Embed Size (px)
Citation preview
TEXTURE, RESIDUAL STRESS AND STRUCTURALANALYSIS OF THIN FILMS USING A COMBINED
X-RAY ANALYSIS
L. Lutterotti
Department of Materials Engineering
University of Trento – Italy
D. Chateigner, CRISMAT-ISMRA, Caen, France
S. Ferrari, MDM-INFM, Agrate (Mi), Italy
J. Ricote, CSIC, Madrid, Spain

Rietveld Texture Analysis (RiTA)• Goals:
– Obtain structure, microstructure, texture and residual stresses of thinfilms and multilayer by one step methodology
– The analysis should not be limited by phase overlapping, strong textureor complex structures
• How? -> Rietveld based analysis or full pattern fitting
– The Rietveld method is a powerful fitting method of the diffractionpattern to refine the crystal structure.
– We select and develop some particular methodologies for the analyses.
– We incorporate in a Rietveld package all these methodologies frommicrostructure to texture, residual stress and reflectivity.
– We build a machine to collect several full XRD spectra at differenttilting position of the sample and reflectivity pattern.
– The final program is Maud, developed inside the ESQUI European project
Texture from Spectra
From pole figures From spectra
Orientation Distribution Function (ODF)
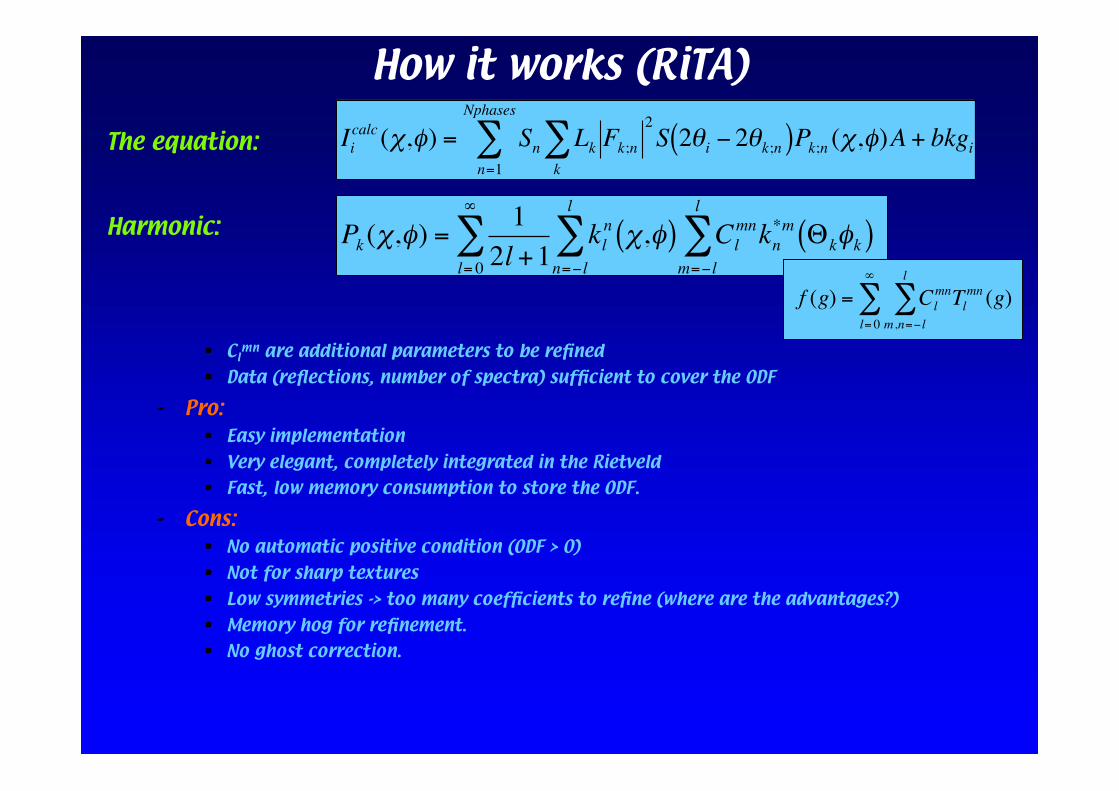
How it works (RiTA)
The equation:
Harmonic:
• Clmn are additional parameters to be refined
• Data (reflections, number of spectra) sufficient to cover the ODF
– Pro:• Easy implementation
• Very elegant, completely integrated in the Rietveld
• Fast, low memory consumption to store the ODF.
– Cons:• No automatic positive condition (ODF > 0)
• Not for sharp textures
• Low symmetries -> too many coefficients to refine (where are the advantages?)
• Memory hog for refinement.
• No ghost correction.
!
Iicalc(",#) = Sn Lk Fk;n
2
S 2$i % 2$k;n( )Pk;n (",#)Ak
&n=1
Nphases
& + bkgi
!
Pk(",#) =
1
2l +1l= 0
$
% kl
n ",#( )n=&l
l
% Cl
mnkn
*m 'k#k( )
m=&l
l
%
!
f (g) = Cl
mnTlmn(g)
m,n="l
l
#l= 0
$
#

How it works (RiTA)• WIMV
– Discrete method. ODF space is divided in regular cells (ex. 5x5x5 degrees) and thefunction value is stored for each cell.
– Numerical integration:
– For each refinement iteration:• Pk extracted (Le Bail method)
• ODF computed (WIMV)
• Pk recalculated
• Fitting of the spectra
– Advantages:• ODF > 0, always
• Ok for sharp textures and low symmetries
– Disadvantages:• Less elegant (require extraction and interpolation to a regular grid)
• Tricky to implement
• Slower in the Rietveld (high symmetries)
!
Pk (",#) = f (g,$)d$$
%
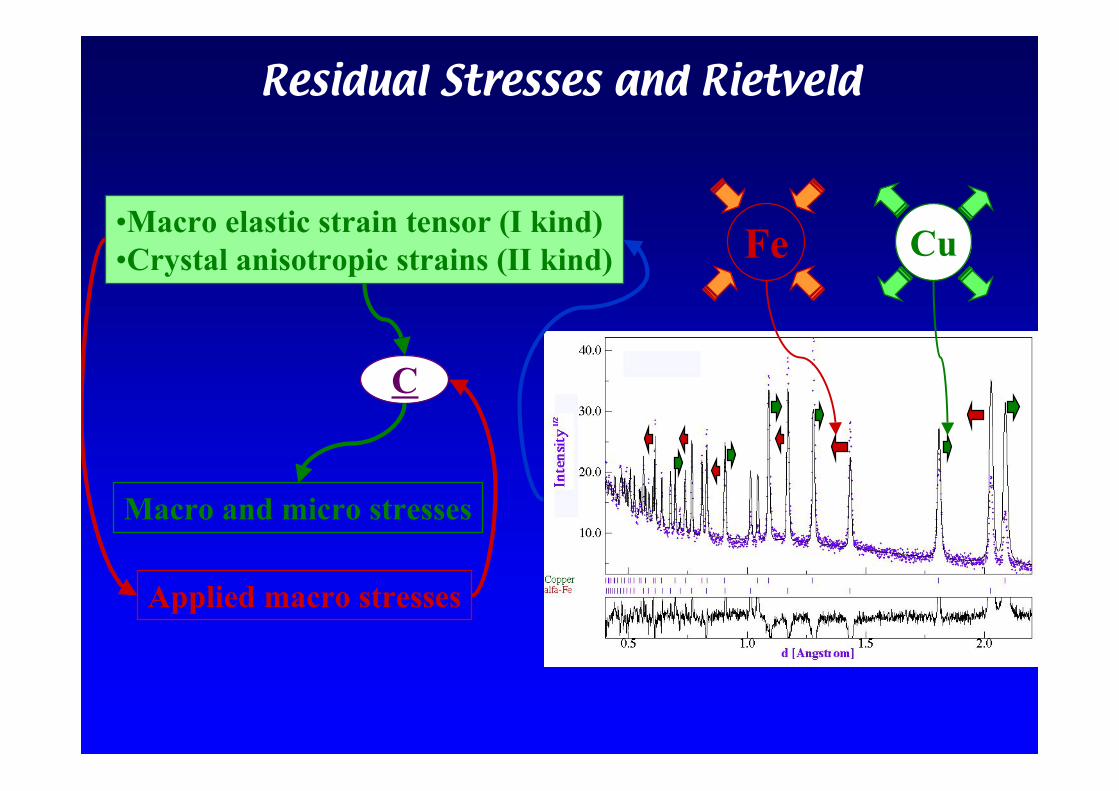
Residual Stresses and Rietveld
Fe Cu•Macro elastic strain tensor (I kind)
•Crystal anisotropic strains (II kind)
Macro and micro stresses
C
Applied macro stresses
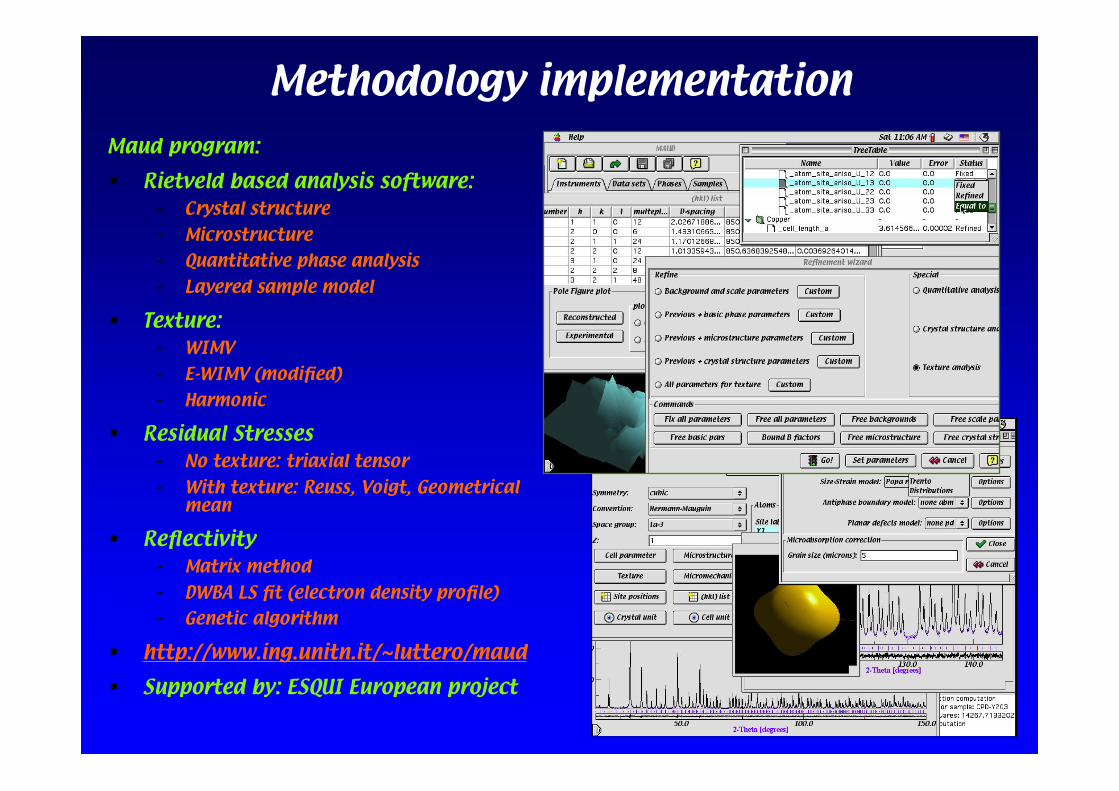
Methodology implementationMaud program:
• Rietveld based analysis software:– Crystal structure
– Microstructure
– Quantitative phase analysis
– Layered sample model
• Texture:– WIMV
– E-WIMV (modified)
– Harmonic
• Residual Stresses– No texture: triaxial tensor
– With texture: Reuss, Voigt, Geometricalmean
• Reflectivity– Matrix method
– DWBA LS fit (electron density profile)
– Genetic algorithm
• http://www.ing.unitn.it/~luttero/maud
• Supported by: ESQUI European project
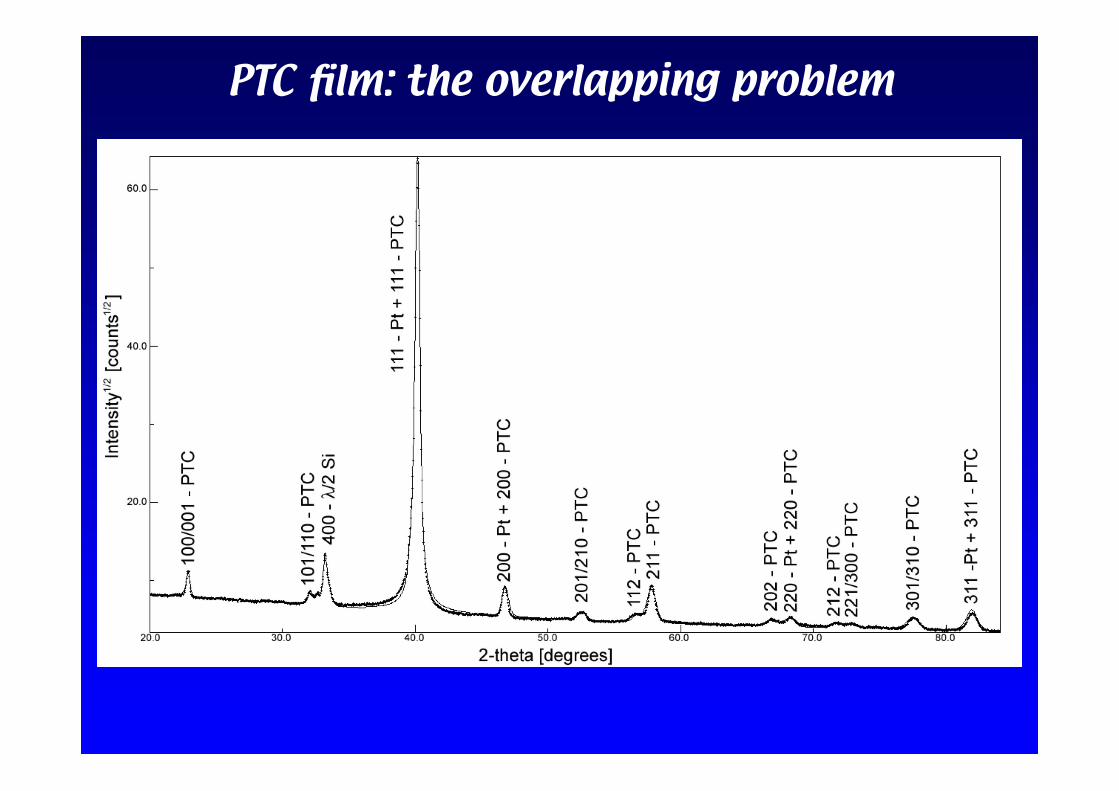
PTC film: the overlapping problem

PTC film: the measurement• Substrate: TiO2/SiO2/Si(100)
• 400 nm of Pb0.76Ca0.24TiO3 (PTC) film deposited by spin coating of a sol-gel solution(CSIC Madrid).
• 50 nm of Pt buffer layer.
• Instrument: 120 degs curved position sensitive detector on a closed eulerian cradle,graphite primary monochromator (LPEC – Le Mans, France)
• Collected full spectra on a 5x5 degs grid in chi and phi. From 0 to 355 in phi and up to50 deg in chi.
The LPEC, Le Mans instrument
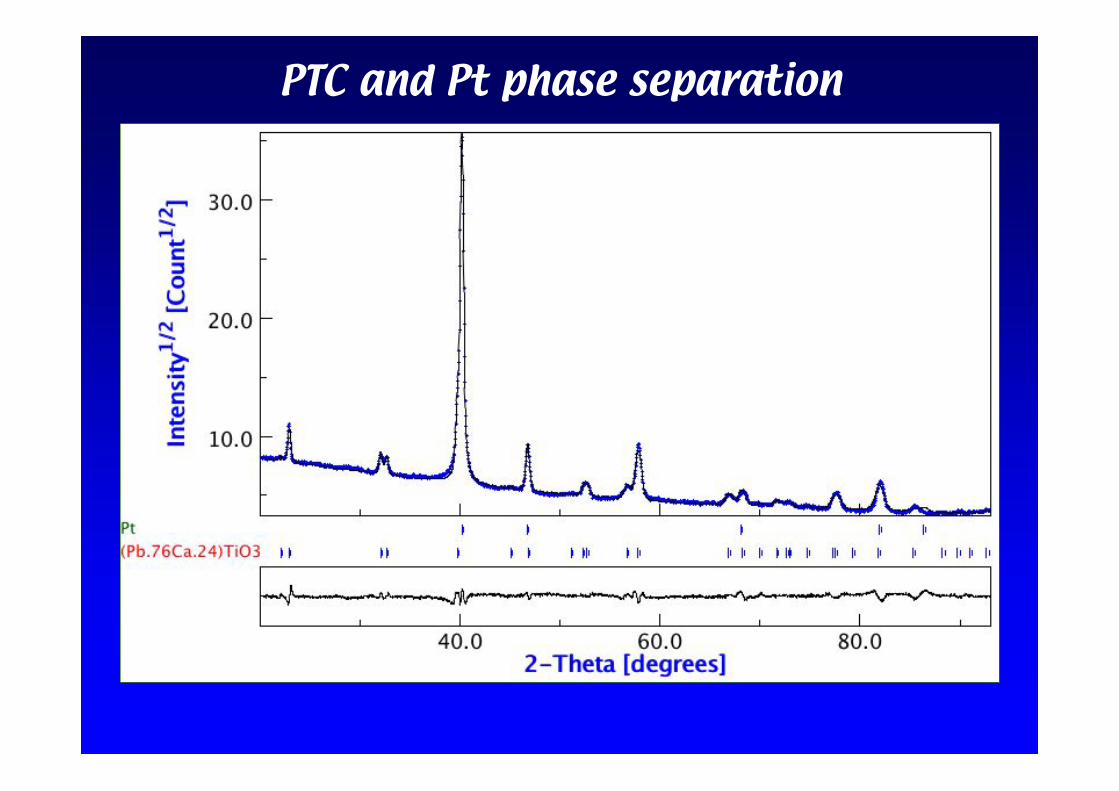
PTC and Pt phase separation
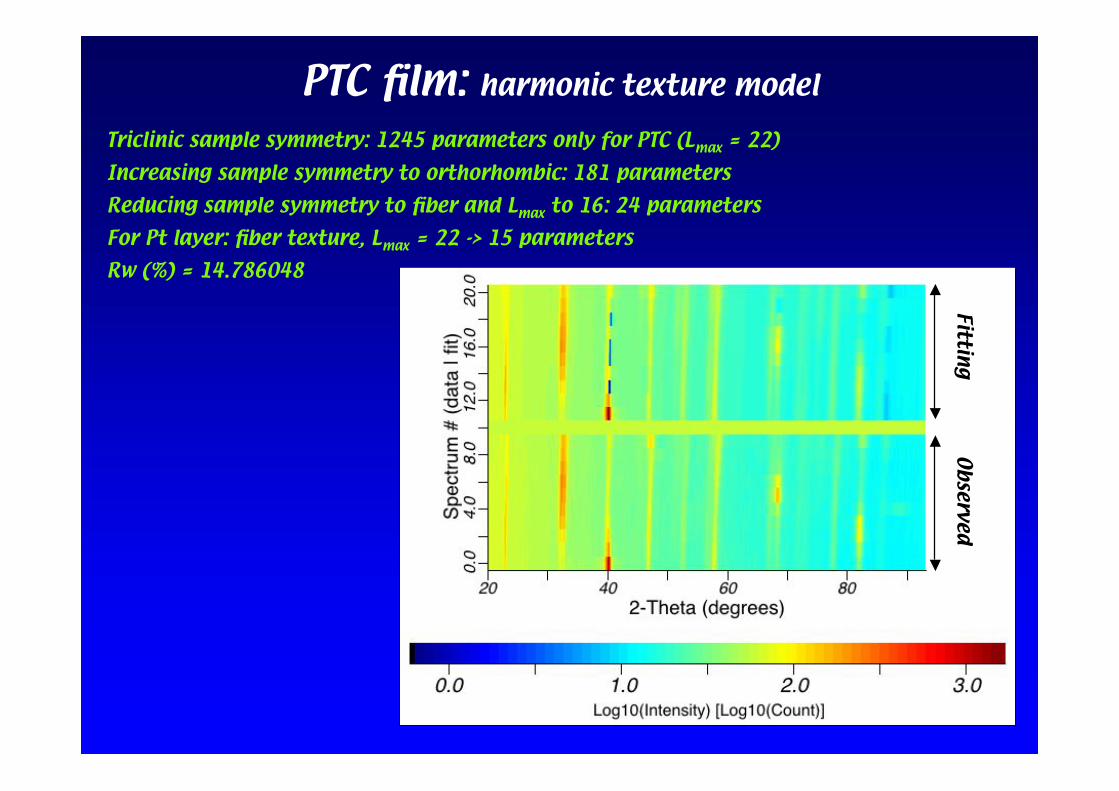
PTC film: harmonic texture model
Triclinic sample symmetry: 1245 parameters only for PTC (Lmax = 22)
Increasing sample symmetry to orthorhombic: 181 parameters
Reducing sample symmetry to fiber and Lmax to 16: 24 parameters
For Pt layer: fiber texture, Lmax = 22 -> 15 parameters
Rw (%) = 14.786048
Ob
servedFittin
g
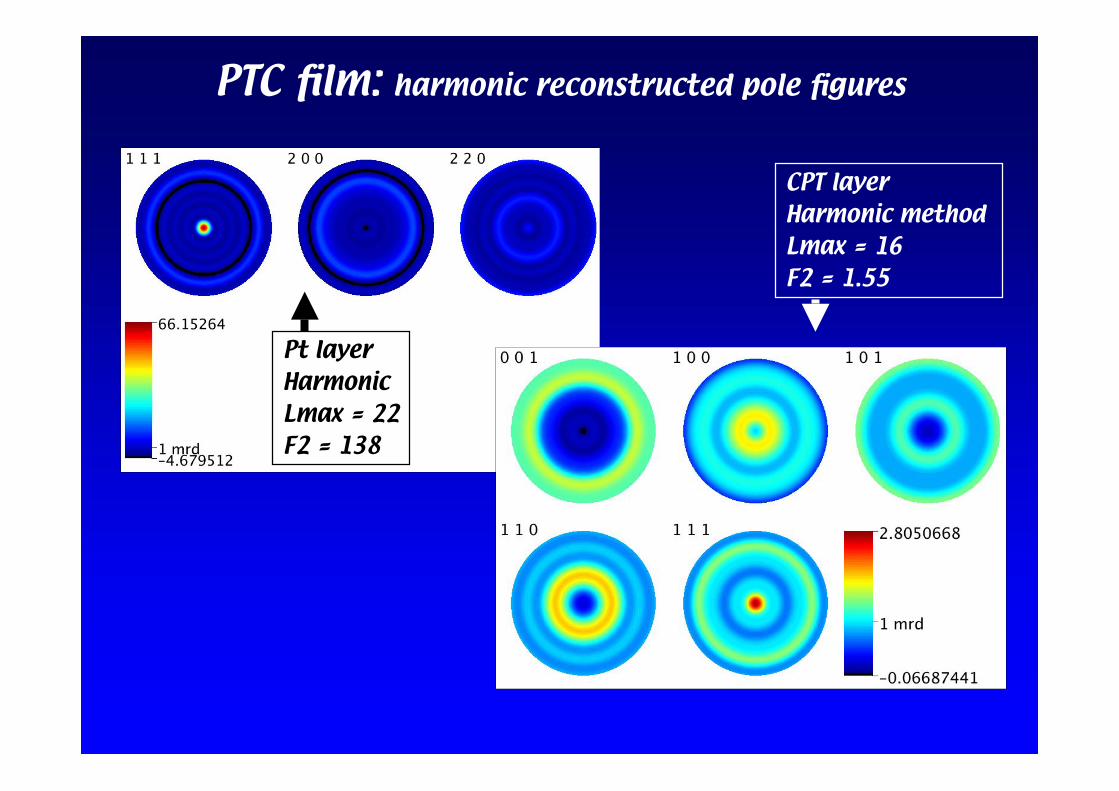
PTC film: harmonic reconstructed pole figures
CPT layerHarmonic method Lmax = 16F2 = 1.55
Pt layerHarmonic Lmax = 22F2 = 138
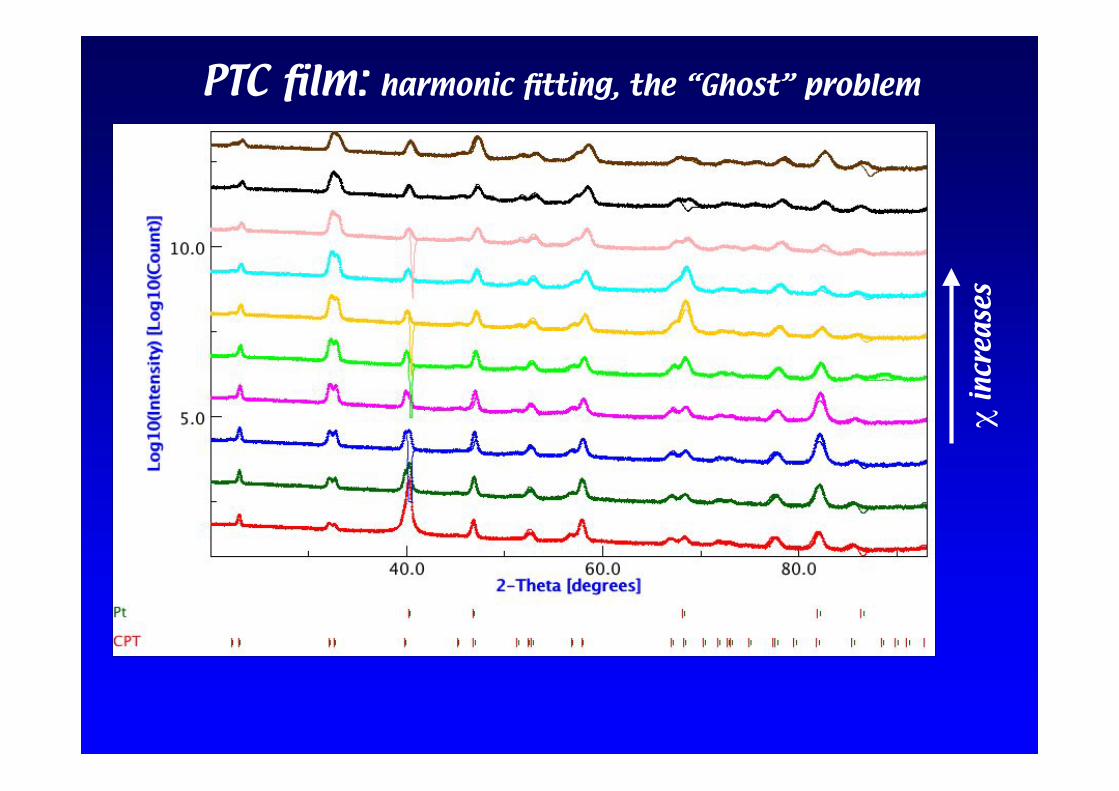
PTC film: harmonic fitting, the “Ghost” problem
! i
ncr
ease
s
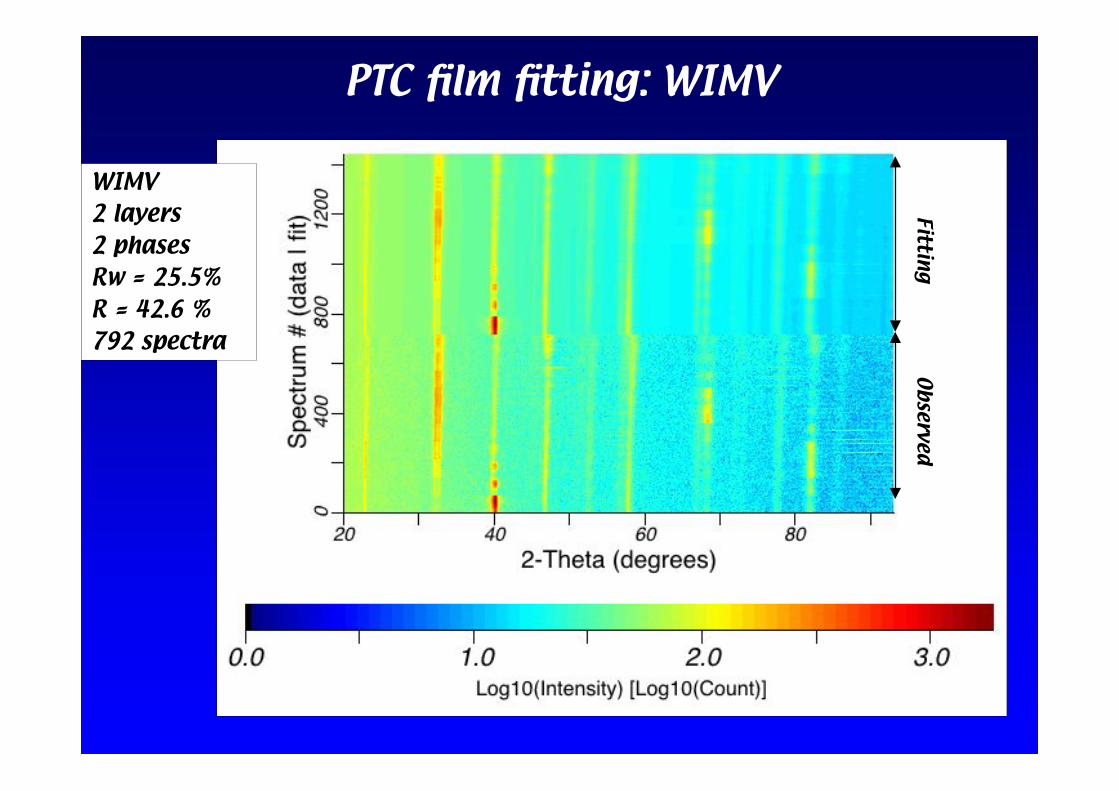
PTC film fitting: WIMV
WIMV2 layers2 phasesRw = 25.5%R = 42.6 %792 spectra
Ob
servedFittin
g
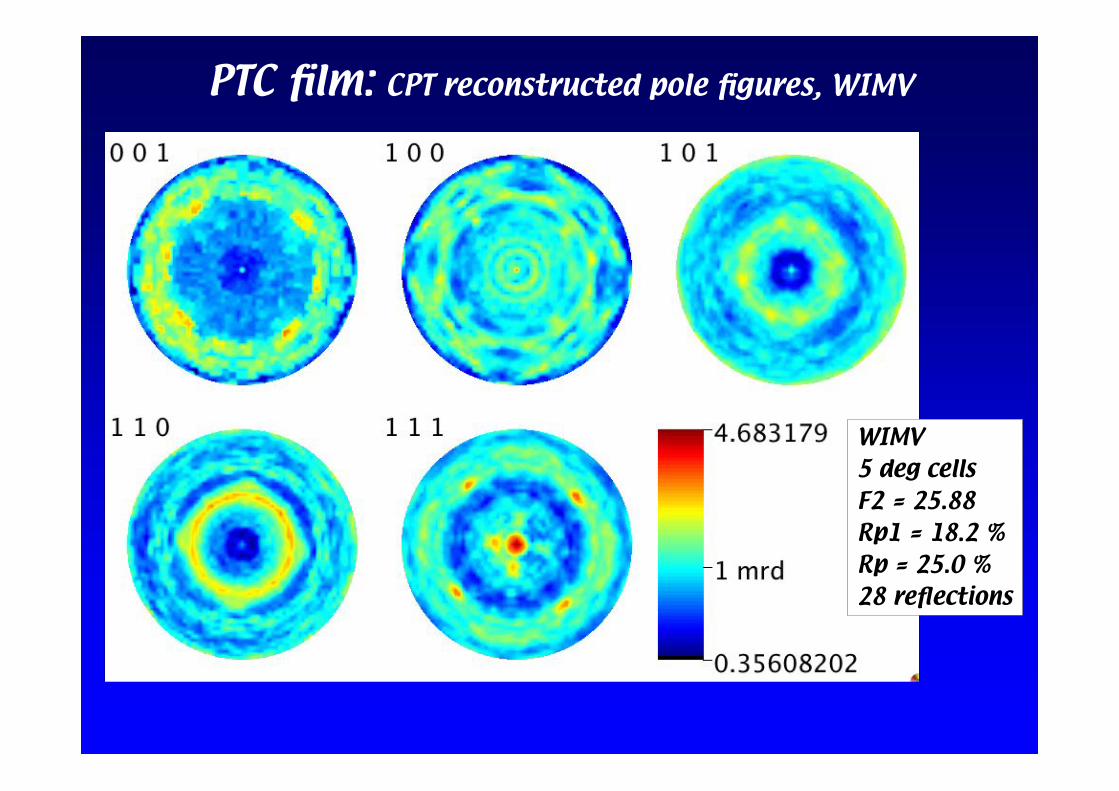
PTC film: CPT reconstructed pole figures, WIMV
WIMV5 deg cellsF2 = 25.88Rp1 = 18.2 %Rp = 25.0 %28 reflections
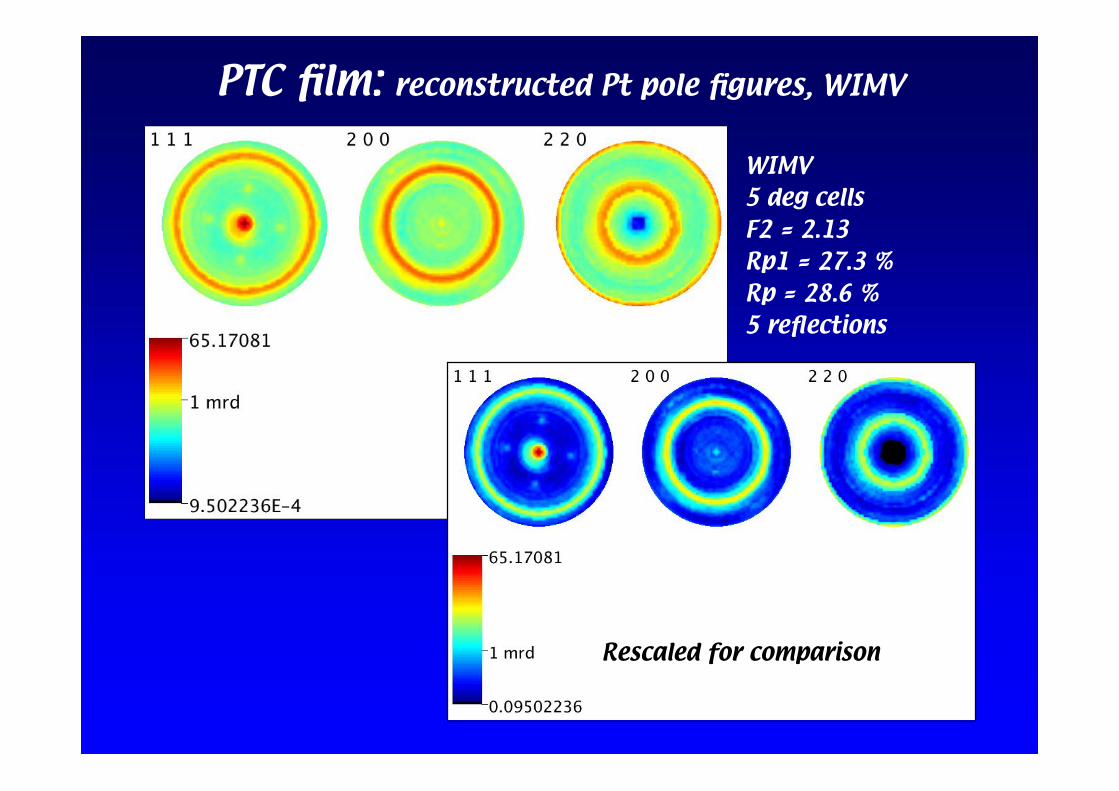
PTC film: reconstructed Pt pole figures, WIMV
WIMV 5 deg cellsF2 = 2.13Rp1 = 27.3 %Rp = 28.6 %5 reflections
Rescaled for comparison
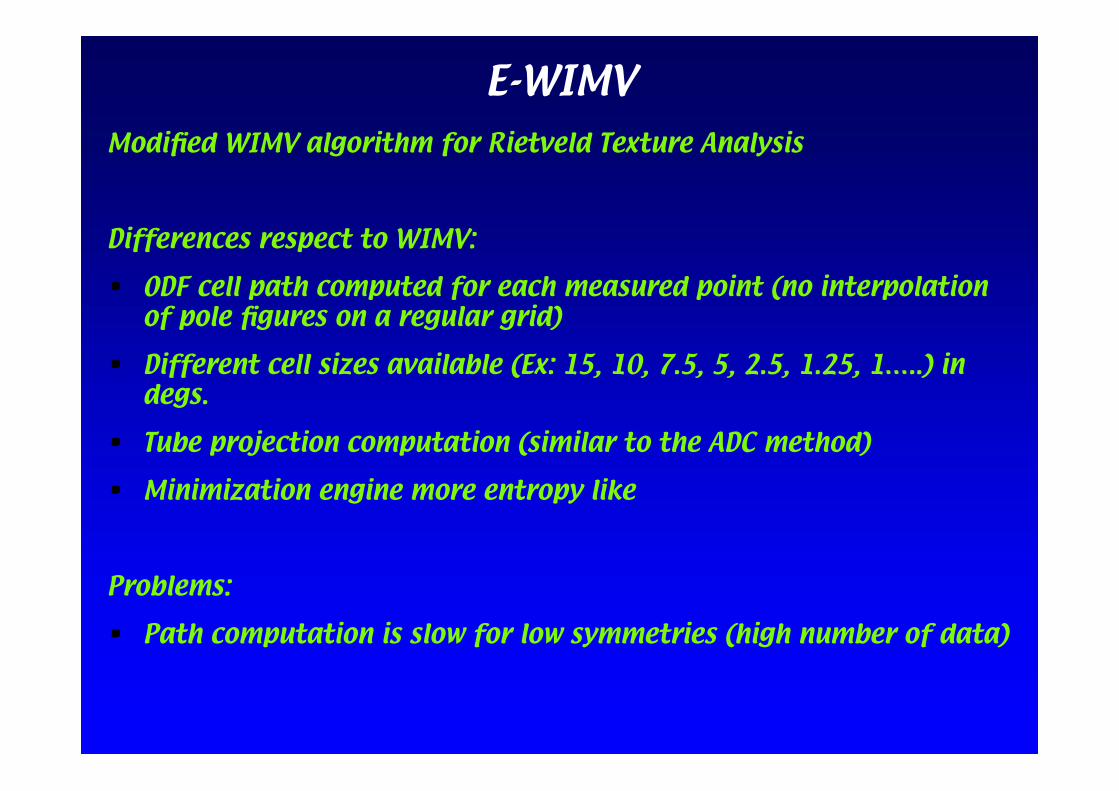
E-WIMVModified WIMV algorithm for Rietveld Texture Analysis
Differences respect to WIMV:
• ODF cell path computed for each measured point (no interpolationof pole figures on a regular grid)
• Different cell sizes available (Ex: 15, 10, 7.5, 5, 2.5, 1.25, 1…..) indegs.
• Tube projection computation (similar to the ADC method)
• Minimization engine more entropy like
Problems:
• Path computation is slow for low symmetries (high number of data)
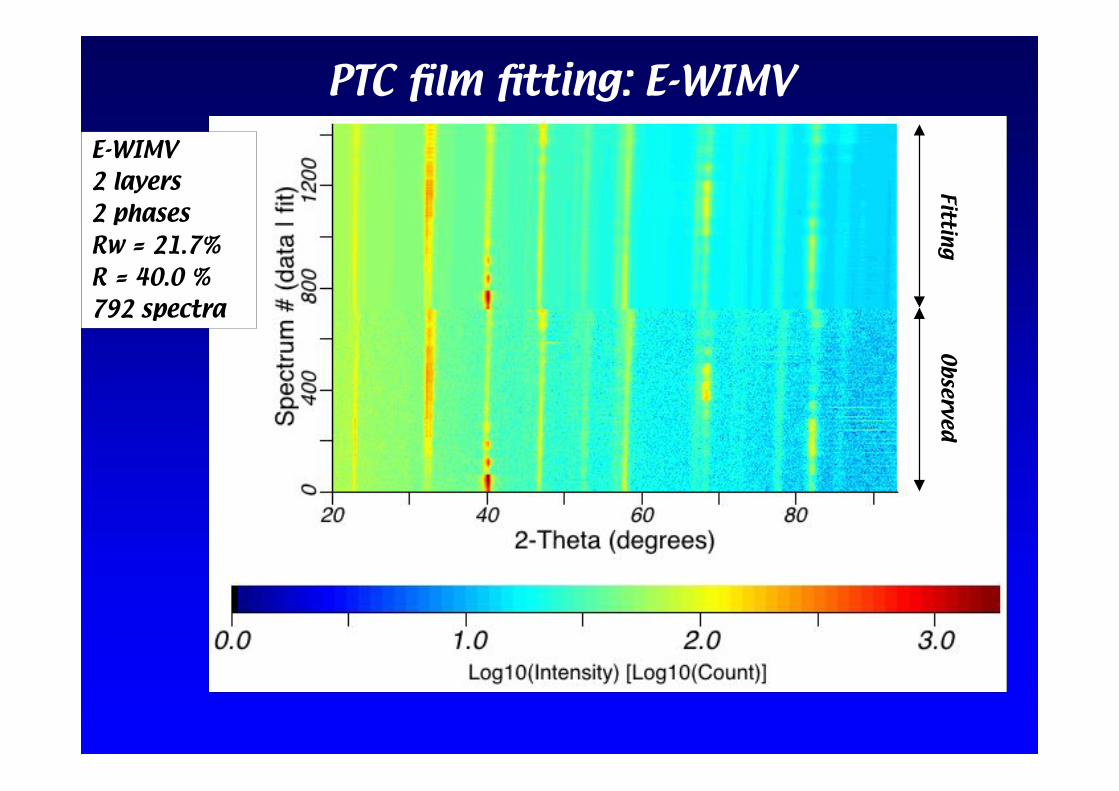
PTC film fitting: E-WIMV
E-WIMV2 layers2 phasesRw = 21.7%R = 40.0 %792 spectra
Ob
servedFittin
g
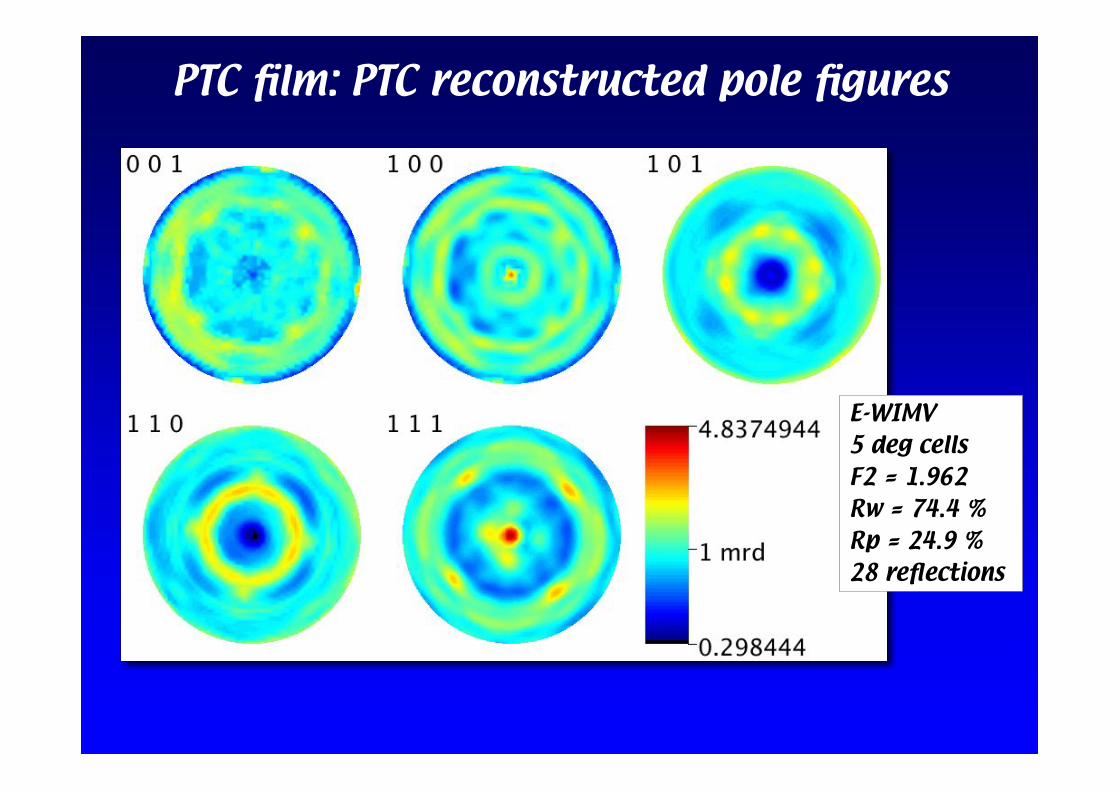
PTC film: PTC reconstructed pole figures
E-WIMV5 deg cellsF2 = 1.962Rw = 74.4 %Rp = 24.9 %28 reflections
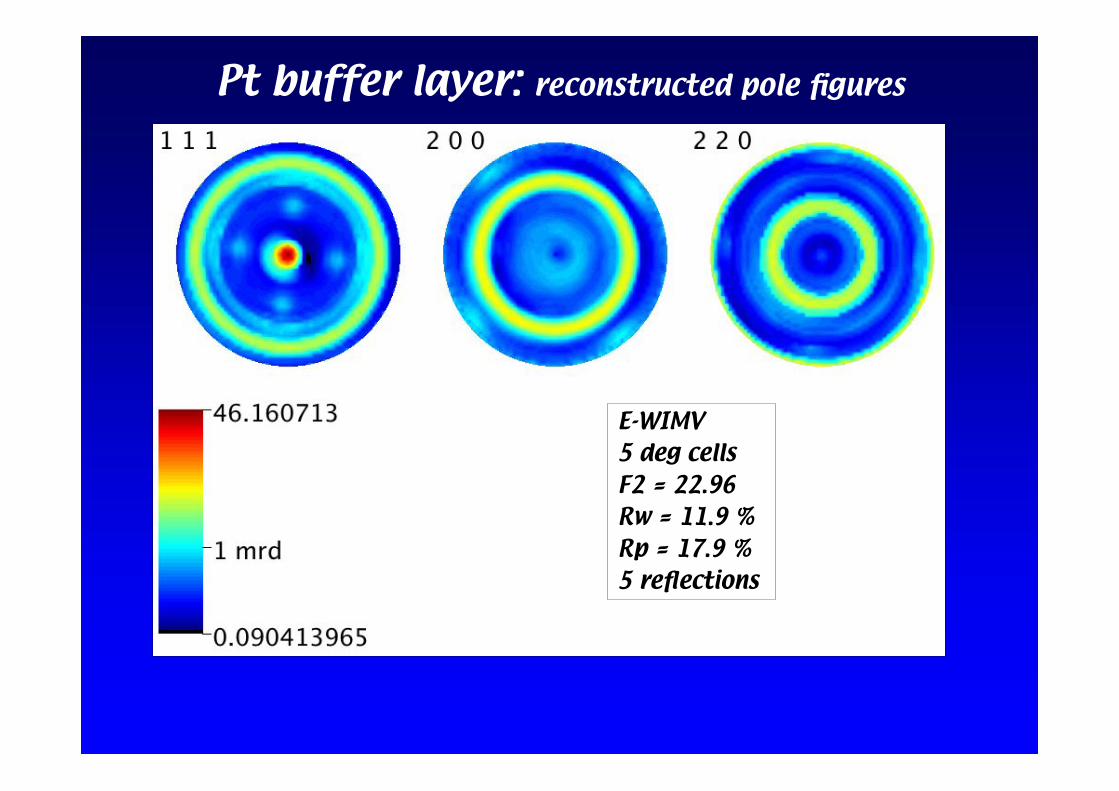
Pt buffer layer: reconstructed pole figures
E-WIMV5 deg cellsF2 = 22.96Rw = 11.9 %Rp = 17.9 %5 reflections
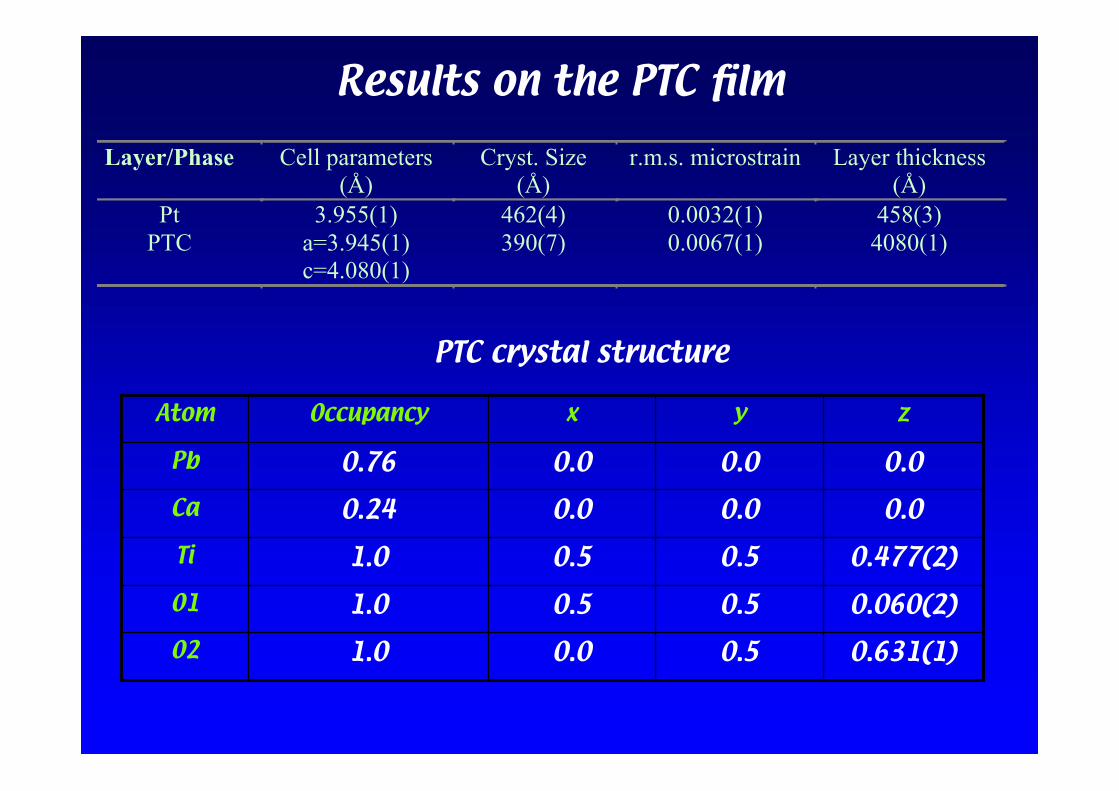
Results on the PTC film
Layer/Phase Cell parameters(Å)
Cryst. Size(Å)
r.m.s. microstrain Layer thickness(Å)
Pt 3.955(1) 462(4) 0.0032(1) 458(3)PTC a=3.945(1)
c=4.080(1)390(7) 0.0067(1) 4080(1)
0.631(1)0.50.01.0O2
0.060(2)0.50.51.0O1
0.477(2)0.50.51.0Ti
0.00.00.00.24Ca
0.00.00.00.76Pb
zyxOccupancyAtom
PTC crystal structure
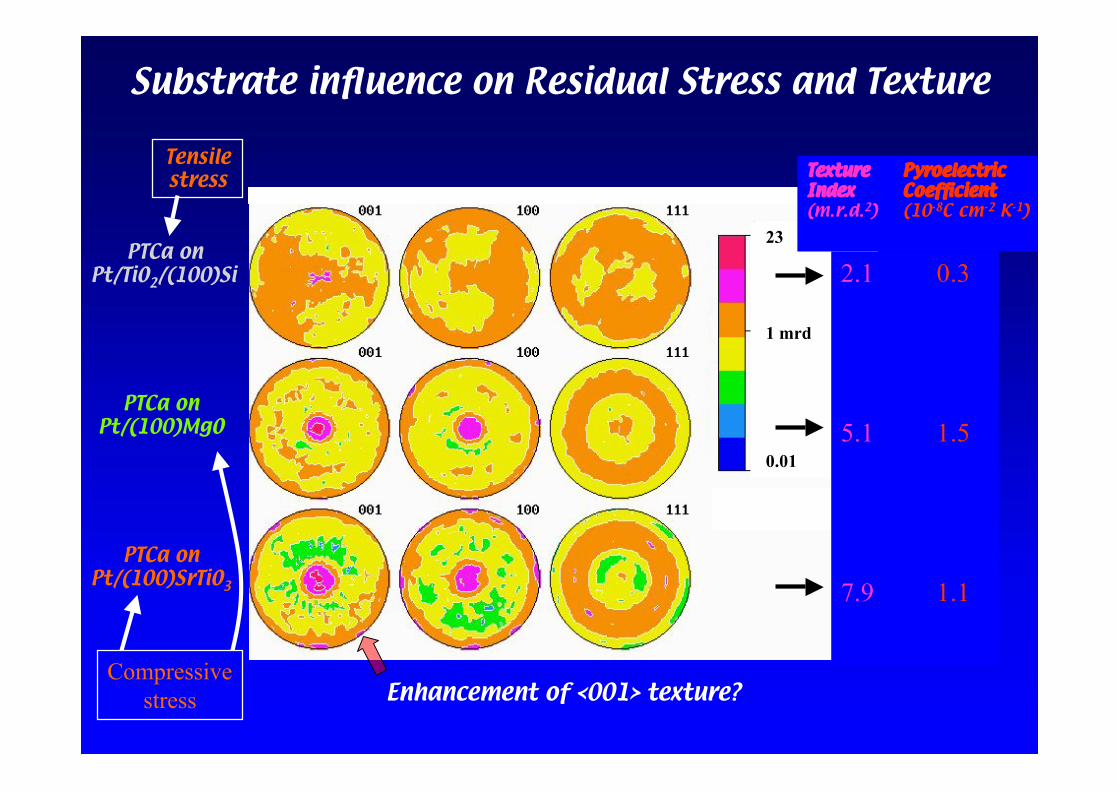
Substrate influence on Residual Stress and Texture
23
0.01
1 mrd
PTCa onPt/(100)SrTiO3
PTCa onPt/(100)MgO
PTCa onPt/TiO2/(100)Si
Texture PyroelectricIndex Coefficient(m.r.d.2) (10-8C cm-2 K-1)
2.1 0.3
5.1 1.5
7.9 1.1
Tensilestress
Compressive
stress Enhancement of <001> texture?
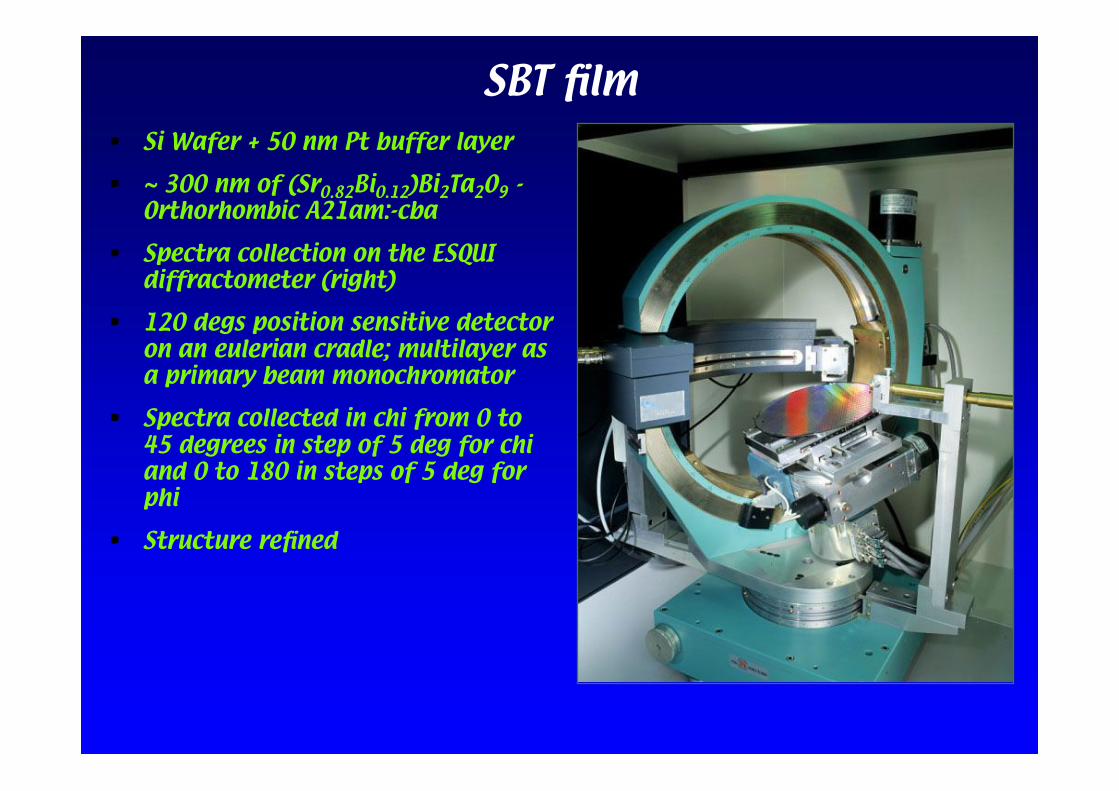
SBT film• Si Wafer + 50 nm Pt buffer layer
• ~ 300 nm of (Sr0.82Bi0.12)Bi2Ta2O9 -Orthorhombic A21am:-cba
• Spectra collection on the ESQUIdiffractometer (right)
• 120 degs position sensitive detectoron an eulerian cradle; multilayer asa primary beam monochromator
• Spectra collected in chi from 0 to45 degrees in step of 5 deg for chiand 0 to 180 in steps of 5 deg forphi
• Structure refined
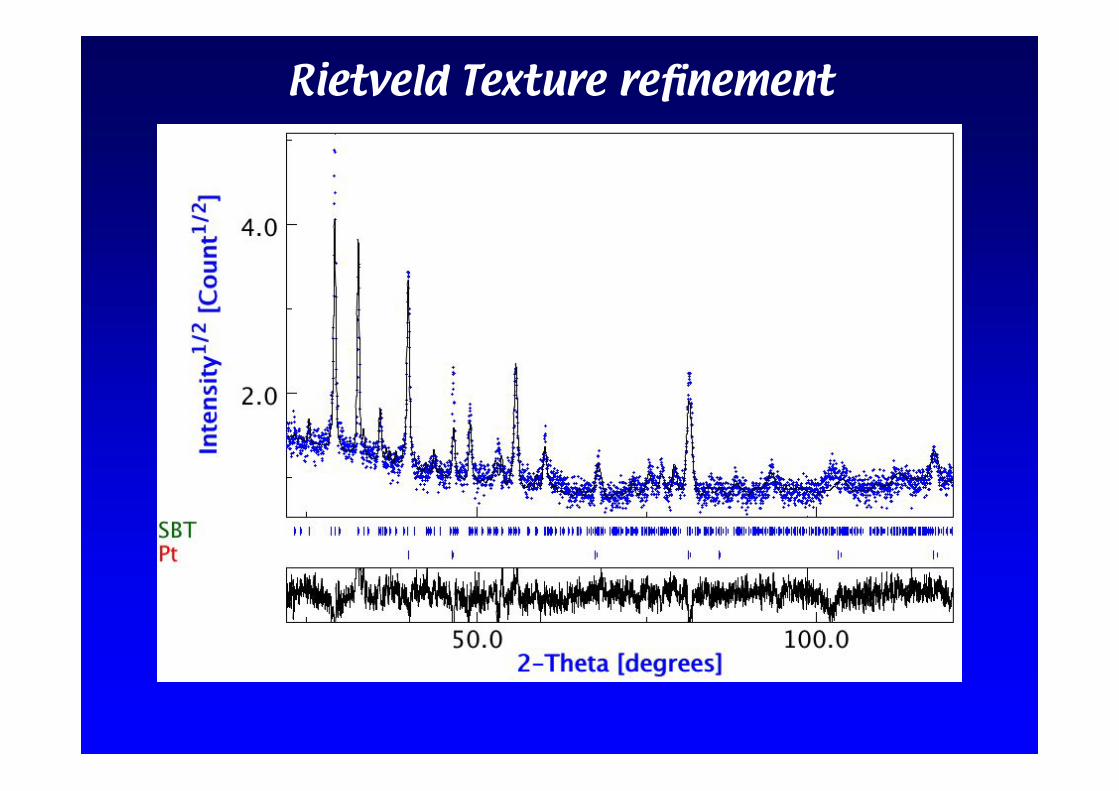
Rietveld Texture refinement
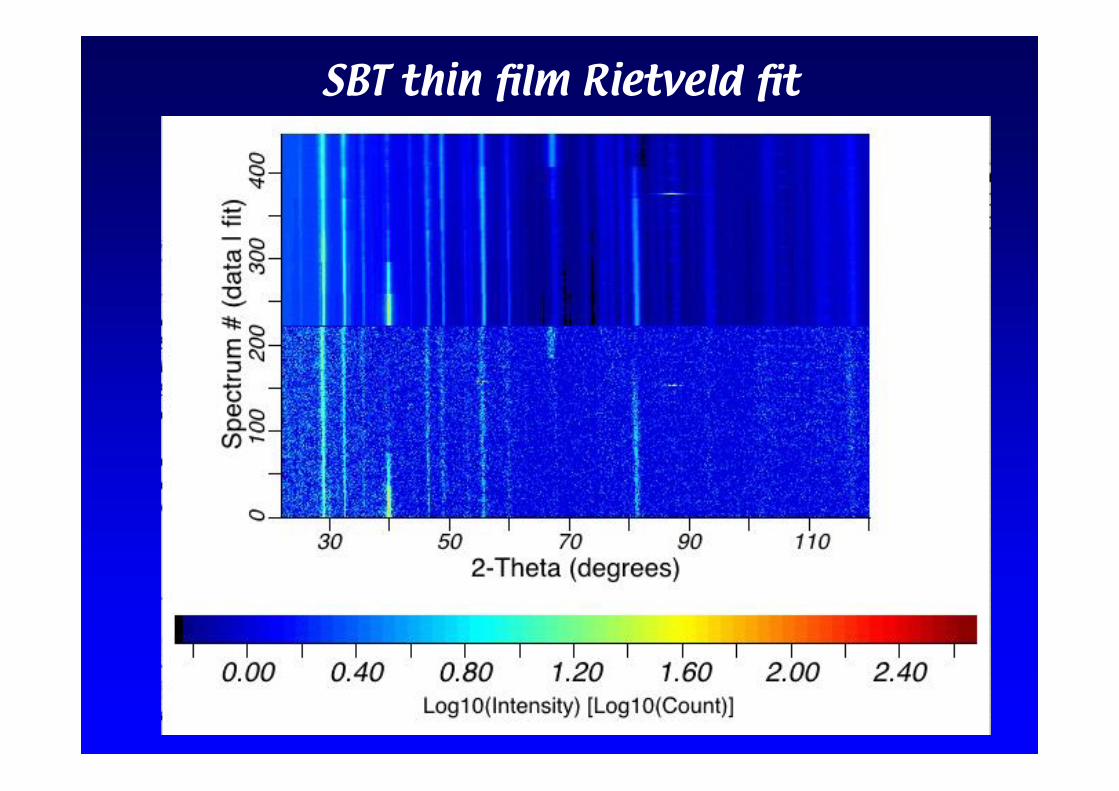
SBT thin film Rietveld fit
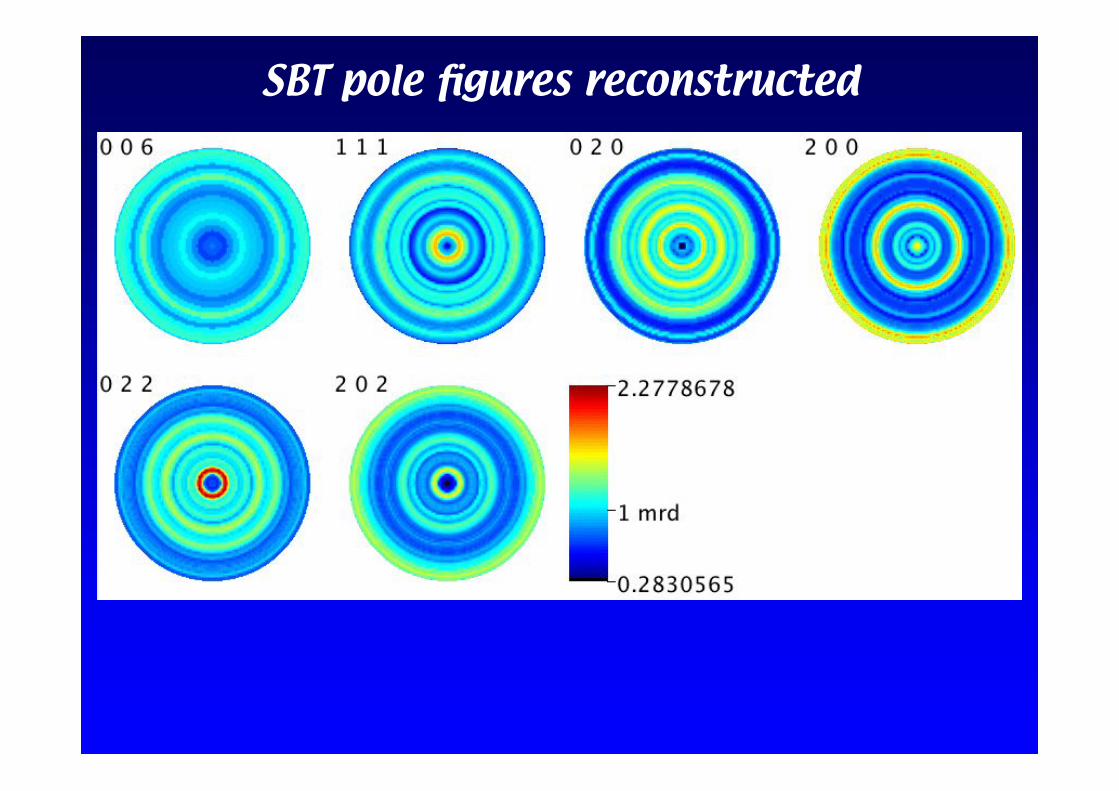
SBT pole figures reconstructed
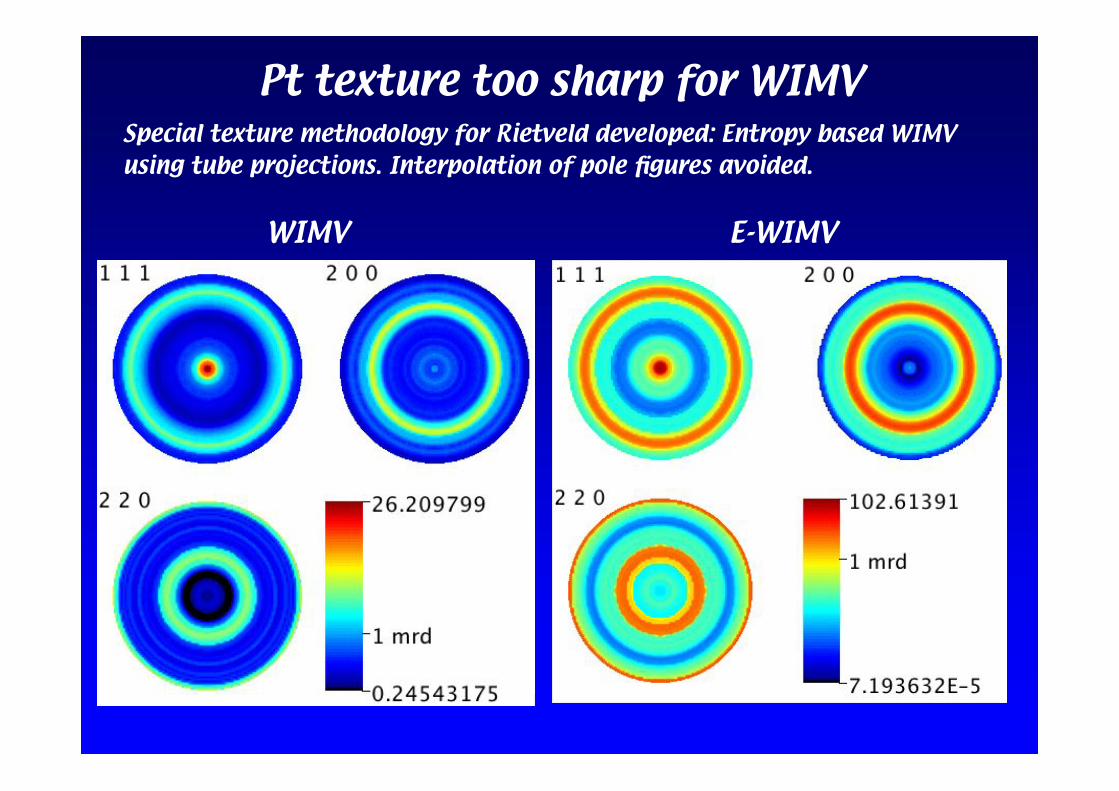
Pt texture too sharp for WIMV
WIMV E-WIMV
Special texture methodology for Rietveld developed: Entropy based WIMVusing tube projections. Interpolation of pole figures avoided.
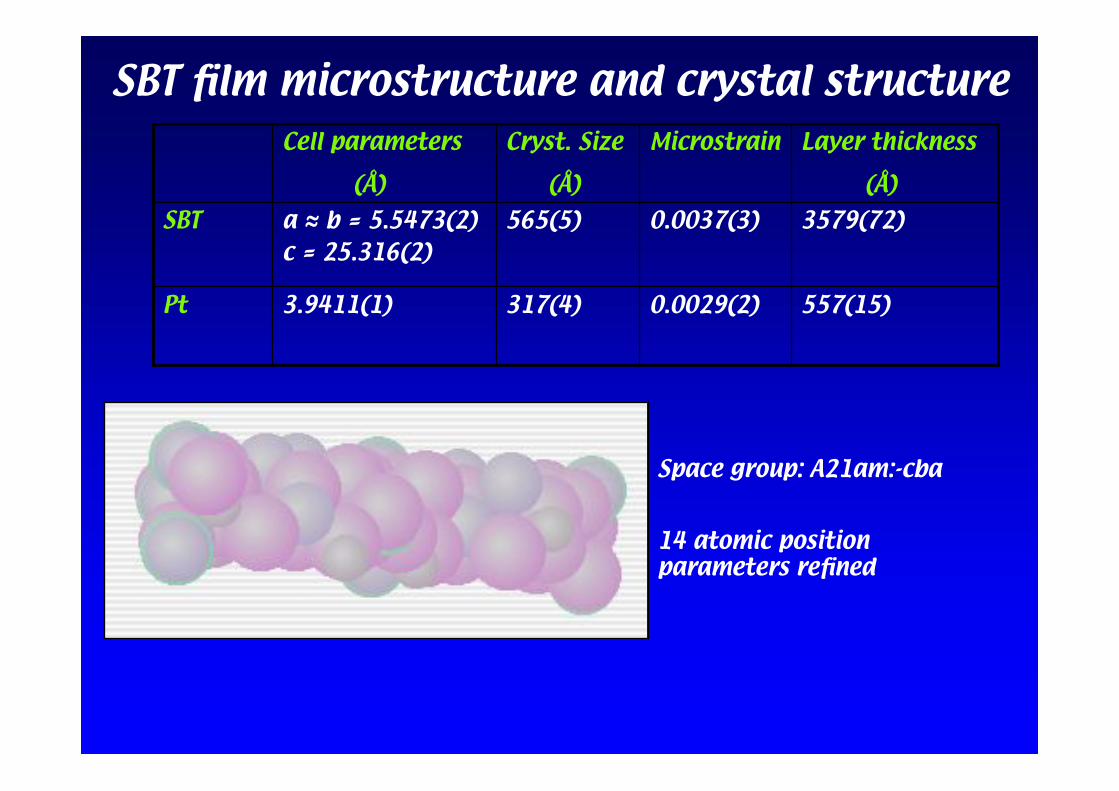
SBT film microstructure and crystal structure
14 atomic positionparameters refined
Space group: A21am:-cba
557(15)0.0029(2)317(4)3.9411(1)Pt
3579(72)0.0037(3)565(5)a ! b = 5.5473(2)c = 25.316(2)
SBT
Layer thickness
(Å)
MicrostrainCryst. Size
(Å)
Cell parameters
(Å)
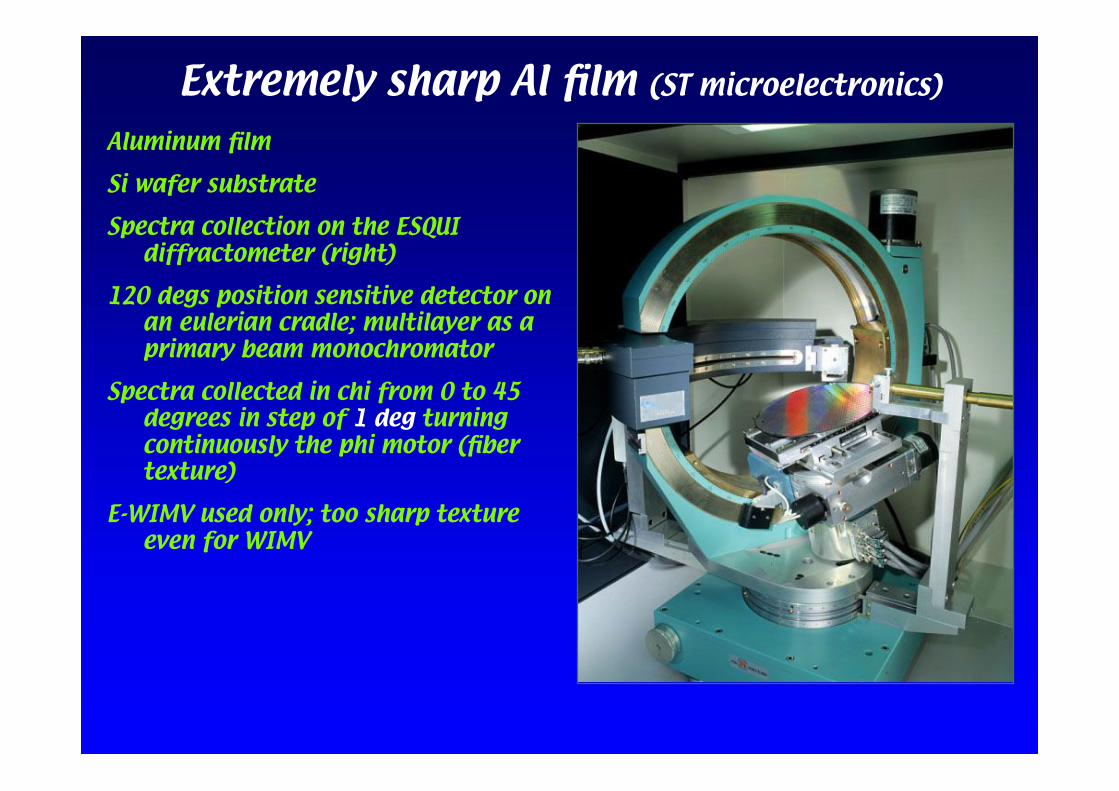
Extremely sharp Al film (ST microelectronics)
Aluminum film
Si wafer substrate
Spectra collection on the ESQUIdiffractometer (right)
120 degs position sensitive detector onan eulerian cradle; multilayer as aprimary beam monochromator
Spectra collected in chi from 0 to 45degrees in step of 1 deg turningcontinuously the phi motor (fibertexture)
E-WIMV used only; too sharp textureeven for WIMV
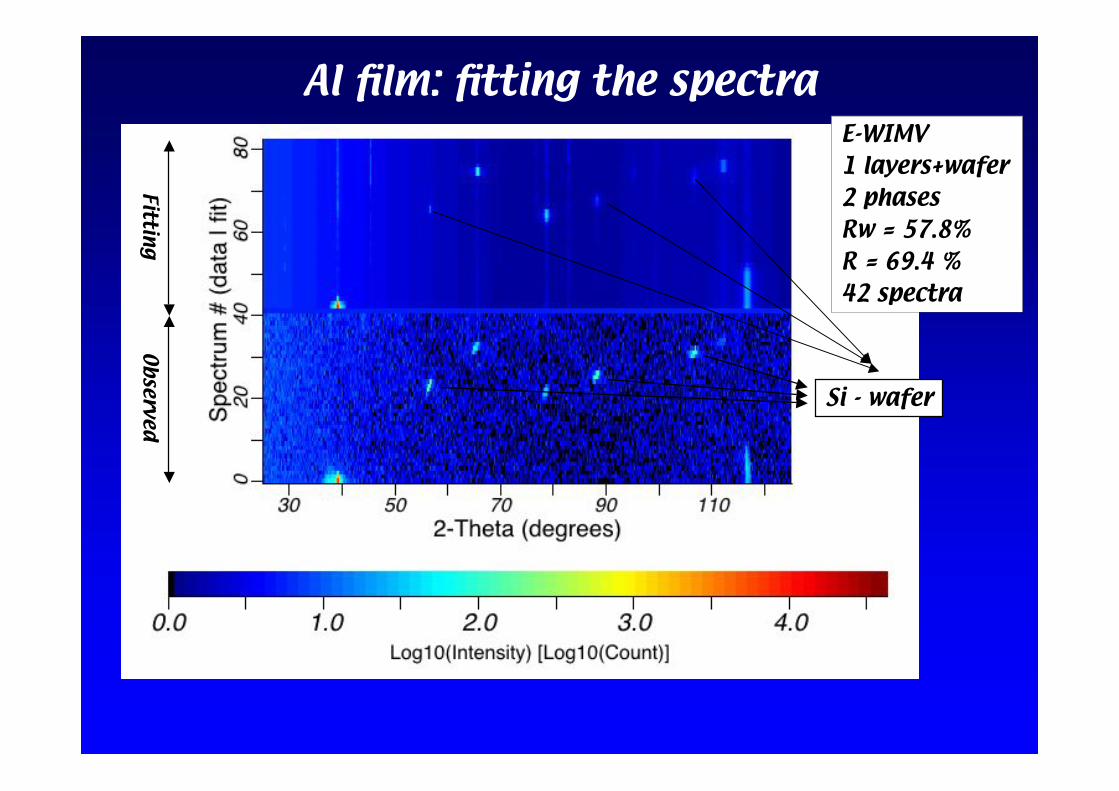
Al film: fitting the spectraE-WIMV1 layers+wafer2 phasesRw = 57.8%R = 69.4 %42 spectra
Si - wafer
Ob
servedFittin
g

Al film: Al reconstructed pole figures
E-WIMV 1 deg cellsF2 = 1100.9Rw = 15.4 %Rp = 19.5 %8 reflections
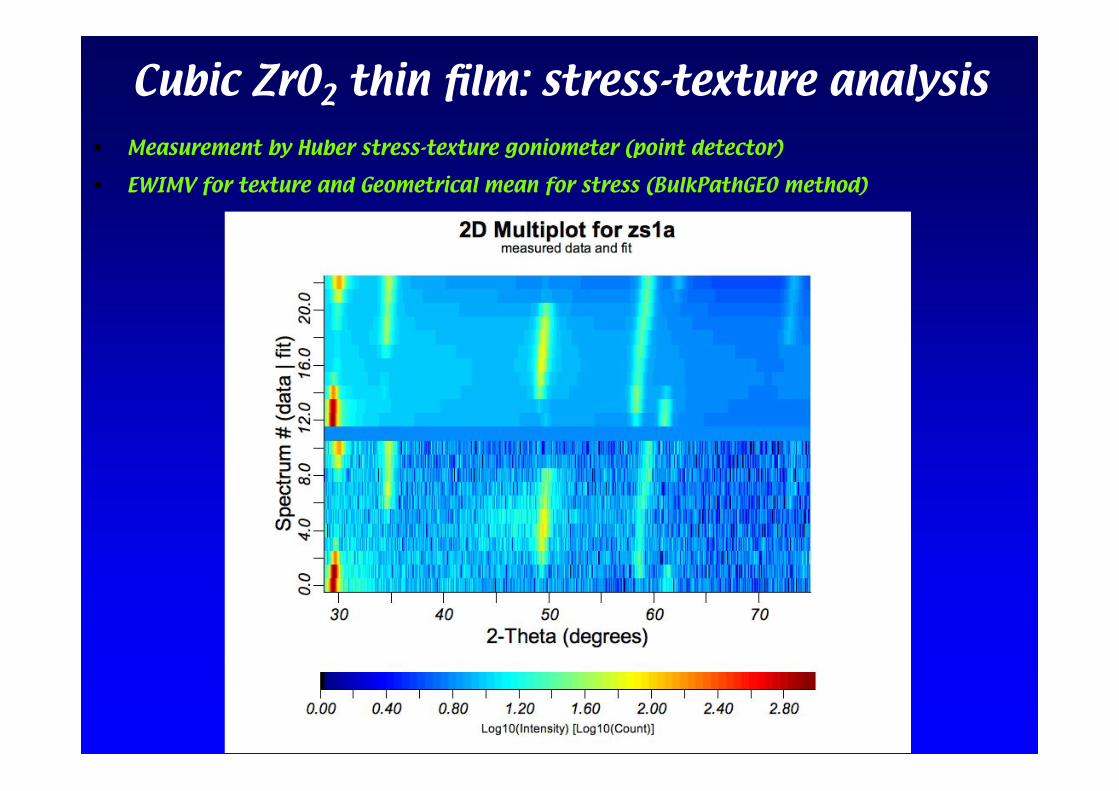
Cubic ZrO2 thin film: stress-texture analysis
• Measurement by Huber stress-texture goniometer (point detector)
• EWIMV for texture and Geometrical mean for stress (BulkPathGEO method)
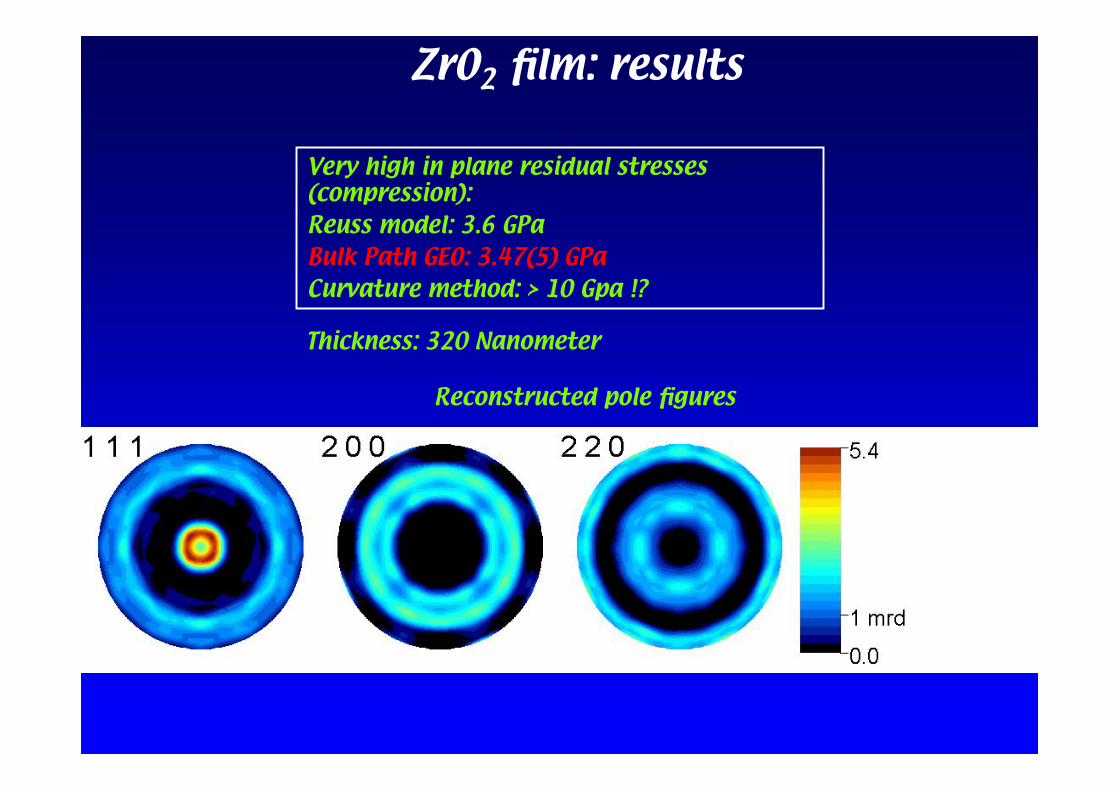
ZrO2 film: results
Very high in plane residual stresses(compression):Reuss model: 3.6 GPaBulk Path GEO: 3.47(5) GPaCurvature method: > 10 Gpa !?
Reconstructed pole figures
Thickness: 320 Nanometer
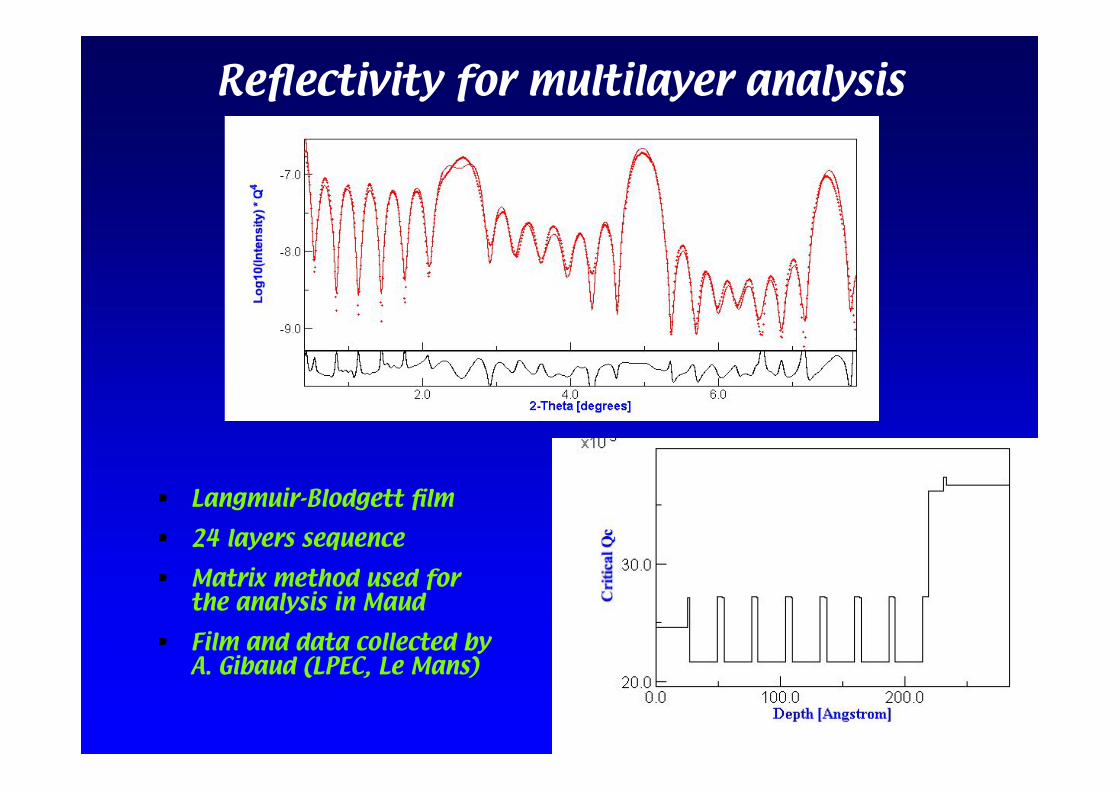
Reflectivity for multilayer analysis
• Langmuir-Blodgett film
• 24 layers sequence
• Matrix method used forthe analysis in Maud
• Film and data collected byA. Gibaud (LPEC, Le Mans)
Conclusions
• Combined analysis (Rietveld, microstructure, texture, residualstresses and reflectivity) is very powerful for thin film
• Extremely sharp textures requires the new E-WIMV method
• Bulk Path GEO confirms to be powerful for macro residual stresses
• We need to decrease the measurement time
• Severe overlapping is no more a problem
The ESQUI European Project site:
http://www.ing.unitn.it/~maud/esqui
Future work (in progress)• Driving the experiment (ODF coverage etc.). Using Genetic
Algorithms?
• Sharp textures -> continuous coverage -> 2D detectors -> 2D fitting?
• Ab initio structure solution. Problems:
– Textured sample preparation
– Data collection (fast, reliable, high resolution)
• Reflectivity: off specular computation (reciprocal map fitting)