Embed Size (px)
Citation preview
Indian Journal of Geo Marine Sciences
Vol.46 (08), August 2017, pp. 1562-1574
Textural characteristics of beach sediments along Kalpakkam, south east
coast of India
S.N. Bramha, A.K. Mohanty, M.K. Samantara, S.N. Panigrahi & K.K. Satpathy*
Environment and Safety Division, Indira Gandhi Centre for Atomic Research, Kalpakkam- 603102, India
*[Email: [email protected]]
Received 13 March 2015 ; revised 22 November 2016
Samples collected from foreshore region showed more variations in grain size as compared to mid-shore region samples.
Median values varied from -0.08ø to 2.19 ø with an average of 1.04 ø (Std ± 0.65 ø). Mean value showed that samples
were fine to coarse sand, whereas, only 1.8% of total samples were found as very coarse sand. During southwest
monsoon the average mean size of the beach sediment was 0.98 ø, which is coarse sand in contrast to the medium sand
observed during other seasons. Present study showed that, 81.7% of the samples were unimodal and 17.8% samples
were bimodal. Sediment samples were very well sorted (0.18 ø) to poorly sorted (1.18 ø) and sorting characteristics
decreased with increased wave energy. Skewness value indicated that 41% & 11% of the samples were positively
skewed and negative skewed respectively, whereas, rest of the samples were symmetrical. All the beaches were
dominated by mesokurtic sediment. Dominance of positively skewed sediment in the study area indicated the
prevalence of low wave activity and longshore current. Presence of relatively high fraction of mesokurtic sediment
indicated that the beaches along Kalpakkam by and large have uniform energy environment.
[Keywords: Beach sediment, Textural characteristics, Sorting, Skewness, Kurtosis, Kalpakkam coast]
Introduction
Size distribution of coarse elastic sediments
reflects the fluidity (velocity) factor of the
deposition and the energy factor of the environment
(site) of deposition1. Granulometric studies of
sediments provide a wealth of information on the
intrinsic properties of sediment and their
depositional environment2-5
. The characteristic of
the grain size distribution are related to source
material, process of weathering, abrasion, corrosion
and sorting process during the transportation and
deposition6. Statistical analysis of beach sediment
is relevant to identify the sedimentary environment.
Mean size, sorting and skewness are the most useful
parameters to describe the sediment characteristics2,
7, 8. The composition of littoral sediment and their
textural characteristics depend on wave, wind,
longshore current and source9. Grain size statistics
are used to distinguish between high and moderate
energy environment10
. Change in any coastal
process between the past and the present is reflected
on the sediment characteristics. In this regard, the
beach sedimentology plays a vital role in
documenting the depositional history of the
region11
. Sedimentologists are particularly
concerned about three aspects of grain size
distribution in sediment i.e. a) techniques for
measuring grain size and expressing it in terms of a
grade scale, b) methods for quantifying grain size
data and representing them in a graphical or
statistical form and c) the genetic significance of
these data11
. Considerable amount of information
on beacg sediment characteristics of east coast of
India area available1, 2, 8, 9, 12, 13, 14, 15,
however,
information on this study area with the crucial
nuclear establishment is scare. Considering the fact
that , Kalpakkam region is a hub of nuclear
establishments such as Madras Atomic Power
Station (MAPS), Bharatiya Nabhikiya Vidyut
Nigam Limited (BHAVINI), Fast Breeder Test
Reactor (FBTR), Kalpakkam Mini Reactor
(KAMINI) and Fast Reactor Fuel Cycle Facility
(FRFCF) etc., a study was designed to figure out the
variations in textural characteristics of the beaches

INDIAN J. MAR. SCI., VOL. 46, NO. 08, AUGUST 2017
from Kalpakkam to Mahabalipuram, a stretch of
20km. Intertidal sediment samples were collected
for one year and were analysed with an objective to
identify the seasonal as well as longshore textural
behavior of the beach sediments, which ultimately
decides the stability/dynamism of the beach.
Materials and Methods
The study area is about 20km long,
stretches between Mahabalipuram and Kaplakkam
township (latitude 12031’-12
034’N and longitude
80009’- 80
011’E) (Figure 1). Beaches in this region
are relatively flat and the foreshore is primarily
composed of coarse sand. The coastal plain is
characterized with a vegetation line – casuarinas,
cashew nut, bushes, scrubs, grasses, etc.
Geomorphic features such as dune sand, beach
ridges, palaeo– lagoons, and palaeo tidal flats are
found along the coastal region16
. These features
mostly formed due to the past and ongoing
emergency of the coast18
. Coastline is in NNE
(North North East) direction, having beach width of
50-100m. Mean tidal range varied from 0.3 – 1.5
m. Coastal current at Kalpakkam has seasonal
character. During South west monsoon (February
to October) the current is northerly with a
magnitude of 0.2 – 1.8 km/h and during North East
monsoon (October to February) the current is
southerly with a magnitude of 0.1 – 1.3 km/h. The
wind speed varied from 10- 40 km/h. These
monsoonal winds cause southerly (~ 0.5 million
m3/y) & northerly (~ 1 million m3/y) littoral drift19
.
The study area is one of the most important
and sensitive areas of the country housing strategic
industrial installation very close to the coastal belt.
Nuclear reactors Madras Atomic Power Station
(MAPS) and Prototype Fast Breeder Reactor
(PFBR), 500 MWe each, are located at a distance of
360 and 460m from the coastline respectively.
Apart from the above reactors, more nuclear
installations are being planned to be built in the
future. The BoB at Kalpakkam, known to generate
eddies and mesoscale features20
and is more prone
to cyclone. During the Indian ocean tsunami in
December 2004 the water level at the Kalpakkam
coast is reported to have reached a level up to
+10.8m21.
Thus, the present study will serve as
baseline for future impact assessment with respect
to textural characteristics of beach sediment as more
and more anthropogenic activities are excepted to
contribute adversely. Furthermore, the study will
contribute in formulating the coastal management
strategies, to protect the nuclear establishment.
Fig. 1 - Study area map showing sampling locations
The sediment samples were collected from
12 stations at Foreshore (FS) and Midshore (MS)
beaches (Figure 1) along Kalpakkam coastline at
monthly intervals during February 2012 to February
2013. Samples were collected based on the nature,
configuration and geomorphological setting of the
coastline. Locations near Mahabalipuram were
selected both sides of the shore temple (M3, M4 are
on North side of the temple whereas, M5, M6 are
on South side of the temple). Similarly, 4 locations
each from IGCAR (I3, I4, I5 and I6) and
Kalpakkam Township (K3, K4, K5 and K6) were
also selected for the investigation. Sediment
samples were collected at foreshore and mid-shore
point of each station during lowest low tide.
Foreshore sediments were collected by using a
teflon screw corer and midshore samples were
collected by hand, after removal of the upper few
layers of the reworked sand. Samples were
collected during lowest low tide. The collected
sediment samples were washed with fresh water;
1563

BRAMHA et al.: TEXTURAL CHARACTERISTICS OF BEACH SEDIMENT
dead shells were removed and oven dried at 70OC.
A known weight (100 g) of each sample was sieved
at intervals of ½ ø using an automatic sieve shaker
(Retsch GmbH, Hann, Germany, Model-AS 200)
and ASTM 20 cm diameter sieves (mesh no. 10 to
230) for 10 minutes. The graphical computational
method of Folk and Ward13
was used to calculate
the grain size statistical parameters, viz. graphic
mean, standard deviation, skewness, and kurtosis.
Statistical analysis of the results and graphical
analysis of the data were performed using
GRADISTAT software22
version 4.0, which is
extremely versatile and has almost the same size
scale (descriptive terminology) for sand as that used
by23-25
.
Result and Discussions
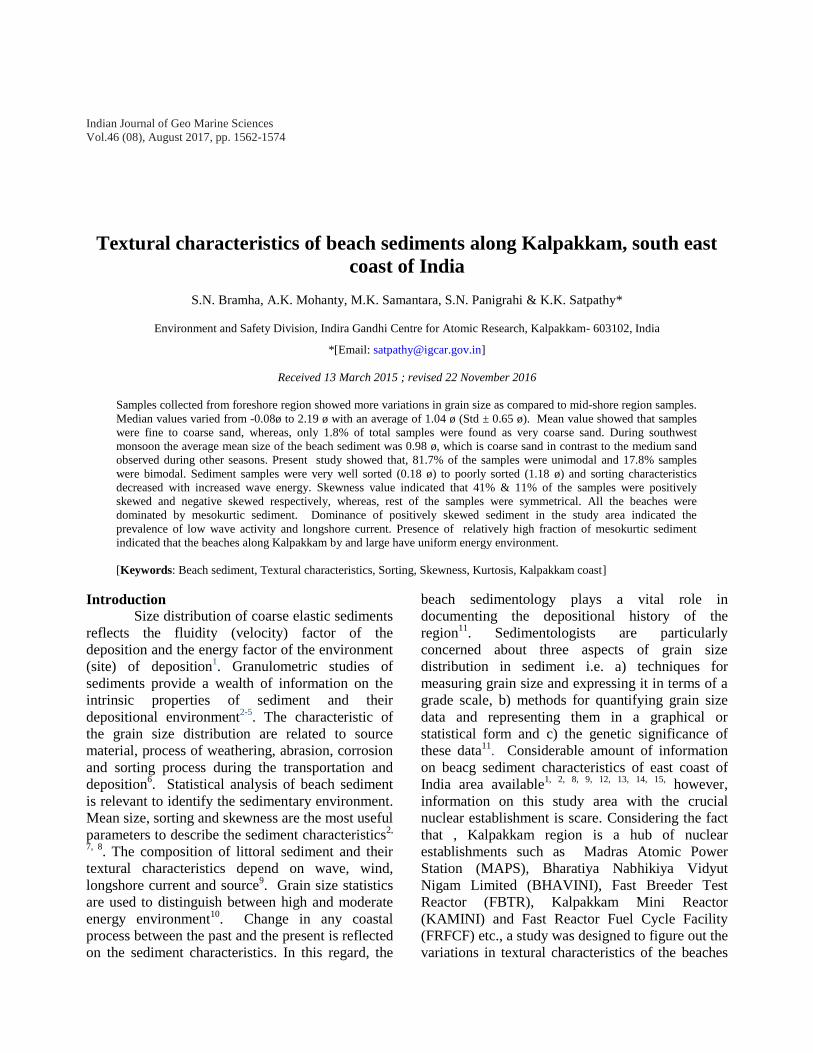
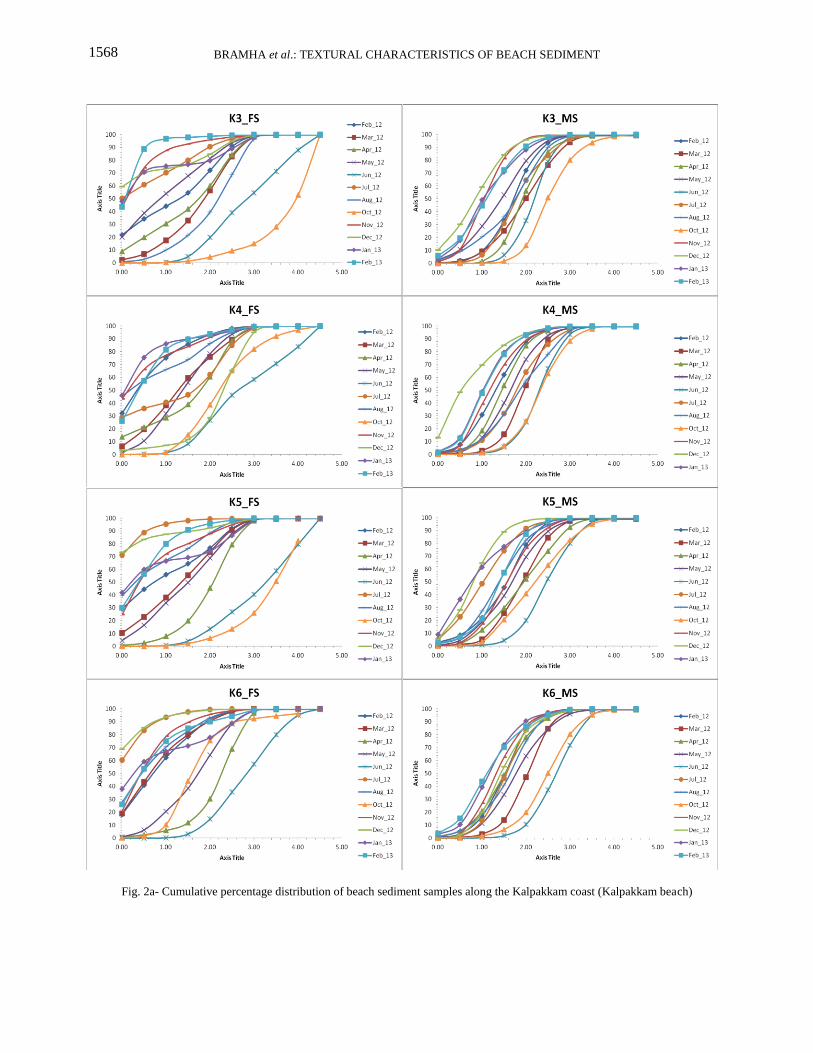
Grain size distribution of monthly
collected sediment samples are presented as
cumulative distribution in Figure 2a, b & c. It is
observed that the variation of grain size along MS
was relatively less as compared to that of FS in
spatial and temporal scale. The difference in grain
size distribution at different locations could be due
to the variations in wave energy experienced by
different sampling locations as well as the beach
morphology8, 26
.
Along the entire study region, the median
values varied from -0.22 to 2.61 ø with an average
of 1.04 ø (Std ± 0.65 ø) (Table 1). At Kalpakkam
beach, the median value varied from -0.07 to 2.20 ø
with an average of 1.01 ø (Std ± 0.62 ø), whereas at
IGCAR beach and Mahabalipuram beach it varied
from -0.13 to 2.20 ø and -0.03 ø to 2.16 ø with an
average value of 1.01 ø (Std ± 0.66 ø) and 0.99 ø
(Std ± 0.63 ø) respectively. It indicated that the
average median size of the Mahabalipuram
sediment sample is larger than that of IGCAR and
Kalpakkam beach samples. Grain size was bigger
along FS area as compared to MS area in 79.1% of
samples at Kalpakkam, 79.5% of samples at
IGCAR and 95.8% of the sample at
Mahabalipuram.
The mean values of the grain size samples
from three beaches varied between fine to coarse
sand, whereas, 1.8% of total samples were found to
be very coarse sand. All the three beaches were
dominated by medium sand (54%), followed by
coarse sand (40.4%). Mean values of grain size
varied from -0.22 to 2.46 ø at IGCAR, -0.05 to 2.33
ø at Kalpakkam and -0.02 to 2.35 ø at
Mahabalipuram with an average of 1.07 ø (Std
±0.54 ø), 1.19 ø (Std ± 0.57 ø) and 1.04 ø (Std ±
0.55 ø) respectively (Table 2). It was observed that
45.5% of the samples from IGCAR, 32.3% of
samples from Kalpakkam and 43 % of samples
from Mahabalipuram were coarse sand. Similarly,
51.1%, 60.4% and 52.1% of samples from IGCAR,
Kalpakkam and Mahabalipuram respectively were
medium sand (Table 3). During post-NE monsoon
and northeast monsoon period, the beach sand was
of medium size. Average mean size during post-
monsoon and NE monsoon period was 1.22 ø and
1.03 ø respectively. However, during SW monsoon
period the averages mean size of the beach
sediment was found to be 0.98 ø, which is coarse
sand. The variation of the beach sand with respect
to SW monsoon was result of change in wave
activity and current pattern occurring along the
coast27, 28
.
Average grain size along FS area was 0.78,
0.91 and 0.69 ø at IGCAR, Kalpakkam and
Mahabalipuram respectively, whereas the average
grain size along MS was 1.36 , 1.46 and 1.40 ø at
IGCAR, Kalpakkam and Mahabalipuram
respectively. It shows that the grain size was
relatively higher at FS region than that of MS
region. The bigger grain size in FS could be due to
the fact that small size particles are winnowed away
by wave action.
Along the study region, 81.7% of the
sample were unimodal, 17.8% samples were
bimodal and only 0.3% of the sample (i.e only one
sample) were trimodal/polymodal. IGCAR beach
samples were unimodal (80.6%) to bimodal
(19.3%), Kalpakkam samples were unimodal
(82.2%) bimodal (16.6%) and polymodal (1%),
whereas, Mahabalipuram samples were unimodal
(82.2%) to bimodal (17.7%). Unimodal
characteristic of the sediment sample was identified
towards gentle beach slope with less wave activity.
It was also observed that 65% of FS and 98.5% of
MS samples were unimodal whereas 34.2% and
1.4% samples were bimodal (Table 3). The above
data indicated that high wave activity in the
foreshore region shaped the textural characteristics
of the three beaches.
Sorting of sediment sample is a classification of
grains according to their shape and size. Standard
deviation (σ) measures the sorting of sediment and
indicates the fluctuations in kinetic energy or
velocity conditions of the depositing agent1.
Sorting values of the collected beach samples
reveled that the sediments samples were very well
1564

INDIAN J. MAR. SCI., VOL. 46, NO. 08, AUGUST 2017
sorted (0.18 ø) to poorly sorted (1.18 ø) (Table 3).
At IGCAR 52% of the samples were moderately
well sorted, 34% moderately sorted (34%). 7% were
poorly sorted, 6% were well sorted and 1% very
well sorted. In Kalpakkam and Mahabalipuram,
47% and 51% of samples were moderately well
sorted, 39% were moderately sorted and 10% and
9% were poorly sorted respectively. According to
Chakrabarti 30
and Chaudhri et al31
, moderately
sorted sands are predominant on the beaches of East
& West coast of India. The variations in sorting
characteristics are mainly attributed to the severity
of wave action, water turbulence and current
velocity. Results clearly indicated that as compared
to FS, MS samples were well sorted which could be
attributed to low wave energy activities. The land
ward part of long shore current played an important
role for sorting sediment along MS where more
samples were found well sorted. Moreover, settling
velocity of asymmetrical grains is less than the
perfect spherical grains, which facilitates easy
transportation of symmetrical grains to the upper
part of the swash zone. It was observed that M4
(Mahabalipuram segment) showed the highest
number of poorly sorted samples (21%) followed by
K3 (17%) and K4 (13%) of Kalpakkam segment. It
showed that wave action at these locations was
relatively higher which might have facilitated
deposition of mixed type of sediment grains.
Present analysis shows that sorting sediment
environment decreased with increased wave energy.
Skewness measures the degree of symmetry
or asymmetry of the grain size distribution. Duane31
observed that positive skewness characterizes a
beach with deposition of sand whereas; negative
skewness indicates erosion or non-deposition.
Erosion and non-deposition of beach influenced by
cyclic current pattern is indicative of the high
energy environment prevailing there. The beach
sediments varied in between very fine skewed to
very coarse skewed (Table 3).
Along the study area, 48% samples were
symmetric, 22% samples were very fine skewed,
19% samples were fine skewed, whereas 9% were
coarse skewed and 2% were very coarse skewed.
75% of samples at IGCAR & Mahabalipuram and
79% of samples at Kalpakkam varied in between
fine to coarse skewed, whereas the remaining
samples were observed to be very fine skewed and
very coarse skewed. Skewness characteristics
indicated that about 41% of the total sediment
samples from all the three beaches were positively
skewed (fine skewed and very fine skewed)
whereas 11% were the negatively skewed (coarse
skewed and very coarse skewed) and 48% were non
skewed (symmetrical) samples. Along the FS
region, the fine sand is winnowed away by wave
causing the sand to be coarse (negatively) skewed.
The strong fine skewed sediments generally imply
the introduction of fine material or removal of
coarser fraction2 or winnowing of sediments
31.
Results showed that depositional process (as
inferred from number of positively skewed
samples) was dominant at the Mahabalipuram
beach followed by Kalpakkam and IGCAR
segments in an annual cycle (Table 3). Similarly,
erosion or non-deposition processes were relatively
high at Kalpakkam as compared to the other two
beaches. High wave activity has been known to
increase the negative skewed sediment in a beach,
whereas, longshore current & low wave activity
support accumulation of positively skewed
sediment. The dominance of positive skewed
sediment in the study area thus indicated the
prevalence of low wave activity and alongshore
current.
Kurtosis is the measure of peakedness or
flatness of samples related to normal distribution.
Graphic Kurtosis represents the qualitative measure
of the part of sediment already sorted elsewhere in a
high energy environment and later transported to
different low energy environments in the coastal
areas and modified such as beach, shallow marine
and fluvial environment. All the three beach
samples of the present study varied between very
platykurtic to very laptokurtic (Table 3). Most of
the samples were platykurtic (23%), mesokutic
(65%) and laptokurtic (8%), whereas, very
platikurtic and very leptokurtic contain 3% and 2%
of samples respectively. Friedman32
suggested that
extreme high or low value of kurtosis imply that
part of sediment achieved its sorting elsewhere in a
high energy environment. All the three beaches
were dominated by mesokurtic samples. It has been
reported that platykurtic to very platykurtic and
leptokurtic to very leptokurtic sedimentary
environments are due to extremely low and high
energy environments respectively8. Thus, the
present study area by and large can be categorized
as uniform energy environment leading to
dominance of mesokurtic grains in the beach
sediment.
1565

BRAMHA et al.: TEXTURAL CHARACTERISTICS OF BEACH SEDIMENT
Table 1: median size of the beach sediments at different locations during different seasons
Name of the
beach
Station Location of
collection
Median size of the sediments in phi scale
Post monsoon South west monsoon North east monsoon
Min Max Ave Std Min Max Ave Std Min Max Ave Std
IGC
AR
I3 FS -0.11 1.21 0.60 0.48 -0.08 0.37 0.14 0.22 -0.10 0.53 0.29 0.34
MS 0.73 2.15 1.67 0.57 0.91 1.04 0.96 0.07 1.05 1.41 1.20 0.18
I4 FS -0.13 2.12 0.92 0.87 0.04 0.77 0.32 0.39 0.96 1.57 1.29 0.31
MS 0.96 1.62 1.33 0.30 0.52 1.01 0.80 0.25 1.23 1.44 1.33 0.10
I5 FS -0.22 0.79 0.33 0.38 0.19 2.61 1.06 1.35 0.18 1.08 0.73 0.48
MS 0.78 1.60 1.17 0.30 1.30 1.99 1.70 0.35 1.34 1.66 1.48 0.17
I6 FS 0.18 1.08 0.69 0.34 -0.05 1.48 0.82 0.79 -0.05 1.84 1.05 0.98
MS 1.07 1.92 1.61 0.35 1.14 1.46 1.34 0.18 1.28 1.39 1.35 0.06
KA
LP
AK
KA
M
K3 FS 0.07 1.86 1.13 0.74 0.00 2.17 1.11 1.09 -0.08 0.10 0.00 0.09
MS 1.10 1.95 1.62 0.36 1.75 1.81 1.78 0.03 0.84 1.51 1.10 0.28
K4 FS 0.35 1.74 1.02 0.63 0.18 1.35 0.88 0.62 0.07 2.28 1.07 1.13
MS 1.04 1.93 1.47 0.34 1.33 1.86 1.63 0.27 0.53 1.67 1.10 0.47
K5 FS 0.37 2.06 1.16 0.66 -0.14 0.74 0.30 0.44 -0.15 0.51 0.25 0.29
MS 1.40 1.94 1.69 0.23 1.02 1.53 1.31 0.26 0.77 1.79 1.23 0.53
K6 FS 0.43 2.24 1.15 0.79 -0.08 1.17 0.51 0.63 -0.13 2.38 0.74 1.12
MS 1.11 2.03 1.59 0.34 1.31 1.63 1.49 0.16 1.16 1.50 1.35 0.15
MA
MA
LL
AP
UR
AM
M3 FS 0.18 0.98 0.68 0.30 0.23 0.63 0.47 0.21 0.11 1.58 0.87 0.61
MS 1.33 1.94 1.55 0.26 1.16 1.50 1.32 0.17 0.92 1.83 1.38 0.41
M4 FS 0.38 2.29 1.23 0.89 0.19 0.38 0.29 0.10 -0.03 1.60 0.49 0.74
MS 1.52 2.11 1.77 0.23 0.69 1.35 1.01 0.33 0.71 1.78 1.31 0.50
M5 FS 0.01 0.52 0.26 0.19 -0.08 0.80 0.39 0.44 0.03 0.34 0.23 0.15
MS 1.07 1.91 1.45 0.40 0.74 1.20 0.99 0.23 1.07 1.31 1.21 0.10
M6 FS 0.03 1.55 0.81 0.63 -0.14 0.99 0.25 0.64 0.03 1.62 0.58 0.74
MS 1.15 1.82 1.49 0.28 0.88 2.02 1.30 0.63 1.08 2.50 1.58 0.63
1566

INDIAN J. MAR. SCI., VOL. 46, NO. 08, AUGUST 2017
Table 2: Discriptive statistics of grain size parameters for samples collected at various locations along Kalpakkam coast
Name of the
beach Location Statistics
Grain size parameters (Phi)
Mean Sorting Skewness Kurtosis
IGC
AR
I3
Min - Max 0.00- 2.09 0.49 - 1.09 -0.14 - 0.60 0.68 - 1.48
Ave 0.93 0.65 0.16 1.03
SD 0.62 0.16 0.21 0.18
I4
Min - Max 0.20 - 1.96 0.46 - 1.08 -0.32 - 0.72 0.68 - 1.50
Ave 1.05 0.70 0.08 0.98
SD 0.48 0.16 0.23 0.15
I5
Min - Max -0.22 - 2.46 0.18 - 1.17 -0.45 - 0.63 0.69 -1.74
Ave 1.08 0.72 0.11 0.99
SD 0.60 0.20 0.24 0.20
I6
Min - Max 0.42 - 1.97 0.49 - 1.05 -0.24 - 0.75 0.72 - 1.30
Ave 1.22 0.76 0.12 0.93
SD 0.43 0.17 0.25 0.13
KA
LP
AK
KA
M
K3
Min - Max 0.07 - 2.06 0.39 -1.13 -0.28 -0.76 0.65 - 1.27
Ave 1.18 0.74 0.10 0.96
SD 0.60 0.20 0.30 0.14
K4
Min - Max 0.21 - 2.23 0.48 - 1.05 -0.38 - 0.57 0.62 - 1.59
Ave 1.23 0.73 0.09 1.00
SD 0.53 0.17 0.24 0.20
K5
Min - Max -0.05 - 2.00 0.40 - 1.17 -0.19 - 0.65 0.60 - 2.78
Ave 1.11 0.76 0.14 1.01
SD 0.58 0.18 0.24 0.41
K6
Min - Max -0.02 - 2.33 0.46 - 1.13 -0.26 - 0.56 0.68 - 1.56
Ave 1.22 0.68 0.10 1.04
SD 0.62 0.15 0.22 0.18
MA
MA
LL
AP
UR
AM
M3
Min - Max 0.18 - 1.95 0.51 - 1.08 -0.17 - 0.44 0.72 - 1.27
Ave 1.10 0.72 0.09 0.98
SD 0.47 0.17 0.14 0.13
M4
Min - Max 0.02 - 2.07 0.39 - 1.18 -0.43 - 0.62 0.57 - 1.20
Ave 1.14 0.76 0.12 0.94
SD 0.61 0.23 0.25 0.16
M5
Min - Max -0.02 - 1.85 0.36 - 1.04 -0.29 - 0.67 0.63 - 1.67
Ave 0.86 0.73 0.18 0.97
SD 0.48 0.18 0.25 0.19
M6
Min - Max -0.01 - 2.35 0.46 - 1.17 -0.36 - 0.61 0.66 - 1.93
Ave 1.07 0.71 0.12 1.03
SD 0.63 0.17 0.25 0.23
1567
BRAMHA et al.: TEXTURAL CHARACTERISTICS OF BEACH SEDIMENT
Fig. 2a- Cumulative percentage distribution of beach sediment samples along the Kalpakkam coast (Kalpakkam beach)
1568

INDIAN J. MAR. SCI., VOL. 46, NO. 08, AUGUST 2017
Fig. 2b- Cumulative percentage distribution of beach sediment samples along the Kalpakkam coast (IGCAR beach)
1569
BRAMHA et al.: TEXTURAL CHARACTERISTICS OF BEACH SEDIMENT
Fig. 2c- Cumulative percentage distribution of beach sediment samples along the Kalpakkam coast (Mahabalipuram beach)
1570
INDIAN J. MAR. SCI., VOL. 46, NO. 08, AUGUST 2017
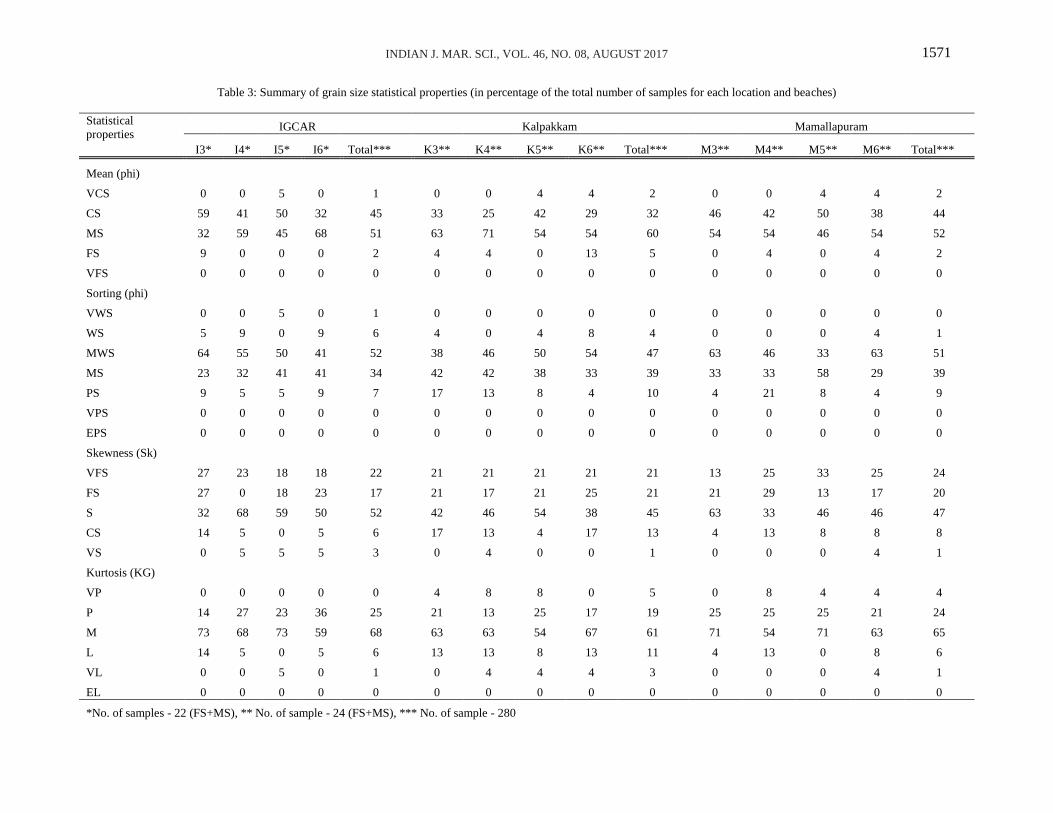
Table 3: Summary of grain size statistical properties (in percentage of the total number of samples for each location and beaches)
Statistical
properties IGCAR Kalpakkam Mamallapuram
I3* I4* I5* I6* Total*** K3** K4** K5** K6** Total*** M3** M4** M5** M6** Total***
Mean (phi)
VCS 0 0 5 0 1 0 0 4 4 2 0 0 4 4 2
CS 59 41 50 32 45 33 25 42 29 32 46 42 50 38 44
MS 32 59 45 68 51 63 71 54 54 60 54 54 46 54 52
FS 9 0 0 0 2 4 4 0 13 5 0 4 0 4 2
VFS 0 0 0 0 0 0 0 0 0 0 0 0 0 0 0
Sorting (phi)
VWS 0 0 5 0 1 0 0 0 0 0 0 0 0 0 0
WS 5 9 0 9 6 4 0 4 8 4 0 0 0 4 1
MWS 64 55 50 41 52 38 46 50 54 47 63 46 33 63 51
MS 23 32 41 41 34 42 42 38 33 39 33 33 58 29 39
PS 9 5 5 9 7 17 13 8 4 10 4 21 8 4 9
VPS 0 0 0 0 0 0 0 0 0 0 0 0 0 0 0
EPS 0 0 0 0 0 0 0 0 0 0 0 0 0 0 0
Skewness (Sk)
VFS 27 23 18 18 22 21 21 21 21 21 13 25 33 25 24
FS 27 0 18 23 17 21 17 21 25 21 21 29 13 17 20
S 32 68 59 50 52 42 46 54 38 45 63 33 46 46 47
CS 14 5 0 5 6 17 13 4 17 13 4 13 8 8 8
VS 0 5 5 5 3 0 4 0 0 1 0 0 0 4 1
Kurtosis (KG)
VP 0 0 0 0 0 4 8 8 0 5 0 8 4 4 4
P 14 27 23 36 25 21 13 25 17 19 25 25 25 21 24
M 73 68 73 59 68 63 63 54 67 61 71 54 71 63 65
L 14 5 0 5 6 13 13 8 13 11 4 13 0 8 6
VL 0 0 5 0 1 0 4 4 4 3 0 0 0 4 1
EL 0 0 0 0 0 0 0 0 0 0 0 0 0 0 0
*No. of samples - 22 (FS+MS), ** No. of sample - 24 (FS+MS), *** No. of sample - 280
1571
BRAMHA et al.: TEXTURAL CHARACTERISTICS OF BEACH SEDIMENT
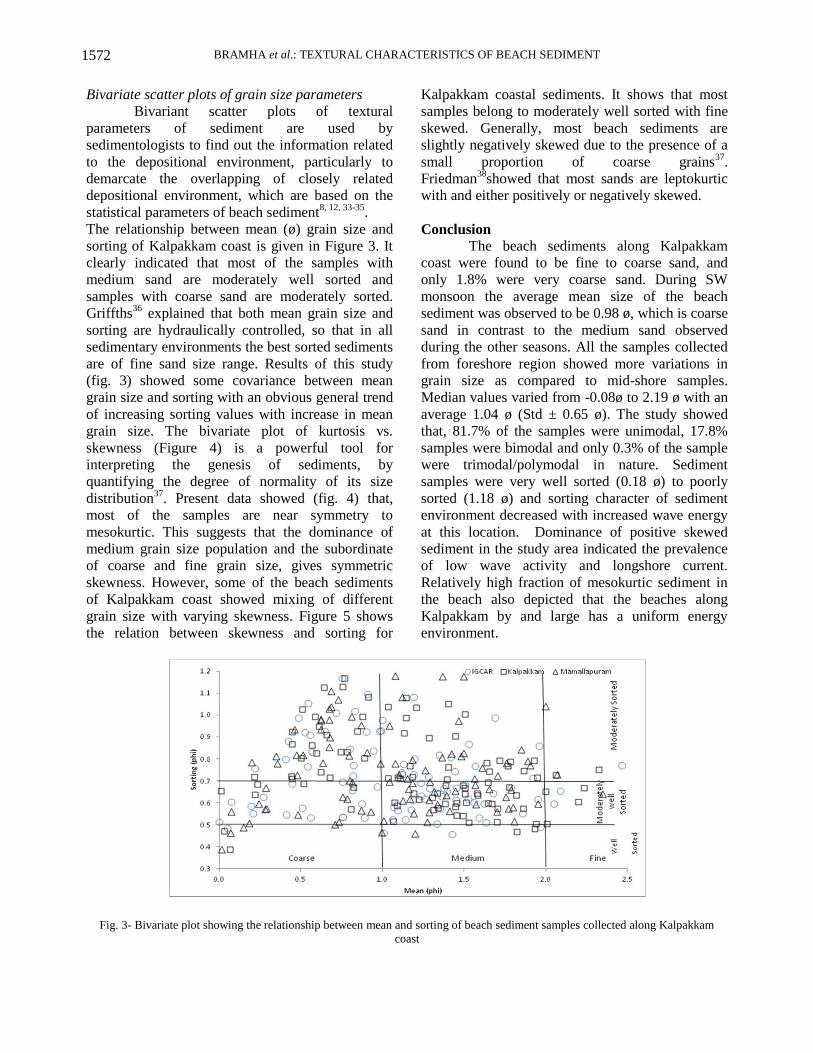
Bivariate scatter plots of grain size parameters
Bivariant scatter plots of textural
parameters of sediment are used by
sedimentologists to find out the information related
to the depositional environment, particularly to
demarcate the overlapping of closely related
depositional environment, which are based on the
statistical parameters of beach sediment8, 12, 33-35
.
The relationship between mean (ø) grain size and
sorting of Kalpakkam coast is given in Figure 3. It
clearly indicated that most of the samples with
medium sand are moderately well sorted and
samples with coarse sand are moderately sorted.
Griffths36
explained that both mean grain size and
sorting are hydraulically controlled, so that in all
sedimentary environments the best sorted sediments
are of fine sand size range. Results of this study
(fig. 3) showed some covariance between mean
grain size and sorting with an obvious general trend
of increasing sorting values with increase in mean
grain size. The bivariate plot of kurtosis vs.
skewness (Figure 4) is a powerful tool for
interpreting the genesis of sediments, by
quantifying the degree of normality of its size
distribution37
. Present data showed (fig. 4) that,
most of the samples are near symmetry to
mesokurtic. This suggests that the dominance of
medium grain size population and the subordinate
of coarse and fine grain size, gives symmetric
skewness. However, some of the beach sediments
of Kalpakkam coast showed mixing of different
grain size with varying skewness. Figure 5 shows
the relation between skewness and sorting for
Kalpakkam coastal sediments. It shows that most
samples belong to moderately well sorted with fine
skewed. Generally, most beach sediments are
slightly negatively skewed due to the presence of a
small proportion of coarse grains37
.
Friedman38
showed that most sands are leptokurtic
with and either positively or negatively skewed.
Conclusion
The beach sediments along Kalpakkam
coast were found to be fine to coarse sand, and
only 1.8% were very coarse sand. During SW
monsoon the average mean size of the beach
sediment was observed to be 0.98 ø, which is coarse
sand in contrast to the medium sand observed
during the other seasons. All the samples collected
from foreshore region showed more variations in
grain size as compared to mid-shore samples.
Median values varied from -0.08ø to 2.19 ø with an
average 1.04 ø (Std ± 0.65 ø). The study showed
that, 81.7% of the samples were unimodal, 17.8%
samples were bimodal and only 0.3% of the sample
were trimodal/polymodal in nature. Sediment
samples were very well sorted (0.18 ø) to poorly
sorted (1.18 ø) and sorting character of sediment
environment decreased with increased wave energy
at this location. Dominance of positive skewed
sediment in the study area indicated the prevalence
of low wave activity and longshore current.
Relatively high fraction of mesokurtic sediment in
the beach also depicted that the beaches along
Kalpakkam by and large has a uniform energy
environment.
Fig. 3- Bivariate plot showing the relationship between mean and sorting of beach sediment samples collected along Kalpakkam
coast
1572

INDIAN J. MAR. SCI., VOL. 46, NO. 08, AUGUST 2017
Fig. 4- Bivariate plot showing the relationship between Kurtosis and Skewness of beach sediment samples collected along
Kalpakkam coast
Fig 5- Bivariate plot showing the relationship between Skewness and Sorting of beach sediment samples collected along Kalpakkam
coast
Acknowledgement
The authors are grateful to Director, Indira
Gandhi Centre for Atomic Research and Director,
Heath, Safety and Environment Group for their
encouragement and support.
References 1. Sahu, B. K., Depositional mechanism from the size
analysis of clastic sediments, J. Sediment Petrol., 34
(1), (1964), 73-83
2. Friedman, G. M., Distinction between dune, beach
and river sands from their textural characteristics. J
Sediment Petrol, 31(4): (1961), 514–529.
3. Visher, G. S., Grain-size distributional processes. J
Sediment Petrol, 39(3): (1969) 1074–1106.
4. Natesan, U., Deepthi, K., Muthulakshmi, A. L.,
Ferrer, V. A., Narasimhan, S. V., Venugopalan, V.
P., Textural and depositional processes of surface
sediments of Kalpakkam, Southeast Coast of India
Frontiers of Earth Science Volume 6, Issue
4, (2012), 392-404.
5. Kumar, V. S., Dora, G. U., Philip, S., Pednekar, P.,
Jai Singh., Variations in tidal constituents along the
nearshore waters of Karnataka, west coast of India,
Journal of Coastal Research, vol.27(5); (2011), 824-
829.
6. Rajamanickam, G. V., Gujar A, R., Interpretation of
environment of deposition from multivariate
discriminant analysis, Indian J. Earth. Sci., 15,
(1988), 234-247.
7. Carranza-Edwards, A., Grain size and sorting in
modern beach sands. Journal of Coastal Research 17
(1): (2001) 38-52.
8. Dora, G. U, Kumar, V. S, Philip, C. S., Johnson, G.,
Vinayaraj, P., Gowthaman, R., Textural
characteristics of foreshore sediments along
Karnataka shoreline, west coast of India.
1573

BRAMHA et al.: TEXTURAL CHARACTERISTICS OF BEACH SEDIMENT
International Journal of Sediment Research, 26 (3),
(2011), 364-377.
9. Komar, P. D., Beach Processes and Sedimentation,
New Jersey, Prentice-Hall, (1976) 1-429.
10. Nordstrom, K. F., The use of grain size statistics to
distinguish between high- and moderateenergy beach
environments. Journal of Sedimentary Petrology,
Vol. 47, No. 3, (1977), 1287-1294.
11. Boggs, S., Principles of Sedimentology and
Stratigraphy. Prentice Hall, Englewood Cliffs, New
Jersey, (1995), 79–93.
12. Alsharhan, A S., El-Sammak, A. A., Grain-Size
Analysis and Characterization of Sedimentary
Environments of the United Arab Emirates Coastal
Area. Journal of Coastal Research: Volume 20, Issue
2, (2004) 464 – 477.
13. Folk, R. L., Ward, W. C., Brazos River bar (Texas): a
study in the significance of grain size parameters. J
Sediment Petrol, 27(1): (1957), 3–27.
14. Friedman, G. M., Differences in size distributions of
populations of particles among sands of various
origins: addendum to IAS Presidential Address.
Sedimentology, 26(6): (1979), 859–862
15. Rajganapathi, V. C., Jitheshkumar, N., Sundararajan.
M., Bhat, K. H., Velusamy, S., Grain size analysis
and characterization of sedimentary environment
along Thiruchendur coast, Tamilnadu, India,
Arabian Journal of Geosciences, Volume 6, Issue
12,(2012) ,4717-4728.
16. Angusamy, N .G., Rajamanickam, V., Coastal
processes of Central Tamil Nadu, India: clues from
grain size studies. Oceanologia 49 (1), (2007) 41–57.
17. Anbarasu, K., Geomorphology of the Northern
Tamilnadu coast using Remote Sensing Techniques.
Unpublished Ph.D. Thesis, Bharathidasan University,
Tiruchirappalli (1994) 184.
18. Mohan, P. M., Rajamanickam. G. V., Depositional
environment, inferred from grain size along the coast
of Tamil Nadu. J Geol Soc India, 52(1): (1998), 95–
102.
19. Satpathy. K, K., Effect of biofouling on the cooling
water quality of a nuclear power plant. Bull
Electrochem, 15(1): (1999), 143–147.
20. Varkey, M. J., Murty, V. S. N, Suryanarayana, A.,
Physical oceanography of the Bay of Bengal and
Andaman Sea. In: Oceanography and Marine
Biology: an Annual Review, vol. 34, A.D. Ansell,
R.V. Gibson, eds., UCL Press, (1996), 1-70.
21. CWPRS Physical Thermal model studies for locating
Intake/ Outfall of 500MWe Fast Breeder Reactor
Project. Technical Report No. 4332, by Central Water
and Power Research Station, Pune, India (2006).
22. Pye K, Blott S J., The geomorphology of UK
estuaries: the role of geological controls, antecedent
conditions and human activities. Estuarine Coastal
and Shelf Science 150, (2014) 196-214.
23. Friedman, G. M., Sanders, J. E., Principles of
Sedimentology. Wiley: New York. (1978).
24. Udden, J. A., Mechanical composition of clastic
sediments. Bulletin of the Geological Society of
America 25: (1914), 655–744.
25. Wentworth, C. K., A scale of grade and class terms
for clastic sediments. Journal of Geology 30: (1922),
377–392.
26. Bryant, E., Behaviour of grain size characteristics on
reflective and dissipative foreshores, Broken Bay,
Australia. Journal of Sedimentary Petrology, 52 (2),
(1982) 431-450.
27. Satpathy, K.K., Mohanty, A.K., Natesan, U., Prasad,
M.V.R. & Sarkar, S.K., Seasonal variation in
physicochemical properties of coastal waters of
kalpakkam, east coast of India with special emphasis
on nutrients. Environmental Monitoring and
Assessment, 164, (2010a), 153-171.
28. Satpathy, K.K., Mohanty, A.K., Sahu, G., Sarkar,
S.K, Natesan, U., Venkatesan, R. & Prasad, M.V.R.
Variations of physicochemical properties in
Kalpakkam coastal waters, east coast of India, during
southwest to northeast monsoon transition period.
Environmental Monitoring and Assessment, 171,
(2010b), 411-424.
29. Chakrabarti, A., Polymodal composition of beach
sands from the East coast of India. Journal of
Sedimentary Petrology, Vol. 47, No. 2, (1977), 634-
641.
30. Chaudhri, R. S., Khan, H. M. M., Kaur, S.,
Sedimentology of beach sediments of the
31. West coast of India. Sedimentary Geology, Vol. 30,
No 1-2, (1981), 79-94.
32. Duane, D. B., Significance of skewness in recent
sediments, Western Pamlico Sound. North Carolina.
Journal of Sedimentary Petrology, Vol. 34, No. 4,
(1964) 864-874.
33. Friedman, G. M., On sorting, sorting co-efficient and
log normality of the grain size distribution of
sandstones. J Geol, 70: (1962), 737–753.
34. Van Andel, T. H., Poole, D. M., Sources of Recent
Sediments in the Northern Gulf of Mexico. Journal of
Sedimentary Petrology, 30(1): (1960), 91-122
35. Davadarini, A. S., Ischenko, L. V., Shuvalov, A. R.,
Reflection of mechanical differentiation in the grain
size and mineral composition of shelf deposits in the
Black sea and Bay of Biscay. Oceanology (Mosc),
17: (1977), 447–451.
36. Krishna Kumar, S., Chandrasekar N., Seralathan P.,
Godson, P. S. Depositional environment and faunal
assemblages of the reef and associated beach rock at
Rameswaram and Keelakkarai group of Islands, Gulf
of Mannar, India; Frontiers of Earth Sciences in
China 5(1), (2011), 65–69.
37. Griffith. J, C., Size versus sorting in Caribbean
sediments. J Geol, 59(3): (1951), 211–243
38. Folk, R L., A review of the grain size parameters.
Sedimentology, 6: (1966), 73–93.
39. Friedman, G. M., On sorting, sorting co-efficient and
log normality of the grain size distribution of
sandstones. J Geol, 70: (1962), 737–753.
1574