Embed Size (px)
Citation preview
The Pakistan Development Review 37 : 4 Part II (Winter 1998) pp. 37:4, 595–619
Textiles Sector of Pakistan: The Challenge Beyond 2004
NAHEED ZIA KHAN
INTRODUCTION
The world is presently looking forward to embrace the greatest moment of modern history of humankind, turn of the millennium. For Pakistan, however, the millennium celebrations are going to be accompanied by over half a century of missed opportunities and a serious challenge ahead. The focus of this study is Pakistan’s status as a ‘single commodity’ country and the life after 2004 in a post-Multifibre Arrangement (MFA) era. This work intends to use the hindsight to argue that MFA, a cat’s cradle of bilateral textile import quotas, was a blessing in disguise for the value added textiles sector of Pakistan. And the difficulties beyond 2004, when all the quotas have gone, should not be underestimated in a bipolar (NAFTA and the EU) and deregulated world economy . The analysis is carried out in four parts. Part I highlights the economic significance of Pakistan’s textiles industry by briefly analysing its contribution to different sectors of her economy. Part II presents the past, present and future scenario of international trade in Textiles and Clothing (T&C). The present situation of Pakistan’s textiles industry along with its foreign exchange generating performance in the past is assessed in Part III. Finally, Part IV analyses the prospects and challenges faced by the T&C sector of Pakistan.
I. TEXTILES SECTOR OF PAKISTAN: ECONOMIC SIGNIFICANCE
The textiles industry may rightly be called the buttress of Pakistan’s economy for following three reasons. First, its backward linkage with the agricultural sector, the life line of Pakistan’s economy, is the strongest. Second, T&C are the biggest manufacturing units in the country, accounting for the largest share of manufacturing investment, value added, and employment. Third, and most important, these are high export interest enterprises. Given the comprehensive spill over effects of this sector, in the event of any external or internal upset this sector is bound to cause serious imbalances in the whole economy of Pakistan.
Naheed Zia Khan teaches Economics at Islamia University, Bahawalpur.

Naheed Zia Khan
37:4, 596
Table 1 provides an overview of the T&C industry’s contribution to various sectors of Pakistan’s economy. Data in Table 1 show that Pakistan’s cotton and textiles sectors contributed to export earnings over 65 percent of the total between 1986–90. Its share of 37 percent in manufacturing employment shows that, apart from its importance as the major source of foreign exchange earnings, T&C sector is the largest source of employment generation in the manufacturing sector of Pakistan. The economic significance of T&C sector is further strengthened by its relative contribution to the manufacturing investment, above 21 percent of the total between 1986–90. Taking into account this very large share of T&C sector in investment, it is not surprising that this industry also makes the largest contribution to the value addition in the manufacturing sector and pays substantial amounts in the form of indirect taxes. Table 1 registers over 20 percent and 8 percent contribution to value addition and manufacturing indirect taxes respectively during 1986–90. The contribution to indirect taxes may appear small at the outset, but its significance for the exchequer should not be underrated in a country where size of the underground economy has grown to 51 percent of GDP [Zafar, Qureshi and Mahmood (1998)].
Table 1
Share of Textiles Industry in Pakistan’s Manufacturing Sector and Exports (Percentage Annual Average in 1986–90)
Manufacturing Sector Export Earnings* Value-added Employment Investment Indirect Taxes
65.44 20.64 37.00 21.60 8.00 Source: For manufacturing sector, Pakistan Economic Survey 1997-98, Table 4.3, 4.4 and 4.5. For
exports, Kazmi (1995), Table III. * Includes export earnings of raw cotton, cotton yarn, cotton cloth, made-ups of textiles, ready
made garments, knitwear, synthetic textiles, carpet and rugs and tents and canvas.
II. REFERENCE OF ANALYSIS: INTERNATIONAL TRADE IN TEXTILES AND CLOTHING
T&C are labour intensive products and traditionally this industry has been the entree into manufacturing for developing countries. However, this route has long been made more difficult by the MFA, in operation since 1974, through which the EU, the US and most other developed countries regulate import from developing countries. Indeed, trade in T&C has always been to the advantage of developing countries’ exporters in the past, as GATT principles have not applied to this sector. That is because the developed countries with textiles industries had to undergo

Textiles Sector
37:4, 597
‘structural adjustment’ to maintain their competitive edge.1 Since 1st January 1995, international T&C trade is going through fundamental change under the 10 year transitional programme of the WTO’s Agreement on Textiles and Clothing (ATC). Under the agreement, WTO members have committed themselves to remove the quotas by 1st January 2005 and fully integrate T&C trade into GATT rules.2
While MFA was a major distortion of the world trade which affected many developing countries’ participation in world trade in T&C, individual countries have been affected in very different ways by MFA. There are two major categories of developing countries’ T&C exporters. The first category includes the countries which currently have a strong comparative advantage, like India and China,3 and whose market access has been tightly restricted, and which therefore will benefit from the abolition of MFA related restrictions. In the second category, on the other hand, there are countries which may suffer due to transitional cost. Pakistan, unfortunately, lists in the latter category. The problem is escalated when the account is taken of the relatively large quotas Pakistan has been enjoying and fully utilising. As given in Table 2, Pakistan was allotted the largest quota in
Table 2
MFA Quota of Selected Asian Exporters in the EU Market* Allotment (000 Tonnes) and Utilisation (Percentage)
Category Pakistan India Thailand Indonesia Malaysia South Korea Taiwan China Allotment 86 73 50 8 20 102 63 71
Utilisation 90.2 82.5 65.3 86.8 51.3 81.0 72.2 74.4 Source: Devenport and Page (1992), Table 3.1. * Based on 1988 imports.
1MFA is an International Commodity Agreement (ICA) among over 50 producing and consuming countries. It specifies a maximum amount of cotton, wool and synthetic fibres that each exporting country may ship to each importing country. In addition, the US and EU have bilateral agreements with many supplying countries in which the latter undertake to further limit their textiles exports to each of the two markets. In particular, strict limitations apply to the annual growth rate of imports. Although the MFA text does not limit its application to developing countries and the criterion for intervention is market ‘disruption’, only these countries have been subjected to it and the criterion has come to imply ‘low-cost’ producers [see Raffaelli (1990)]. It is truly amazing that MFA, a major departure from basic GATT rules, particularly the principle of non-discrimination embodied in MFN clause, has lasted since 1974 and the Uruguay Round has given it another ten years to be phased out.
2MFA coverage of trade in textiles is going to be removed in four very unequal stages. The process is based on integration of the product according to relative trade shares represented by import level during 1990. The first phase was due to be completed by the end of 1994, covering the items which accounted for at least 16 percent of 1990 imports. The second phase, adding a minimum of 17 percent, was to be completed by the end of 1997. An additional 18 percent is to be integrated by the end of 2001. The remaining products need not be integrated, until the terminus, 1st January 2005, is reached (see WTO, “Agreement on Textiles and Clothing”).
3China and Taiwan were not MFA signatories. But their T&C exports to EU markets and US have also been subjected to the same quota regime.

Naheed Zia Khan
37:4, 598
the EU market after South Korea and its quota utilisation rate has been the highest of all its Asian competitors. Further, since the imposition of MFA there has been, in the meantime, emergence of even lower cost suppliers in the Far East.
Pakistan is the largest exporter of cotton yarn in the world and the fourth largest exporter of cotton fabric.4 But Pakistan’s T&C industry is at a phenomenal disadvantage compared to South East Asian (SEA) countries. SEA countries, including Japan, Hong Kong, South Korea and Indonesia are main markets for Pakistan’s yarn exports. These countries re-export textiles after substantial value addition. As documented in Table 3, in recent years, Pakistan’s competitive position in the world market has further weakened relative to its Asian competitors. The figures show that, except for Indonesia and India, share of all of its Asian competitors, falling under the MFA regime, in world merchandise exports value more than doubled in 16 years to 1996. Compared to Pakistan, even India’s share is substantially higher in 1996 from its 1980 level. The Indonesian share, however, registered a decrease which might have been caused by the political turmoil of the last years of Suharto regime coupled with the onset of “Asian crisis”. Although Thailand is widely believed the biggest victim of the “Asian crisis” and –1 percent fall in its export value in 1997 is justified on that ground, Pakistan, ironically, appears to have been inflicted most by the “Asian crisis”: the bonanza in 1996, which might have been the result of the appreciation of the currencies of its SEA competitors, was followed by –6 percent negative growth in its merchandise exports value during 1997.5 Pakistani yarn, the largest foreign exchange earning item of her exports, is now facing competition from Indian varieties in its traditional markets of the Far East, particularly Japan.
Table 3
Merchandise Exports Value of Selected Asian Economies % Share in World Trade Annual Percentage Change Region/Country 1980 1996 1995 1996 1997 Asia 15.01 27.63 18 1 5 Pakistan 0.13 0.18 9 17 -6 India 0.42 0.62 23 7 3 Thailand 0.32 1.05 26 -1 3 Indonesia 1.06 0.94 13 10 7 Malaysia 0.64 1.47 26 5 1 South Korea 0.86 2.45 30 6 5 Taiwan 0.97 2.19 20 6 5 China 0.89 2.85 23 2 21
Source: World Trade Organisation.
4The country’s share of world production in both categories is 7.23 percent and 6.12 percent respectively [see ‘Textile Exports May Miss Target’, Pakistan and Gulf Economist (PAGE), November 30th 1996].
5It must be added here that the financial crisis in some Asian countries had only a modest impact on average global trade growth in 1997, both in value and volume terms [see WTO (1996)].

Textiles Sector
37:4, 599
Furthermore, Pakistan is generally not perceived to be a preferred supplier by buyers in the export markets. Its T&C industry is generally considered to be the one which does not appreciate competition oriented dynamics of market, as it lacks innovative ideas and supplies a limited product range of lower than average quality level. These problems are present to a varying degree in all textiles producing developing countries. But many of the countries have resolved them in part and are reaping the dividends, while lack of diversification and low quality of Pakistani T&C products have eroded country’s comparative advantage even in the quota markets. In 1993 quota utilisation in certain categories for the major EU countries was as low as 20 percent. For USA, the comparable number was 28 percent [Azhar (1995)]. Thus the optimism about Pakistan’s enhanced textiles exports, based on the presumption that quota regime has severely constrained its export performance [Naqvi and Mahmood (1995)], in the post-MFA era is misplaced. And there is little doubt that the primary problem behind the poor performance of Pakistan’s T&C exports is an inadequate domestic supply response rather than a lack of export opportunities.6 In recent years, Pakistan’s quota utilisation performance rather lends supports to the argument that a fully utilised quota does not always imply that it has been binding [Erzan et al. (1989)].
In the non-quota markets, buyers of Pakistani yarn and cloth are heavily concentrated in East Asia. Now the Chinese, Indian and other Asian competitors can supply even these products at lower prices.7 Further, since importing non-quota countries have no threat to their upstream textiles industry, their buyers are highly price sensitive due to the commodity nature of items. Another challenge is that major buyers of Pakistani yarn in Far East Asia are gradually moving out of textiles industry. For future growth, exporters will have to tap new markets in a world where the already stiff competition is increasingly getting fierce.
So far, unfortunately, Pakistan has not been able to take advantage of its cheap labour and domestic raw material availability to capture a significant share of the world T&C market. In FY 1992, country produced 12.7 percent of the world cotton output, but its share in the world T&C exports barely crossed 2 percent mark, and for most of the years before that it remained close to 1 percent [Ministry of Commerce (1993)].
III. PAKISTAN’S TEXTILES AND CLOTHING INDUSTRY: STRENGTH AND WEAKNESSES
Textiles industry in Pakistan has in its credit the largest number of manufacturing units in the formal sector of the economy. This merit is, however,
6As a matter of fact, under the Bilateral Textiles Agreement with USA, Pakistan enjoys one of the highest growth rates on textile quotas. The agreed principal of growth on growth under the Uruguay Round will enable Pakistan to have quotas almost doubled at the end of 2004 [see Kazmi (1995)].
7While Pakistan gets only US$2.13 per kg of T&C exports into Japan, Korea and China get US$18.97 and US$13.4 respectively [see Khan (1995)].

Naheed Zia Khan
37:4, 600
marred by the fact that over 50 years of its existence it has shown very poor record of self-sustained balanced growth through downward integration. Figure 1 generally summarises value addition downstream of textiles industry.
Pakistan’s textiles industry can be broken into three main categories, spinning, weaving and composites. In the organised sector spinning, with approximately 8.23m spindles and 0.143m rotors [Pakistan (1998)], is the biggest industry. As textiles manufacturers relied heavily on yarn exports, spindle capacity significantly increased over the years. At the same time, the actual capacity utilisation has fallen from 94 percent in 1959 to 79 percent in 1997 [ibid]. Spinning sector suffers from over-capacity because it was not complemented by corresponding increase in capacities of downstream industries. As a matter of fact, the real textiles sector comprises value addition downstream industries, weaving, finishing and manufacture of made-ups, including garments, respectively.8 But spinners have always dominated the industry and the huge increase in spinning capacity is the result of the concentration of effort on the export of this low value added product category.9 Table 4 provides annual average contribution of various cotton and textiles categories in Pakistan’s export earnings. As listed in Table 4a, cotton yarn made the largest contribution, 33.6 percent, in the total foreign exchange earnings of six cotton and textiles categories between 1970–96. Its contribution was ever largest, 41.9 percent, during 1990–96, the last sub-period. Accordingly, the contribution of cotton yarn turns out to be highest, 12.19 percent between 1970–96, also in Table 4b. which lists the relative contribution of same product categories in total export earnings of the country. The same trend is observed in Table 4c. Which is based on a different set of data. The figures documented in Table 4 show that the share of high value added products was much lower in total export earnings than the potential of the country. After cotton yarn, cotton cloth constituted the largest share, 31.5 percent and 11.06 percent during 1970–96, and 11.22 percent during 1978–94 in a., b. and c. of Table 4 respectively. Ready made garments accounted for the third largest share, 6.13 percent, of export earnings during 1978–94, followed by made-ups of textiles. Share of raw cotton in exports varied vary widely because of fluctuations in the quantum of cotton available for exports. Table 4 provides the evidence that Pakistan’s exports earnings still primarily consist of raw cotton and intermediate textiles products.
8Finished garments bring on average US$5 per pound as compared to an average of US$0.70, US$1.40 and US$2 in case of raw cotton, cotton yarn and cotton fabrics respectively (see ‘Textile Industry Review’, AKD Research, October 23 1998).
9Pakistan constitutes approximately 25 percent of world coarse yarn production. Therefore, particularly due to overemphasis on yarn production, Pakistan is the largest yarn exporter in the world (ibid).

Textiles Sector
37:4, 601
Figure One

Naheed Zia Khan
37:4, 602
Table 4
Share of Cotton and Textiles in Export Earnings
Product Category 1970–79 1980–89 1990–96 1970–96 (a) % Share in Foreign Exchange Earnings of Six Product Categories
1. Raw Cotton 25.50 35.16 11.73 25.50 2. Cotton Waste 0.86 0.58 1.81 1.00 3. Cotton Yarn 35.26 26.30 41.90 33.66 4. Cotton Thread 1.09 0.64 0.11 0.67 5. Cotton Cloth 35.76 28.89 29.19 31.51 6. Synthetic Textiles 1.51 8.42 15.24 7.62 Total (1+2+3+4+5+6) 100 100 100 100
(b) % Share of Total Export Earnings: Six Product Categories Product Category 1970–79 1980–89 1990–96 1970–96 1. Raw Cotton 9.19 12.32 4.54 9.14 2. Cotton Waste 0.32 0.20 0.71 0.38 3. Cotton Yarn 12.33 9.12 16.36 12.19 4. Cotton Thread 0.36 0.21 0.04 0.23 5. Cotton Cloth 12.07 9.81 11.45 11.06 6. Synthetic Textiles 0.51 2.97 5.96 2.83 Total (1+2+3+4+5+6) 34.79 34.62 39.02 35.82
(c) % Share of Total Export Earnings: Nine Product Categories Product Category 1978–83 1984–89 1990–94 1978–94 1. Raw Cotton 11.12 13.00 5.66 10.21 2. Cotton Yarn 8.68 11.03 17.61 12.13 3. Cotton Cloth 11.03 10.96 11.78 11.22 4. Ready Made 3.10 7.09 8.6 6.13 5. Made-ups of Textiles 2.71 6.35 8.15 5.60 6. Knitwear 0.93 2.45 6.28 3.04 7. Tents and Canvas 2.20 1.43 0.73 1.43 8. Carpets and Rugs 8.18 5.50 3.27 5.79 9. Synthetic Textiles 2.57 3.14 6.58 3.96 Total (1+2+3+4+5+6+7+8+9) 50.54 60.86 68.6 59.51
Source: (a) and (b) are computed from the raw data for cotton and textiles categories and for total exports taken from Economic Survey 1997-98 and International Financial Statistics of the IMF respectively. For ratios listed in (c) raw data were taken from Kazmi (1995), Table 3.

Textiles Sector
37:4, 603
The latter, unfortunately, are low quality and fetch low price. Not to speak of large countries like China and India, it is a matter of great concern to note that even a small country Bangladesh which does not produce a gram of cotton has emerged as a major competitor for Pakistan’s garments exports. Realising its limitations, Bangladesh did not go for the establishment of upstream industries and availed the advantage of low-cost manpower for manufacturing the highest value addition product, garments.10 Further, not falling under MFA regime was an advantage which Bangladesh exploited to a maximum. On the contrary, given that Pakistan is among the top five cotton producing countries with abundant labour, it could be suggested with the benefit of hindsight that MFA appears to be one of the major factors causing the production of low quality products and unbalanced growth of Pakistan’s textiles sector.11 As mentioned earlier, the latter suffers from an imbalance between spinning, weaving and processing. Spinning constitutes 68 percent of the total listed units, weaving 12 percent and composite 20 percent [APTMA]. The imbalance makes the spinners all the more powerful and they are able to enforce their vested interests. Spinners status as the largest earners of foreign exchange must be discounted by the fact that spectacular growth of this sector owes to out of the proportion public policy favours, at both domestic and external fronts.12 In spite of more than fifty years of its existence, this sector, unfortunately, still needs crutches to live on.
Although Pakistan’s textiles industry enjoys enormous advantages compared to other manufacturing activities of the country, it has so far failed to achieve competitiveness in terms of quality, value addition and price optimisation through Balancing, Modernisation and Restructuring (BMR). Pakistan’s textiles producers kept the myopic view of the market and spared themselves the investment efforts which could have brought the industry and the country the dividends of long-run viability and sustainability of high GDP growth rates respectively. However, in all
10Ready made garments and knitwear products accounted for more than 70 percent of the total foreign exchange earnings of Bangladesh in 1997 [see Pakistan Textile Journal, August (1998)]. Further, It should be added that Bangladesh with a high share of manufactures in its total merchandise exports (83 percent in 1994), is figured among those traders which expanded their exports faster than world trade through 1985-94 [see WTO (1996)].
11Pakistan, owing to its true comparative advantage in T&C, could have immensely benefited by MFA restrictions on large suppliers. But, on the contrary, MFA safety net appears to have hindered her production and export of high quality and high value-added products. Pakistan enjoys large quantities in upstream categories. Not only that these products have low value addition, the allocation of quota on the basis of quantity exported rather than on price realisation prompted many producers to sell low quality in large volumes at lower prices.
12The favours include availability of cotton at prices 30 percent below the international level, duty free import of plant and machinery, financing at lower interest rates and complete ban on import of textile products into the country. Had this kind of environment available to any other industry, perhaps it would have grown to any imaginable size.

Naheed Zia Khan
37:4, 604
fairness, the Government policy has been equally responsible for the ailment of Pakistan’s textiles sector. For example, the nationalisation of Pakistan’s banking industry in the 1970s’ was followed by very liberal industrial financing policies of the Government to offset the private investment effects of the nationalisation of manufacturing units. The policy of liberal industrial financing helped in expanding both the vertical and horizontal base of the textiles industry. Unfortunately, this windfall was disbursed and availed in an unplanned manner by the lending and borrowing parties respectively. The commonplace practice of over-invoicing resulted in eroding the viability of projects. As a matter of fact, the debt/equity ratio of Pakistan’s manufacturing sector as a whole was drastically changed to include the extra added risk of further nationalisation. It went from 60:40 to 70:30, then to 80:20 and finally ended up at 90:10 [Altaf (1989)]. In some cases financial institutions provided 100 percent capital, leaving the entire control to the private sector i.e. a state enterprise in private hands [ibid]. Resultantly, the textiles industry, specifically its weaving and spinning sectors,13 are currently under heavy burden of loans most of which have become overdue in repayments. Despite frequent rescheduling and all efforts of the Government and the banks, the default levels are high and recovery position is very weak. The largest percentage of stuck-up loans belongs to the textiles sector. Data on companies debt/equity and dividend ratio in Table 5 and Table 6 are useful, albeit rough, indication of the magnitude of problem. The evidence provided in Table 6 shows that the performance of the textiles industry has been very disappointing on the stock exchange market. There are about 238 textiles companies on the board of Karachi Stock Exchange (KSE). Hardly a little over 20 percent of their shares are selling at face value or above.14 The investors confidence in the textiles industry has shattered as many shares of the companies on KSE are selling at below 20 percent of the face value resulting in heavy losses to the holders.15 Even some of the blue-chip companies have been under severe recession for the last few years. The evidence listed in Table 6 shows that most of the textiles units are either running in loss or don not declare any cash dividends to the stockholders.
13Apart from the Government policy, the spinners, too, are responsible for the problems the sector is now facing. The public limited companies of this sector not only lent huge amounts to associate private limited companies, they also heavily invested in the equities of viable companies in other sectors of the economy. Such practices forced the spinning units to avail credit from the financial sector to the maximum borrowing limit.
14The three major composite units on the KSE experienced a drastic decline in aggregate Earning Per Share (EPS) from Rs 3.66 in 1994 to Rs 0.5 in 1995, before recovering to Rs I.54 in 1996 (see Pakistan Compendium, January 1998).
15The market value of shares of 220 companies on the KSE is estimated around Rs 20 billion, compared to the investment which is estimated around Rs 50 billion at face value rate. But the overall value of these units may be around Rs 80 billion (ibid).

Textiles Sector
37:4, 605
Table 5
Debt/Equity Ratio of Pakistan’s Textiles Industry*
Spinning Units
(132)
Composite Units
(31)
Weaving Units
(18)
Total Units
(181)
1994-95 1995-96 1994-95 1995-96 1994-95 1995-96 1994-95 1995-96
72:28 76:24 56:44 54:46 78:22 78:22 66:24 68:32 Source: All Pakistan Textiles Mills Association (APTMA). *APTMA members only.
Table 6
Market Worth and Dividend Position of Pakistan’s Textiles Industry
Cash Dividend Paid
Sector
No. of
Listed Units
Selling Below
Face Value 1991 1992 1993 1994
Spinning 159 111 11 44 24 19
Weaving 29 25 1 2 2 1
Composite 50 26 12 9 7 6 Source: APTMA.
The fortunes of both Pakistan’s economy and her textiles industry are closely
tied to the cotton growers. Although Pakistan is among the top five cotton producing countries, its cotton yield is much lower compared to many other cotton producing countries.16 But except for FY 1992, when cotton crop recorded Pakistan’s highest ever yield of 12.7m bales, the actual production of cotton has mostly been lower than the original estimates and cotton production in Pakistan has never exceeded 10.5m bales mark. Furthermore, although the quality of cotton has showed improvement over the past records, it is still below the international standards. The main buyers, spinners, did not invested any efforts towards improvement in quality. By buying whatever was available in ginning factories and producing yarn accordingly, they failed to give any standardisation system to upstream producers. In
16The cotton yield in Pakistan is 597 kg per hectare as against 1720 in Israel, 1280 in Australia and 1128 in Turkey. According to experts, the country can achieve 20 million bales from the existing area under cultivation through better crop management. Being an agriculture based economy and cotton being one of the major crops, 1.5m bales variation in cotton production effects the GDP growth, according to one estimate, by 1 percent (see ‘Textile Industry Review’, AKD Research, October 23 1998).
Naheed Zia Khan
37:4, 606
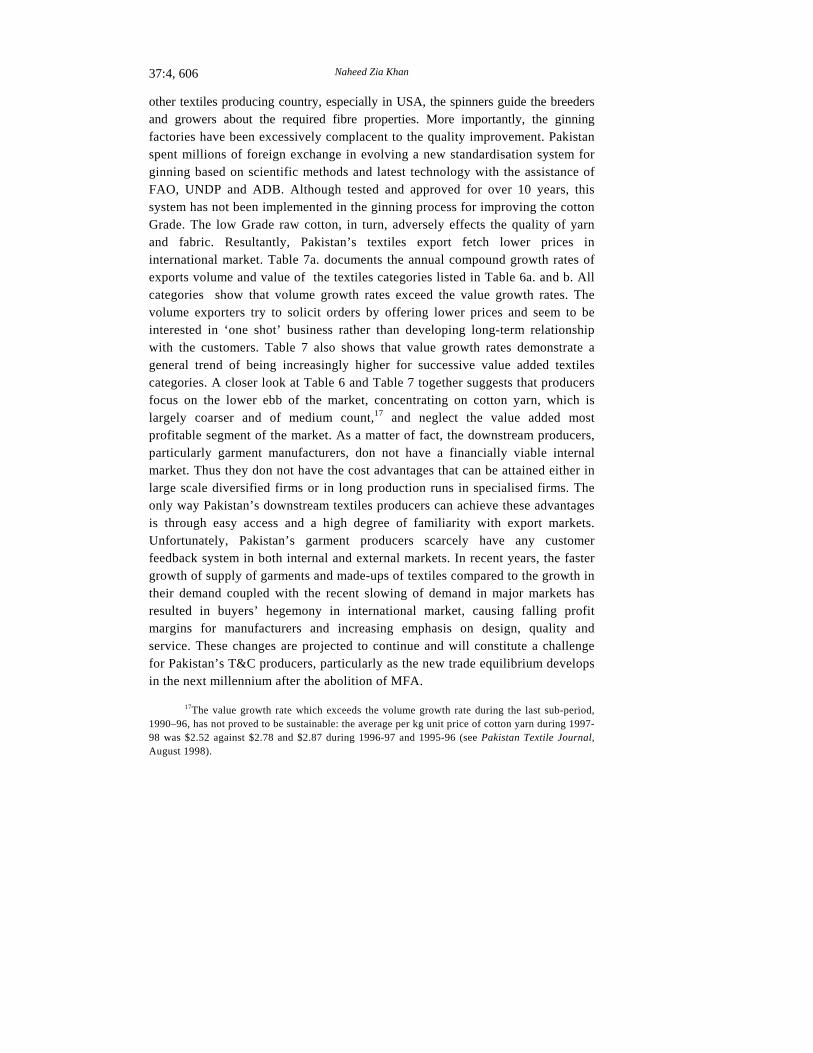
other textiles producing country, especially in USA, the spinners guide the breeders and growers about the required fibre properties. More importantly, the ginning factories have been excessively complacent to the quality improvement. Pakistan spent millions of foreign exchange in evolving a new standardisation system for ginning based on scientific methods and latest technology with the assistance of FAO, UNDP and ADB. Although tested and approved for over 10 years, this system has not been implemented in the ginning process for improving the cotton Grade. The low Grade raw cotton, in turn, adversely effects the quality of yarn and fabric. Resultantly, Pakistan’s textiles export fetch lower prices in international market. Table 7a. documents the annual compound growth rates of exports volume and value of the textiles categories listed in Table 6a. and b. All categories show that volume growth rates exceed the value growth rates. The volume exporters try to solicit orders by offering lower prices and seem to be interested in ‘one shot’ business rather than developing long-term relationship with the customers. Table 7 also shows that value growth rates demonstrate a general trend of being increasingly higher for successive value added textiles categories. A closer look at Table 6 and Table 7 together suggests that producers focus on the lower ebb of the market, concentrating on cotton yarn, which is largely coarser and of medium count,17 and neglect the value added most profitable segment of the market. As a matter of fact, the downstream producers, particularly garment manufacturers, don not have a financially viable internal market. Thus they don not have the cost advantages that can be attained either in large scale diversified firms or in long production runs in specialised firms. The only way Pakistan’s downstream textiles producers can achieve these advantages is through easy access and a high degree of familiarity with export markets. Unfortunately, Pakistan’s garment producers scarcely have any customer feedback system in both internal and external markets. In recent years, the faster growth of supply of garments and made-ups of textiles compared to the growth in their demand coupled with the recent slowing of demand in major markets has resulted in buyers’ hegemony in international market, causing falling profit margins for manufacturers and increasing emphasis on design, quality and service. These changes are projected to continue and will constitute a challenge for Pakistan’s T&C producers, particularly as the new trade equilibrium develops in the next millennium after the abolition of MFA.
17The value growth rate which exceeds the volume growth rate during the last sub-period, 1990–96, has not proved to be sustainable: the average per kg unit price of cotton yarn during 1997-98 was $2.52 against $2.78 and $2.87 during 1996-97 and 1995-96 (see Pakistan Textile Journal, August 1998).

Textiles Sector
37:4, 607
Table 7
Growth Rates of Raw Cotton and Textiles Exports of Pakistan* Product Category 1970–79 1980–89 1990–96 1970–96
(a) Low and Medium Value-added Categories a(V) Raw Cotton –5.58 4.80 -24.38 1.50 (Q) –10.14 14.79 –24.16 4.29 b(V) Cotton Waste –18.70 18.27 5.97 9.69 (Q) –26.28 27.99 9.18 11.34 c(V) Cotton Yarn 2.42 9.15 5.86 7.028 (Q) –3.75 13.52 4.63 8.44 d(V) Cotton Thread 6.24 –20.14 –15.55 –7.43 (Q) –1.80 –17.29 –15.02 –5.75 e(V) Cotton Cloth 9.07 2.85 9.73 5.49 (Q) 4.73 5.65 3.04 5.50 f (V) Synthetic Textiles 4.45 18.05 10.99 20.45 (Q) 3.65 40.10 8.63 22.13 Total (V) (a+b+c+d+e+f) 2.99 5.32 5.11 6.24 Exports (Value) 9.25 2.78 4.41 5.80
(b) High Value Added Product Categories (Value) Product Category 1978–83 1984–89 1990–94 1978–94
Knitwear 20.52 26.69 13.74 23.68 Madeup of Textiles 32.13 21.79 5.95 17.03 Ready Made Garments 17.28 18.37 8.50 15.28
Source: Growth rates in (a) are computed from the raw data for cotton and textiles categories and for total exports taken from Pakistan Economic Survey 1997-98 and International Financial Statistics of the IMF respectively. For Growth Rates listed in (b), raw data were taken from Kazmi (1995), Table III.
*Percent annual compound growth rates estimated at constant market price of the United States, the base year is 1990.
The evidence provided in this part supports the conclusion that textiles sector
in Pakistan has relied heavily on static comparative advantage in cotton production and did not really focus on the dynamics of increasing productivity. In spite of its existence for over 50 years, Pakistan’s textiles industry is still living on cheap cotton, fiscal, monetary and commercial policy incentives and trade barriers for its survival. Even when an industry is viable without incentives and protection, competitiveness and comparative advantage are temporary according to the argument of product cycle theory [Vernon (1966)]. In the present world of technological development, static comparative advantage is more viable and lasts longer if accompanied by dynamic

Naheed Zia Khan
37:4, 608
competitive advantage which requires inventions and innovations of the products and production processes. Pakistan’s textiles producers hardly spared any funds for R&D and short-term ready cash was given first preference at the cost of ignoring long-run fat dividends of investment in quality and consumer preferences. Finally, as it presently appears, Pakistan’s textiles industry which cannot stand without outright favours is going to be a laggard in the world market after 2004 when new trading order begins and MFA safety net is no longer available to provide protection from strong competitors in its traditional markets, EU and North America. Indeed, ruthless competition is likely to be offered by countries such as China, India, Thailand, Malaysia, the Philippines, Mexico and a number of others, especially in the crucial area of higher value-added categories. In the present situation of low competitive levels, market liberalisation in the next millennium threatens to woo away even its established customer base. It will be difficult to find even the cozy domestic arena in which a business might hide.18 Any domestic or international market large enough to be attractive is going to be subject to the normal activities of world producers looking for additional market share.
IV. IMPLICATIONS OF THE NEW ORDER FOR POLICY
FORMULATION: EGGS AND BUGS
Figure 2 summarises the restructuring challenge faced by the textiles sector of Pakistan. There are three eggs of high potentiality which need careful hatching for profitably sustainable reproduction of the sector. Two bugs, on the other hand, frequently cause viral infection as they quickly develop immunity from all ‘vaccine’. The best that could be done for viable existence is careful administration of relevant ‘medicine’. These eggs and bugs are analysed in the following. Given the scope of this study, this discussion is limited to certain key factors in each category.
1. The major challenge for Pakistan’s T&C producers is to enhance the competitiveness which is presently threatened by the internal weaknesses. Monitoring for quality is the biggest challenge, because quality may be multi-dimensional, unquantifiable in some respects and may contain an irreducible subjective element [Hirschleifer (1971)]. However, a market economy devises various institutions to cope with the uncertainty about quality. These include brand names, advertising, guarantees, warrantees, client relationships, service contracts and, most importantly, effective information system. For maintaining and enhancing competitive edge, the producers must develop these institutions. Substantial investment in real
18Pakistan’s T&C producers must take into account that Article 6 and 7 of ATC embody obligations for both importing and the exporting countries of MFA, committing Pakistan to remove QRs and prohibitions on the import of T&C products (see WTO, “Agreement on Textiles and Clothing”).

Textiles Sector
37:4, 609
Figure 2

Naheed Zia Khan
37:4, 610
time systems is required for using information technology to respond to changing customer preferences within the shortest possible time. Maintaining competitive edge in the 21st century necessarily requires improved relationship with the customer. Suppliers who can give rapid response to satisfy their customers will invariably be the winners. On-line facilities such as order status inquiry, delivery timetable, video conferencing, new order booking and customer inquiries will help to improve competitiveness. As a matter of fact, essential intelligence about customers and other suppliers, specialised product knowledge and updating operational information are increasingly becoming more and more important inputs. These inputs must be produced, nurtured, managed, preserved and, above all, effectively utilised.
A major weakness of many manufacturing units in Pakistan is that they are family owned and managed. At the initial stages, when the companies are small, such organisational structure may be efficient. But it becomes increasingly inefficient as the companies grow. Currently, another important challenge for the large textiles units of Pakistan lies in the management ranks. Middle management in many of the units is often thin, senior management overloaded and decision making too centralised in the hands of a just few. The evolution from “ownership control” to “management control” often helps accelerate the change needed to keep pace with the dynamics of the market. Producers in Pakistan able to change their existing management culture accordingly will have a better chance of success in the next century.
Since the 1970s, world cotton prices have been very volatile. Trying to remain competitive in world market has already been a challenge for Pakistan’s cotton and textiles industries. Managing price risk has been extremely difficult for both mills and cotton growers. Future markets, used by many developed and developing countries’ competitors, are largely unfamiliar to Pakistan’s producers. If competitors are benefiting from the ability to manage price risk, it will be difficult to survive without being involved. The instrument of options provides an effective method of managing risk. Apart from their unfamiliarity, Pakistan’s cotton and textiles producers have been hesitant to use options because of their high perceived costs. However, options spreads can be used to reduce the cost.19
Finally, unless the textiles industry learns to share profit with shareholders, scrip prices are not going to improve. To achieve higher capacity utilisation and
19For example, protecting against a downward move in prices might cost 4 cents for protection from the current price level. If the purchaser of the options wants to protect against a price decline of 6–9 cents, but is willing to risk prices falling even lower, he could sell a cheaper PUT against his previous long PUT. This might reduce his cost to only one cent, while protecting him against the first 6–9 cents of price decline [see Miller and VanHoose (1993)].

Textiles Sector
37:4, 611
quality improvement, industry must reinvest its earnings in textiles for BMR rather than in other sectors.
2. Government policies which create an environment for industry to invest in upgradtion/modernisation and expansion, especially with a view to improve export focus, need to be formulated. Given that there is greater value addition in fabrics and garments, the Government policy must recognise the need for enhancing their finishing quality to the market competitive levels. To accelerate the implementation of ISO 9000 and ISO 14000, the Government should provide consistent incentive packages to the export oriented industries. Both the Government and exporters are responsible for lower unit price realisation of Pakistan’s textiles exports in the past. The quota policy has always been remained tilted towards volume exporters against those who make efforts to improve quality standard. During the transition period, the Government still has a good chance to encourage the exporters in achieving higher unit price realisation through quality improvement.
A Textiles University, jointly funded by textiles producers and the Government, needs to be established for upgrading technical knowledge and efficiency at all levels of production. Further, a National Textiles Commission, consisting of textiles producers and market experts, should be set up to examine the most important global trends during the first decade of the next century. Given that even the best financial and business strategies get it wrong a lot of time, the commission should particularly focus its attention on predicting when and how significant changes might occur. Without such preparations, life for textiles producers is not going to be easy in the coming years.20
3. Mutual consistency of fiscal, monetary and trade policies is the most important prerequisite to increase the efficiency of all economic sectors, including textiles. However, this is a necessary but not sufficient condition. What is additionally required is a reduction in bureaucracy which currently hampers efficiency at all levels. Specifically important are custom clearance formalities and sales tax refunds21 and duty drawbacks.
20There are even suggestions for ‘Ministry of Textiles’. Currently, day to day affairs of the textiles sector are dealt by different ministries, including Ministry of Commerce, Ministry of Finance and some line departments. The creation of ‘Ministry of Finance’ can provide a ‘One Window Operation’ facility and will certainly improve the performance. Pakistan’s two major South Asian competitors, India and Bangladesh, already have Ministry of Textiles in operation.
21The Pakistan Government has imposed sales tax on cotton at ginned stage. Since more than 90 percent of the cotton either in raw form or in the shape of yarn, fabric or ready made garments is exported, it means that the tax paid has to be refunded. On the one hand, net result of this futile exercise is the administrative cost for collection and refund of the tax, on the other it further adds to the liquidity problem of the textiles sector due to delays in settlement of claims.

Naheed Zia Khan
37:4, 612
Further, road and rail transport corridors and networks must be improved to reduce transport cost and lead time. Inadequate and inefficient transport, storage facilities and telecommunication act everywhere to limit the supply side response. Currently, these problems abound in Pakistan. But the problem is especially serious at the institutional level. Institutions and their rules have a very strong bearing on an economy’s efficiency and growth prospects, a point which is made very forcefully and convincingly by North (1990). At the institutional level, Pakistan lacks a transparent legal and regulatory framework, including company and bankruptcy laws and investment codes. As a matter of fact, the absence of an effective institutional network which promotes entrepreneurial, managerial, technical and marketing skills has constrained to a large extent the value addition growth in Pakistan’s T&C sector.
4. This category specifically includes: addressing the problem of regional and financial instability as a result of Pakistan having gone nuclear; efforts to restore the international economic and political relations; adjusting the value of Pakistani Rupee in relation to the currencies of other developing countries’ competitors; addressing the anti-dumping duties on a tripartite base which requires dialogue between producers’ representatives, Pakistan Government and duty imposing importing countries.22
5. This includes, first of all, full implementation of WTO agreements by all signatories. Even when this prerequisite is met, there are certain crucial factors which are going to be beyond control of Pakistan’s and other developing countries’ textiles producers. Firstly, even when the Uruguay Round trade liberalisation agreements are fully implemented, trade in T&C would still be highly subject to both direct and “indirect” non-quota
22Pakistan has experienced repeated imposition of provisional anti-dumping duties on unbleached 100 percent cotton. During 1997, the EU imposed anti-dumping duties on the imports of unbleached cotton fabric from Pakistan. The provisional penalty 32.5 percent for non-cooperative companies, firms which did not provide the data of their production and sales costs as required by EU, was later reduced to a definitive 11.1 percent, and the provisional duty of 19.3 percent was lowered to a definitive 10.1 percent on the weighted average for the cooperative companies (See ‘Anti-dumping Duty on Gray Cloth’, PAGE August 10-16 1998). Presently, the Ministry of Commerce and the Ministry of Law do not have experts to defend Pakistani exporter against dumping allegations. The Government and APTMA are forced to hire foreign experts and pay them fees in foreign exchange. It may not be out of context to mention here that the Ministry of Commerce does not even have people for quota negotiations. For a long time, negotiations were conducted by a chartered accountant who had worked as consultant to the Ministry. Even the Textiles Quota Management Directorate does not have the experts in question and had re-employed one of past directors on contract basis after his retirement. The last director general until 1996 was from the DMG group. For decades, the Export Promotion Bureau has been headed by people from civil services groups. Since Pakistan is one of the ten members of WTO’s Textiles Monitoring Body (TMB) to supervise the second stage, 1998–2001, implementation of ATC, now it has a good opportunity to do away with the shortcomings and defend the interests of its textiles producers during the transition period and beyond.

Textiles Sector
37:4, 613
barriers. It appears that, apart from post-Uruguay Round tariff peaks which are going to escalate with the level of product’s processing,23 restrictive measures such as anti-dumping actions are going to be increasingly used to restrict imports from developing countries. The number of anti-dumping actions reported to the GATT Secretariat shows a steady rise since 1990 [GATT (1994)]. Further, integration of the T&C sector under GATT system may be replaced by another set of restrictive practices in the next round of trade talks. There are sound reasons behind author’s apprehension that extraneous issues, such as environment, social concern and ambiguous labour standards, will be played up by the developed countries in the next round of trade talks to the extent of achieving explicit deliberations.24
Secondly, another challenge is the risk of being left out of proliferating free trade areas and custom unions. Particularly, NAFTA and EU are continuously growing both in width and depth and now cover virtually all major markets of Pakistan’s T&C exporters. The spokespersons of NAFTA and EU often attempt to camouflage their global trade liberalisation rhetoric by arguing that both developing countries and third countries would benefit from the trade-creating effects of these regional arrangements materialised into the stimulus to growth and thus import demand in the member countries. Although to assess the magnitude and spread of trade diverting effects of NAFTA and EU is beyond the scope of this study, it could be argued that there are reasons to think that diversion effects in T&C will be enormous.25 This could further increase the degree of marginalisation of Pakistan’s T&C exporters who have become accustomed to the protection provided by the quota regime. Thirdly, it is expected that over the next decade the further introduction of micro-controllers (the white-collar micro-processor equivalent of the blue-collar) in textiles machinery will facilitate the shift of T&C manufacturing back
23For details on post-Uruguay Round tariff escalation, see GATT 1994. For the implications of tariff escalation for developing countries’ exports, [see World Bank (1996)].
24As a matter of fact, implicit ruling on these subjects is already provided by the Uruguay Round. On the one hand the Agreement seeks to ensure that technical barriers do not restrict trade, on the other it does recognise the right of countries to protect human, animal and plant life and environment. The Agreement clearly establishes that countries should not be prevented from ensuring that their desired standards meet the levels they consider appropriate.
25The anti-dumping duty imposed by the EU, during 1997, on the imports of unbleached cotton fabric from Pakistan was triggered by the campaign jointly launched by the textiles producers in Greece, Spain, Portugal, France and Italy, because the prices of unbleached cloth they produce were incompetitive, making them unable to capture their own market. MFA dates back to the times when EU was an intermediate, half-functioning common market and the poor relations, Greece, Spain and Portugal, were not even considered to be qualified for its membership. Once MFA’s binding obligation is over, these countries may resort to any measures to protect the interests of their textiles producers within the wide, and continuously expanding, EU market.

Naheed Zia Khan
37:4, 614
to the developed countries [Mello (1997)]. Already, with open-end spinning techniques, shuttle-less looms, multi-phase looms, double-knitting machines, non-woven fabrics and programmed pattern printing comparative advantage seems to be shifting back to developed countries.
Finally, the future evolution of the five most affected countries, South Korea, Malaysia, Thailand, Indonesia and the Philippines, by the on going “Asian crisis” is still uncertain. These SEA countries, including Taiwan and China, are strong competitors of Pakistan’s T&C exports. Although it is still not clear how the slump in the world economy and the on going “Asian crisis” will effect productivity and demand globally, but companies that emerge survivors from the “Asian crisis” will be those that have the management who understands the stakes and is skilled enough to take the calculated risk.
CONCLUSION
Economic projections about the benefits in the next millennium to developing countries from the Uruguay Round generally and from the abolition of MFA specifically should not simply reassure and lull textiles producers and policy makers about a future with many uncertainties. Trade and trade liberalisation do not produce wealth and jobs; they only help in the distribution of demand and jobs. Pakistan’s T&C industry faces in the next millennium both great opportunity and even a greater threat globally for it to survive and grow. Many of the changes that will occur are outside the control of Pakistan and her textiles producers. It is the responsibility of Pakistan’s Government to assist the producers in their effort to prepare themselves for the looming challenge by keeping pace with the market dictates and dynamics. Although Pakistan needs quantum leap, it may have better chances of retaining and eventually increasing its market share even if it succeeds in achieving marginal increases in textiles quality and productivity every year during the transitory period. As the world economy becomes increasingly integrated, external influences have an ever-greater impact on countries’ domestic economies. In reality, the many external and domestic factors that will determine Pakistan’s T&C industry’s performance in the world market do not operate independently. There is a complex interaction, both positive and negative: a factor in one category can interact with others in the same category, and developments in external factors can improve or worsen the effects of domestic factors and vice versa.
Tariff escalation in specific sectors, including T&C, and other non-quota import barriers will continue to be a feature of developed countries’ trade practices in the post-Uruguay Round world of the next century. Given all these challenges, global business success will more likely happen to those who earn it, not to those who fall into it. The competition is getting increasingly fierce and the only selling point is quality at competitive price.

Textiles Sector
37:4, 615
REFERENCES
Altaf, Z. (1989) Pakistani Entrepreneur. London: Groom Helm. Azhar, R. A. (1995) The Uruguay Round and Pakistan’s Exports: Problems and
Prospects. Pakistan Institute of Development Economics, Islamabad, April. Erzan, et al. (1989) Effects of Multifibre Arrangement on Developing Countries: An
Empirical Investigation. In Carl B. Hamilton (ed) Textiles Trade and the Developing Countries: Eliminating the Multifibre Arrangement in the 1990s. Washington, D.C.: World Bank.
GATT (1994) The Results of the Uruguay Round of Multilateral Trade Negotiations. November. (Mimeographed.)
Hirschleifer, J. (1971) The Private and Social Value of Information and the Reward to Incentive Activity. American Economic Review, September.
IMF (1997) International Financial Statistics. Year Book. Iqbal, Z., K. Qureshi, and R. Mahmood (1998) The Underground Economy and Tax
Evasion in Pakistan: A Fresh Assessment. Pakistan Institute of Development Economics, Islamabad. (Research Report No. 158.)
Kazmi, A. A. (1995) The Implications of the Uruguay Round for Pakistan: Government’s Perspective. Pakistan Institute of Development Economics, Islamabad, April.
Khan, A. H. (1995) The Implications of the Uruguay Round for Pakistan. Pakistan Institute of Development Economics, Islamabad, April.
Martin, W., and L. A. Winters (1995) The Uruguay Round-Widening and Deepening the World Trading System. Washington D. C.: World Bank.
Mello, B. D. (1997) Underdevelopment after the Uruguay Round: India. In J. M. Griesgraber and B. G. Gunter (ed) World Trade: Toward Fair and Free Trade in 21st Century. Pluto Press.
Michael, D., and Page S. (1992) Europe: 1992 and the Developing World. Overseas Development Institute.
Miller, R., and VanHoose D. (1993) Modern Money and Banking. McGraw-Hill, Inc. Naqvi, S., and Z. Mahmood (1995) The Uruguay Round Agreement and its
Implications for Developing Countries including Pakistan. Pakistan Institute of Development Economics, Islamabad, April.
North, D. C. (1990) Institutions, Institutional Change and Economic Performance. Cambridge University Press.
Pakistan, Government of (1993) The State of Pakistan’s Foreign Trade, 1992-93. Ministry of Finance, Islamabad, November.
Pakistan, Government of (1998) Economic Survey 1997-98. Islamabad: Finance Division.

Naheed Zia Khan
37:4, 616
Raffaelli, M. (1989) Some Considerations on the Multifibre Arrangement: Past, Present and Future. In Carl B. Hamilton (ed) Textiles Trade and the Developing Countries: Eliminating the Multifibre Arrangement in the 1990s. Washington D.C.: World Bank.
Vernon, R. (1966) International Investment and International Trade in the Product Cycle. Quarterly Journal of Economics, May.
World Bank (1996) Global Economic Prospects and the Developing Countries. WTO (1996) Participation of Developing Countries in World Trade. Committee on
Trade and Development. August. WTO (n.d.) The Agreement on Textiles and Clothing. (Text available on WTO
Website).