Embed Size (px)
Citation preview
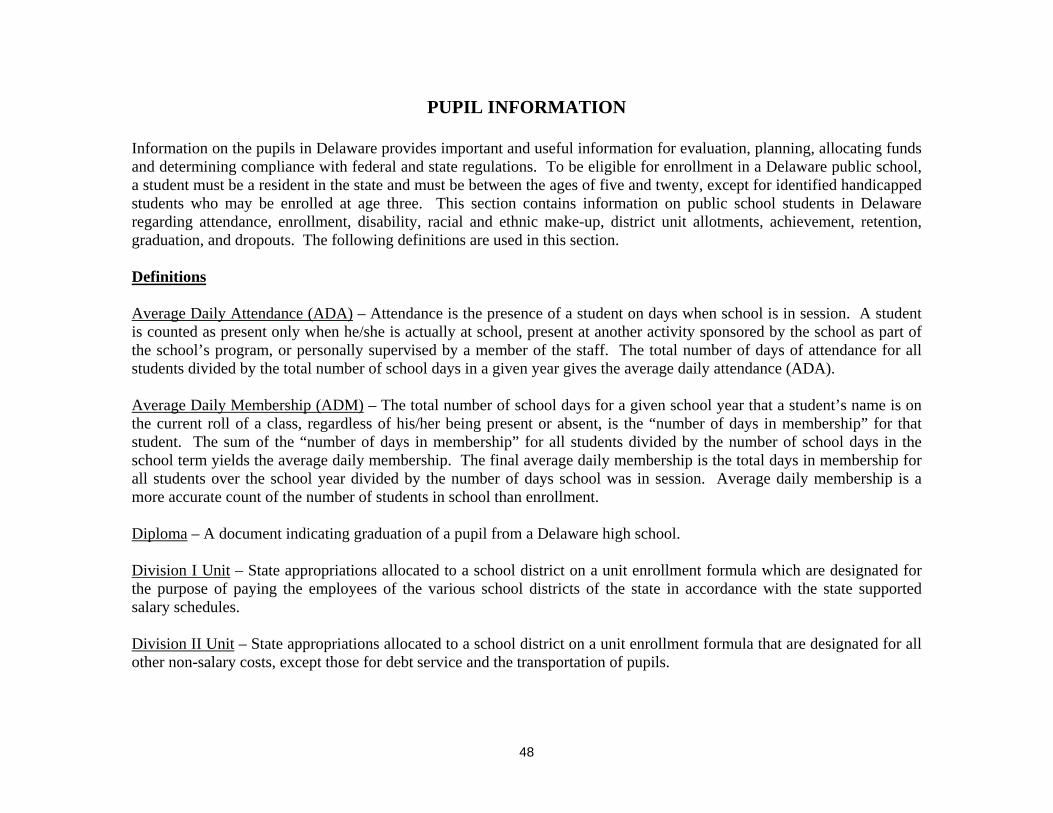
PUPIL INFORMATION
Information on the pupils in Delaware provides important and useful information for evaluation, planning, allocating funds and determining compliance with federal and state regulations. To be eligible for enrollment in a Delaware public school, a student must be a resident in the state and must be between the ages of five and twenty, except for identified handicapped students who may be enrolled at age three. This section contains information on public school students in Delaware regarding attendance, enrollment, disability, racial and ethnic make-up, district unit allotments, achievement, retention, graduation, and dropouts. The following definitions are used in this section. Definitions Average Daily Attendance (ADA) – Attendance is the presence of a student on days when school is in session. A student is counted as present only when he/she is actually at school, present at another activity sponsored by the school as part of the school’s program, or personally supervised by a member of the staff. The total number of days of attendance for all students divided by the total number of school days in a given year gives the average daily attendance (ADA). Average Daily Membership (ADM) – The total number of school days for a given school year that a student’s name is on the current roll of a class, regardless of his/her being present or absent, is the “number of days in membership” for that student. The sum of the “number of days in membership” for all students divided by the number of school days in the school term yields the average daily membership. The final average daily membership is the total days in membership for all students over the school year divided by the number of days school was in session. Average daily membership is a more accurate count of the number of students in school than enrollment. Diploma – A document indicating graduation of a pupil from a Delaware high school. Division I Unit – State appropriations allocated to a school district on a unit enrollment formula which are designated for the purpose of paying the employees of the various school districts of the state in accordance with the state supported salary schedules. Division II Unit – State appropriations allocated to a school district on a unit enrollment formula that are designated for all other non-salary costs, except those for debt service and the transportation of pupils.
48
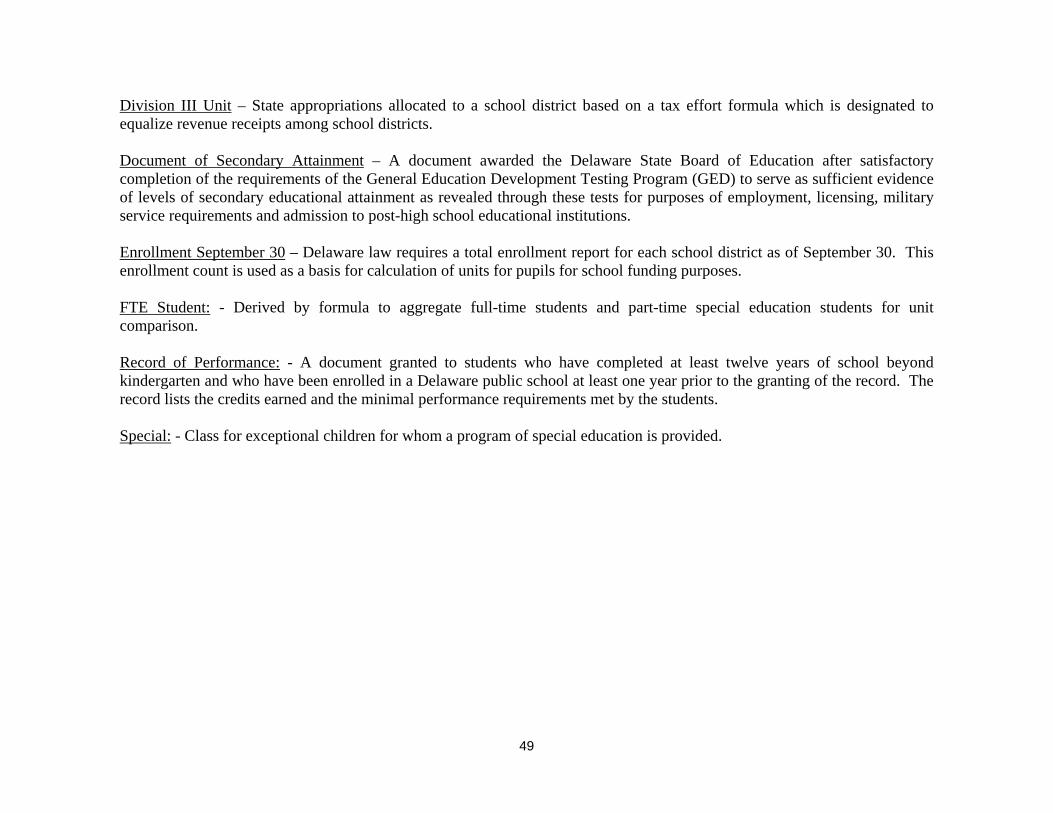
Division III Unit – State appropriations allocated to a school district based on a tax effort formula which is designated to equalize revenue receipts among school districts. Document of Secondary Attainment – A document awarded the Delaware State Board of Education after satisfactory completion of the requirements of the General Education Development Testing Program (GED) to serve as sufficient evidence of levels of secondary educational attainment as revealed through these tests for purposes of employment, licensing, military service requirements and admission to post-high school educational institutions. Enrollment September 30 – Delaware law requires a total enrollment report for each school district as of September 30. This enrollment count is used as a basis for calculation of units for pupils for school funding purposes. FTE Student: - Derived by formula to aggregate full-time students and part-time special education students for unit comparison. Record of Performance: - A document granted to students who have completed at least twelve years of school beyond kindergarten and who have been enrolled in a Delaware public school at least one year prior to the granting of the record. The record lists the credits earned and the minimal performance requirements met by the students. Special: - Class for exceptional children for whom a program of special education is provided.
49
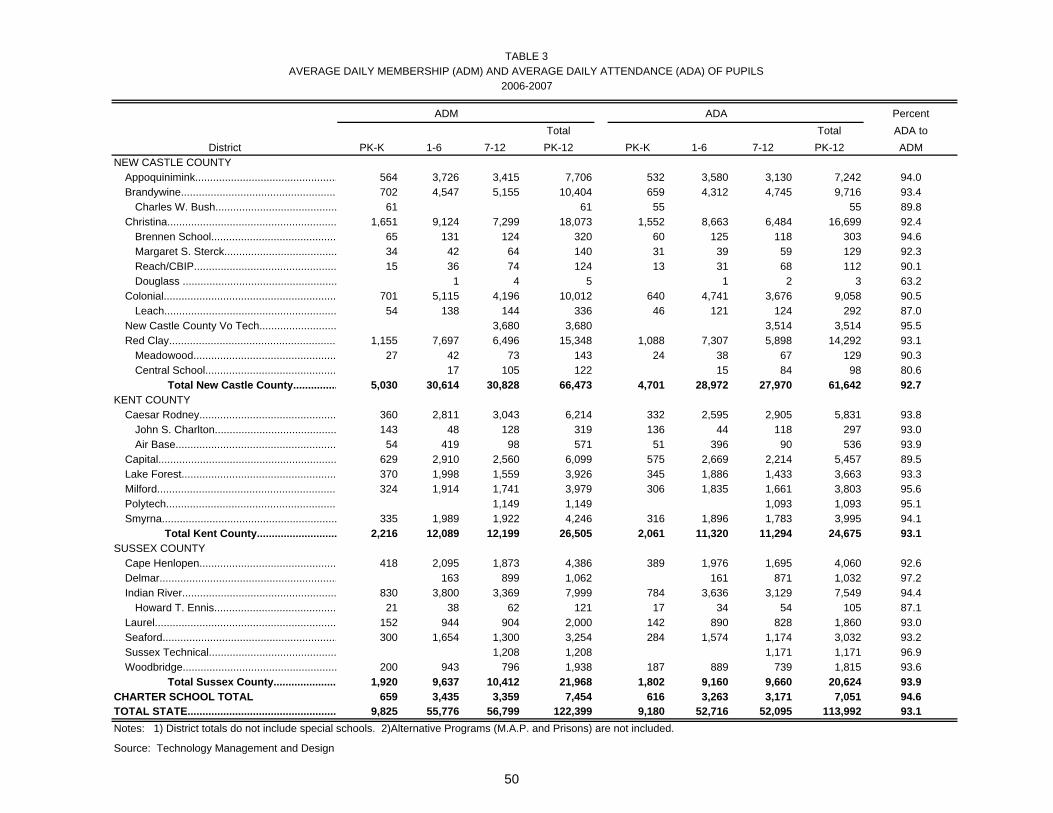
TABLE 3AVERAGE DAILY MEMBERSHIP (ADM) AND AVERAGE DAILY ATTENDANCE (ADA) OF PUPILS
2006-2007
ADM ADA PercentTotal Total ADA to
District PK-K 1-6 7-12 PK-12 PK-K 1-6 7-12 PK-12 ADMNEW CASTLE COUNTY
Appoquinimink................................................ 564 3,726 3,415 7,706 532 3,580 3,130 7,242 94.0Brandywine..................................................... 702 4,547 5,155 10,404 659 4,312 4,745 9,716 93.4
Charles W. Bush......................................... 61 61 55 55 89.8Christina......................................................... 1,651 9,124 7,299 18,073 1,552 8,663 6,484 16,699 92.4
Brennen School.......................................... 65 131 124 320 60 125 118 303 94.6Margaret S. Sterck...................................... 34 42 64 140 31 39 59 129 92.3Reach/CBIP................................................ 15 36 74 124 13 31 68 112 90.1Douglass .................................................... 1 4 5 1 2 3 63.2
Colonial.......................................................... 701 5,115 4,196 10,012 640 4,741 3,676 9,058 90.5Leach.......................................................... 54 138 144 336 46 121 124 292 87.0
New Castle County Vo Tech.......................... 3,680 3,680 3,514 3,514 95.5Red Clay......................................................... 1,155 7,697 6,496 15,348 1,088 7,307 5,898 14,292 93.1
Meadowood................................................ 27 42 73 143 24 38 67 129 90.3Central School............................................ 17 105 122 15 84 98 80.6 Total New Castle County............... 5,030 30,614 30,828 66,473 4,701 28,972 27,970 61,642 92.7
KENT COUNTYCaesar Rodney.............................................. 360 2,811 3,043 6,214 332 2,595 2,905 5,831 93.8
John S. Charlton......................................... 143 48 128 319 136 44 118 297 93.0Air Base...................................................... 54 419 98 571 51 396 90 536 93.9
Capital............................................................ 629 2,910 2,560 6,099 575 2,669 2,214 5,457 89.5Lake Forest.................................................... 370 1,998 1,559 3,926 345 1,886 1,433 3,663 93.3Milford............................................................. 324 1,914 1,741 3,979 306 1,835 1,661 3,803 95.6Polytech.......................................................... 1,149 1,149 1,093 1,093 95.1Smyrna........................................................... 335 1,989 1,922 4,246 316 1,896 1,783 3,995 94.1
Total Kent County........................... 2,216 12,089 12,199 26,505 2,061 11,320 11,294 24,675 93.1SUSSEX COUNTY
Cape Henlopen.............................................. 418 2,095 1,873 4,386 389 1,976 1,695 4,060 92.6Delmar............................................................ 163 899 1,062 161 871 1,032 97.2Indian River.................................................... 830 3,800 3,369 7,999 784 3,636 3,129 7,549 94.4
Howard T. Ennis......................................... 21 38 62 121 17 34 54 105 87.1Laurel............................................................. 152 944 904 2,000 142 890 828 1,860 93.0Seaford........................................................... 300 1,654 1,300 3,254 284 1,574 1,174 3,032 93.2Sussex Technical........................................... 1,208 1,208 1,171 1,171 96.9Woodbridge.................................................... 200 943 796 1,938 187 889 739 1,815 93.6
Total Sussex County..................... 1,920 9,637 10,412 21,968 1,802 9,160 9,660 20,624 93.9CHARTER SCHOOL TOTAL 659 3,435 3,359 7,454 616 3,263 3,171 7,051 94.6TOTAL STATE.................................................. 9,825 55,776 56,799 122,399 9,180 52,716 52,095 113,992 93.1Notes: 1) District totals do not include special schools. 2)Alternative Programs (M.A.P. and Prisons) are not included.
Source: Technology Management and Design
50

TABLE 4ENROLLMENT BY GRADE
SUM OF REGULAR, PART-TIME SPECIAL AND FULL-TIME SPECIAL STUDENTS
SEPTEMBER 30, 2006DISTRICT PK K 1 2 3 4 5 6 PK-6 7 8 9 10 11 12 7-12 TOTALSNEW CASTLE COUNTY
Appoquinimink School DistrictRegular 0 491 568 586 513 565 531 572 3,826 552 536 471 514 470 420 2,963 6,789Part-Time Special 0 0 0 0 4 4 2 6 16 1 6 5 5 6 9 32 48Full-Time Special 10 19 42 41 42 46 48 64 312 63 59 38 58 45 30 293 605
Total by Grade 10 510 610 627 559 615 581 642 4,154 616 601 514 577 521 459 3,288 7,442Special Schools 0 0 0 0 0 0 0 0 0 0 0 0 0 0 0 0 0
Appoquinimink ILC(Reg) 0 0 0 0 0 0 0 0 0 0 0 0 0 0 0 0 0Appoquinimink ILC(P/T) 0 0 0 0 0 0 0 0 0 0 0 0 0 0 3 3 3Appoquinimink ILC(F/T) 15 15 7 9 9 8 11 8 82 15 13 12 7 7 7 61 143Total by Grade 15 15 7 9 9 8 11 8 82 15 13 12 7 7 10 64 146
Total Appoquinimink School District 0 0 0 0 0 0 0 0 0 0 0 0 0 0 0 0 0Regular 0 491 568 586 513 565 531 572 3,826 552 536 471 514 470 420 2,963 6,789Part-Time Special 0 0 0 0 4 4 2 6 16 1 6 5 5 6 12 35 51Full-Time Special 25 34 49 50 51 54 59 72 394 78 72 50 65 52 37 354 748
Total by Grade 25 525 617 636 568 623 592 650 4,236 631 614 526 584 528 469 3,352 7,588Brandywine School District
Regular 0 632 722 700 675 648 652 681 4,710 758 765 925 761 691 667 4,567 9,277Part-Time Special 0 3 4 9 9 9 3 2 39 3 17 45 21 26 30 142 181Full-Time Special 8 40 40 60 78 71 69 93 459 86 77 80 27 35 53 358 817
Total by Grade 8 675 766 769 762 728 724 776 5,208 847 859 1,050 809 752 750 5,067 10,275Special Schools
Brandywine ILC(Reg) 0 0 0 0 0 0 0 0 0 0 0 0 0 0 0 0 0Brandywine ILC(P/T) 0 0 0 0 0 0 0 0 0 0 0 0 0 0 0 0 0Brandywine ILC(F/T) 0 0 0 0 0 0 0 0 0 0 0 0 0 0 0 0 0Bush School(Reg) 0 0 0 0 0 0 0 0 0 0 0 0 0 0 0 0 0Bush School(P/T) 0 0 0 0 0 0 0 0 0 0 0 0 0 0 0 0 0Bush School(F/T) 46 0 0 0 0 0 0 0 46 0 0 0 0 0 0 0 46duPont Hospital School(Reg) 0 0 0 0 0 0 0 0 0 0 0 0 0 0 0 0 0duPont Hospital School(P/T) 0 0 0 0 0 0 0 0 0 0 0 0 0 0 0 0 0duPont Hospital School(F/T) 0 0 0 0 0 0 0 0 0 0 0 0 0 0 0 0 0
Total by Grade 46 0 0 0 0 0 0 0 46 0 0 0 0 0 0 0 46Total Brandywine School District 0 0 0 0 0 0 0 0 0 0 0 0 0 0 0 0 0
Regular 0 632 722 700 675 648 652 681 4,710 758 765 925 761 691 667 4,567 9,277Part-Time Special 0 3 4 9 9 9 3 2 39 3 17 45 21 26 30 142 181Full-Time Special 54 40 40 60 78 71 69 93 505 86 77 80 27 35 53 358 863
Total by Grade 54 675 766 769 762 728 724 776 5,254 847 859 1,050 809 752 750 5,067 10,321(Table continued on following page)
51

TABLE 4ENROLLMENT BY GRADE
SUM OF REGULAR, PART-TIME SPECIAL AND FULL-TIME SPECIAL STUDENTS
SEPTEMBER 30, 2006DISTRICT PK K 1 2 3 4 5 6 PK-6 7 8 9 10 11 12 7-12 TOTALS
Christina School DistrictRegular 0 1,155 1,560 1,367 1,387 1,349 1,120 1,055 8,993 1,229 1,385 1,156 1,195 843 824 6,632 15,625Part-Time Special 0 10 1 1 4 4 3 8 31 1 3 1 10 3 17 35 66Full-Time Special 0 70 128 130 131 169 124 148 900 149 129 104 109 51 25 567 1,467
Total by Grade 0 1,235 1,689 1,498 1,522 1,522 1,247 1,211 9,924 1,379 1,517 1,261 1,314 897 866 7,234 17,158Special Schools
Alternative Programs(Reg) 0 0 0 1 1 4 8 3 17 8 15 18 9 1 2 53 70Alternative Programs(P/T) 0 0 0 0 0 0 0 2 2 0 0 2 1 2 0 5 7Alternative Programs(F/T) 0 0 0 0 2 1 5 2 10 3 10 2 4 0 0 19 29Christina ILC(Reg) 0 0 0 0 0 0 0 0 0 0 0 0 0 0 0 0 0Christina ILC(P/T) 0 0 0 1 0 0 0 0 1 0 1 1 0 0 0 2 3Christina ILC(F/T) 40 21 21 24 18 24 21 22 191 18 16 21 13 12 44 124 315Del Autism Prog (DAP)(Reg) 0 5 0 0 0 0 0 1 6 0 0 0 0 0 0 0 6Del Autism Prog (DAP)(P/T) 0 0 0 0 0 0 0 0 0 0 0 0 0 0 4 4 4Del Autism Prog (DAP)(F/T) 74 10 34 32 38 65 45 50 348 50 69 70 58 25 27 299 647REACH/CBIP(Reg) 0 0 0 2 0 0 0 0 2 0 0 0 0 0 0 0 2REACH/CBIP(P/T) 0 0 0 0 0 0 0 0 0 0 0 0 0 0 0 0 0REACH/CBIP(F/T) 8 6 9 4 2 11 5 5 50 8 9 11 11 30 5 74 124Sterck School(Reg) 0 0 0 0 0 0 0 0 0 0 0 0 0 0 0 0 0Sterck School(P/T) 0 0 0 0 0 0 0 0 0 0 0 0 0 0 0 0 0Sterck School(F/T) 29 3 5 10 5 7 4 8 71 9 5 14 11 14 6 59 130
Total by Grade 151 45 69 74 66 112 88 93 698 96 125 139 107 84 88 639 1,337Total Christina School District 0 0 0 0 0 0 0 0 0 0 0 0 0 0 0 0 0
Regular 0 1,160 1,560 1,370 1,388 1,353 1,128 1,059 9,018 1,237 1,400 1,174 1,204 844 826 6,685 15,703Part-Time Special 0 10 1 2 4 4 3 10 34 1 4 4 11 5 21 46 80Full-Time Special 151 110 197 200 196 277 204 235 1,570 237 238 222 206 132 107 1,142 2,712
Total by Grade 151 1,280 1,758 1,572 1,588 1,634 1,335 1,304 10,622 1,475 1,642 1,400 1,421 981 954 7,873 18,495Colonial School District
Regular 0 621 806 768 726 734 792 765 5,212 831 893 636 533 437 410 3,740 8,952Part-Time Special 0 0 14 16 17 18 19 36 120 30 31 18 6 12 25 122 242Full-Time Special 0 30 42 54 83 87 107 84 487 95 82 110 63 49 31 430 917
Total by Grade 0 651 862 838 826 839 918 885 5,819 956 1,006 764 602 498 466 4,292 10,111Special Schools
McCullough ILC(Reg) 0 0 0 0 0 0 0 0 0 0 0 0 0 0 0 0 0 McCullough ILC(P/T) 0 0 0 0 0 0 0 0 0 0 0 0 0 0 0 0 0 McCullough ILC(F/T) 37 15 3 7 5 5 3 4 79 10 11 16 13 8 5 63 142
(Table continued on following page)
52

TABLE 4ENROLLMENT BY GRADE
SUM OF REGULAR, PART-TIME SPECIAL AND FULL-TIME SPECIAL STUDENTS
SEPTEMBER 30, 2006DISTRICT PK K 1 2 3 4 5 6 PK-6 7 8 9 10 11 12 7-12 TOTALS
Leach School(Reg) 0 0 0 0 0 0 0 0 0 0 0 0 0 0 0 0 0Leach School(P/T) 0 0 0 0 0 0 0 0 0 0 0 0 0 0 0 0 0Leach School(F/T) 41 5 6 3 5 3 3 3 69 5 3 7 3 20 1 39 108
Total by Grade 78 20 9 10 10 8 6 7 148 15 14 23 16 28 6 102 250Total Colonial School District 0 0 0 0 0 0 0 0 0 0 0 0 0 0 0 0 0
Regular 0 621 806 768 726 734 792 765 5,212 831 893 636 533 437 410 3,740 8,952Part-Time Special 0 0 14 16 17 18 19 36 120 30 31 18 6 12 25 122 242Full-Time Special 78 50 51 64 93 95 113 91 635 110 96 133 79 77 37 532 1,167
Total by Grade 78 671 871 848 836 847 924 892 5,967 971 1,020 787 618 526 472 4,394 10,361Red Clay Consolidated School District
Regular 0 1,074 1,231 1,150 1,192 1,017 1,132 1,076 7,872 1,156 1,286 1,083 987 713 580 5,805 13,677Part-Time Special 0 13 10 26 33 34 37 41 194 28 28 48 18 28 21 171 365Full-Time Special 0 7 36 77 91 115 116 107 549 115 115 112 75 49 22 488 1,037
Total by Grade 0 1,094 1,277 1,253 1,316 1,166 1,285 1,224 8,615 1,299 1,429 1,243 1,080 790 623 6,464 15,079Special Schools
Community Sch(Reg) 0 0 0 0 0 0 0 0 0 3 7 9 9 4 6 38 38Community Sch(P/T) 0 0 0 0 0 0 0 0 0 0 0 0 0 0 0 0 0Community Sch(F/T) 0 0 0 0 0 0 0 0 0 0 0 0 0 0 0 0 0First State School(Reg) 0 0 0 0 0 0 0 0 0 0 0 0 0 0 0 0 0First State School(P/T) 0 0 0 0 0 0 0 0 0 0 0 0 0 0 0 0 0First State School(F/T) 0 1 0 0 0 1 0 2 4 4 4 1 1 2 0 12 16Meadowood Program(Reg) 0 0 0 0 0 0 0 0 0 0 0 0 0 0 0 0 0Meadowood Program(P/T) 0 0 0 0 0 0 0 0 0 0 0 0 0 0 0 0 0Meadowood Program(F/T) 19 8 8 8 9 5 7 6 70 13 9 9 10 8 28 77 147PACE/Telegraph Road ILC(Reg) 0 0 0 0 0 0 0 0 0 0 0 0 0 0 0 0 0PACE/Telegraph Road ILC(P/T) 0 0 0 0 0 0 0 0 0 0 0 0 0 0 0 0 0PACE/Telegraph Road ILC(F/T) 30 28 26 32 34 34 23 0 207 0 0 0 0 0 0 0 207Richardson Park lrn Centr ILC(Reg) 0 0 0 0 0 0 0 0 0 0 0 0 0 0 0 0 0Richardson Park lrn Centr ILC(P/T) 0 0 0 0 0 0 0 0 0 0 0 0 0 0 0 0 0Richardson Park lrn Centr ILC(F/T) 0 0 0 0 0 0 0 16 16 13 9 19 14 18 18 91 107
Total by Grade 49 37 34 40 43 40 30 24 297 33 29 38 34 32 52 218 515Total Red Clay Consolidated School District 0 0 0 0 0 0 0 0 0 0 0 0 0 0 0 0 0
Regular 0 1,074 1,231 1,150 1,192 1,017 1,132 1,076 7,872 1,159 1,293 1,092 996 717 586 5,843 13,715Part-Time Special 0 13 10 26 33 34 37 41 194 28 28 48 18 28 21 171 365Full-Time Special 49 44 70 117 134 155 146 131 846 145 137 141 100 77 68 668 1,514
Total by Grade 49 1,131 1,311 1,293 1,359 1,206 1,315 1,248 8,912 1,332 1,458 1,281 1,114 822 675 6,682 15,594(Table continued on following page)
53

TABLE 4ENROLLMENT BY GRADE
SUM OF REGULAR, PART-TIME SPECIAL AND FULL-TIME SPECIAL STUDENTS
SEPTEMBER 30, 2006DISTRICT PK K 1 2 3 4 5 6 PK-6 7 8 9 10 11 12 7-12 TOTALS
New Castle County Vo-Tech School DistrictRegular 0 0 0 0 0 0 0 0 0 0 1 1,078 810 748 667 3,304 3,304Part-Time Special 0 0 0 0 0 0 0 0 0 0 0 12 31 42 44 129 129Full-Time Special 0 0 0 0 0 0 0 0 0 0 0 118 79 68 62 327 327
Total by Grade 0 0 0 0 0 0 0 0 0 0 1 1,208 920 858 773 3,760 3,760Special Schools
DelCastle ILC(Reg) 0 0 0 0 0 0 0 0 0 0 0 0 0 0 0 0 0DelCastle ILC(P/T) 0 0 0 0 0 0 0 0 0 0 0 0 0 0 0 0 0DelCastle ILC(F/T) 0 0 0 0 0 0 0 0 0 0 0 5 12 7 10 34 34
Total by Grade 0 0 0 0 0 0 0 0 0 0 0 5 12 7 10 34 34Total New Castle County Vo-Tech School Di 0 0 0 0 0 0 0 0 0 0 0 0 0 0 0 0 0
Regular 0 0 0 0 0 0 0 0 0 0 1 1,078 810 748 667 3,304 3,304Part-Time Special 0 0 0 0 0 0 0 0 0 0 0 12 31 42 44 129 129Full-Time Special 0 0 0 0 0 0 0 0 0 0 0 123 91 75 72 361 361
Total by Grade 0 0 0 0 0 0 0 0 0 0 1 1,213 932 865 783 3,794 3,794
Charter School of WilmingtonRegular 0 0 0 0 0 0 0 0 0 0 0 242 227 252 227 948 948Part-Time Special 0 0 0 0 0 0 0 0 0 0 0 0 0 0 0 0 0Full-Time Special 0 0 0 0 0 0 0 0 0 0 0 0 0 0 0 0 0
Total by Grade 0 0 0 0 0 0 0 0 0 0 0 242 227 252 227 948 948Delaware Military Academy
Regular 0 0 0 0 0 0 0 0 0 0 0 142 134 120 103 499 499Part-Time Special 0 0 0 0 0 0 0 0 0 0 0 0 0 0 0 0 0Full-Time Special 0 0 0 0 0 0 0 0 0 0 0 5 2 3 9 19 19
Total by Grade 0 0 0 0 0 0 0 0 0 0 0 147 136 123 112 518 518
East Side Charter SchoolRegular 0 49 52 38 30 17 9 20 215 4 14 0 0 0 0 18 233Part-Time Special 0 0 0 0 0 0 0 0 0 0 0 0 0 0 0 0 0Full-Time Special 0 0 1 1 1 3 4 1 11 3 1 0 0 0 0 4 15
Total by Grade 0 49 53 39 31 20 13 21 226 7 15 0 0 0 0 22 248
Family Foundation AcademyRegular 0 0 81 70 62 0 0 0 213 0 0 0 0 0 0 0 213Part-Time Special 0 0 0 0 3 0 0 0 3 0 0 0 0 0 0 0 3Full-Time Special 0 0 3 7 4 0 0 0 14 0 0 0 0 0 0 0 14
Total by Grade 0 0 84 77 69 0 0 0 230 0 0 0 0 0 0 0 230(Table continued on following page)
54

TABLE 4ENROLLMENT BY GRADE
SUM OF REGULAR, PART-TIME SPECIAL AND FULL-TIME SPECIAL STUDENTS
SEPTEMBER 30, 2006DISTRICT PK K 1 2 3 4 5 6 PK-6 7 8 9 10 11 12 7-12 TOTALS
Kuumba Academy Charter SchoolRegular 0 51 42 34 46 32 33 0 238 0 0 0 0 0 0 0 238Part-Time Special 0 0 0 0 0 0 0 0 0 0 0 0 0 0 0 0 0Full-Time Special 0 0 3 2 3 4 5 0 17 0 0 0 0 0 0 0 17
Total by Grade 0 51 45 36 49 36 38 0 255 0 0 0 0 0 0 0 255
Marion T. Academy Charter SchoolRegular 0 114 72 63 60 48 33 33 423 30 46 0 0 0 0 76 499Part-Time Special 0 0 0 0 0 0 0 0 0 0 0 0 0 0 0 0 0Full-Time Special 0 0 1 3 3 13 3 8 31 1 5 0 0 0 0 6 37
Total by Grade 0 114 73 66 63 61 36 41 454 31 51 0 0 0 0 82 536
Maurice J. Moyer AcademyRegular 0 0 0 0 0 0 0 108 108 61 0 57 0 0 0 118 226Part-Time Special 0 0 0 0 0 0 0 17 17 9 0 13 0 0 0 22 39Full-Time Special 0 0 0 0 0 0 0 0 0 0 0 0 0 0 0 0 0
Total by Grade 0 0 0 0 0 0 0 125 125 70 0 70 0 0 0 140 265
MOT Charter SchoolRegular 0 72 72 68 67 65 69 64 477 64 70 0 0 0 0 134 611Part-Time Special 0 0 0 0 0 0 0 0 0 0 0 0 0 0 0 0 0Full-Time Special 0 3 3 7 8 10 6 11 48 11 5 0 0 0 0 16 64
Total by Grade 0 75 75 75 75 75 75 75 525 75 75 0 0 0 0 150 675
Newark Charter SchoolRegular 0 0 0 0 0 0 154 157 311 162 149 0 0 0 0 311 622Part-Time Special 0 0 0 0 0 0 0 0 0 0 0 0 0 0 0 0 0Full-Time Special 0 0 0 0 0 0 8 6 14 6 6 0 0 0 0 12 26
Total by Grade 0 0 0 0 0 0 162 163 325 168 155 0 0 0 0 323 648
Odyssey Charter School DistrictRegular 0 71 32 17 0 0 0 0 120 0 0 0 0 0 0 0 120Part-Time Special 0 0 0 0 0 0 0 0 0 0 0 0 0 0 0 0 0Full-Time Special 0 2 0 1 0 0 0 0 3 0 0 0 0 0 0 0 3
Total by Grade 0 73 32 18 0 0 0 0 123 0 0 0 0 0 0 0 123
Pencader Business and FinanceRegular 0 0 0 0 0 0 0 0 0 0 0 219 91 0 0 310 310Part-Time Special 0 0 0 0 0 0 0 0 0 0 0 0 0 0 0 0 0Full-Time Special 0 0 0 0 0 0 0 0 0 0 0 12 4 0 0 16 16
Total by Grade 0 0 0 0 0 0 0 0 0 0 0 231 95 0 0 326 326(Table continued on following page)
55

TABLE 4ENROLLMENT BY GRADE
SUM OF REGULAR, PART-TIME SPECIAL AND FULL-TIME SPECIAL STUDENTS
SEPTEMBER 30, 2006DISTRICT PK K 1 2 3 4 5 6 PK-6 7 8 9 10 11 12 7-12 TOTALS
Thomas Edison Charter SchoolRegular 0 134 122 119 97 82 65 64 683 57 57 0 0 0 0 114 797Part-Time Special 0 0 0 0 0 0 0 0 0 0 0 0 0 0 0 0 0Full-Time Special 0 2 3 0 8 3 7 9 32 6 7 0 0 0 0 13 45
Total by Grade 0 136 125 119 105 85 72 73 715 63 64 0 0 0 0 127 842
TOTAL NEW CASTLE COUNTYRegular 0 4,469 5,360 4,983 4,856 4,561 4,598 4,599 33,426 4,915 5,224 6,036 5,270 4,279 3,906 29,630 63,056Part-Time Special 0 26 29 53 70 69 64 112 423 72 86 145 92 119 153 667 1,090Full-Time Special 357 285 421 512 579 685 624 657 4,120 683 644 766 574 451 383 3,501 7,621
Total by Grade 357 4,780 5,810 5,548 5,505 5,315 5,286 5,368 37,969 5,670 5,954 6,947 5,936 4,849 4,442 33,798 71,767
KENT COUNTYCaesar Rodney School District
Regular 0 347 403 437 438 417 428 402 2,872 504 497 496 425 373 317 2,612 5,484Part-Time Special 0 0 2 3 3 8 12 7 35 3 6 13 2 9 14 47 82Full-Time Special 9 3 23 25 49 51 54 67 281 63 56 115 21 37 21 313 594
Total by Grade 9 350 428 465 490 476 494 476 3,188 570 559 624 448 419 352 2,972 6,160Special Schools
Charlton School(Reg) 0 0 0 0 0 0 0 0 0 0 0 0 0 0 0 0 0Charlton School(P/T) 0 0 0 0 0 0 0 0 0 0 0 0 0 0 0 0 0Charlton School(F/T) 29 9 4 12 8 8 9 12 91 19 18 15 12 12 51 127 218Kent Elementary ILC(Reg) 0 0 0 0 0 0 0 0 0 0 0 0 0 0 0 0 0Kent Elementary ILC(P/T) 0 0 0 0 0 0 0 0 0 0 0 0 0 0 0 0 0Kent Elementary ILC(F/T) 0 1 6 9 10 11 15 0 52 0 0 0 0 0 0 0 52Kent Middle Sch ILC(Reg) 0 0 0 0 0 0 0 0 0 0 0 0 0 0 0 0 0Kent Middle Sch ILC(P/T) 0 0 0 0 0 0 0 0 0 0 0 0 0 0 0 0 0Kent Middle Sch ILC(F/T) 0 26 7 5 5 5 7 29 84 21 26 5 0 1 0 53 137
Total by Grade 29 36 17 26 23 24 31 41 227 40 44 20 12 13 51 180 407Dover Air Force Base
Regular 0 41 53 58 37 30 36 28 283 18 25 19 20 10 9 101 384Part-Time Special 0 0 0 0 1 1 1 4 7 3 6 2 0 0 1 12 19Full-Time Special 0 0 1 2 4 3 0 0 10 0 0 7 0 1 0 8 18
Total by Grade 0 41 54 60 42 34 37 32 300 21 31 28 20 11 10 121 421Total Caesar Rodney School District
Regular 0 388 456 495 475 447 464 430 3,155 522 522 515 445 383 326 2,713 5,868Part-Time Special 0 0 2 3 4 9 13 11 42 6 12 15 2 9 15 59 101Full-Time Special 38 39 41 53 76 78 85 108 518 103 100 142 33 51 72 501 1,019
Total by Grade 38 427 499 551 555 534 562 549 3,715 631 634 672 480 443 413 3,273 6,988(Table continued on following page)
56

TABLE 4ENROLLMENT BY GRADE
SUM OF REGULAR, PART-TIME SPECIAL AND FULL-TIME SPECIAL STUDENTS
SEPTEMBER 30, 2006DISTRICT PK K 1 2 3 4 5 6 PK-6 7 8 9 10 11 12 7-12 TOTALS
Capital School DistrictRegular 0 531 521 446 399 374 355 327 2,953 421 414 419 340 289 282 2,165 5,118Part-Time Special 0 0 0 0 0 0 0 0 0 0 1 2 4 3 13 23 23Full-Time Special 28 33 33 56 63 90 71 87 461 82 71 72 37 32 5 299 760
Total by Grade 28 564 554 502 462 464 426 414 3,414 503 486 493 381 324 300 2,487 5,901Special Schools
Capital ILC(Reg) 0 0 0 0 0 0 0 0 0 0 0 0 0 0 0 0 0Capital ILC(P/T) 0 0 0 0 0 0 0 0 0 0 0 0 0 0 0 0 0Capital ILC(F/T) 0 1 3 1 10 4 7 6 32 17 9 14 3 7 6 56 88Kent County Comm(Reg) 0 0 0 0 0 0 0 0 0 0 0 0 0 0 0 0 0Kent County Comm(P/T) 0 0 0 0 0 0 0 0 0 0 0 0 0 0 0 0 0Kent County Comm(F/T) 23 9 6 4 8 2 5 5 62 1 6 3 2 4 11 27 89Kent Secondary ILC(Reg) 0 0 0 0 0 0 0 0 0 0 0 0 0 0 0 0 0Kent Secondary ILC(P/T) 0 0 0 0 0 0 0 0 0 0 0 0 0 0 0 0 0Kent Secondary ILC(F/T) 0 0 0 0 0 0 0 0 0 0 0 24 12 9 5 50 50
Total by Grade 23 10 9 5 18 6 12 11 94 18 15 41 17 20 22 133 227Total Capital School District
Regular 0 531 521 446 399 374 355 327 2,953 421 414 419 340 289 282 2,165 5,118Part-Time Special 0 0 0 0 0 0 0 0 0 0 1 2 4 3 13 23 23Full-Time Special 51 43 42 61 81 96 83 98 555 100 86 113 54 52 27 432 987
Total by Grade 51 574 563 507 480 470 438 425 3,508 521 501 534 398 344 322 2,620 6,128
Lake Forest School DistrictRegular 0 295 339 287 271 278 286 287 2,043 274 285 288 195 160 156 1,358 3,401Part-Time Special 0 0 0 0 0 0 0 0 0 2 2 4 3 3 11 25 25Full-Time Special 31 29 25 32 51 45 43 33 289 41 38 50 27 28 9 193 482
Total by Grade 31 324 364 319 322 323 329 320 2,332 317 325 342 225 191 176 1,576 3,908Special Schools
Lake Forest ILC(Reg) 0 0 0 0 0 0 0 0 0 0 0 0 0 0 0 0 0Lake Forest ILC(P/T) 0 0 0 0 0 0 0 0 0 0 0 0 0 0 0 0 0Lake Forest ILC(F/T) 0 0 0 0 0 0 0 1 1 4 3 5 0 0 0 12 13Low Incident Prog(Reg) 0 0 0 0 0 0 0 0 0 0 0 0 0 0 0 0 0Low Incident Prog(P/T) 0 0 0 0 0 0 0 0 0 0 0 0 0 0 0 0 0Low Incident Prog(F/T) 0 0 0 0 0 0 0 0 0 0 0 0 0 0 0 0 0
Total by Grade 0 0 0 0 0 0 0 1 1 4 3 5 0 0 0 12 13(Table continued on following page)
57
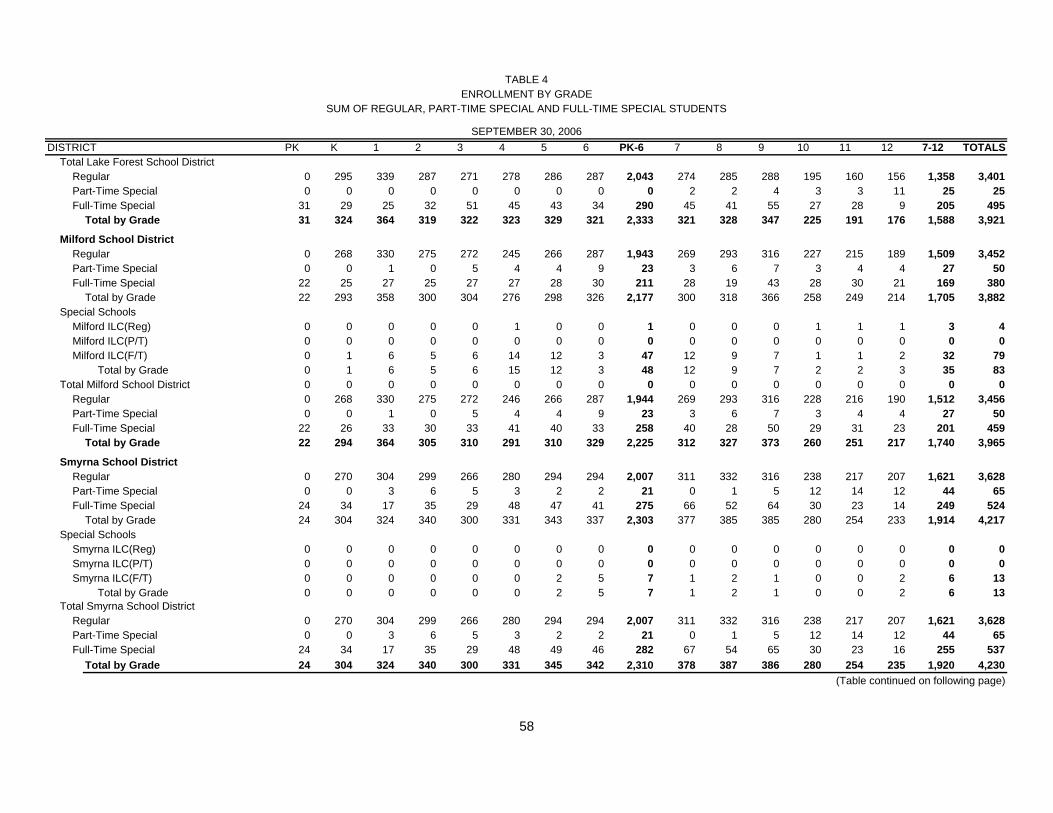
TABLE 4ENROLLMENT BY GRADE
SUM OF REGULAR, PART-TIME SPECIAL AND FULL-TIME SPECIAL STUDENTS
SEPTEMBER 30, 2006DISTRICT PK K 1 2 3 4 5 6 PK-6 7 8 9 10 11 12 7-12 TOTALS
Total Lake Forest School DistrictRegular 0 295 339 287 271 278 286 287 2,043 274 285 288 195 160 156 1,358 3,401Part-Time Special 0 0 0 0 0 0 0 0 0 2 2 4 3 3 11 25 25Full-Time Special 31 29 25 32 51 45 43 34 290 45 41 55 27 28 9 205 495
Total by Grade 31 324 364 319 322 323 329 321 2,333 321 328 347 225 191 176 1,588 3,921
Milford School DistrictRegular 0 268 330 275 272 245 266 287 1,943 269 293 316 227 215 189 1,509 3,452Part-Time Special 0 0 1 0 5 4 4 9 23 3 6 7 3 4 4 27 50Full-Time Special 22 25 27 25 27 27 28 30 211 28 19 43 28 30 21 169 380
Total by Grade 22 293 358 300 304 276 298 326 2,177 300 318 366 258 249 214 1,705 3,882Special Schools
Milford ILC(Reg) 0 0 0 0 0 1 0 0 1 0 0 0 1 1 1 3 4Milford ILC(P/T) 0 0 0 0 0 0 0 0 0 0 0 0 0 0 0 0 0Milford ILC(F/T) 0 1 6 5 6 14 12 3 47 12 9 7 1 1 2 32 79
Total by Grade 0 1 6 5 6 15 12 3 48 12 9 7 2 2 3 35 83Total Milford School District 0 0 0 0 0 0 0 0 0 0 0 0 0 0 0 0 0
Regular 0 268 330 275 272 246 266 287 1,944 269 293 316 228 216 190 1,512 3,456Part-Time Special 0 0 1 0 5 4 4 9 23 3 6 7 3 4 4 27 50Full-Time Special 22 26 33 30 33 41 40 33 258 40 28 50 29 31 23 201 459
Total by Grade 22 294 364 305 310 291 310 329 2,225 312 327 373 260 251 217 1,740 3,965
Smyrna School DistrictRegular 0 270 304 299 266 280 294 294 2,007 311 332 316 238 217 207 1,621 3,628Part-Time Special 0 0 3 6 5 3 2 2 21 0 1 5 12 14 12 44 65Full-Time Special 24 34 17 35 29 48 47 41 275 66 52 64 30 23 14 249 524
Total by Grade 24 304 324 340 300 331 343 337 2,303 377 385 385 280 254 233 1,914 4,217Special Schools
Smyrna ILC(Reg) 0 0 0 0 0 0 0 0 0 0 0 0 0 0 0 0 0Smyrna ILC(P/T) 0 0 0 0 0 0 0 0 0 0 0 0 0 0 0 0 0Smyrna ILC(F/T) 0 0 0 0 0 0 2 5 7 1 2 1 0 0 2 6 13
Total by Grade 0 0 0 0 0 0 2 5 7 1 2 1 0 0 2 6 13Total Smyrna School District
Regular 0 270 304 299 266 280 294 294 2,007 311 332 316 238 217 207 1,621 3,628Part-Time Special 0 0 3 6 5 3 2 2 21 0 1 5 12 14 12 44 65Full-Time Special 24 34 17 35 29 48 49 46 282 67 54 65 30 23 16 255 537
Total by Grade 24 304 324 340 300 331 345 342 2,310 378 387 386 280 254 235 1,920 4,230(Table continued on following page)
58

TABLE 4ENROLLMENT BY GRADE
SUM OF REGULAR, PART-TIME SPECIAL AND FULL-TIME SPECIAL STUDENTS
SEPTEMBER 30, 2006DISTRICT PK K 1 2 3 4 5 6 PK-6 7 8 9 10 11 12 7-12 TOTALS
Polytech School DistrictRegular 0 0 0 0 0 0 0 0 0 0 0 290 272 248 246 1,056 1,056Part-Time Special 0 0 0 0 0 0 0 0 0 0 0 0 0 0 0 0 0Full-Time Special 0 0 0 0 0 0 0 0 0 0 0 30 31 18 27 106 106
Total by Grade 0 0 0 0 0 0 0 0 0 0 0 320 303 266 273 1,162 1,162 Academy of Dover Charter
Regular 0 69 58 45 30 26 15 14 257 0 0 0 0 0 0 0 257Part-Time Special 0 0 0 0 0 0 0 0 0 0 0 0 0 0 0 0 0Full-Time Special 0 3 2 3 5 2 7 4 26 0 0 0 0 0 0 0 26
Total by Grade 0 72 60 48 35 28 22 18 283 0 0 0 0 0 0 0 283
Campus Community CharterRegular 0 0 38 39 37 41 40 44 239 51 76 57 39 38 31 292 531Part-Time Special 0 0 0 0 0 0 0 0 0 0 0 0 0 0 0 0 0Full-Time Special 0 0 1 2 3 2 5 4 17 1 4 5 8 4 1 23 40
Total by Grade 0 0 39 41 40 43 45 48 256 52 80 62 47 42 32 315 571
Positive Outcomes CharterRegular 0 0 0 0 0 0 0 0 0 7 11 12 12 6 5 53 53Part-Time Special 0 0 0 0 0 0 0 0 0 0 0 0 0 0 0 0 0Full-Time Special 0 0 0 0 0 0 0 0 0 8 14 17 14 10 6 69 69
Total by Grade 0 0 0 0 0 0 0 0 0 15 25 29 26 16 11 122 122 Providence Creek Academy Charter
Regular 0 69 76 58 72 70 67 66 478 69 72 0 0 0 0 141 619Part-Time Special 0 0 0 0 0 0 0 0 0 0 0 0 0 0 0 0 0Full-Time Special 0 0 1 3 5 4 10 10 33 8 7 0 0 0 0 15 48
Total by Grade 0 69 77 61 77 74 77 76 511 77 79 0 0 0 0 156 667
TOTAL KENT COUNTYRegular 0 1,890 2,122 1,944 1,822 1,762 1,787 1,749 13,076 1,924 2,005 2,213 1,769 1,557 1,443 10,911 23,987Part-Time Special 0 0 6 9 14 16 19 22 86 11 22 33 24 33 55 178 264Full-Time Special 166 174 162 219 283 316 322 337 1,979 372 334 477 226 217 181 1,807 3,786
Total by Grade 166 2,064 2,290 2,172 2,119 2,094 2,128 2,108 15,141 2,307 2,361 2,723 2,019 1,807 1,679 12,896 28,037(Table continued on following page)
59

TABLE 4ENROLLMENT BY GRADE
SUM OF REGULAR, PART-TIME SPECIAL AND FULL-TIME SPECIAL STUDENTS
SEPTEMBER 30, 2006DISTRICT PK K 1 2 3 4 5 6 PK-6 7 8 9 10 11 12 7-12 TOTALS
SUSSEX COUNTYCape Henlopen School District
Regular 0 351 304 341 260 292 317 268 2,133 295 292 254 259 290 200 1,590 3,723Part-Time Special 0 2 5 4 7 7 6 11 42 11 7 3 4 8 6 39 81Full-Time Special 0 16 21 27 26 33 29 44 196 35 38 35 35 26 10 179 375
Total by Grade 0 369 330 372 293 332 352 323 2,371 341 337 292 298 324 216 1,808 4,179Special Schools
Cape Henlopen ILC(Reg) 0 0 0 0 0 0 0 0 0 0 0 0 0 0 0 0 0Cape Henlopen ILC(P/T) 0 0 0 0 0 0 0 0 0 0 0 0 0 0 0 0 0Cape Henlopen ILC(F/T) 0 4 5 6 9 10 13 4 51 5 6 4 5 1 2 23 74Career Opportunities(Reg) 0 0 0 0 0 0 0 0 0 0 0 0 0 0 0 0 0Career Opportunities(P/T) 0 0 0 0 0 0 0 0 0 0 0 0 0 0 0 0 0Career Opportunities(F/T) 0 0 0 0 0 0 0 0 0 0 0 0 0 0 0 0 0Sussex Consortium ILC(Reg) 0 0 0 0 0 0 0 0 0 0 0 0 0 0 0 0 0Sussex Consortium ILC(P/T) 0 0 0 0 0 0 0 0 0 0 0 0 0 0 0 0 0Sussex Consortium ILC(F/T) 29 10 10 13 6 13 11 14 106 15 13 1 4 2 9 44 150
Total by Grade 29 14 15 19 15 23 24 18 157 20 19 5 9 3 11 67 224Total Cape Henlopen School District
Regular 0 351 304 341 260 292 317 268 2,133 295 292 254 259 290 200 1,590 3,723Part-Time Special 0 2 5 4 7 7 6 11 42 11 7 3 4 8 6 39 81Full-Time Special 29 30 36 46 41 56 53 62 353 55 57 40 44 29 21 246 599
Total by Grade 29 383 345 391 308 355 376 341 2,528 361 356 297 307 327 227 1,875 4,403
Delmar School DistrictRegular 0 0 0 0 0 0 0 153 153 152 152 152 137 107 97 797 950Part-Time Special 0 0 0 0 0 0 0 1 1 3 1 3 3 1 6 17 18Full-Time Special 0 0 0 0 0 0 0 12 12 15 18 11 16 10 9 79 91
Total by Grade 0 0 0 0 0 0 0 166 166 170 171 166 156 118 112 893 1,059Special Schools
Delmar Secondary ILC(Reg) 0 0 0 0 0 0 0 0 0 0 0 0 0 0 0 0 0Delmar Secondary ILC(P/T) 0 0 0 0 0 0 0 0 0 0 0 0 0 0 3 3 3Delmar Secondary ILC(F/T) 0 0 0 0 0 0 0 0 0 0 0 1 3 4 0 8 8
Total by Grade 0 0 0 0 0 0 0 0 0 0 0 1 3 4 3 11 11Total Delmar School District
Regular 0 0 0 0 0 0 0 153 153 152 152 152 137 107 97 797 950Part-Time Special 0 0 0 0 0 0 0 1 1 3 1 3 3 1 9 20 21Full-Time Special 0 0 0 0 0 0 0 12 12 15 18 12 19 14 9 87 99
Total by Grade 0 0 0 0 0 0 0 166 166 170 171 167 159 122 115 904 1,070(Table continued on following page)
60

TABLE 4ENROLLMENT BY GRADE
SUM OF REGULAR, PART-TIME SPECIAL AND FULL-TIME SPECIAL STUDENTS
SEPTEMBER 30, 2006DISTRICT PK K 1 2 3 4 5 6 PK-6 7 8 9 10 11 12 7-12 TOTALS
Indian River School DistrictRegular 0 651 572 561 545 518 544 234 3,625 245 250 515 495 408 355 2,268 5,893Part-Time Special 0 0 0 0 2 1 1 0 4 0 0 7 6 6 20 39 43Full-Time Special 81 82 63 72 77 81 75 30 561 32 44 76 61 55 14 282 843
Total by Grade 81 733 635 633 624 600 620 264 4,190 277 294 598 562 469 389 2,589 6,779Special Schools
Ennis(Reg) 0 0 0 0 0 0 0 0 0 0 0 0 0 0 0 0 0Ennis(P/T) 0 0 0 0 0 0 0 0 0 0 0 0 0 0 0 0 0Ennis(F/T) 14 7 4 4 6 12 5 8 60 9 5 9 9 8 27 67 127Indian River ILC(Reg) 0 0 0 0 0 0 0 0 0 0 0 0 0 0 0 0 0Indian River ILC(P/T) 0 0 0 0 0 0 0 0 0 0 0 0 0 0 0 0 0Indian River ILC(F/T) 0 1 4 5 13 21 14 17 75 22 18 24 19 9 7 99 174Richard Allen(Reg) 0 0 0 0 0 0 0 0 0 0 0 0 0 0 0 0 0Richard Allen(P/T) 0 0 0 0 0 0 0 0 0 0 0 0 0 0 0 0 0Richard Allen(F/T) 0 0 0 0 0 0 0 0 0 0 0 0 0 0 0 0 0Sussex Central Middle(Reg) 0 0 0 0 0 0 0 297 297 311 308 0 0 0 0 619 916Sussex Central Middle(P/T) 0 0 0 0 0 0 0 4 4 1 1 0 0 0 0 2 6Sussex Central Middle(F/T) 0 0 0 0 0 0 0 42 42 40 54 0 0 0 0 94 136
Total by Grade 14 8 8 9 19 33 19 368 478 383 386 33 28 17 34 881 1,359Total Indian River School District
Regular 0 651 572 561 545 518 544 531 3,922 556 558 515 495 408 355 2,887 6,809Part-Time Special 0 0 0 0 2 1 1 4 8 1 1 7 6 6 20 41 49Full-Time Special 95 90 71 81 96 114 94 97 738 103 121 109 89 72 48 542 1,280
Total by Grade 95 741 643 642 643 633 639 632 4,668 660 680 631 590 486 423 3,470 8,138(Table continued on following page)
61

TABLE 4ENROLLMENT BY GRADE
SUM OF REGULAR, PART-TIME SPECIAL AND FULL-TIME SPECIAL STUDENTS
SEPTEMBER 30, 2006DISTRICT PK K 1 2 3 4 5 6 PK-6 7 8 9 10 11 12 7-12 TOTALS
Laurel School DistrictRegular 0 150 151 154 157 153 151 148 1,064 145 170 145 124 88 79 751 1,815Part-Time Special 0 0 0 0 0 0 0 0 0 0 0 1 0 0 6 7 7Full-Time Special 8 12 13 9 13 31 22 17 125 19 26 28 19 13 6 111 236
Total by Grade 8 162 164 163 170 184 173 165 1,189 164 196 174 143 101 91 869 2,058Special Schools
Laurel ILC(Reg) 0 0 0 0 0 0 0 0 0 0 0 0 0 0 0 0 0Laurel ILC(P/T) 0 0 0 0 0 0 0 0 0 0 0 0 0 0 0 0 0Laurel ILC(F/T) 0 0 0 0 0 0 1 1 2 1 1 3 0 2 1 8 10W Sussex Academy ILC(Reg) 0 0 0 0 0 0 0 0 0 0 0 0 0 0 0 0 0W Sussex Academy ILC(P/T) 0 0 0 0 0 0 0 0 0 0 0 0 0 0 0 0 0W Sussex Academy ILC(F/T) 0 0 0 0 0 0 0 0 0 0 0 0 2 2 4 8 8
Total by Grade 0 0 0 0 0 0 1 1 2 1 1 3 2 4 5 16 18Total Laurel School District
Regular 0 150 151 154 157 153 151 148 1,064 145 170 145 124 88 79 751 1,815Part-Time Special 0 0 0 0 0 0 0 0 0 0 0 1 0 0 6 7 7Full-Time Special 8 12 13 9 13 31 23 18 127 20 27 31 21 17 11 127 254
Total by Grade 8 162 164 163 170 184 174 166 1,191 165 197 177 145 105 96 885 2,076
Seaford School DistrictRegular 0 278 277 276 248 212 210 194 1,695 211 244 245 178 112 124 1,114 2,809Part-Time Special 0 0 0 0 0 0 0 0 0 0 0 0 0 0 0 0 0Full-Time Special 7 18 24 32 29 45 51 42 248 45 35 33 21 10 6 150 398
Total by Grade 7 296 301 308 277 257 261 236 1,943 256 279 278 199 122 130 1,264 3,207Special Schools
Seaford ILC(Reg) 0 0 0 0 0 0 0 0 0 0 0 0 0 0 0 0 0Seaford ILC(P/T) 0 0 0 0 0 0 0 0 0 0 0 0 0 0 0 0 0Seaford ILC(F/T) 0 0 0 1 0 1 2 7 11 14 15 10 5 6 2 52 63Sussex Ortho/Vis Han(Reg) 0 0 0 0 0 0 0 0 0 0 0 0 0 0 0 0 0Sussex Ortho/Vis Han(P/T) 0 0 0 0 0 0 0 0 0 0 0 0 0 0 0 0 0Sussex Ortho/Vis Han(F/T) 2 4 0 1 1 1 4 1 14 3 1 2 1 3 5 15 29
Total by Grade 2 4 0 2 1 2 6 8 25 17 16 12 6 9 7 67 92Total Seaford School District
Regular 0 278 277 276 248 212 210 194 1,695 211 244 245 178 112 124 1,114 2,809Part-Time Special 0 0 0 0 0 0 0 0 0 0 0 0 0 0 0 0 0Full-Time Special 9 22 24 34 30 47 57 50 273 62 51 45 27 19 13 217 490
Total by Grade 9 300 301 310 278 259 267 244 1,968 273 295 290 205 131 137 1,331 3,299(Table continued on following page)
62

TABLE 4ENROLLMENT BY GRADE
SUM OF REGULAR, PART-TIME SPECIAL AND FULL-TIME SPECIAL STUDENTS
SEPTEMBER 30, 2006DISTRICT PK K 1 2 3 4 5 6 PK-6 7 8 9 10 11 12 7-12 TOTALS
Sussex Vo-Tech School DistrictRegular 0 0 0 0 0 0 0 0 0 0 0 333 260 270 232 1,095 1,095Part-Time Special 0 0 0 0 0 0 0 0 0 0 0 0 0 0 0 0 0Full-Time Special 0 0 0 0 0 0 0 0 0 0 0 31 40 34 27 132 132
Total by Grade 0 0 0 0 0 0 0 0 0 0 0 364 300 304 259 1,227 1,227Woodbridge School District
Regular 0 170 158 127 148 143 156 150 1,052 155 132 136 107 87 75 692 1,744Part-Time Special 0 0 0 0 1 0 2 0 3 3 2 0 0 0 0 5 8Full-Time Special 10 9 5 7 8 7 13 18 77 27 16 30 11 7 3 94 171
Total by Grade 10 179 163 134 157 150 171 168 1,132 185 150 166 118 94 78 791 1,923Special Schools 0 0 0 0 0 0 0 0 0 0 0 0 0 0 0 0 0
Woodbridge ILC(Reg) 0 0 0 0 0 0 0 0 0 0 0 0 0 0 0 0 0Woodbridge ILC(P/T) 0 0 0 0 0 0 0 0 0 0 0 0 0 0 0 0 0Woodbridge ILC(F/T) 0 0 0 2 3 0 0 0 5 2 2 1 2 2 0 9 14
Total by Grade 0 0 0 2 3 0 0 0 5 2 2 1 2 2 0 9 14Total Woodbridge School District 0 0
Regular 0 170 158 127 148 143 156 150 1,052 155 132 136 107 87 75 692 1,744 Part-Time Special 0 0 0 0 1 0 2 0 3 3 2 0 0 0 0 5 8 Full-Time Special 10 9 5 9 11 7 13 18 82 29 18 31 13 9 3 103 185
Total by Grade 10 179 163 136 160 150 171 168 1,137 187 152 167 120 96 78 800 1,937Sussex Academy Charter School
Regular 0 0 0 0 0 0 0 113 113 105 90 0 0 0 0 195 308Part-Time Special 0 0 0 0 0 0 0 0 0 0 0 0 0 0 0 0 0Full-Time Special 0 0 0 0 0 0 0 5 5 4 6 0 0 0 0 10 15
Total by Grade 0 0 0 0 0 0 0 118 118 109 96 0 0 0 0 205 323
TOTAL SUSSEX COUNTYRegular 0 1,600 1,462 1,459 1,358 1,318 1,378 1,557 10,132 1,619 1,638 1,780 1,560 1,362 1,162 9,121 19,253Part-Time Special 0 2 5 4 10 8 9 16 54 18 11 14 13 15 41 112 166Full-Time Special 151 163 149 179 191 255 240 262 1,590 288 298 299 253 194 132 1,464 3,054
Total by Grade 151 1,765 1,616 1,642 1,559 1,581 1,627 1,835 11,776 1,925 1,947 2,093 1,826 1,571 1,335 10,697 22,473
TOTAL STATEWIDERegular 0 7,959 8,944 8,386 8,036 7,641 7,763 7,905 56,634 8,458 8,867 10,029 8,599 7,198 6,511 49,662 106,296Part-Time Special 0 28 40 66 94 93 92 150 563 101 119 192 129 167 249 957 1,520Full-Time Special 674 622 732 910 1,053 1,256 1,186 1,256 7,689 1,343 1,276 1,542 1,053 862 696 6,772 14,461
Total by Grade 674 8,609 9,716 9,362 9,183 8,990 9,041 9,311 64,886 9,902 10,262 11,763 9,781 8,227 7,456 57,391 122,277
NOTE: Sum of students enrolled by category by grade. Full-time special education students are enrolled in special education classes at least 12.5 hours per week.SOURCE: Technology Management and Design
63

American Indian Black Asian Hispanic White TotalDistrict No. % No. % No. % No. % No. % No. %
NEW CASTLE COUNTY Appoquinimink............................................ 31 0.4% 1,640 21.6% 274 3.6% 323 4.3% 5,320 70.1% 7,588 100% Brandywine................................................. 22 0.2% 4,102 39.7% 426 4.1% 357 3.5% 5,414 52.5% 10,321 100% Christina..................................................... 56 0.3% 7,847 42.4% 817 4.4% 2,227 12.0% 7,548 40.8% 18,495 100% Colonial...................................................... 32 0.3% 4,665 45.0% 272 2.6% 1,489 14.4% 3,903 37.7% 10,361 100% New Castle County Vo Tech...................... 10 0.3% 1,334 35.2% 30 0.8% 317 8.4% 2,103 55.4% 3,794 100% Red Clay Consolidated............................... 24 0.2% 4,167 26.7% 592 3.8% 3,156 20.2% 7,655 49.1% 15,594 100% Charter School of Wilmington..................... 3 0.3% 77 8.1% 202 21.3% 26 2.7% 641 67.5% 949 100% Delaware Military Academy........................ 0 0.0% 55 10.6% 10 1.9% 19 3.7% 434 83.8% 518 100% East Side Charter School…………………… 0 0.0% 245 99.2% 0 0.0% 2 0.8% 0 0.0% 247 100% Family Foundation...................................... 4 1.7% 185 80.8% 1 0.4% 7 3.1% 32 14.0% 229 100% Kuumba Academy…………………………… 0 0.0% 249 98.0% 0 0.0% 4 1.6% 1 0.4% 254 100% Marion T. Academy………………………… 0 0.0% 509 95.1% 1 0.2% 23 4.3% 2 0.4% 535 100% Moyer Academy……………………………… 2 0.8% 250 94.7% 2 0.8% 4 1.5% 6 2.3% 264 100% Newark Charter……………………………… 2 0.3% 81 12.5% 55 8.5% 20 3.1% 490 75.6% 648 100% MOT Charter………………………………… 0 0.0% 68 10.1% 15 2.2% 14 2.1% 578 85.6% 675 100% Odyssey Charter……………………………… 0 0.0% 36 29.3% 3 2.4% 7 5.7% 77 62.6% 123 100% Pencader Charter…………………………… 6 1.8% 120 36.8% 16 4.9% 12 3.7% 172 52.8% 326 100% Thomas Edison Charter……………………. 1 0.1% 789 93.7% 7 0.8% 37 4.4% 8 1.0% 842 100%
Total New Castle County....................... 193 0.3% 26,419 36.8% 2,723 3.8% 8,044 11.2% 34,384 47.9% 71,763 100%KENT COUNTY
Caesar Rodney.......................................... 30 0.4% 1,991 28.5% 208 3.0% 362 5.2% 4,395 62.9% 6,986 100% Capital........................................................ 40 0.7% 3,098 50.6% 154 2.5% 327 5.3% 2,500 40.9% 6,119 100% Lake Forest................................................ 16 0.4% 876 22.3% 42 1.1% 146 3.7% 2,841 72.5% 3,921 100% Milford......................................................... 17 0.4% 1,031 26.0% 54 1.4% 468 11.8% 2,395 60.4% 3,965 100% Polytech...................................................... 6 0.5% 255 21.9% 22 1.9% 49 4.2% 830 71.4% 1,162 100% Smyrna....................................................... 11 0.3% 879 20.8% 56 1.3% 162 3.8% 3,122 73.8% 4,230 100% Academy of Dover...................................... 2 0.7% 253 89.7% 3 1.1% 9 3.2% 15 5.3% 282 100% Campus Community School………………… 3 0.5% 156 27.3% 19 3.3% 24 4.2% 369 64.6% 571 100% Positive Outcomes Charter School............ 0 0.0% 19 15.6% 1 0.8% 2 1.6% 100 82.0% 122 100% Providence Creek Charter.......................... 6 0.9% 133 19.9% 11 1.6% 11 1.6% 506 75.9% 667 100%
Total Kent County................................... 131 0.5% 8,691 31.0% 570 2.0% 1,560 5.6% 17,073 60.9% 28,025 100%SUSSEX COUNTY
Cape Henlopen.......................................... 48 1.1% 891 20.2% 93 2.1% 316 7.2% 3,055 69.4% 4,403 100% Delmar........................................................ 3 0.3% 180 16.8% 18 1.7% 19 1.8% 850 79.4% 1,070 100% Indian River................................................ 30 0.4% 1,533 18.8% 101 1.2% 1,326 16.3% 5,148 63.3% 8,138 100% Laurel......................................................... 5 0.2% 560 27.0% 42 2.0% 103 5.0% 1,366 65.8% 2,076 100% Seaford....................................................... 8 0.2% 1,239 37.5% 40 1.2% 281 8.5% 1,732 52.5% 3,300 100% Sussex Academy of Arts and Sciences…… 2 0.6% 13 4.0% 11 3.4% 15 4.6% 282 87.3% 323 100% Sussex Technical....................................... 17 1.4% 192 15.6% 10 0.8% 44 3.6% 964 78.6% 1,227 100% Woodbridge................................................ 6 0.3% 662 34.2% 14 0.7% 224 11.6% 1,030 53.2% 1,936 100%
Total Sussex County.............................. 119 0.5% 5,270 23.5% 329 1.5% 2,328 10.4% 14,427 64.2% 22,473 100%TOTAL STATE................................................ 443 0.4% 40,380 33.0% 3,622 3.0% 11,932 9.8% 65,884 53.9% 122,261 100% Note: Figures taken from fall enrollment and do not reflect the September 30 enrollment count.Source: Technology Management and Design
64
TABLE 5PUPIL ENROLLMENT BY RACIAL/ETHNIC GROUP
FALL, 2006

TABLE 6COMPARISON OF SEPTEMBER 30 ENROLLMENTS
ROUNDED FULL-TIME EQUIVALENT
1971 THRU 2006
Number and Percent of Increase or DecreaseNumber by Grade K 1-6 7-12 Spec. Total
Year K 1-6 7-12 Special Total No. % No. % No. % No. % No. %1971 ..... 9,018 64,546 59,404 5,045 138,013 1,288 16.7 -1,213 -1.9 1,765 3.1 428 9.3 2,268 1.71972 ..... 8,511 59,981 60,335 5,490 134,317 -507 -5.6 -4,565 -7.1 931 1.6 445 8.8 -3,696 -2.71973 ..... 8,494 57,042 60,799 6,605 132,940 -17 -0.2 -2,939 -4.9 464 0.8 1,115 20.3 -1,377 -1.01974 ..... 8,643 54,250 60,508 7,208 130,609 149 1.8 -2,792 -4.9 -291 -0.5 603 9.1 -2,331 -1.81975 ..... 8,746 51,182 59,950 7,598 127,476 103 1.2 -3,068 -5.7 -558 -0.9 390 5.4 -3,133 -2.41976 ..... 8,029 48,037 58,134 8,073 122,273 -717 -8.2 -3,145 -6.1 -1,816 -3.0 475 6.3 -5,203 -4.11977 ..... 6,962 46,066 55,296 9,046 117,370 -1,067 -13.3 -1,971 -4.1 -2,838 -4.9 973 12.1 -4,903 -4.01978 ..... 6,116 41,847 53,616 9,455 111,034 -846 -12.2 -4,219 -9.2 -1,680 -3.0 409 4.5 -6,336 -5.41979 ..... 5,819 38,712 49,259 10,245 104,035 -297 -4.9 -3,135 -7.5 -4,357 -8.1 790 8.4 -6,999 -6.31980 ..... 5,864 37,277 46,263 9,999 99,403 45 0.8 -1,435 -3.7 -2,996 -6.1 -246 -2.4 -4,632 -4.51981 ..... 5,742 35,964 43,518 9,848 95,072 -122 -2.1 -1,313 -3.5 -2,745 -5.9 -151 -1.5 -4,331 -4.41982 ..... 6,169 34,773 41,870 9,834 92,646 427 7.4 -1,191 -3.3 -1,648 -3.8 -14 -0.1 -2,426 -2.61983 ..... 6,200 34,275 40,829 10,102 91,406 31 0.5 -498 -1.4 -1,041 -2.5 268 2.7 -1,240 -1.31984 ..... 6,646 34,903 39,842 10,376 91,767 446 7.2 628 1.8 -987 -2.4 274 2.7 361 0.41985 ..... 6,933 36,197 39,132 10,639 92,901 287 4.3 1,294 3.7 -710 -1.8 263 2.5 1,134 1.21986 ..... 7,143 38,001 38,578 10,688 94,410 210 3.0 1,804 5.0 -554 -1.4 49 0.5 1,509 1.61987 ..... 7,291 39,906 38,197 10,265 95,659 148 2.1 1,905 5.0 -381 -1.0 -423 -4.0 1,249 1.31988 ..... 7,351 41,978 37,532 9,817 96,678 60 0.8 2,072 5.2 -665 -1.7 -448 -4.4 1,019 1.11989 ..... 7,268 43,363 37,502 9,675 97,808 -83 -1.1 1,385 3.3 -30 -0.1 -142 -1.4 1,130 1.21990 ..... 7,488 44,434 37,967 9,769 99,658 220 3.0 1,071 2.5 465 1.2 94 1.0 1,850 1.91991 ..... 7,594 45,069 39,140 10,393 102,196 106 1.4 635 1.4 1,173 3.1 624 6.4 2,538 2.51992 ..... 7,343 45,364 40,575 11,039 104,321 -251 -3.3 295 0.7 1,435 3.7 646 6.2 2,125 2.11993 ..... 7,485 45,049 41,641 11,372 105,547 142 1.9 -315 -0.7 1,066 2.6 333 3.0 1,226 1.21994 ..... 6,887 45,154 42,877 11,895 106,813 -598 -8.0 105 0.2 1,236 3.0 523 4.6 1,266 1.21995 ..... 7,177 44,979 44,080 12,225 108,461 290 4.2 -175 -0.4 1,203 2.8 330 2.8 1,648 1.51996 ..... 7,353 45,474 45,197 12,525 110,549 176 2.5 495 1.1 1,117 2.5 300 2.5 2,088 1.91997 ..... 7,492 45,809 45,811 12,848 111,960 139 1.9 335 0.7 614 1.4 323 2.6 1,411 1.31998 ..... 7,504 46,847 46,075 12,656 113,082 12 0.2 1,038 2.3 264 0.6 -192 -1.5 1,122 1.01999 ..... 7,263 47,537 46,148 12,649 113,598 -241 -3.2 690 1.5 73 0.2 -7 -0.1 516 0.52000 ..... 7,184 47,994 46,467 12,873 114,518 -79 -1.1 457 1.0 319 0.7 224 1.8 920 0.82001 ..... 7,148 48,632 46,497 13,207 115,484 -36 -0.5 638 1.3 30 0.1 334 2.6 966 0.82002 ..... 7,217 48,324 46,924 13,824 116,288 69 1.0 -308 -0.6 427 0.9 617 4.7 804 0.72003 ..... 7,384 47,923 47,272 15,197 117,776 167 2.3 -401 -0.8 348 0.7 1,373 9.9 1,488 1.32004 ..... 7,637 47,659 48,262 15,551 119,109 253 3.4 -264 -0.6 990 2.1 354 2.3 1,333 1.12005 ..... 7,901 48,329 49,005 15,728 120,963 264 3.5 670 1.4 743 1.5 177 1.1 1,854 1.62006 ..... 7,959 48,675 49,662 15,981 122,277 58 0.7 346 0.7 657 1.3 253 1.6 1,314 1.1
Source: Technology Management and Design
65

TABLE 7UNIT ALLOTMENT BASED ON ENROLLMENTS REPORTED BY LOCAL SCHOOL DISTRICTS
AS OF SEPTEMBER 30, 2006
(29) APPOQUINIMINK SCHOOL DISTRICT
KINDERGARTEN Grades 1-3 Grades 4-6 Grades 7-12 Total Regular
Enrollment 491.00 1,669.98 1,677.22 2,985.28 6,823.48
Units 28.00 96.00 84.00 149.00 357.00
EMD ED LD TMD SMD OHI OI HHPD VI PS AUT DB TBI ILC Total Special
Enrollment 17.00 43.63 314.70 25.00 7.00 160.50 22.33 9.08 1.00 0.00 19.57 0.00 0.00 144.71 764.52
Units 1.00 4.00 39.00 4.00 1.00 27.00 4.00 2.00 0.00 0.00 5.00 0.00 0.00 17.00 104.00
VOC. DIV. I VOC. DIV. II VOC. DIV. OTHERUnits 25.00 64.00 0.00 TOTAL REGULAR & SPECIAL ENROLLMENT 7,588.00
TOTAL REGULAR & SPECIAL 461.00
*Includes 25 PRE-KIND. Students VOC DEDUCT 12.00
NET REGULAR & SPECIAL 449.00
DISTRICT DIV. I 474.00
DISTRICT DIV. II 513.00
(31) BRANDYWINE SCHOOL DISTRICT
KINDERGARTEN Grades 1-3 Grades 4-6 Grades 7-12 Total Regular
Enrollment 633.67 2,111.89 1,990.58 4,656.45 9,392.59
Units 18.00 121.00 100.00 233.00 472.00
EMD ED LD TMD SMD OHI OI HHPD VI PS AUT DB TBI ILC Total Special
Enrollment 114.86 64.06 533.94 33.00 1.00 93.59 35.01 8.06 1.00 1.14 39.73 1.00 2.02 0.00 928.41
Units 8.00 6.00 67.00 5.00 0.00 16.00 6.00 1.00 0.00 0.00 10.00 0.00 0.00 0.00 119.00
VOC. DIV. I VOC. DIV. II VOC. DIV. OTHERUnits 35.00 97.00 0.00 TOTAL REGULAR & SPECIAL ENROLLMENT 10,321.00
TOTAL REGULAR & SPECIAL 591.00
*Includes 54 PRE-KIND. Students VOC DEDUCT 17.00
NET REGULAR & SPECIAL 574.00
NOTE: Brandywine School District's Division I units would have increased by 3 to 612 in its traditional unit count because of engineering. DISTRICT DIV. I 609.00
(Table continued on following page.) DISTRICT DIV. II 671.0066

TABLE 7 (Continued)UNIT ALLOTMENT BASED ON ENROLLMENTS REPORTED BY LOCAL SCHOOL DISTRICTS
AS OF SEPTEMBER 30, 2006
(33) CHRISTINA SCHOOL DISTRICT
KINDERGARTEN Grades 1-3 Grades 4-6 Grades 7-12 Total Regular
Enrollment 1,166.23 4,323.92 3,551.72 6,710.52 15,752.39
Units 34.00 249.00 178.00 336.00 797.00
EMD ED LD TMD SMD OHI OI HHPD VI PS AUT DB TBI ILC Total Special
Enrollment 83.25 35.13 1,156.03 52.00 20.00 345.22 76.16 135.77 4.00 1.07 318.23 16.00 4.00 495.75 2,742.61
Units 6.00 4.00 145.00 9.00 3.00 58.00 13.00 23.00 0.00 0.00 80.00 4.00 1.00 58.00 404.00
VOC. DIV. I VOC. DIV. II VOC. DIV. OTHERUnits 79.00 207.00 0.00 TOTAL REGULAR & SPECIAL ENROLLMENT 18,495.00
TOTAL REGULAR & SPECIAL 1,201.00
*Includes 151 PRE-KIND. Students VOC DEDUCT 39.00
NET REGULAR & SPECIAL 1,162.00
DISTRICT DIV. I 1,241.00
DISTRICT DIV. II 1,369.00
(34) COLONIAL SCHOOL DISTRICT
KINDERGARTEN Grades 1-3 Grades 4-6 Grades 7-12 Total Regular
Enrollment 621.00 2,326.69 2,333.50 3,812.55 9,093.74
Units 18.00 134.00 117.00 191.00 460.00
EMD ED LD TMD SMD OHI OI HHPD VI PS AUT DB TBI ILC Total Special
Enrollment 160.70 26.00 620.36 52.00 10.00 171.95 76.71 9.18 1.00 1.03 6.33 11.00 4.00 117.00 1,267.26
Units 11.00 3.00 78.00 9.00 2.00 29.00 13.00 2.00 0.00 1.00 2.00 3.00 1.00 14.00 168.00
VOC. DIV. I VOC. DIV. II VOC. DIV. OTHERUnits 35.00 101.00 0.00 TOTAL REGULAR & SPECIAL ENROLLMENT 10,361.00
TOTAL REGULAR & SPECIAL 628.00
*Includes 78 PRE-KIND. Students VOC DEDUCT 17.00
NET REGULAR & SPECIAL 611.00
DISTRICT DIV. I 646.00
(Table continued on following page.) DISTRICT DIV. II 712.0067

TABLE 7 (Continued)UNIT ALLOTMENT BASED ON ENROLLMENTS REPORTED BY LOCAL SCHOOL DISTRICTS
AS OF SEPTEMBER 30, 2006
(38) NEW CASTLE COUNTY VOTECH SCHOOL DISTRICT
KINDERGARTEN Grades 1-3 Grades 4-6 Grades 7-12 Total Regular
Enrollment 0.00 0.00 0.00 3,369.86 3,369.86
Units 0.00 0.00 0.00 168.00 168.00
EMD ED LD TMD SMD OHI OI HHPD VI PS AUT DB TBI ILC Total Special
Enrollment 9.00 3.25 296.79 2.00 0.00 64.98 10.75 2.25 0.00 0.12 1.00 0.00 0.00 34.00 424.14
Units 1.00 0.00 37.00 0.00 0.00 11.00 2.00 0.00 0.00 0.00 0.00 0.00 0.00 4.00 55.00
VOC. DIV. I VOC. DIV. II VOC. DIV. OTHERUnits 129.00 374.00 0.00 TOTAL REGULAR & SPECIAL ENROLLMENT 3,794.00
TOTAL REGULAR & SPECIAL 223.00
*Includes 0 PRE-KIND. Students VOC DEDUCT 63.00
NET REGULAR & SPECIAL 160.00
DISTRICT DIV. I 289.00
DISTRICT DIV. II 534.00
(32) RED CLAY CONSOLIDATED SCHOOL DISTRICT
KINDERGARTEN Grades 1-3 Grades 4-6 Grades 7-12 Total Regular
Enrollment 1,086.04 3,610.94 3,290.63 5,950.49 13,938.10
Units 31.00 208.00 165.00 298.00 702.00
EMD ED LD TMD SMD OHI OI HHPD VI PS AUT DB TBI ILC Total Special
Enrollment 127.61 45.89 837.91 105.00 24.00 183.51 22.29 10.65 0.00 1.00 4.04 4.00 4.00 286.00 1,655.90
Units 9.00 5.00 105.00 17.00 4.00 31.00 4.00 2.00 0.00 0.00 1.00 1.00 1.00 33.00 213.00
VOC. DIV. I VOC. DIV. II VOC. DIV. OTHERUnits 48.00 136.00 0.00 TOTAL REGULAR & SPECIAL ENROLLMENT 15,594.00
TOTAL REGULAR & SPECIAL 915.00
*Includes 49 PRE-KIND. Students VOC DEDUCT 24.00
NET REGULAR & SPECIAL 891.00
DISTRICT DIV. I 939.00
(Table continued on following page.) DISTRICT DIV. II 1,027.0068

TABLE 7 (Continued)UNIT ALLOTMENT BASED ON ENROLLMENTS REPORTED BY LOCAL SCHOOL DISTRICTS
AS OF SEPTEMBER 30, 2006
(10) CAESAR RODNEY SCHOOL DISTRICT
KINDERGARTEN Grades 1-3 Grades 4-6 Grades 7-12 Total Regular
Enrollment 347.00 1,283.38 1,263.77 2,633.27 5,527.42
Units 10.00 74.00 63.00 132.00 279.00
EMD ED LD TMD SMD OHI OI HHPD VI PS AUT DB TBI ILC Total Special
Enrollment 93.62 26.34 386.87 109.00 23.00 115.29 11.50 4.29 4.00 1.00 68.67 7.00 0.00 189.00 1,039.58
Units 6.00 3.00 48.00 18.00 4.00 19.00 2.00 1.00 0.00 1.00 17.00 2.00 0.00 22.00 143.00
VOC. DIV. I VOC. DIV. II VOC. DIV. OTHERUnits 24.00 68.00 0.00 TOTAL REGULAR & SPECIAL ENROLLMENT 6,567.00
TOTAL REGULAR & SPECIAL 422.00
*Includes 38 PRE-KIND. Students VOC DEDUCT 12.00
NET REGULAR & SPECIAL 410.00
DISTRICT DIV. I 434.00
DISTRICT DIV. II 478.00
(14) DOVER AIR FORCE BASE
KINDERGARTEN Grades 1-3 Grades 4-6 Grades 7-12 Total Regular
Enrollment 41.00 148.93 97.60 107.78 395.31
Units 1.00 9.00 5.00 5.00 20.00
EMD ED LD TMD SMD OHI OI HHPD VI PS AUT DB TBI ILC Total Special
Enrollment 2.00 0.00 20.31 0.00 0.00 3.17 0.07 0.07 0.00 0.00 0.07 0.00 0.00 0.00 25.69
Units 0.00 0.00 3.00 0.00 0.00 1.00 0.00 0.00 0.00 0.00 0.00 0.00 0.00 0.00 4.00
VOC. DIV. I VOC. DIV. II VOC. DIV. OTHERUnits 1.00 2.00 0.00 TOTAL REGULAR & SPECIAL ENROLLMENT 421.00
TOTAL REGULAR & SPECIAL 24.00
*Includes 0 PRE-KIND. Students VOC DEDUCT 0.00
NET REGULAR & SPECIAL 24.00
DISTRICT DIV. I 25.00
(Table continued on following page.) DISTRICT DIV. II 26.0069

TABLE 7 (Continued)UNIT ALLOTMENT BASED ON ENROLLMENTS REPORTED BY LOCAL SCHOOL DISTRICTS
AS OF SEPTEMBER 30, 2006
(13) CAPITAL SCHOOL DISTRICT
KINDERGARTEN Grades 1-3 Grades 4-6 Grades 7-12 Total Regular
Enrollment 531.00 1,366.00 1,056.00 2,177.58 5,130.58
Units 31.00 79.00 53.00 109.00 272.00
EMD ED LD TMD SMD OHI OI HHPD VI PS AUT DB TBI ILC Total Special
Enrollment 38.00 26.47 559.61 8.00 0.00 100.23 71.00 11.11 0.00 5.00 36.00 11.00 0.00 131.00 997.42
Units 3.00 3.00 70.00 1.00 0.00 17.00 12.00 2.00 0.00 0.00 9.00 3.00 0.00 15.00 135.00
VOC. DIV. I VOC. DIV. II VOC. DIV. OTHERUnits 20.00 50.00 0.00 TOTAL REGULAR & SPECIAL ENROLLMENT 6,128.00
TOTAL REGULAR & SPECIAL 407.00
*Includes 51 PRE-KIND. Students VOC DEDUCT 10.00
NET REGULAR & SPECIAL 397.00
DISTRICT DIV. I 417.00
DISTRICT DIV. II 447.00
(15) LAKE FOREST SCHOOL DISTRICT
KINDERGARTEN Grades 1-3 Grades 4-6 Grades 7-12 Total Regular
Enrollment 295.00 897.00 851.00 1,371.53 3,414.53
Units 8.00 52.00 43.00 69.00 172.00
EMD ED LD TMD SMD OHI OI HHPD VI PS AUT DB TBI ILC Total Special
Enrollment 38.00 25.85 358.66 0.00 0.00 55.96 8.00 5.00 0.00 0.00 3.00 0.00 0.00 12.00 506.47
Units 3.00 3.00 45.00 0.00 0.00 9.00 1.00 1.00 0.00 0.00 1.00 0.00 0.00 1.00 64.00
VOC. DIV. I VOC. DIV. II VOC. DIV. OTHERUnits 17.00 48.00 0.00 TOTAL REGULAR & SPECIAL ENROLLMENT 3,921.00
TOTAL REGULAR & SPECIAL 236.00
*Includes 31 PRE-KIND. Students VOC DEDUCT 8.00
NET REGULAR & SPECIAL 228.00
DISTRICT DIV. I 245.00
(Table continued on following page.) DISTRICT DIV. II 276.0070
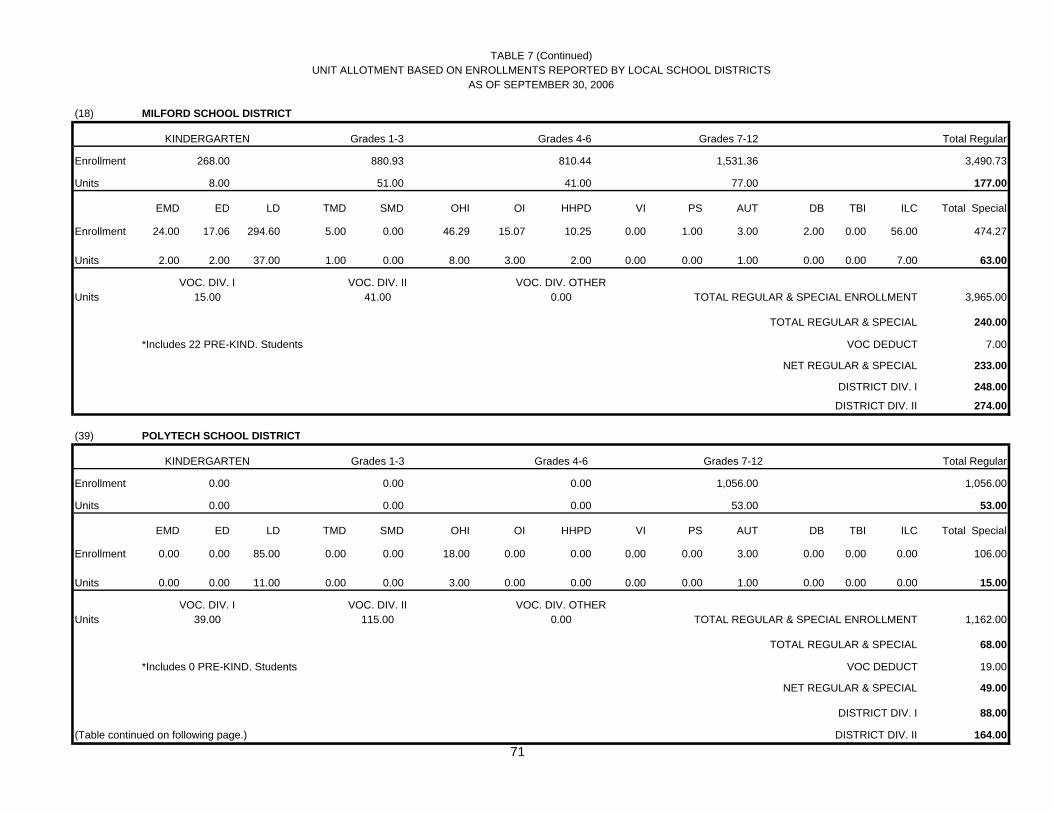
TABLE 7 (Continued)UNIT ALLOTMENT BASED ON ENROLLMENTS REPORTED BY LOCAL SCHOOL DISTRICTS
AS OF SEPTEMBER 30, 2006
(18) MILFORD SCHOOL DISTRICT
KINDERGARTEN Grades 1-3 Grades 4-6 Grades 7-12 Total Regular
Enrollment 268.00 880.93 810.44 1,531.36 3,490.73
Units 8.00 51.00 41.00 77.00 177.00
EMD ED LD TMD SMD OHI OI HHPD VI PS AUT DB TBI ILC Total Special
Enrollment 24.00 17.06 294.60 5.00 0.00 46.29 15.07 10.25 0.00 1.00 3.00 2.00 0.00 56.00 474.27
Units 2.00 2.00 37.00 1.00 0.00 8.00 3.00 2.00 0.00 0.00 1.00 0.00 0.00 7.00 63.00
VOC. DIV. I VOC. DIV. II VOC. DIV. OTHERUnits 15.00 41.00 0.00 TOTAL REGULAR & SPECIAL ENROLLMENT 3,965.00
TOTAL REGULAR & SPECIAL 240.00
*Includes 22 PRE-KIND. Students VOC DEDUCT 7.00
NET REGULAR & SPECIAL 233.00
DISTRICT DIV. I 248.00
DISTRICT DIV. II 274.00
(39) POLYTECH SCHOOL DISTRICT
KINDERGARTEN Grades 1-3 Grades 4-6 Grades 7-12 Total Regular
Enrollment 0.00 0.00 0.00 1,056.00 1,056.00
Units 0.00 0.00 0.00 53.00 53.00
EMD ED LD TMD SMD OHI OI HHPD VI PS AUT DB TBI ILC Total Special
Enrollment 0.00 0.00 85.00 0.00 0.00 18.00 0.00 0.00 0.00 0.00 3.00 0.00 0.00 0.00 106.00
Units 0.00 0.00 11.00 0.00 0.00 3.00 0.00 0.00 0.00 0.00 1.00 0.00 0.00 0.00 15.00
VOC. DIV. I VOC. DIV. II VOC. DIV. OTHERUnits 39.00 115.00 0.00 TOTAL REGULAR & SPECIAL ENROLLMENT 1,162.00
TOTAL REGULAR & SPECIAL 68.00
*Includes 0 PRE-KIND. Students VOC DEDUCT 19.00
NET REGULAR & SPECIAL 49.00
DISTRICT DIV. I 88.00
(Table continued on following page.) DISTRICT DIV. II 164.0071

TABLE 7 (Continued)UNIT ALLOTMENT BASED ON ENROLLMENTS REPORTED BY LOCAL SCHOOL DISTRICTS
AS OF SEPTEMBER 30, 2006
(24) SMYRNA SCHOOL DISTRICT
KINDERGARTEN Grades 1-3 Grades 4-6 Grades 7-12 Total Regular
Enrollment 270.00 881.67 874.75 1,652.37 3,678.79
Units 16.00 51.00 44.00 83.00 194.00
EMD ED LD TMD SMD OHI OI HHPD VI PS AUT DB TBI ILC Total Special
Enrollment 39.00 26.09 389.18 6.00 0.00 48.62 10.06 12.20 0.00 0.00 7.06 0.00 0.00 13.00 551.21
Units 3.00 3.00 49.00 1.00 0.00 8.00 2.00 2.00 0.00 0.00 2.00 0.00 0.00 2.00 72.00
VOC. DIV. I VOC. DIV. II VOC. DIV. OTHERUnits 20.00 57.00 0.00 TOTAL REGULAR & SPECIAL ENROLLMENT 4,230.00
TOTAL REGULAR & SPECIAL 266.00
*Includes 24 PRE-KIND. Students VOC DEDUCT 10.00
NET REGULAR & SPECIAL 256.00
DISTRICT DIV. I 276.00
DISTRICT DIV. II 313.00
(17) CAPE HENLOPEN SCHOOL DISTRICT
KINDERGARTEN Grades 1-3 Grades 4-6 Grades 7-12 Total Regular
Enrollment 352.17 914.50 890.15 1,611.72 3,768.54
Units 20.00 53.00 45.00 81.00 199.00
EMD ED LD TMD SMD OHI OI HHPD VI PS AUT DB TBI ILC Total Special
Enrollment 23.50 6.34 310.86 7.00 0.00 31.53 11.24 5.33 0.00 0.00 143.66 0.00 2.00 93.00 634.46
Units 2.00 1.00 39.00 1.00 0.00 5.00 2.00 1.00 0.00 0.00 36.00 0.00 0.00 11.00 98.00
VOC. DIV. I VOC. DIV. II VOC. DIV. OTHERUnits 16.00 45.00 0.00 TOTAL REGULAR & SPECIAL ENROLLMENT 4,403.00
TOTAL REGULAR & SPECIAL 297.00
*Includes 29 PRE-KIND. Students VOC DEDUCT 8.00
NET REGULAR & SPECIAL 289.00
DISTRICT DIV. I 305.00
(Table continued on following page.) DISTRICT DIV. II 334.0072

TABLE 7 (Continued)UNIT ALLOTMENT BASED ON ENROLLMENTS REPORTED BY LOCAL SCHOOL DISTRICTS
AS OF SEPTEMBER 30, 2006
(37) DELMAR SCHOOL DISTRICT
KINDERGARTEN Grades 1-3 Grades 4-6 Grades 7-12 Total Regular
Enrollment 0.00 0.00 153.28 810.24 963.52
Units 0.00 0.00 8.00 41.00 49.00
EMD ED LD TMD SMD OHI OI HHPD VI PS AUT DB TBI ILC Total Special
Enrollment 8.00 1.07 68.79 0.00 0.00 10.87 0.00 0.00 0.00 1.00 0.00 0.00 1.07 15.68 106.48
Units 1.00 0.00 9.00 0.00 0.00 2.00 0.00 0.00 0.00 0.00 0.00 0.00 0.00 2.00 14.00
VOC. DIV. I VOC. DIV. II VOC. DIV. OTHERUnits 10.00 26.00 0.00 TOTAL REGULAR & SPECIAL ENROLLMENT 1,070.00
TOTAL REGULAR & SPECIAL 63.00
*Includes 0 PRE-KIND. Students VOC DEDUCT 5.00
NET REGULAR & SPECIAL 58.00
DISTRICT DIV. I 68.00
DISTRICT DIV. II 84.00
(36) INDIAN RIVER SCHOOL DISTRICT
KINDERGARTEN Grades 1-3 Grades 4-6 Grades 7-12 Total Regular
Enrollment 651.00 1,679.30 1,596.75 2,910.33 6,837.38
Units 19.00 97.00 80.00 146.00 342.00
EMD ED LD TMD SMD OHI OI HHPD VI PS AUT DB TBI ILC Total Special
Enrollment 11.57 21.87 806.44 61.00 15.00 123.47 51.20 12.07 0.00 2.00 4.00 16.00 2.00 174.00 1,300.62
Units 1.00 2.00 101.00 10.00 2.00 21.00 9.00 2.00 0.00 1.00 1.00 4.00 0.00 20.00 174.00
VOC. DIV. I VOC. DIV. II VOC. DIV. OTHERUnits 26.00 74.00 0.00 TOTAL REGULAR & SPECIAL ENROLLMENT 8,138.00
TOTAL REGULAR & SPECIAL 516.00
*Includes 95 PRE-KIND. Students VOC DEDUCT 13.00
NET REGULAR & SPECIAL 503.00
DISTRICT DIV. I 529.00
(Table continued on following page.) DISTRICT DIV. II 577.0073

TABLE 7 (Continued)UNIT ALLOTMENT BASED ON ENROLLMENTS REPORTED BY LOCAL SCHOOL DISTRICTS
AS OF SEPTEMBER 30, 2006
(16) LAUREL SCHOOL DISTRICT
KINDERGARTEN Grades 1-3 Grades 4-6 Grades 7-12 Total Regular
Enrollment 150.00 462.00 452.00 754.23 1,818.23
Units 9.00 27.00 23.00 38.00 97.00
EMD ED LD TMD SMD OHI OI HHPD VI PS AUT DB TBI ILC Total Special
Enrollment 54.00 15.74 133.03 6.00 0.00 18.00 0.00 3.00 0.00 0.00 10.00 0.00 0.00 18.00 257.77
Units 4.00 2.00 17.00 1.00 0.00 3.00 0.00 0.00 0.00 0.00 2.00 0.00 0.00 2.00 31.00
VOC. DIV. I VOC. DIV. II VOC. DIV. OTHERUnits 5.00 13.00 0.00 TOTAL REGULAR & SPECIAL ENROLLMENT 2,076.00
TOTAL REGULAR & SPECIAL 128.00
*Includes 8 PRE-KIND. Students VOC DEDUCT 2.00
NET REGULAR & SPECIAL 126.00
DISTRICT DIV. I 131.00
DISTRICT DIV. II 139.00
(23) SEAFORD SCHOOL DISTRICT
KINDERGARTEN Grades 1-3 Grades 4-6 Grades 7-12 Total Regular
Enrollment 278.00 801.00 616.00 1,114.00 2,809.00
Units 16.00 46.00 31.00 56.00 149.00
EMD ED LD TMD SMD OHI OI HHPD VI PS AUT DB TBI ILC Total Special
Enrollment 23.00 12.00 300.00 6.00 1.00 41.00 22.00 7.00 1.00 4.00 16.00 0.00 4.00 53.00 490.00
Units 2.00 1.00 37.00 1.00 0.00 7.00 4.00 1.00 0.00 0.00 4.00 0.00 1.00 6.00 64.00
VOC. DIV. I VOC. DIV. II VOC. DIV. OTHERUnits 12.00 34.00 0.00 TOTAL REGULAR & SPECIAL ENROLLMENT 3,299.00
TOTAL REGULAR & SPECIAL 213.00
*Includes 9 PRE-KIND. Students VOC DEDUCT 6.00
NET REGULAR & SPECIAL 207.00
DISTRICT DIV. I 219.00
(Table continued on following page.) DISTRICT DIV. II 241.0074

TABLE 7 (Continued)UNIT ALLOTMENT BASED ON ENROLLMENTS REPORTED BY LOCAL SCHOOL DISTRICTS
AS OF SEPTEMBER 30, 2006
(40) SUSSEX TECHNICAL SCHOOL DISTRICT
KINDERGARTEN Grades 1-3 Grades 4-6 Grades 7-12 Total Regular
Enrollment 0.00 0.00 0.00 1,095.00 1,095.00
Units 0.00 0.00 0.00 55.00 55.00
EMD ED LD TMD SMD OHI OI HHPD VI PS AUT DB TBI ILC Total Special
Enrollment 0.00 9.00 107.00 0.00 0.00 16.00 0.00 0.00 0.00 0.00 0.00 0.00 0.00 0.00 132.00
Units 0.00 1.00 13.00 0.00 0.00 3.00 0.00 0.00 0.00 0.00 0.00 0.00 0.00 0.00 17.00
VOC. DIV. I VOC. DIV. II VOC. DIV. OTHERUnits 41.00 121.00 0.00 TOTAL REGULAR & SPECIAL ENROLLMENT 1,227.00
TOTAL REGULAR & SPECIAL 72.00
*Includes 0 PRE-KIND. Students VOC DEDUCT 20.00
NET REGULAR & SPECIAL 52.00
DISTRICT DIV. I 93.00
DISTRICT DIV. II 173.00
(35) WOODBRIDGE SCHOOL DISTRICT
KINDERGARTEN Grades 1-3 Grades 4-6 Grades 7-12 Total Regular
Enrollment 170.00 433.67 450.20 695.31 1,749.18
Units 10.00 25.00 23.00 35.00 93.00
EMD ED LD TMD SMD OHI OI HHPD VI PS AUT DB TBI ILC Total Special
Enrollment 8.00 5.33 148.46 0.00 0.00 6.00 5.00 0.03 1.00 0.00 0.00 0.00 0.00 14.00 187.82
Units 1.00 1.00 19.00 0.00 0.00 1.00 1.00 0.00 0.00 0.00 0.00 0.00 0.00 2.00 25.00
VOC. DIV. I VOC. DIV. II VOC. DIV. OTHERUnits 11.00 24.00 0.00 TOTAL REGULAR & SPECIAL ENROLLMENT 1,937.00
TOTAL REGULAR & SPECIAL 118.00
*Includes 10 PRE-KIND. Students VOC DEDUCT 5.00
NET REGULAR & SPECIAL 113.00
DISTRICT DIV. I 124.00
(Table continued on following page.) DISTRICT DIV. II 137.0075

TABLE 7 (Continued)UNIT ALLOTMENT BASED ON ENROLLMENTS REPORTED BY LOCAL SCHOOL DISTRICTS
AS OF SEPTEMBER 30, 2006
(70) CHARTER SCHOOL OF WILMINGTON
KINDERGARTEN Grades 1-3 Grades 4-6 Grades 7-12 Total Regular
Enrollment 0.00 0.00 0.00 948.00 948.00
Units 0.00 0.00 0.00 47.40 47.40
EMD ED LD TMD SMD OHI OI HHPD VI PS AUT DB TBI ILC Total Special
Enrollment 0.00 0.00 0.00 0.00 0.00 0.00 0.00 0.00 0.00 0.00 0.00 0.00 0.00 0.00 0.00
Units 0.00 0.00 0.00 0.00 0.00 0.00 0.00 0.00 0.00 0.00 0.00 0.00 0.00 0.00 0.00
VOC. DIV. I VOC. DIV. II VOC. DIV. OTHERUnits 0.00 0.00 0.00 TOTAL REGULAR & SPECIAL ENROLLMENT 948.00
TOTAL REGULAR & SPECIAL 47.40
*Includes 0 PRE-KIND. Students VOC DEDUCT 0.00
NET REGULAR & SPECIAL 47.40
DISTRICT DIV. I 47.40
DISTRICT DIV. II 47.40
(79) DELAWARE MILITARY ACADEMY
KINDERGARTEN Grades 1-3 Grades 4-6 Grades 7-12 Total Regular
Enrollment 0.00 0.00 0.00 499.00 499.00
Units 0.00 0.00 0.00 24.95 24.95
EMD ED LD TMD SMD OHI OI HHPD VI PS AUT DB TBI ILC Total Special
Enrollment 2.00 1.00 12.00 0.00 0.00 3.00 0.00 1.00 0.00 0.00 0.00 0.00 0.00 0.00 19.00
Units 0.13 0.10 1.50 0.00 0.00 0.50 0.00 0.17 0.00 0.00 0.00 0.00 0.00 0.00 2.40
VOC. DIV. I VOC. DIV. II VOC. DIV. OTHERUnits 2.32 6.50 0.00 TOTAL REGULAR & SPECIAL ENROLLMENT 518.00
TOTAL REGULAR & SPECIAL 27.35
*Includes 0 PRE-KIND. Students VOC DEDUCT 1.16
NET REGULAR & SPECIAL 26.19
DISTRICT DIV. I 28.51
(Table continued on following page.) DISTRICT DIV. II 32.6976

TABLE 7 (Continued)UNIT ALLOTMENT BASED ON ENROLLMENTS REPORTED BY LOCAL SCHOOL DISTRICTS
AS OF SEPTEMBER 30, 2006
(72) EAST SIDE CHARTER SCHOOL
KINDERGARTEN Grades 1-3 Grades 4-6 Grades 7-12 Total Regular
Enrollment 49.00 120.00 46.00 18.00 233.00
Units 2.82 6.90 2.30 0.90 12.91
EMD ED LD TMD SMD OHI OI HHPD VI PS AUT DB TBI ILC Total Special
Enrollment 5.00 2.00 7.00 0.00 0.00 0.00 1.00 0.00 0.00 0.00 0.00 0.00 0.00 0.00 15.00
Units 0.33 0.20 0.88 0.00 0.00 0.00 0.17 0.00 0.00 0.00 0.00 0.00 0.00 0.00 1.58
VOC. DIV. I VOC. DIV. II VOC. DIV. OTHERUnits 0.00 0.00 0.00 TOTAL REGULAR & SPECIAL ENROLLMENT 248.00
TOTAL REGULAR & SPECIAL 14.49
*Includes 0 PRE-KIND. Students VOC DEDUCT 0.00
NET REGULAR & SPECIAL 14.49
DISTRICT DIV. I 14.49
DISTRICT DIV. II 14.49
(80) Family Foundation Academy
KINDERGARTEN Grades 1-3 Grades 4-6 Grades 7-12 Total Regular
Enrollment 0.00 215.40 0.00 0.00 215.40
Units 0.00 12.38 0.00 0.00 12.38
EMD ED LD TMD SMD OHI OI HHPD VI PS AUT DB TBI ILC Total Special
Enrollment 2.00 0.00 10.00 0.00 0.00 1.60 1.00 0.00 0.00 0.00 0.00 0.00 0.00 0.00 14.60
Units 0.13 0.00 1.25 0.00 0.00 0.27 0.17 0.00 0.00 0.00 0.00 0.00 0.00 0.00 1.82
VOC. DIV. I VOC. DIV. II VOC. DIV. OTHERUnits 0.00 0.00 0.00 TOTAL REGULAR & SPECIAL ENROLLMENT 230.00
TOTAL REGULAR & SPECIAL 14.20
*Includes 0 PRE-KIND. Students VOC DEDUCT 0.00
NET REGULAR & SPECIAL 14.20
DISTRICT DIV. I 14.20
(Table continued on following page.) DISTRICT DIV. II 14.2077

TABLE 7 (Continued)UNIT ALLOTMENT BASED ON ENROLLMENTS REPORTED BY LOCAL SCHOOL DISTRICTS
AS OF SEPTEMBER 30, 2006
(82) KUUMBA ACADEMY CHARTER SCHOOL
KINDERGARTEN Grades 1-3 Grades 4-6 Grades 7-12 Total Regular
Enrollment 51.00 122.00 65.00 0.00 238.00
Units 2.93 7.01 3.25 0.00 13.19
EMD ED LD TMD SMD OHI OI HHPD VI PS AUT DB TBI ILC Total Special
Enrollment 0.00 0.00 16.00 0.00 0.00 1.00 0.00 0.00 0.00 0.00 0.00 0.00 0.00 0.00 17.00
Units 0.00 0.00 2.00 0.00 0.00 0.17 0.00 0.00 0.00 0.00 0.00 0.00 0.00 0.00 2.17
VOC. DIV. I VOC. DIV. II VOC. DIV. OTHERUnits 0.00 0.00 0.00 TOTAL REGULAR & SPECIAL ENROLLMENT 255.00
TOTAL REGULAR & SPECIAL 15.36
*Includes 0 PRE-KIND. Students VOC DEDUCT 0.00
NET REGULAR & SPECIAL 15.36
DISTRICT DIV. I 15.36
DISTRICT DIV. II 15.36
(84) MARION T. ACADEMY CHARTER SCHOOL
KINDERGARTEN Grades 1-3 Grades 4-6 Grades 7-12 Total Regular
Enrollment 114.00 195.00 114.00 76.00 499.00
Units 7.00 11.00 6.00 4.00 28.00
EMD ED LD TMD SMD OHI OI HHPD VI PS AUT DB TBI ILC Total Special
Enrollment 4.00 0.00 29.00 0.00 0.00 4.00 0.00 0.00 0.00 0.00 0.00 0.00 0.00 0.00 37.00
Units 0.00 0.00 4.00 0.00 0.00 1.00 0.00 0.00 0.00 0.00 0.00 0.00 0.00 0.00 5.00
VOC. DIV. I VOC. DIV. II VOC. DIV. OTHERUnits 0.00 0.00 0.00 TOTAL REGULAR & SPECIAL ENROLLMENT 536.00
TOTAL REGULAR & SPECIAL 33.00
*Includes 0 PRE-KIND. Students VOC DEDUCT 0.00
NET REGULAR & SPECIAL 33.00
DISTRICT DIV. I 33.00
(Table continued on following page.) DISTRICT DIV. II 33.0078

TABLE 7 (Continued)UNIT ALLOTMENT BASED ON ENROLLMENTS REPORTED BY LOCAL SCHOOL DISTRICTS
AS OF SEPTEMBER 30, 2006
(75) Maurice J. Moyer Academy
KINDERGARTEN Grades 1-3 Grades 4-6 Grades 7-12 Total Regular
Enrollment 0.00 0.00 110.89 121.74 232.63
Units 0.00 0.00 6.00 6.00 12.00
EMD ED LD TMD SMD OHI OI HHPD VI PS AUT DB TBI ILC Total Special
Enrollment 5.81 0.00 20.75 0.00 0.00 5.81 0.00 0.00 0.00 0.00 0.00 0.00 0.00 0.00 32.37
Units 0.00 0.00 3.00 0.00 0.00 1.00 0.00 0.00 0.00 0.00 0.00 0.00 0.00 0.00 4.00
VOC. DIV. I VOC. DIV. II VOC. DIV. OTHERUnits 0.00 0.00 0.00 TOTAL REGULAR & SPECIAL ENROLLMENT 265.00
TOTAL REGULAR & SPECIAL 16.00
*Includes 0 PRE-KIND. Students VOC DEDUCT 0.00
NET REGULAR & SPECIAL 16.00
DISTRICT DIV. I 16.00
DISTRICT DIV. II 16.00
(88) MOT CHARTER SCHOOL
KINDERGARTEN Grades 1-3 Grades 4-6 Grades 7-12 Total Regular
Enrollment 72.00 207.00 198.00 134.00 611.00
Units 4.00 12.00 10.00 7.00 33.00
EMD ED LD TMD SMD OHI OI HHPD VI PS AUT DB TBI ILC Total Special
Enrollment 2.00 0.00 45.00 0.00 0.00 14.00 0.00 0.00 0.00 0.00 3.00 0.00 0.00 0.00 64.00
Units 0.00 0.00 6.00 0.00 0.00 2.00 0.00 0.00 0.00 0.00 1.00 0.00 0.00 0.00 9.00
VOC. DIV. I VOC. DIV. II VOC. DIV. OTHERUnits 1.00 4.00 0.00 TOTAL REGULAR & SPECIAL ENROLLMENT 675.00
TOTAL REGULAR & SPECIAL 42.00
*Includes 0 PRE-KIND. Students VOC DEDUCT 0.00
NET REGULAR & SPECIAL 42.00
DISTRICT DIV. I 43.00
(Table continued on following page.) DISTRICT DIV. II 46.0079

TABLE 7 (Continued)UNIT ALLOTMENT BASED ON ENROLLMENTS REPORTED BY LOCAL SCHOOL DISTRICTS
AS OF SEPTEMBER 30, 2006
(89) NEWARK CHARTER SCHOOL
KINDERGARTEN Grades 1-3 Grades 4-6 Grades 7-12 Total Regular
Enrollment 0.00 0.00 311.00 311.00 622.00
Units 0.00 0.00 16.00 16.00 32.00
EMD ED LD TMD SMD OHI OI HHPD VI PS AUT DB TBI ILC Total Special
Enrollment 0.00 0.00 15.00 0.00 0.00 10.00 0.00 0.00 0.00 1.00 0.00 0.00 0.00 0.00 26.00
Units 0.00 0.00 2.00 0.00 0.00 2.00 0.00 0.00 0.00 0.00 0.00 0.00 0.00 0.00 4.00
VOC. DIV. I VOC. DIV. II VOC. DIV. OTHERUnits 0.00 0.00 0.00 TOTAL REGULAR & SPECIAL ENROLLMENT 648.00
TOTAL REGULAR & SPECIAL 36.00
*Includes 0 PRE-KIND. Students VOC DEDUCT 0.00
NET REGULAR & SPECIAL 36.00
DISTRICT DIV. I 36.00
DISTRICT DIV. II 36.00
(86) Odyssey Charter School District
KINDERGARTEN Grades 1-3 Grades 4-6 Grades 7-12 Total Regular
Enrollment 71.00 49.00 0.00 0.00 120.00
Units 4.08 2.82 0.00 0.00 6.90
EMD ED LD TMD SMD OHI OI HHPD VI PS AUT DB TBI ILC Total Special
Enrollment 0.00 0.00 2.00 0.00 0.00 0.00 1.00 0.00 0.00 0.00 0.00 0.00 0.00 0.00 3.00
Units 0.00 0.00 0.25 0.00 0.00 0.00 0.17 0.00 0.00 0.00 0.00 0.00 0.00 0.00 0.42
VOC. DIV. I VOC. DIV. II VOC. DIV. OTHERUnits 0.00 0.00 0.00 TOTAL REGULAR & SPECIAL ENROLLMENT 123.00
TOTAL REGULAR & SPECIAL 7.31
*Includes 0 PRE-KIND. Students VOC DEDUCT 0.00
NET REGULAR & SPECIAL 7.31
DISTRICT DIV. I 7.31
(Table continued on following page.) DISTRICT DIV. II 7.3180

TABLE 7 (Continued)UNIT ALLOTMENT BASED ON ENROLLMENTS REPORTED BY LOCAL SCHOOL DISTRICTS
AS OF SEPTEMBER 30, 2006
(83) Pencader Business and Finance Charter High School
KINDERGARTEN Grades 1-3 Grades 4-6 Grades 7-12 Total Regular
Enrollment 0.00 0.00 0.00 310.00 310.00
Units 0.00 0.00 0.00 15.50 15.50
EMD ED LD TMD SMD OHI OI HHPD VI PS AUT DB TBI ILC Total Special
Enrollment 2.00 0.00 12.00 0.00 0.00 2.00 0.00 0.00 0.00 0.00 0.00 0.00 0.00 0.00 16.00
Units 0.13 0.00 1.50 0.00 0.00 0.33 0.00 0.00 0.00 0.00 0.00 0.00 0.00 0.00 1.97
VOC. DIV. I VOC. DIV. II VOC. DIV. OTHERUnits 5.76 10.26 0.00 TOTAL REGULAR & SPECIAL ENROLLMENT 326.00
TOTAL REGULAR & SPECIAL 17.47
*Includes 0 PRE-KIND. Students VOC DEDUCT 2.88
NET REGULAR & SPECIAL 14.59
DISTRICT DIV. I 20.34
DISTRICT DIV. II 24.85
(76) THOMAS A. EDISON CHARTER SCHOOL
KINDERGARTEN Grades 1-3 Grades 4-6 Grades 7-12 Total Regular
Enrollment 134.00 338.00 211.00 114.00 797.00
Units 8.00 19.00 11.00 6.00 44.00
EMD ED LD TMD SMD OHI OI HHPD VI PS AUT DB TBI ILC Total Special
Enrollment 1.00 0.00 37.00 0.00 0.00 6.00 1.00 0.00 0.00 0.00 0.00 0.00 0.00 0.00 45.00
Units 0.00 0.00 5.00 0.00 0.00 1.00 0.00 0.00 0.00 0.00 0.00 0.00 0.00 0.00 6.00
VOC. DIV. I VOC. DIV. II VOC. DIV. OTHERUnits 0.00 0.00 0.00 TOTAL REGULAR & SPECIAL ENROLLMENT 842.00
TOTAL REGULAR & SPECIAL 50.00
*Includes 0 PRE-KIND. Students VOC DEDUCT 0.00
NET REGULAR & SPECIAL 50.00
DISTRICT DIV. I 50.00
(Table continued on following page.) DISTRICT DIV. II 50.0081
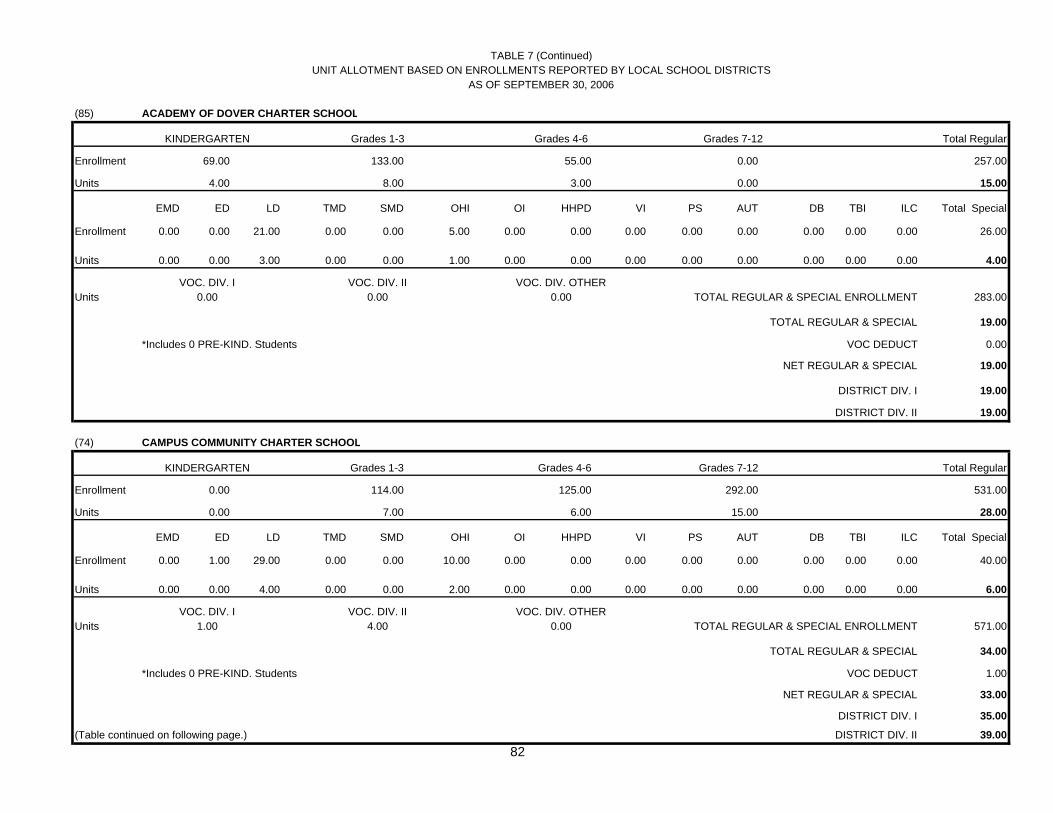
TABLE 7 (Continued)UNIT ALLOTMENT BASED ON ENROLLMENTS REPORTED BY LOCAL SCHOOL DISTRICTS
AS OF SEPTEMBER 30, 2006
(85) ACADEMY OF DOVER CHARTER SCHOOL
KINDERGARTEN Grades 1-3 Grades 4-6 Grades 7-12 Total Regular
Enrollment 69.00 133.00 55.00 0.00 257.00
Units 4.00 8.00 3.00 0.00 15.00
EMD ED LD TMD SMD OHI OI HHPD VI PS AUT DB TBI ILC Total Special
Enrollment 0.00 0.00 21.00 0.00 0.00 5.00 0.00 0.00 0.00 0.00 0.00 0.00 0.00 0.00 26.00
Units 0.00 0.00 3.00 0.00 0.00 1.00 0.00 0.00 0.00 0.00 0.00 0.00 0.00 0.00 4.00
VOC. DIV. I VOC. DIV. II VOC. DIV. OTHERUnits 0.00 0.00 0.00 TOTAL REGULAR & SPECIAL ENROLLMENT 283.00
TOTAL REGULAR & SPECIAL 19.00
*Includes 0 PRE-KIND. Students VOC DEDUCT 0.00
NET REGULAR & SPECIAL 19.00
DISTRICT DIV. I 19.00
DISTRICT DIV. II 19.00
(74) CAMPUS COMMUNITY CHARTER SCHOOL
KINDERGARTEN Grades 1-3 Grades 4-6 Grades 7-12 Total Regular
Enrollment 0.00 114.00 125.00 292.00 531.00
Units 0.00 7.00 6.00 15.00 28.00
EMD ED LD TMD SMD OHI OI HHPD VI PS AUT DB TBI ILC Total Special
Enrollment 0.00 1.00 29.00 0.00 0.00 10.00 0.00 0.00 0.00 0.00 0.00 0.00 0.00 0.00 40.00
Units 0.00 0.00 4.00 0.00 0.00 2.00 0.00 0.00 0.00 0.00 0.00 0.00 0.00 0.00 6.00
VOC. DIV. I VOC. DIV. II VOC. DIV. OTHERUnits 1.00 4.00 0.00 TOTAL REGULAR & SPECIAL ENROLLMENT 571.00
TOTAL REGULAR & SPECIAL 34.00
*Includes 0 PRE-KIND. Students VOC DEDUCT 1.00
NET REGULAR & SPECIAL 33.00
DISTRICT DIV. I 35.00
(Table continued on following page.) DISTRICT DIV. II 39.0082

TABLE 7 (Continued)UNIT ALLOTMENT BASED ON ENROLLMENTS REPORTED BY LOCAL SCHOOL DISTRICTS
AS OF SEPTEMBER 30, 2006
(71) POSITIVE OUTCOMES CHARTER SCHOOL
KINDERGARTEN Grades 1-3 Grades 4-6 Grades 7-12 Total Regular
Enrollment 0.00 0.00 0.00 53.00 53.00
Units 0.00 0.00 0.00 3.00 3.00
EMD ED LD TMD SMD OHI OI HHPD VI PS AUT DB TBI ILC Total Special
Enrollment 9.00 7.00 30.00 0.00 0.00 23.00 0.00 0.00 0.00 0.00 0.00 0.00 0.00 0.00 69.00
Units 1.00 1.00 4.00 0.00 0.00 4.00 0.00 0.00 0.00 0.00 0.00 0.00 0.00 0.00 10.00
VOC. DIV. I VOC. DIV. II VOC. DIV. OTHERUnits 1.00 4.00 0.00 TOTAL REGULAR & SPECIAL ENROLLMENT 122.00
TOTAL REGULAR & SPECIAL 13.00
*Includes 0 PRE-KIND. Students VOC DEDUCT 0.00
NET REGULAR & SPECIAL 13.00
DISTRICT DIV. I 14.00
DISTRICT DIV. II 17.00
(87) PROVIDENCE CREEK ACADEMY CHARTER SCHOOL
KINDERGARTEN Grades 1-3 Grades 4-6 Grades 7-12 Total Regular
Enrollment 69.00 206.00 203.00 141.00 619.00
Units 4.00 12.00 10.00 7.00 33.00
EMD ED LD TMD SMD OHI OI HHPD VI PS AUT DB TBI ILC Total Special
Enrollment 0.00 0.00 37.00 0.00 0.00 10.00 1.00 0.00 0.00 0.00 0.00 0.00 0.00 0.00 48.00
Units 0.00 0.00 5.00 0.00 0.00 2.00 0.00 0.00 0.00 0.00 0.00 0.00 0.00 0.00 7.00
VOC. DIV. I VOC. DIV. II VOC. DIV. OTHERUnits 0.00 0.00 0.00 TOTAL REGULAR & SPECIAL ENROLLMENT 667.00
TOTAL REGULAR & SPECIAL 40.00
*Includes 0 PRE-KIND. Students VOC DEDUCT 0.00
NET REGULAR & SPECIAL 40.00
DISTRICT DIV. I 40.00
(Table continued on following page.) DISTRICT DIV. II 40.0083

TABLE 7 (Continued)UNIT ALLOTMENT BASED ON ENROLLMENTS REPORTED BY LOCAL SCHOOL DISTRICTS
AS OF SEPTEMBER 30, 2006
(77) SUSSEX ACADEMY OF ARTS AND SCIENCES
KINDERGARTEN Grades 1-3 Grades 4-6 Grades 7-12 Total Regular
Enrollment 0.00 0.00 113.00 195.00 308.00
Units 0.00 0.00 6.00 10.00 16.00
EMD ED LD TMD SMD OHI OI HHPD VI PS AUT DB TBI ILC Total Special
Enrollment 0.00 0.00 8.00 0.00 0.00 6.00 0.00 1.00 0.00 0.00 0.00 0.00 0.00 0.00 15.00
Units 0.00 0.00 1.00 0.00 0.00 1.00 0.00 0.00 0.00 0.00 0.00 0.00 0.00 0.00 2.00
VOC. DIV. I VOC. DIV. II VOC. DIV. OTHERUnits 0.00 0.00 0.00 TOTAL REGULAR & SPECIAL ENROLLMENT 323.00
TOTAL REGULAR & SPECIAL 18.00
*Includes 0 PRE-KIND. Students VOC DEDUCT 0.00
NET REGULAR & SPECIAL 18.00
DISTRICT DIV. I 18.00
DISTRICT DIV. II 18.00
STATE TOTAL INCLUDING DAFB
KINDERGARTEN Grades 1-3 Grades 4-6 Grades 7-12 Total Regular
Enrollment 7,980.11 25,491.20 23,507.48 50,218.61 107,197.40
Units 313.83 1,470.10 1,182.55 2,517.75 5,484.23
EMD ED LD TMD SMD OHI OI HHPD VI PS AUT DB TBI ILC Total Special
Enrollment 907.92 422.12 8,059.29 477.00 101.00 1,755.59 453.39 247.34 13.00 19.36 686.36 68.00 23.09 1,846.14 15,079.60
Units 65.73 45.30 1,013.38 78.00 16.00 297.27 78.50 42.17 0.00 3.00 173.00 17.00 4.00 216.00 2,049.34
VOC. DIV. I VOC. DIV. II VOC. DIV. OTHERUnits 620.07 1,727.76 0.00 TOTAL REGULAR & SPECIAL ENROLLMENT 122,277.00
*Includes 674 PRE-KIND. Students TOTAL REGULAR & SPECIAL 7,533.57
VOC DEDUCT 302.04
NET REGULAR & SPECIAL 7,231.54
DISTRICT DIV. I 7,851.61
(Table continued on following page.) DISTRICT DIV. II 8,959.2984

TABLE 7 (Continued)UNIT ALLOTMENT BASED ON ENROLLMENTS REPORTED BY LOCAL SCHOOL DISTRICTS
AS OF SEPTEMBER 30, 2006
STATE TOTAL EXCLUDING DAFB
KINDERGARTEN Grades 1-3 Grades 4-6 Grades 7-12 Total Regular
Enrollment 7,939.11 25,342.27 23,409.88 50,110.83 106,802.09
Units 312.83 1,461.10 1,177.55 2,512.75 5,464.23
EMD ED LD TMD SMD OHI OI HHPD VI PS AUT DB TBI ILC Total Special
Enrollment 905.92 422.12 8,038.98 477.00 101.00 1,752.42 453.32 247.27 13.00 19.36 686.29 68.00 23.09 1,846.14 15,053.91
Units 65.73 45.30 1,010.38 78.00 16.00 296.27 78.50 42.17 0.00 3.00 173.00 17.00 4.00 216.00 2,045.34
VOC. DIV. I VOC. DIV. II VOC. DIV. OTHERUnits 619.07 1,725.76 0.00 TOTAL REGULAR & SPECIAL ENROLLMENT 121,856.00
*Includes 674 PRE-KIND. Students TOTAL REGULAR & SPECIAL 7,509.57
VOC DEDUCT 302.04
NET REGULAR & SPECIAL 7,207.54
DISTRICT DIV. I 7,826.61
Source: Technology Management and Design DISTRICT DIV. II 8,933.29
85

86
NOTES RELATING TO 2006 UNIT ALLOTMENTS
APPOQUINIMINK Low Incident Program .................62 students (8 units): EMD 13 (1); TMD 25 (4); SMD 7 (1); OHI 3 (0); OI 9 (1); AUT 5 (1); BRANDYWINE C.W. Bush....................................46 students (5 units): EMD 9 (1); ED 1 (0); LD 26 (3); TMD 3 (0) OHI 2 (0); OI 4 (1); DB 1 (0) CHRISTINA Brennen School............................315 students (79 units): AUT 315 (79); Deduct (1); Voc. I (3); Voc. II (6); Total Div. I (80); Div. II (83) Margaret S. Sterck .......................130 students (23 units): HHPD 114 (19); D/B 16 (4) REACH........................................ 124 students (17 units): EMD 28 (2); TMD 49 (8); SMD 20 (3); OHI 8 (1); OI 19 (3); REG 2 (0) Christina ILC………………….. 653 students (82 units): ILC 493 (57); TMD 3 (0); OHI 83 (14); OI 55 (9); HHPD 7 (1); VI 2 (0); TBI 4 (1); REG 6 (0); Deduct (1); Voc
I (3); Voc II (6); Total Div. I (85); Div. II (88) Alternative Programs………..… 99 students (5 units): EMD 5 (0); ED 12 (1); LD 9 (1); OHI 3 (0); REG 70 (3) COLONIAL* J.G. Leach ....................................108 students (20 units): PTST 0 (1); EMD 5 (0); TMD 17 (3); SMD 10 (2); OHI 12 (2); OI 45 (7); PS 1 (0); AUT 3 (1); DB 11 (3);
TBI 4 (1); Deduct (5); Voc. I (10); Voc. II (30); Total Div. I (24); Div. II (44); (includes Ex. Child. Voc. Units) McCullough ILC…………….….142 students (18 units): ILC 117 (14); OHI 22 (4); OI 2 (0); HHPD 1 (0)
NEW CASTLE CO VT Delcastle ILC……………….…. 34 students (4 units): ILC 34 (4); Deduct (1); Voc. I (2); Voc. II (7); Total Div. I (5); Div. II (10); (includes Ex. Child. Voc. Units). In addition to the 3,794 Regular and Special students reported, there are 44 part-time students who are enrolled in ......................................................vocational courses and who generate 50,400 Div. I voc. minutes (2 units) RED CLAY First State School .........................16 students (3 units): OHI 16 (3) Meadowood……………………..147 students (24 units): EMD 9 (1); TMD 103 (17); SMD 24 (4); OHI 4 (1); OI 1 (0); AUT 2 (0); DB 4 (1); Deduct (1); Voc I (3);
Voc II (8); Total Div. I (26); Div. II (31) Community School ......................38 students (2 units): REG (1-3) 0 (0); REG (4-6) 0 (0); REG (7-12) 38 (2); Deduct (0); Voc I (0); Voc II (1); Tot Div. I (4); Tot Div. II
(5) Richardson Park ILC ................... 207 students (23 units): ILC 185 (21); OHI 13 (2); OI 3 (0); HHPD 3 (0); PS 1 (0); AUT 1 (0); TBI 1 (0) The Central School ......................107 students (12 units): ILC 101 (12); TMD 2 (0); OHI 3 (0); TBI 1 (0); Deduct (0); Voc I (1); Voc II (3); Tot Div. I (13); Tot Div. II
(15) CAESAR RODNEY* John S. Charlton...........................218 students (42 units): EMD 6 (0); TMD 108 (18); SMD 23 (4); OI 9 (1); HHPD 1 (0); AUT 64 (16); DB 7 (2); PTST 0 (1); ...................................................... Deduct (1); Voc. I (3); Voc. II (9); Total Div. I (43); Div. II (49) Kent Co. Elem. ILC .....................52 students (6 units): ILC 52 (6) CAPITAL Kent Co. Community...................89 students (17 units): TMD 6 (1); OI 54 (9); HHPD 2 (0); AUT 16 (4); DB 11 (3) Kent Co. Sec. ILC........................50 students (6 units): ILC 44 (5); OHI 6 (1); Deduct (0); Voc. I (Ex. Child. Units) (1); Voc. II (3); Total Div. I (7); ......................................................Div. II (9) LAKE FOREST Early Child. Ctr............................9 students (1 units): OHI 7 (1); OI 1 (0); HHPD 1 (0) CAPE HENLOPEN Sussex Consortium ......................150 students (33 units): ILC 19 (2); TMD 5 (1); OHI 2 (0); HHPD 3 (0); AUT 121 (30); Deduct (0); Voc. I (1); Voc ...................................................... II (4); Total Div I (35); Div. II (38) INDIAN RIVER* Howard T. Ennis ..........................127 students (23 units): TMD 60 (10); SMD 15 (2); OI 34 (6); HHPD 2 (0); DB 16 (4); PTST 0 (1); Deduct (1); Voc. I ...................................................... (2); Voc. II (6); Total Div. I (23); Div. II (27) SEAFORD Sussex Orthopedic .......................29 students (4 units): TMD 1 (0); SMD 1 (0); OHI 2 (0); OI 22(4); VI 1 (0); TBI 2(0) Autistic Program…………….….16 students (4 units): AUT 16(4) *County PTST Unit
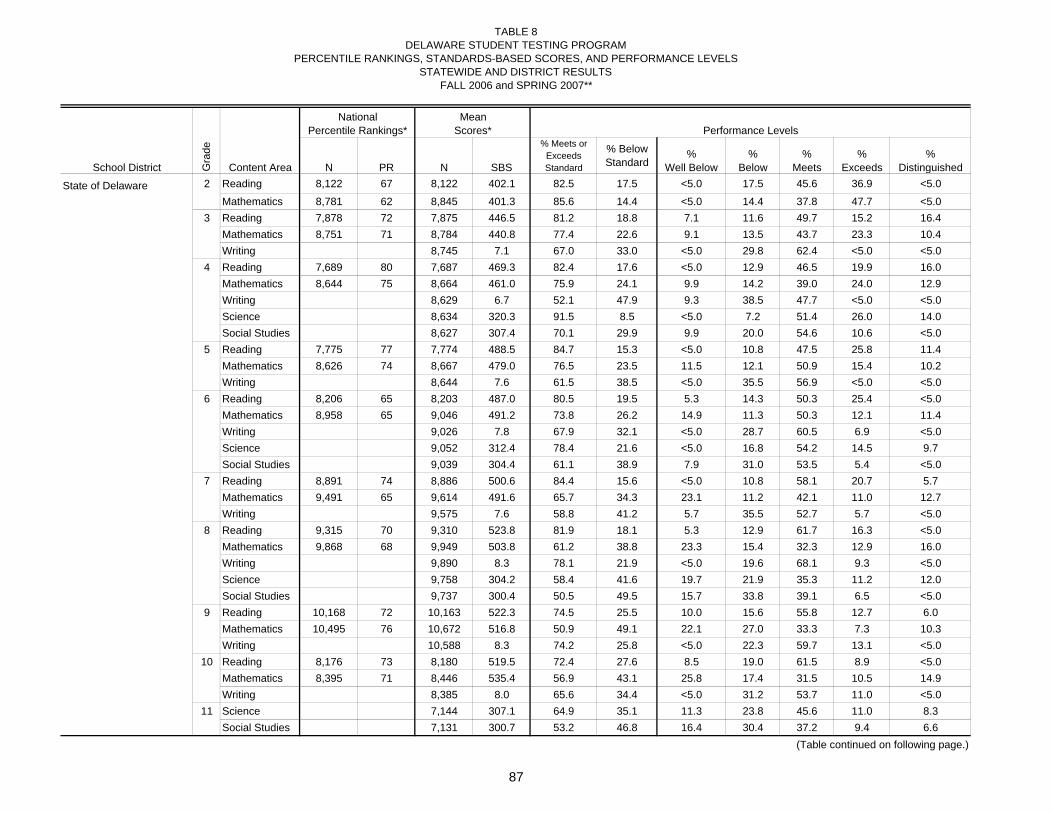
TABLE 8DELAWARE STUDENT TESTING PROGRAM
PERCENTILE RANKINGS, STANDARDS-BASED SCORES, AND PERFORMANCE LEVELSSTATEWIDE AND DISTRICT RESULTS
FALL 2006 and SPRING 2007**
School District Content Area N PR N SBS
% Meets or Exceeds Standard
% Below Standard
% Well Below
% Below
% Meets
% Exceeds
% Distinguished
State of Delaware 2 Reading 8,122 67 8,122 402.1 82.5 17.5 <5.0 17.5 45.6 36.9 <5.0
Mathematics 8,781 62 8,845 401.3 85.6 14.4 <5.0 14.4 37.8 47.7 <5.03 Reading 7,878 72 7,875 446.5 81.2 18.8 7.1 11.6 49.7 15.2 16.4
Mathematics 8,751 71 8,784 440.8 77.4 22.6 9.1 13.5 43.7 23.3 10.4Writing 8,745 7.1 67.0 33.0 <5.0 29.8 62.4 <5.0 <5.0
4 Reading 7,689 80 7,687 469.3 82.4 17.6 <5.0 12.9 46.5 19.9 16.0Mathematics 8,644 75 8,664 461.0 75.9 24.1 9.9 14.2 39.0 24.0 12.9Writing 8,629 6.7 52.1 47.9 9.3 38.5 47.7 <5.0 <5.0Science 8,634 320.3 91.5 8.5 <5.0 7.2 51.4 26.0 14.0Social Studies 8,627 307.4 70.1 29.9 9.9 20.0 54.6 10.6 <5.0
5 Reading 7,775 77 7,774 488.5 84.7 15.3 <5.0 10.8 47.5 25.8 11.4Mathematics 8,626 74 8,667 479.0 76.5 23.5 11.5 12.1 50.9 15.4 10.2Writing 8,644 7.6 61.5 38.5 <5.0 35.5 56.9 <5.0 <5.0
6 Reading 8,206 65 8,203 487.0 80.5 19.5 5.3 14.3 50.3 25.4 <5.0Mathematics 8,958 65 9,046 491.2 73.8 26.2 14.9 11.3 50.3 12.1 11.4Writing 9,026 7.8 67.9 32.1 <5.0 28.7 60.5 6.9 <5.0Science 9,052 312.4 78.4 21.6 <5.0 16.8 54.2 14.5 9.7Social Studies 9,039 304.4 61.1 38.9 7.9 31.0 53.5 5.4 <5.0
7 Reading 8,891 74 8,886 500.6 84.4 15.6 <5.0 10.8 58.1 20.7 5.7Mathematics 9,491 65 9,614 491.6 65.7 34.3 23.1 11.2 42.1 11.0 12.7Writing 9,575 7.6 58.8 41.2 5.7 35.5 52.7 5.7 <5.0
8 Reading 9,315 70 9,310 523.8 81.9 18.1 5.3 12.9 61.7 16.3 <5.0Mathematics 9,868 68 9,949 503.8 61.2 38.8 23.3 15.4 32.3 12.9 16.0Writing 9,890 8.3 78.1 21.9 <5.0 19.6 68.1 9.3 <5.0Science 9,758 304.2 58.4 41.6 19.7 21.9 35.3 11.2 12.0Social Studies 9,737 300.4 50.5 49.5 15.7 33.8 39.1 6.5 <5.0
9 Reading 10,168 72 10,163 522.3 74.5 25.5 10.0 15.6 55.8 12.7 6.0Mathematics 10,495 76 10,672 516.8 50.9 49.1 22.1 27.0 33.3 7.3 10.3Writing 10,588 8.3 74.2 25.8 <5.0 22.3 59.7 13.1 <5.0
10 Reading 8,176 73 8,180 519.5 72.4 27.6 8.5 19.0 61.5 8.9 <5.0Mathematics 8,395 71 8,446 535.4 56.9 43.1 25.8 17.4 31.5 10.5 14.9Writing 8,385 8.0 65.6 34.4 <5.0 31.2 53.7 11.0 <5.0
11 Science 7,144 307.1 64.9 35.1 11.3 23.8 45.6 11.0 8.3Social Studies 7,131 300.7 53.2 46.8 16.4 30.4 37.2 9.4 6.6
(Table continued on following page.)
87
Performance LevelsNational
Percentile Rankings*Mean
Scores*
Gra
de

TABLE 8DELAWARE STUDENT TESTING PROGRAM
PERCENTILE RANKINGS, STANDARDS-BASED SCORES, AND PERFORMANCE LEVELSSTATEWIDE AND DISTRICT RESULTS
FALL 2006 and SPRING 2007**
School District Content Area N PR N SBS
% Meets or Exceeds Standard
% Below Standard
% Well Below
% Below
% Meets
% Exceeds
% Distinguished
Performance LevelsNational
Percentile Rankings*Mean
Scores*
Gra
de
Appoquinimink 2 Reading 612 74 612 411.4 89.5 10.5 <5.0 10.5 44.0 45.6 <5.0
Mathematics 642 68 643 406.7 89.7 10.3 <5.0 10.3 37.2 52.6 <5.03 Reading 541 78 541 455.9 89.6 10.4 <5.0 6.5 49.0 20.3 20.3
Mathematics 571 78 572 450.7 85.3 14.7 <5.0 10.3 44.2 28.3 12.8Writing 572 7.7 82.0 18.0 <5.0 16.6 75.9 5.6 <5.0
4 Reading 586 85 586 476.4 87.2 12.8 <5.0 10.4 42.8 21.2 23.2Mathematics 618 78 619 466.9 82.6 17.4 <5.0 13.2 40.2 30.4 12.0Writing 619 7.5 71.1 28.9 <5.0 25.4 63.0 7.9 <5.0Science 620 326.6 >95 <5.0 <5.0 <5.0 39.0 35.0 23.4Social Studies 620 313.8 83.7 16.3 <5.0 13.1 61.0 14.5 8.2
5 Reading 556 82 555 497.3 90.6 9.4 <5.0 7.2 43.2 31.5 15.9Mathematics 583 78 584 483.9 82.2 17.8 8.4 9.4 52.7 19.5 9.9Writing 583 8.1 73.9 26.1 <5.0 24.9 66.0 7.4 <5.0
6 Reading 608 71 609 496.1 87.5 12.5 <5.0 10.0 46.0 34.8 6.7Mathematics 634 73 642 499.8 83.3 16.7 7.8 8.9 54.5 16.5 12.3Writing 642 8.1 73.5 26.5 <5.0 24.5 63.1 10.4 <5.0Science 642 317.9 89.4 10.6 <5.0 9.0 54.4 21.8 13.2Social Studies 641 308.8 74.1 25.9 <5.0 22.9 64.1 6.1 <5.0
7 Reading 603 79 603 509.3 91.2 8.8 <5.0 6.3 56.9 27.2 7.1Mathematics 623 70 623 499.4 77.8 22.2 13.0 9.1 49.9 16.1 11.9Writing 623 7.8 62.3 37.7 <5.0 35.0 52.8 8.8 <5.0
8 Reading 582 75 582 535.7 92.3 7.7 <5.0 5.8 65.1 22.5 <5.0Mathematics 600 72 600 510.0 72.0 28.0 10.5 17.5 42.3 15.8 13.8Writing 600 8.7 87.7 12.3 <5.0 11.3 71.5 15.5 <5.0Science 608 313.8 74.0 26.0 9.5 16.4 41.3 15.0 17.8Social Studies 608 306.2 65.3 34.7 7.4 27.3 52.6 7.7 <5.0
9 Reading 491 77 491 529.6 81.7 18.3 6.7 11.6 58.5 16.5 6.7Mathematics 491 81 497 523.7 59.2 40.8 16.3 24.5 36.6 10.9 11.7Writing 495 8.5 79.4 20.6 <5.0 18.6 64.0 14.7 <5.0
10 Reading 512 78 512 525.4 81.1 18.9 5.9 13.1 69.1 10.5 <5.0Mathematics 518 79 518 547.3 70.5 29.5 18.5 11.0 31.5 15.8 23.2Writing 513 8.2 70.8 29.2 <5.0 25.3 55.4 14.8 <5.0
11 Science 506 306.1 65.6 34.4 10.1 24.3 49.4 11.9 <5.0Social Studies 505 302.5 57.8 42.2 14.7 27.5 41.4 10.9 5.5
(Table continued on following page.)
88

TABLE 8DELAWARE STUDENT TESTING PROGRAM
PERCENTILE RANKINGS, STANDARDS-BASED SCORES, AND PERFORMANCE LEVELSSTATEWIDE AND DISTRICT RESULTS
FALL 2006 and SPRING 2007**
School District Content Area N PR N SBS
% Meets or Exceeds Standard
% Below Standard
% Well Below
% Below
% Meets
% Exceeds
% Distinguished
Performance LevelsNational
Percentile Rankings*Mean
Scores*
Gra
de
Brandywine 2 Reading 702 70 702 404.5 82.8 17.2 <5.0 17.2 41.5 41.3 <5.0Mathematics 741 65 742 404.1 86.7 13.3 <5.0 13.3 35.4 51.2 <5.0
3 Reading 694 74 694 447.8 81.6 18.4 8.9 9.5 46.7 15.6 19.3Mathematics 736 73 736 442.3 76.4 23.6 11.3 12.4 38.7 23.5 14.1Writing 734 7.1 69.1 30.9 <5.0 28.1 65.4 <5.0 <5.0
4 Reading 669 79 668 467.5 78.3 21.7 7.2 14.5 41.9 17.7 18.7Mathematics 705 77 706 464.5 73.2 26.8 9.9 16.9 31.2 23.1 19.0Writing 705 6.8 54.5 45.5 9.8 35.7 48.5 5.4 <5.0Science 714 318.8 88.7 11.3 <5.0 9.7 52.0 23.1 13.6Social Studies 714 305.6 65.5 34.5 12.5 22.0 50.3 11.2 <5.0
5 Reading 681 79 681 492.1 83.0 17.0 5.4 11.6 39.4 28.6 15.0Mathematics 706 79 706 485.9 78.2 21.8 11.0 10.8 44.3 16.1 17.7Writing 704 7.9 67.5 32.5 <5.0 30.3 58.5 7.7 <5.0
6 Reading 728 66 728 485.8 77.2 22.8 8.0 14.8 46.8 24.2 6.2Mathematics 760 69 762 492.7 69.6 30.4 15.9 14.6 42.5 13.1 13.9Writing 761 8.0 73.6 26.4 <5.0 23.3 65.3 7.4 <5.0Science 769 312.4 76.5 23.5 7.9 15.6 49.4 13.1 13.9Social Studies 769 303.9 57.2 42.8 11.4 31.3 47.3 6.2 <5.0
7 Reading 830 75 830 505.6 86.1 13.9 <5.0 9.0 53.3 22.9 10.0Mathematics 836 74 839 502.2 72.5 27.5 17.6 9.9 40.3 13.3 18.8Writing 838 7.9 68.4 31.6 <5.0 27.7 61.6 6.3 <5.0
8 Reading 828 70 828 523.2 79.7 20.3 7.5 12.8 57.1 17.3 5.3Mathematics 840 76 848 515.5 69.0 31.0 19.6 11.4 31.0 13.7 24.3Writing 844 8.4 82.0 18.0 <5.0 16.1 73.3 8.4 <5.0Science 827 304.5 57.0 43.0 23.1 20.0 31.4 10.5 15.0Social Studies 827 301.7 50.5 49.5 17.5 31.9 32.3 8.9 9.3
9 Reading 922 72 922 521.7 72.9 27.1 12.1 15.0 50.5 14.2 8.1Mathematics 925 78 927 517.4 52.0 48.0 23.0 25.0 32.3 7.9 11.9Writing 915 8.3 75.3 24.7 <5.0 20.8 61.1 12.6 <5.0
10 Reading 725 76 725 527.0 77.8 22.2 6.2 16.0 60.4 14.6 <5.0Mathematics 727 79 727 542.7 61.5 38.5 22.4 16.1 28.2 12.4 20.9Writing 723 8.3 74.3 25.7 <5.0 23.8 55.6 18.1 <5.0
11 Science 656 305.7 62.7 37.3 15.1 22.3 44.1 10.7 7.9Social Studies 653 300.8 53.0 47.0 19.1 27.9 33.8 10.6 8.6
(Table continued on following page.)
89

TABLE 8DELAWARE STUDENT TESTING PROGRAM
PERCENTILE RANKINGS, STANDARDS-BASED SCORES, AND PERFORMANCE LEVELSSTATEWIDE AND DISTRICT RESULTS
FALL 2006 and SPRING 2007**
School District Content Area N PR N SBS
% Meets or Exceeds Standard
% Below Standard
% Well Below
% Below
% Meets
% Exceeds
% Distinguished
Performance LevelsNational
Percentile Rankings*Mean
Scores*
Gra
de
Caesar Rodney 2 Reading 477 73 477 414.1 88.5 11.5 <5.0 11.5 42.6 45.9 <5.0Mathematics 531 70 531 413.5 90.6 9.4 <5.0 9.4 33.0 57.6 <5.0
3 Reading 486 72 486 453.1 86.0 14.0 <5.0 10.1 48.1 18.5 19.3Mathematics 555 74 555 450.1 86.5 13.5 <5.0 9.0 46.7 26.8 13.0Writing 554 7.6 79.1 20.9 <5.0 20.0 72.9 6.0 <5.0
4 Reading 453 81 453 472.8 86.8 13.2 <5.0 10.2 46.4 23.6 16.8Mathematics 522 79 522 466.2 82.6 17.4 7.5 10.0 40.0 28.4 14.2Writing 522 7.1 59.2 40.8 5.7 35.1 54.2 <5.0 <5.0Science 520 322.8 93.8 6.2 <5.0 5.0 48.8 26.9 18.1Social Studies 520 310.9 79.0 21.0 5.6 15.4 60.0 13.1 6.0
5 Reading 470 79 470 494.4 89.8 10.2 <5.0 8.9 45.7 33.0 11.1Mathematics 551 77 552 487.7 87.3 12.7 <5.0 7.8 56.5 20.5 10.3Writing 552 8.1 73.0 27.0 <5.0 27.0 67.0 5.8 <5.0
6 Reading 448 68 448 495.6 88.4 11.6 <5.0 8.5 48.4 32.6 7.4Mathematics 540 62 541 490.2 74.5 25.5 16.1 9.4 51.2 12.6 10.7Writing 540 8.2 77.6 22.4 <5.0 20.0 68.3 8.9 <5.0Science 537 314.4 80.4 19.6 <5.0 15.3 52.9 14.9 12.7Social Studies 537 307.0 68.5 31.5 6.3 25.1 57.5 8.6 <5.0
7 Reading 553 81 553 518.5 >95 <5.0 <5.0 <5.0 52.8 30.6 12.1Mathematics 611 71 611 502.9 76.6 23.4 14.2 9.2 46.6 14.9 15.1Writing 610 8.1 72.8 27.2 <5.0 25.6 63.3 8.9 <5.0
8 Reading 558 75 558 536.2 91.9 8.1 <5.0 5.6 60.6 26.5 <5.0Mathematics 603 75 603 517.0 76.6 23.4 10.9 12.4 34.8 20.6 21.2Writing 603 8.6 87.6 12.4 <5.0 11.8 72.3 13.8 <5.0Science 602 314.4 76.1 23.9 8.6 15.3 41.5 17.9 16.6Social Studies 601 309.2 71.0 29.0 5.7 23.3 51.2 11.8 8.0
9 Reading 539 78 539 530.9 83.3 16.7 5.8 10.9 61.0 17.3 5.0Mathematics 608 76 609 519.0 53.7 46.3 19.4 26.9 35.1 8.7 9.9Writing 605 8.6 81.3 18.7 <5.0 17.5 64.3 14.7 <5.0
10 Reading 430 78 430 526.4 83.5 16.5 <5.0 14.7 73.0 9.1 <5.0Mathematics 441 77 441 545.0 69.8 30.2 15.4 14.7 36.1 15.9 17.9Writing 439 8.3 73.1 26.9 <5.0 26.4 63.6 8.9 <5.0
11 Science 375 309.4 72.3 27.7 6.1 21.6 55.2 10.9 6.1Social Studies 376 303.0 58.8 41.2 9.6 31.6 47.1 9.0 <5.0
(Table continued on following page.)
90

TABLE 8DELAWARE STUDENT TESTING PROGRAM
PERCENTILE RANKINGS, STANDARDS-BASED SCORES, AND PERFORMANCE LEVELSSTATEWIDE AND DISTRICT RESULTS
FALL 2006 and SPRING 2007**
School District Content Area N PR N SBS
% Meets or Exceeds Standard
% Below Standard
% Well Below
% Below
% Meets
% Exceeds
% Distinguished
Performance LevelsNational
Percentile Rankings*Mean
Scores*
Gra
de
Cape Henlopen 2 Reading 326 68 326 405.9 79.1 20.9 <5.0 20.9 35.9 43.3 <5.0Mathematics 368 61 369 401.3 85.1 14.9 <5.0 14.9 37.4 47.7 <5.0
3 Reading 257 74 257 448.9 79.4 20.6 7.0 13.6 39.7 19.1 20.6Mathematics 295 72 295 446.4 78.0 22.0 8.5 13.6 41.4 20.7 15.9Writing 295 7.0 64.4 35.6 <5.0 31.2 59.0 5.1 <5.0
4 Reading 289 81 289 471.7 84.8 15.2 <5.0 11.8 48.1 18.7 18.0Mathematics 333 72 333 461.4 75.7 24.3 11.4 12.9 34.2 27.0 14.4Writing 330 6.3 44.2 55.8 14.2 41.5 41.8 <5.0 <5.0Science 339 321.4 91.7 8.3 <5.0 6.5 47.5 30.4 13.9Social Studies 338 306.8 73.4 26.6 10.9 15.7 60.1 9.8 <5.0
5 Reading 308 82 308 492.2 87.3 12.7 <5.0 10.7 47.4 27.6 12.3Mathematics 349 76 351 483.7 81.2 18.8 7.7 11.1 52.7 18.2 10.3Writing 351 7.8 62.1 37.9 <5.0 35.6 53.8 7.7 <5.0
6 Reading 294 65 294 486.0 81.0 19.0 <5.0 15.3 50.3 27.9 <5.0Mathematics 310 67 326 494.3 77.3 22.7 12.6 10.1 49.7 14.7 12.9Writing 326 7.6 59.8 40.2 <5.0 35.9 53.4 6.4 <5.0Science 323 314.0 84.8 15.2 <5.0 10.2 58.2 17.3 9.3Social Studies 322 305.5 65.8 34.2 7.1 27.0 58.7 6.2 <5.0
7 Reading 306 80 306 505.4 87.9 12.1 <5.0 9.5 60.1 18.3 9.5Mathematics 335 67 336 495.1 68.2 31.8 21.4 10.4 42.3 11.6 14.3Writing 333 7.5 56.2 43.8 <5.0 39.6 53.2 <5.0 <5.0
8 Reading 316 72 316 528.8 88.0 12.0 <5.0 10.1 66.8 17.1 <5.0Mathematics 342 71 344 507.4 66.3 33.7 17.4 16.3 35.2 12.8 18.3Writing 343 8.3 76.4 23.6 <5.0 22.4 63.3 12.5 <5.0Science 342 311.0 67.5 32.5 12.9 19.6 34.8 14.3 18.4Social Studies 342 303.4 56.4 43.6 12.9 30.7 43.0 7.6 5.8
9 Reading 268 76 268 531.4 80.2 19.8 5.6 14.2 56.0 16.0 8.2Mathematics 276 82 288 530.9 59.0 41.0 16.7 24.3 28.8 10.8 19.4Writing 287 8.5 77.0 23.0 <5.0 20.6 51.6 24.4 <5.0
10 Reading 233 76 233 527.1 75.1 24.9 10.3 14.6 57.1 12.4 5.6Mathematics 247 73 247 540.7 63.2 36.8 24.3 12.6 31.2 15.4 16.6Writing 246 8.0 65.9 34.1 5.3 28.9 54.1 11.0 <5.0
11 Science 267 313.5 71.2 28.8 6.7 22.1 38.6 15.4 17.2Social Studies 267 307.2 65.2 34.8 12.4 22.5 41.9 13.1 10.1
(Table continued on following page.)
91

TABLE 8DELAWARE STUDENT TESTING PROGRAM
PERCENTILE RANKINGS, STANDARDS-BASED SCORES, AND PERFORMANCE LEVELSSTATEWIDE AND DISTRICT RESULTS
FALL 2006 and SPRING 2007**
School District Content Area N PR N SBS
% Meets or Exceeds Standard
% Below Standard
% Well Below
% Below
% Meets
% Exceeds
% Distinguished
Performance LevelsNational
Percentile Rankings*Mean
Scores*
Gra
de
Capital 2 Reading 448 69 448 405.1 85.5 14.5 <5.0 14.5 47.1 38.4 <5.0Mathematics 489 59 489 397.8 86.7 13.3 <5.0 13.3 43.4 43.4 <5.0
3 Reading 400 69 400 445.5 82.8 17.3 5.8 11.5 55.8 15.0 12.0Mathematics 465 67 466 438.0 77.5 22.5 7.7 14.8 46.4 24.5 6.7Writing 465 6.9 66.2 33.8 <5.0 30.5 64.5 <5.0 <5.0
4 Reading 407 80 407 468.3 82.1 17.9 <5.0 14.0 46.4 23.3 12.3Mathematics 475 74 477 457.0 74.6 25.4 11.9 13.4 42.6 23.3 8.8Writing 476 6.5 47.7 52.3 10.7 41.6 45.6 <5.0 <5.0Science 470 320.6 92.1 7.9 <5.0 6.8 48.9 31.5 11.7Social Studies 469 308.0 71.6 28.4 8.7 19.6 56.9 10.4 <5.0
5 Reading 364 70 364 473.7 71.7 28.3 8.8 19.5 51.4 16.2 <5.0Mathematics 406 61 420 464.8 61.9 38.1 21.2 16.9 48.6 9.8 <5.0Writing 420 7.0 41.0 59.0 <5.0 55.7 39.5 <5.0 <5.0
6 Reading 357 64 357 484.3 80.1 19.9 <5.0 15.1 54.6 22.7 <5.0Mathematics 419 62 420 485.9 70.2 29.8 15.2 14.5 51.0 12.1 7.1Writing 420 7.6 63.3 36.7 <5.0 32.4 58.6 <5.0 <5.0Science 414 311.6 78.3 21.7 <5.0 16.9 57.2 13.8 7.2Social Studies 412 304.9 62.4 37.6 8.5 29.1 55.8 <5.0 <5.0
7 Reading 431 71 431 494.4 80.0 20.0 5.6 14.4 61.0 15.5 <5.0Mathematics 428 54 489 475.1 51.7 48.3 33.9 14.3 38.0 8.8 <5.0Writing 490 7.2 49.8 50.2 6.9 43.3 45.7 <5.0 <5.0
8 Reading 425 64 425 515.3 73.6 26.4 8.7 17.6 57.4 12.9 <5.0Mathematics 474 56 474 488.7 46.4 53.6 36.7 16.9 28.7 8.0 9.7Writing 469 8.2 77.2 22.8 <5.0 20.7 69.3 7.7 <5.0Science 457 294.5 41.8 58.2 31.5 26.7 26.0 7.9 7.9Social Studies 456 294.2 37.1 62.9 26.5 36.4 29.4 <5.0 <5.0
9 Reading 423 63 423 509.3 62.2 37.8 18.2 19.6 48.7 10.2 <5.0Mathematics 397 75 456 506.7 41.7 58.3 32.5 25.9 31.1 6.1 <5.0Writing 450 8.1 68.9 31.1 <5.0 27.1 57.8 10.7 <5.0
10 Reading 324 68 324 510.1 65.1 34.9 13.3 21.6 58.6 6.2 <5.0Mathematics 328 70 333 529.4 45.9 54.1 37.5 16.5 24.9 7.2 13.8Writing 334 7.6 57.8 42.2 <5.0 38.0 50.6 6.6 <5.0
11 Science 270 301.4 54.8 45.2 22.2 23.0 38.9 9.6 6.3Social Studies 271 292.5 42.1 57.9 27.3 30.6 29.9 8.1 <5.0
(Table continued on following page.)
92

TABLE 8DELAWARE STUDENT TESTING PROGRAM
PERCENTILE RANKINGS, STANDARDS-BASED SCORES, AND PERFORMANCE LEVELSSTATEWIDE AND DISTRICT RESULTS
FALL 2006 and SPRING 2007**
School District Content Area N PR N SBS
% Meets or Exceeds Standard
% Below Standard
% Well Below
% Below
% Meets
% Exceeds
% Distinguished
Performance LevelsNational
Percentile Rankings*Mean
Scores*
Gra
de
Christina 2 Reading 1,380 64 1,380 401.5 82.1 17.9 <5.0 17.9 45.7 36.4 <5.0Mathematics 1,471 59 1,479 400.5 85.5 14.5 <5.0 14.5 38.4 47.1 <5.0
3 Reading 1,403 73 1,402 449.1 82.8 17.2 6.3 10.9 48.5 15.0 19.3Mathematics 1,534 72 1,538 446.0 79.6 20.4 8.6 11.8 41.4 24.5 13.7Writing 1,529 7.5 76.9 23.1 <5.0 20.0 69.5 6.7 <5.0
4 Reading 1,426 78 1,426 468.2 80.2 19.8 6.0 13.8 45.0 18.8 16.3Mathematics 1,582 73 1,584 460.5 75.2 24.8 11.9 12.9 36.4 25.5 13.3Writing 1,575 6.9 54.8 45.2 9.7 35.6 48.1 5.5 <5.0Science 1,567 319.1 88.8 11.2 <5.0 8.6 50.3 25.1 13.4Social Studies 1,566 307.0 68.3 31.7 12.1 19.5 51.3 11.4 5.6
5 Reading 1,159 71 1,158 482.9 81.4 18.6 6.1 12.4 49.0 23.3 9.2Mathematics 1,273 69 1,275 473.5 72.3 27.7 12.7 15.0 52.6 11.9 7.8Writing 1,273 7.6 60.3 39.7 <5.0 36.6 56.9 <5.0 <5.0
6 Reading 1,147 59 1,147 480.9 75.9 24.1 5.7 18.5 53.0 20.4 <5.0Mathematics 1,257 56 1,262 482.9 67.8 32.2 18.4 13.8 51.0 10.5 6.4Writing 1,255 7.8 69.3 30.7 <5.0 27.3 64.0 5.3 <5.0Science 1,256 307.7 69.3 30.7 6.6 24.0 52.5 11.6 5.2Social Studies 1,252 301.2 52.5 47.5 10.1 37.5 48.0 <5.0 <5.0
7 Reading 1,314 63 1,314 484.4 72.6 27.4 9.9 17.5 59.4 11.7 <5.0Mathematics 1,407 51 1,426 476.2 51.1 48.9 35.6 13.3 37.9 6.7 6.5Writing 1,412 7.2 49.0 51.0 8.3 42.7 46.2 <5.0 <5.0
8 Reading 1,423 63 1,423 512.2 74.1 25.9 9.0 16.9 63.3 9.2 <5.0Mathematics 1,498 54 1,515 488.3 47.2 52.8 33.3 19.5 30.6 9.1 7.5Writing 1,498 8.0 74.0 26.0 <5.0 22.0 69.3 <5.0 <5.0Science 1,458 293.1 43.0 57.0 28.9 28.1 32.3 6.7 <5.0Social Studies 1,455 294.3 39.2 60.8 21.6 39.2 34.8 <5.0 <5.0
9 Reading 1,110 65 1,109 509.5 63.5 36.5 16.1 20.4 51.5 7.8 <5.0Mathematics 1,155 65 1,164 503.6 37.5 62.5 32.6 29.9 27.7 <5.0 5.8Writing 1,150 7.8 65.0 35.0 7.4 27.7 52.5 10.6 <5.0
10 Reading 1,060 67 1,061 508.6 58.8 41.2 15.3 25.9 50.4 6.5 <5.0Mathematics 1,110 59 1,118 520.7 40.6 59.4 40.5 18.9 25.9 6.2 8.5Writing 1,095 7.6 59.0 41.0 6.3 34.7 49.1 9.1 <5.0
11 Science 808 300.9 51.7 48.3 18.2 30.1 37.7 8.5 5.4Social Studies 797 293.4 38.8 61.2 24.5 36.8 28.0 6.3 <5.0
(Table continued on following page.)
93

TABLE 8DELAWARE STUDENT TESTING PROGRAM
PERCENTILE RANKINGS, STANDARDS-BASED SCORES, AND PERFORMANCE LEVELSSTATEWIDE AND DISTRICT RESULTS
FALL 2006 and SPRING 2007**
School District Content Area N PR N SBS
% Meets or Exceeds Standard
% Below Standard
% Well Below
% Below
% Meets
% Exceeds
% Distinguished
Performance LevelsNational
Percentile Rankings*Mean
Scores*
Gra
de
Colonial 2 Reading 693 61 693 394.1 77.6 22.4 <5.0 22.4 49.8 27.8 <5.0Mathematics 754 49 757 388.6 78.1 21.9 <5.0 21.9 42.3 35.8 <5.0
3 Reading 687 66 687 437.0 74.8 25.2 10.8 14.4 52.7 12.5 9.6Mathematics 756 62 757 429.7 70.7 29.3 12.3 17.0 46.4 17.0 7.3Writing 756 6.8 58.2 41.8 <5.0 38.0 54.1 <5.0 <5.0
4 Reading 702 78 702 464.4 80.2 19.8 <5.0 15.0 52.6 17.8 9.8Mathematics 779 65 781 451.5 69.7 30.3 12.3 18.1 43.3 20.4 6.0Writing 781 6.6 47.9 52.1 9.9 42.3 45.2 <5.0 <5.0Science 797 319.2 94.1 5.9 <5.0 5.1 59.6 24.6 9.9Social Studies 797 307.3 70.5 29.5 7.9 21.6 58.2 8.3 <5.0
5 Reading 777 73 777 487.0 84.8 15.2 <5.0 10.8 49.4 25.7 9.7Mathematics 848 68 849 471.2 71.6 28.4 14.1 14.3 54.2 11.2 6.2Writing 847 7.6 62.7 37.3 <5.0 32.7 58.2 <5.0 <5.0
6 Reading 764 60 764 479.0 73.8 26.2 7.6 18.6 54.1 17.4 <5.0Mathematics 841 51 842 476.5 61.2 38.8 22.8 16.0 50.2 7.2 <5.0Writing 841 7.6 61.2 38.8 <5.0 34.2 56.1 <5.0 <5.0Science 851 309.3 74.6 25.4 5.4 20.0 56.8 13.0 <5.0Social Studies 850 301.5 55.2 44.8 9.2 35.6 51.2 <5.0 <5.0
7 Reading 851 69 851 493.3 81.9 18.1 <5.0 13.4 65.0 15.0 <5.0Mathematics 918 54 923 478.8 56.6 43.4 30.3 13.1 42.3 8.1 6.2Writing 921 7.4 56.8 43.2 6.8 36.4 51.9 <5.0 <5.0
8 Reading 929 67 929 520.9 80.5 19.5 <5.0 15.4 63.9 14.2 <5.0Mathematics 975 56 983 490.0 50.1 49.9 29.3 20.7 34.1 9.7 6.3Writing 977 8.3 81.1 18.9 <5.0 17.3 73.2 7.7 <5.0Science 970 304.9 57.9 42.1 18.9 23.2 34.9 10.7 12.3Social Studies 969 300.4 49.2 50.8 13.4 37.4 38.6 6.5 <5.0
9 Reading 609 66 609 513.9 68.0 32.0 11.3 20.7 55.3 10.0 <5.0Mathematics 635 63 640 501.5 32.0 68.0 31.9 36.1 24.2 <5.0 <5.0Writing 636 7.9 64.5 35.5 <5.0 33.3 58.2 6.1 <5.0
10 Reading 505 64 505 508.1 62.4 37.6 11.5 26.1 58.8 <5.0 <5.0Mathematics 515 59 516 521.6 41.5 58.5 35.9 22.7 29.1 5.8 6.6Writing 517 7.6 55.9 44.1 <5.0 40.0 48.4 7.4 <5.0
11 Science 420 303.6 59.8 40.2 13.1 27.1 47.6 9.3 <5.0Social Studies 420 298.3 48.8 51.2 17.1 34.0 40.0 5.7 <5.0
(Table continued on following page.)
94

TABLE 8DELAWARE STUDENT TESTING PROGRAM
PERCENTILE RANKINGS, STANDARDS-BASED SCORES, AND PERFORMANCE LEVELSSTATEWIDE AND DISTRICT RESULTS
FALL 2006 and SPRING 2007**
School District Content Area N PR N SBS
% Meets or Exceeds Standard
% Below Standard
% Well Below
% Below
% Meets
% Exceeds
% Distinguished
Performance LevelsNational
Percentile Rankings*Mean
Scores*
Gra
de
Delmar 2 ReadingMathematics
3 ReadingMathematicsWriting
4 ReadingMathematicsWritingScienceSocial Studies
5 ReadingMathematicsWriting
6 Reading 154 63 154 481.2 76.6 23.4 7.1 16.2 53.9 20.1 <5.0Mathematics 160 69 160 493.0 77.5 22.5 10.0 12.5 55.0 14.4 8.1Writing 160 7.1 43.1 56.9 <5.0 53.1 42.5 <5.0 <5.0Science 164 308.9 70.7 29.3 5.5 23.8 54.9 11.6 <5.0Social Studies 164 301.7 54.9 45.1 14.0 31.1 52.4 <5.0 <5.0
7 Reading 167 73 167 499.8 83.8 16.2 <5.0 12.6 58.1 22.2 <5.0Mathematics 173 69 173 494.7 64.2 35.8 24.9 11.0 39.9 8.1 16.2Writing 173 7.5 56.1 43.9 5.2 38.7 54.9 <5.0 <5.0
8 Reading 166 72 166 530.4 88.0 12.0 <5.0 7.8 60.8 22.3 <5.0Mathematics 173 71 174 508.7 67.2 32.8 20.7 12.1 33.3 10.9 23.0Writing 174 8.5 87.9 12.1 <5.0 10.3 78.7 8.6 <5.0Science 173 308.9 65.3 34.7 16.2 18.5 36.4 12.1 16.8Social Studies 173 299.7 48.0 52.0 19.1 32.9 37.6 5.8 <5.0
9 Reading 159 81 159 535.0 84.9 15.1 <5.0 10.7 59.1 21.4 <5.0Mathematics 164 82 164 526.0 65.2 34.8 10.4 24.4 47.0 12.2 6.1Writing 164 8.5 81.1 18.9 <5.0 17.7 70.1 11.0 <5.0
10 Reading 142 74 142 525.5 81.7 18.3 5.6 12.7 69.0 10.6 <5.0Mathematics 148 76 148 540.3 62.8 37.2 16.9 20.3 34.5 12.8 15.5Writing 148 7.8 56.8 43.2 <5.0 41.2 46.6 10.1 <5.0
11 Science 111 310.5 75.7 24.3 7.2 17.1 56.8 11.7 7.2Social Studies 111 304.6 62.2 37.8 10.8 27.0 45.9 5.4 10.8
(Table continued on following page.)
95

TABLE 8DELAWARE STUDENT TESTING PROGRAM
PERCENTILE RANKINGS, STANDARDS-BASED SCORES, AND PERFORMANCE LEVELSSTATEWIDE AND DISTRICT RESULTS
FALL 2006 and SPRING 2007**
School District Content Area N PR N SBS
% Meets or Exceeds Standard
% Below Standard
% Well Below
% Below
% Meets
% Exceeds
% Distinguished
Performance LevelsNational
Percentile Rankings*Mean
Scores*
Gra
de
Indian River 2 Reading 500 75 500 417.7 92.6 7.4 <5.0 7.4 42.4 50.2 <5.0Mathematics 563 75 565 424.7 >95 <5.0 <5.0 <5.0 27.8 68.1 <5.0
3 Reading 518 76 518 458.4 90.2 9.8 <5.0 7.7 48.3 18.3 23.6Mathematics 596 81 596 454.6 89.4 10.6 <5.0 7.0 43.5 32.7 13.3Writing 593 7.4 74.5 25.5 <5.0 24.3 68.6 5.2 <5.0
4 Reading 494 86 494 481.7 93.9 6.1 <5.0 5.1 43.7 26.7 23.5Mathematics 576 86 576 477.5 88.0 12.0 <5.0 7.5 34.0 31.1 22.9Writing 571 7.2 61.8 38.2 <5.0 33.6 55.0 6.3 <5.0Science 579 325.2 >95 <5.0 <5.0 <5.0 42.0 35.1 20.0Social Studies 579 315.7 85.0 15.0 <5.0 12.1 56.1 17.4 11.4
5 Reading 538 83 537 500.7 92.4 7.6 <5.0 6.3 43.0 29.8 19.6Mathematics 610 83 610 495.0 90.3 9.7 <5.0 6.6 49.8 22.8 17.7Writing 606 8.1 74.3 25.7 <5.0 24.9 69.1 <5.0 <5.0
6 Reading 546 67 546 489.0 85.3 14.7 <5.0 12.3 55.1 26.2 <5.0Mathematics 591 67 603 496.9 83.6 16.4 8.1 8.3 58.7 14.8 10.1Writing 604 8.0 73.8 26.2 <5.0 25.0 67.5 5.8 <5.0Science 606 313.9 84.2 15.8 <5.0 14.2 59.7 16.2 8.3Social Studies 606 306.1 64.2 35.8 <5.0 31.0 54.8 7.8 <5.0
7 Reading 598 78 596 506.5 90.1 9.9 <5.0 7.4 59.9 24.3 5.9Mathematics 642 71 642 500.7 76.3 23.7 12.6 11.1 50.0 11.4 15.0Writing 639 7.9 69.3 30.7 <5.0 28.2 65.7 <5.0 <5.0
8 Reading 589 73 587 534.5 91.3 8.7 <5.0 7.3 66.1 19.4 5.8Mathematics 634 77 635 516.3 75.6 24.4 12.4 12.0 35.9 19.1 20.6Writing 633 8.5 83.1 16.9 <5.0 15.5 73.1 9.6 <5.0Science 633 316.0 76.6 23.4 10.3 13.1 40.3 15.2 21.2Social Studies 632 307.3 66.9 33.1 9.3 23.7 47.0 11.9 8.1
9 Reading 539 76 539 527.9 78.1 21.9 8.5 13.4 55.8 13.5 8.7Mathematics 580 78 582 520.6 54.8 45.2 19.9 25.3 34.9 7.0 12.9Writing 576 8.1 70.0 30.0 <5.0 27.4 55.4 13.9 <5.0
10 Reading 471 73 470 521.6 73.4 26.6 6.6 20.0 60.6 9.1 <5.0Mathematics 510 74 512 539.0 60.9 39.1 22.7 16.4 32.6 10.9 17.4Writing 514 7.8 58.9 41.1 <5.0 38.1 48.6 9.9 <5.0
11 Science 412 308.9 68.2 31.8 8.3 23.5 46.4 14.6 7.3Social Studies 413 301.9 56.7 43.3 13.6 29.8 42.1 9.9 <5.0
(Table continued on following page.)
96

TABLE 8DELAWARE STUDENT TESTING PROGRAM
PERCENTILE RANKINGS, STANDARDS-BASED SCORES, AND PERFORMANCE LEVELSSTATEWIDE AND DISTRICT RESULTS
FALL 2006 and SPRING 2007**
School District Content Area N PR N SBS
% Meets or Exceeds Standard
% Below Standard
% Well Below
% Below
% Meets
% Exceeds
% Distinguished
Performance LevelsNational
Percentile Rankings*Mean
Scores*
Gra
de
Lake Forest 2 Reading 297 69 297 405.7 87.5 12.5 <5.0 12.5 49.2 38.4 <5.0Mathematics 321 60 325 401.6 85.8 14.2 <5.0 14.2 38.2 47.7 <5.0
3 Reading 276 71 276 447.1 82.6 17.4 5.1 12.3 55.1 15.2 12.3Mathematics 319 70 320 438.9 80.9 19.1 5.9 13.1 52.2 22.5 6.3Writing 320 7.1 65.0 35.0 <5.0 32.8 62.2 <5.0 <5.0
4 Reading 298 79 297 466.9 82.5 17.5 5.1 12.5 52.9 15.5 14.1Mathematics 333 69 334 456.7 73.4 26.6 9.0 17.7 43.1 22.5 7.8Writing 334 6.4 42.2 57.8 11.1 46.7 41.0 <5.0 <5.0Science 323 320.5 93.8 6.2 <5.0 5.9 56.7 27.6 9.6Social Studies 323 305.5 71.2 28.8 6.2 22.6 65.0 <5.0 <5.0
5 Reading 289 75 291 483.2 87.3 12.7 <5.0 8.9 58.8 24.1 <5.0Mathematics 328 77 330 478.2 79.4 20.6 8.2 12.4 56.7 15.5 7.3Writing 328 7.4 54.6 45.4 <5.0 42.1 52.4 <5.0 <5.0
6 Reading 282 64 279 485.4 82.8 17.2 <5.0 13.3 57.3 22.2 <5.0Mathematics 312 68 314 496.1 83.8 16.2 7.0 9.2 58.6 14.6 10.5Writing 314 7.9 69.4 30.6 <5.0 28.0 63.1 6.4 <5.0Science 319 313.7 82.1 17.9 <5.0 16.0 58.0 14.7 9.4Social Studies 319 305.0 64.9 35.1 5.3 29.8 58.6 <5.0 <5.0
7 Reading 286 74 283 498.5 83.7 16.3 <5.0 12.4 62.2 19.1 <5.0Mathematics 312 66 317 491.5 70.3 29.7 17.7 12.0 51.4 9.8 9.1Writing 316 7.2 47.5 52.5 7.0 45.6 43.4 <5.0 <5.0
8 Reading 295 71 293 523.3 86.3 13.7 <5.0 8.9 72.7 11.3 <5.0Mathematics 320 76 321 513.0 74.1 25.9 15.9 10.0 36.4 17.8 19.9Writing 318 8.2 76.1 23.9 <5.0 21.4 68.9 6.9 <5.0Science 316 304.4 62.0 38.0 16.8 21.2 42.1 13.3 6.6Social Studies 315 301.6 55.2 44.8 12.4 32.4 46.0 5.7 <5.0
9 Reading 323 60 320 506.1 64.4 35.6 15.9 19.7 56.3 6.3 <5.0Mathematics 321 71 329 510.1 47.7 52.3 24.9 27.4 38.0 5.2 <5.0Writing 327 7.8 65.7 34.3 5.2 29.1 59.9 5.5 <5.0
10 Reading 199 71 199 510.1 63.8 36.2 8.5 27.6 59.3 <5.0 <5.0Mathematics 198 66 200 524.3 44.5 55.5 29.0 26.5 29.5 8.0 7.0Writing 197 7.5 52.8 47.2 <5.0 43.7 49.2 <5.0 <5.0
11 Science 173 304.5 61.3 38.7 11.6 27.2 52.0 5.2 <5.0Social Studies 172 301.0 58.1 41.9 11.0 30.8 49.4 5.2 <5.0
(Table continued on following page.)
97

TABLE 8DELAWARE STUDENT TESTING PROGRAM
PERCENTILE RANKINGS, STANDARDS-BASED SCORES, AND PERFORMANCE LEVELSSTATEWIDE AND DISTRICT RESULTS
FALL 2006 and SPRING 2007**
School District Content Area N PR N SBS
% Meets or Exceeds Standard
% Below Standard
% Well Below
% Below
% Meets
% Exceeds
% Distinguished
Performance LevelsNational
Percentile Rankings*Mean
Scores*
Gra
de
Laurel 2 Reading 147 62 147 393.7 76.2 23.8 <5.0 23.8 50.3 25.9 <5.0Mathematics 156 68 156 407.0 89.7 10.3 <5.0 10.3 37.2 52.6 <5.0
3 Reading 144 72 144 442.6 79.2 20.8 8.3 12.5 54.2 12.5 12.5Mathematics 160 72 160 436.5 74.4 25.6 10.0 15.6 49.4 18.1 6.9Writing 158 6.3 43.0 57.0 <5.0 53.8 43.0 <5.0 <5.0
4 Reading 154 72 154 460.6 77.3 22.7 7.1 15.6 50.6 14.9 11.7Mathematics 182 69 182 447.7 60.4 39.6 15.9 23.6 36.8 15.9 7.7Writing 181 6.2 34.3 65.7 10.5 55.2 32.6 <5.0 <5.0Science 182 312.0 81.9 18.1 <5.0 15.9 62.6 13.7 5.5Social Studies 182 298.0 48.4 51.6 18.7 33.0 44.5 <5.0 <5.0
5 Reading 152 65 152 467.2 61.8 38.2 14.5 23.7 43.4 13.2 5.3Mathematics 169 70 171 464.9 66.1 33.9 19.9 14.0 52.6 7.6 5.8Writing 170 6.9 40.0 60.0 7.1 52.9 38.2 <5.0 <5.0
6 Reading 147 60 147 482.4 76.9 23.1 <5.0 19.0 54.4 19.0 <5.0Mathematics 156 68 157 489.1 72.6 27.4 17.2 10.2 45.9 14.0 12.7Writing 157 7.6 58.0 42.0 <5.0 38.2 49.7 8.3 <5.0Science 163 309.8 73.6 26.4 <5.0 21.5 58.3 10.4 <5.0Social Studies 163 300.2 50.9 49.1 11.7 37.4 49.7 <5.0 <5.0
7 Reading 152 77 152 498.0 81.6 18.4 <5.0 16.4 61.8 15.1 <5.0Mathematics 162 71 168 490.9 66.7 33.3 25.0 8.3 39.3 11.9 15.5Writing 168 7.6 58.9 41.1 <5.0 38.1 56.0 <5.0 <5.0
8 Reading 168 65 168 512.6 72.6 27.4 6.5 20.8 64.9 7.7 <5.0Mathematics 189 66 191 493.0 52.9 47.1 28.8 18.3 31.4 14.1 7.3Writing 190 8.4 82.6 17.4 <5.0 15.3 71.6 10.0 <5.0Science 189 294.7 43.9 56.1 23.8 32.3 34.9 5.8 <5.0Social Studies 188 292.5 30.3 69.7 23.9 45.7 28.2 <5.0 <5.0
9 Reading 128 68 128 514.5 72.7 27.3 <5.0 22.7 65.6 7.0 <5.0Mathematics 148 68 149 503.8 35.6 64.4 24.2 40.3 32.2 <5.0 <5.0Writing 146 8.1 74.0 26.0 <5.0 21.9 64.4 9.6 <5.0
10 Reading 111 73 111 513.9 65.8 34.2 6.3 27.9 61.3 <5.0 <5.0Mathematics 120 75 120 532.4 59.2 40.8 21.7 19.2 41.7 9.2 8.3Writing 118 7.5 57.6 42.4 <5.0 38.1 55.1 <5.0 <5.0
11 Science 85 303.4 58.8 41.2 16.5 24.7 45.9 8.2 <5.0Social Studies 84 297.4 47.6 52.4 22.6 29.8 40.5 <5.0 <5.0
(Table continued on following page.)
98

TABLE 8DELAWARE STUDENT TESTING PROGRAM
PERCENTILE RANKINGS, STANDARDS-BASED SCORES, AND PERFORMANCE LEVELSSTATEWIDE AND DISTRICT RESULTS
FALL 2006 and SPRING 2007**
School District Content Area N PR N SBS
% Meets or Exceeds Standard
% Below Standard
% Well Below
% Below
% Meets
% Exceeds
% Distinguished
Performance LevelsNational
Percentile Rankings*Mean
Scores*
Gra
de
Milford 2 Reading 276 73 276 409.6 90.9 9.1 <5.0 9.1 48.6 42.4 <5.0Mathematics 304 71 306 411.6 94.4 5.6 <5.0 5.6 38.6 55.9 <5.0
3 Reading 270 78 270 457.6 91.9 8.1 <5.0 5.9 50.4 21.1 20.4Mathematics 310 79 314 453.6 86.3 13.7 <5.0 9.9 42.4 32.2 11.8Writing 310 7.8 83.5 16.5 <5.0 16.5 75.5 7.4 <5.0
4 Reading 244 85 244 476.7 91.8 8.2 <5.0 6.6 49.6 25.0 17.2Mathematics 284 82 287 468.1 86.4 13.6 <5.0 8.7 45.3 26.5 14.6Writing 285 7.0 56.5 43.5 6.0 37.5 53.0 <5.0 <5.0Science 289 324.0 >95 <5.0 <5.0 <5.0 49.8 28.0 19.7Social Studies 289 312.6 78.9 21.1 <5.0 17.3 57.1 15.2 6.6
5 Reading 274 83 274 497.2 94.5 5.5 <5.0 5.5 51.8 29.6 13.1Mathematics 304 79 306 487.4 86.3 13.7 5.6 8.2 52.9 21.6 11.8Writing 305 7.6 57.7 42.3 <5.0 40.7 54.8 <5.0 <5.0
6 Reading 289 68 289 494.9 88.6 11.4 <5.0 9.3 50.5 31.5 6.6Mathematics 321 76 322 509.9 85.4 14.6 8.7 5.9 44.7 16.8 23.9Writing 321 8.2 77.9 22.1 <5.0 21.2 70.4 6.9 <5.0Science 327 315.2 87.2 12.8 <5.0 8.9 59.0 16.8 11.3Social Studies 327 304.3 62.7 37.3 5.2 32.1 56.6 5.2 <5.0
7 Reading 277 77 277 505.5 89.9 10.1 <5.0 7.9 61.0 22.4 6.5Mathematics 306 75 306 501.0 75.8 24.2 16.0 8.2 47.7 14.7 13.4Writing 305 7.4 54.4 45.6 5.2 40.3 48.2 5.9 <5.0
8 Reading 338 72 337 535.5 88.4 11.6 <5.0 9.2 58.2 24.6 5.6Mathematics 357 76 358 518.8 70.1 29.9 18.2 11.7 30.4 11.2 28.5Writing 356 8.7 82.6 17.4 <5.0 17.1 64.0 14.0 <5.0Science 355 305.2 61.7 38.3 13.8 24.5 40.3 13.0 8.5Social Studies 353 300.7 49.9 50.1 11.3 38.8 42.5 <5.0 <5.0
9 Reading 298 77 298 530.3 80.2 19.8 6.4 13.4 59.4 14.1 6.7Mathematics 327 79 330 520.0 53.6 46.4 19.7 26.7 31.5 8.5 13.6Writing 330 8.2 70.6 29.4 <5.0 27.3 57.6 11.5 <5.0
10 Reading 211 78 211 525.7 83.4 16.6 <5.0 12.8 71.1 9.5 <5.0Mathematics 222 72 222 535.7 59.9 40.1 27.5 12.6 31.1 12.6 16.2Writing 221 8.0 64.7 35.3 <5.0 33.0 52.5 10.0 <5.0
11 Science 230 308.2 66.1 33.9 10.9 23.0 45.2 10.4 10.4Social Studies 231 301.2 55.0 45.0 18.6 26.4 38.1 7.8 9.1
(Table continued on following page.)
99

TABLE 8DELAWARE STUDENT TESTING PROGRAM
PERCENTILE RANKINGS, STANDARDS-BASED SCORES, AND PERFORMANCE LEVELSSTATEWIDE AND DISTRICT RESULTS
FALL 2006 and SPRING 2007**
School District Content Area N PR N SBS
% Meets or Exceeds Standard
% Below Standard
% Well Below
% Below
% Meets
% Exceeds
% Distinguished
Performance LevelsNational
Percentile Rankings*Mean
Scores*
Gra
de
New Castle County VT 8 Reading 46 50 46 492.9 52.2 47.8 17.4 30.4 50.0 <5.0 <5.0Mathematics 47 34 52 461.8 7.7 92.3 67.3 25.0 5.8 <5.0 <5.0Writing 50 7.6 56.0 44.0 <5.0 44.0 52.0 <5.0 <5.0Science 49 278.9 12.2 87.8 49.0 38.8 10.2 <5.0 <5.0Social Studies 50 286.4 16.0 84.0 36.0 48.0 16.0 <5.0 <5.0
9 Reading 1,148 74 1,148 525.6 83.5 16.5 <5.0 13.2 71.4 9.4 <5.0Mathematics 1,157 78 1,167 520.9 58.4 41.6 11.7 29.9 44.7 8.1 5.5Writing 1,162 8.6 86.8 13.2 <5.0 12.5 74.2 12.2 <5.0
10 Reading 840 68 844 514.7 72.3 27.7 7.1 20.6 68.0 <5.0 <5.0Mathematics 860 65 864 528.7 54.5 45.5 22.9 22.6 40.0 7.8 6.7Writing 860 8.1 70.1 29.9 <5.0 29.1 63.3 6.7 <5.0
11 Science 816 306.0 64.7 35.3 8.2 27.1 52.0 9.2 <5.0Social Studies 816 295.6 44.4 55.6 17.2 38.5 37.5 5.4 <5.0
Polytech 9 Reading 297 81 297 534.6 93.6 6.4 <5.0 <5.0 73.1 17.8 <5.0Mathematics 313 85 313 533.9 76.4 23.6 <5.0 19.8 51.4 14.4 10.5Writing 312 8.7 88.1 11.9 <5.0 11.9 74.4 12.8 <5.0
10 Reading 290 75 290 519.7 75.5 24.5 6.2 18.3 69.0 6.2 <5.0Mathematics 295 73 295 533.7 60.3 39.7 18.0 21.7 35.9 14.9 9.5Writing 295 8.2 71.9 28.1 <5.0 27.5 63.4 7.8 <5.0
11 Science 249 310.9 74.3 25.7 <5.0 22.9 55.8 8.8 9.6Social Studies 249 302.9 57.0 43.0 11.2 31.7 41.4 11.6 <5.0
(Table continued on following page.)
100
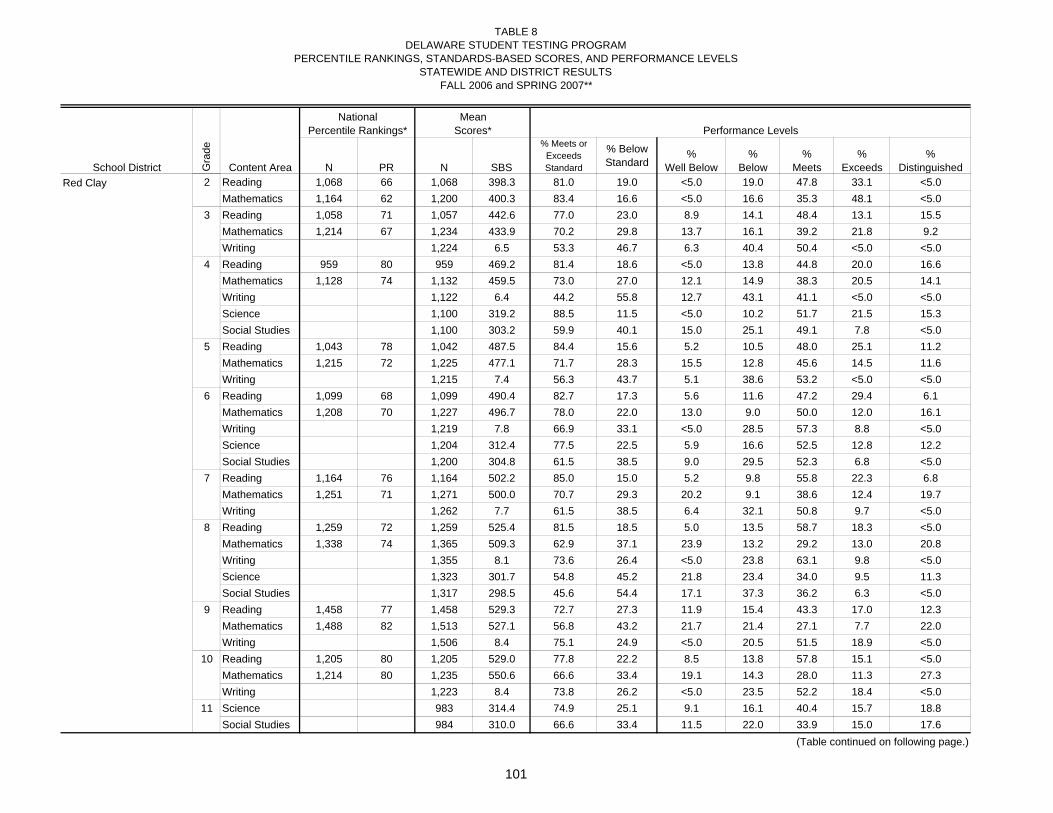
TABLE 8DELAWARE STUDENT TESTING PROGRAM
PERCENTILE RANKINGS, STANDARDS-BASED SCORES, AND PERFORMANCE LEVELSSTATEWIDE AND DISTRICT RESULTS
FALL 2006 and SPRING 2007**
School District Content Area N PR N SBS
% Meets or Exceeds Standard
% Below Standard
% Well Below
% Below
% Meets
% Exceeds
% Distinguished
Performance LevelsNational
Percentile Rankings*Mean
Scores*
Gra
de
Red Clay 2 Reading 1,068 66 1,068 398.3 81.0 19.0 <5.0 19.0 47.8 33.1 <5.0Mathematics 1,164 62 1,200 400.3 83.4 16.6 <5.0 16.6 35.3 48.1 <5.0
3 Reading 1,058 71 1,057 442.6 77.0 23.0 8.9 14.1 48.4 13.1 15.5Mathematics 1,214 67 1,234 433.9 70.2 29.8 13.7 16.1 39.2 21.8 9.2Writing 1,224 6.5 53.3 46.7 6.3 40.4 50.4 <5.0 <5.0
4 Reading 959 80 959 469.2 81.4 18.6 <5.0 13.8 44.8 20.0 16.6Mathematics 1,128 74 1,132 459.5 73.0 27.0 12.1 14.9 38.3 20.5 14.1Writing 1,122 6.4 44.2 55.8 12.7 43.1 41.1 <5.0 <5.0Science 1,100 319.2 88.5 11.5 <5.0 10.2 51.7 21.5 15.3Social Studies 1,100 303.2 59.9 40.1 15.0 25.1 49.1 7.8 <5.0
5 Reading 1,043 78 1,042 487.5 84.4 15.6 5.2 10.5 48.0 25.1 11.2Mathematics 1,215 72 1,225 477.1 71.7 28.3 15.5 12.8 45.6 14.5 11.6Writing 1,215 7.4 56.3 43.7 5.1 38.6 53.2 <5.0 <5.0
6 Reading 1,099 68 1,099 490.4 82.7 17.3 5.6 11.6 47.2 29.4 6.1Mathematics 1,208 70 1,227 496.7 78.0 22.0 13.0 9.0 50.0 12.0 16.1Writing 1,219 7.8 66.9 33.1 <5.0 28.5 57.3 8.8 <5.0Science 1,204 312.4 77.5 22.5 5.9 16.6 52.5 12.8 12.2Social Studies 1,200 304.8 61.5 38.5 9.0 29.5 52.3 6.8 <5.0
7 Reading 1,164 76 1,164 502.2 85.0 15.0 5.2 9.8 55.8 22.3 6.8Mathematics 1,251 71 1,271 500.0 70.7 29.3 20.2 9.1 38.6 12.4 19.7Writing 1,262 7.7 61.5 38.5 6.4 32.1 50.8 9.7 <5.0
8 Reading 1,259 72 1,259 525.4 81.5 18.5 5.0 13.5 58.7 18.3 <5.0Mathematics 1,338 74 1,365 509.3 62.9 37.1 23.9 13.2 29.2 13.0 20.8Writing 1,355 8.1 73.6 26.4 <5.0 23.8 63.1 9.8 <5.0Science 1,323 301.7 54.8 45.2 21.8 23.4 34.0 9.5 11.3Social Studies 1,317 298.5 45.6 54.4 17.1 37.3 36.2 6.3 <5.0
9 Reading 1,458 77 1,458 529.3 72.7 27.3 11.9 15.4 43.3 17.0 12.3Mathematics 1,488 82 1,513 527.1 56.8 43.2 21.7 21.4 27.1 7.7 22.0Writing 1,506 8.4 75.1 24.9 <5.0 20.5 51.5 18.9 <5.0
10 Reading 1,205 80 1,205 529.0 77.8 22.2 8.5 13.8 57.8 15.1 <5.0Mathematics 1,214 80 1,235 550.6 66.6 33.4 19.1 14.3 28.0 11.3 27.3Writing 1,223 8.4 73.8 26.2 <5.0 23.5 52.2 18.4 <5.0
11 Science 983 314.4 74.9 25.1 9.1 16.1 40.4 15.7 18.8Social Studies 984 310.0 66.6 33.4 11.5 22.0 33.9 15.0 17.6
(Table continued on following page.)
101

TABLE 8DELAWARE STUDENT TESTING PROGRAM
PERCENTILE RANKINGS, STANDARDS-BASED SCORES, AND PERFORMANCE LEVELSSTATEWIDE AND DISTRICT RESULTS
FALL 2006 and SPRING 2007**
School District Content Area N PR N SBS
% Meets or Exceeds Standard
% Below Standard
% Well Below
% Below
% Meets
% Exceeds
% Distinguished
Performance LevelsNational
Percentile Rankings*Mean
Scores*
Gra
de
Seaford 2 Reading 241 67 241 401.8 83.8 16.2 <5.0 16.2 51.0 32.8 <5.0Mathematics 269 59 269 397.4 84.0 16.0 <5.0 16.0 43.9 40.1 <5.0
3 Reading 218 69 218 441.2 80.3 19.7 7.3 12.4 59.2 8.7 12.4Mathematics 248 74 248 437.3 78.2 21.8 8.9 12.9 50.0 20.6 7.7Writing 245 6.3 46.1 53.9 <5.0 49.0 45.7 <5.0 <5.0
4 Reading 197 81 197 470.6 84.8 15.2 <5.0 13.7 49.7 20.3 14.7Mathematics 232 79 232 464.0 79.7 20.3 5.6 14.7 43.5 22.0 14.2Writing 233 6.4 42.1 57.9 9.4 48.5 39.9 <5.0 <5.0Science 236 319.9 93.2 6.8 <5.0 6.4 56.8 25.0 11.4Social Studies 233 307.5 71.2 28.8 6.0 22.7 56.7 10.3 <5.0
5 Reading 215 77 215 483.7 81.9 18.1 6.0 12.1 52.1 20.9 8.8Mathematics 253 71 254 475.3 73.2 26.8 13.0 13.8 49.6 15.0 8.7Writing 253 7.4 56.1 43.9 <5.0 39.9 55.3 <5.0 <5.0
6 Reading 201 59 201 476.9 74.1 25.9 8.5 17.4 55.7 15.9 <5.0Mathematics 212 64 226 481.8 68.6 31.4 17.7 13.7 55.3 5.8 7.5Writing 226 7.3 49.6 50.4 <5.0 46.5 46.5 <5.0 <5.0Science 224 310.7 75.9 24.1 <5.0 21.4 57.6 10.7 7.6Social Studies 224 301.8 52.2 47.8 11.2 36.6 48.2 <5.0 <5.0
7 Reading 224 67 224 489.0 79.0 21.0 8.9 12.1 63.4 13.8 <5.0Mathematics 244 55 244 478.1 52.5 47.5 33.2 14.3 38.1 8.6 5.7Writing 244 7.0 42.2 57.8 10.7 47.1 40.2 <5.0 <5.0
8 Reading 262 64 262 510.3 69.8 30.2 9.2 21.0 58.0 10.3 <5.0Mathematics 268 61 274 488.7 51.8 48.2 32.5 15.7 32.8 12.0 6.9Writing 272 7.7 63.2 36.8 <5.0 33.5 58.8 <5.0 <5.0Science 263 299.5 50.2 49.8 25.1 24.7 31.2 10.6 8.4Social Studies 264 295.0 40.2 59.8 25.8 34.1 34.1 <5.0 <5.0
9 Reading 231 67 231 515.4 71.9 28.1 12.6 15.6 60.2 6.9 <5.0Mathematics 226 76 235 512.7 39.1 60.9 20.9 40.0 26.0 5.1 8.1Writing 233 8.4 71.7 28.3 <5.0 26.2 53.2 17.2 <5.0
10 Reading 143 70 143 517.4 69.2 30.8 8.4 22.4 60.1 6.3 <5.0Mathematics 146 64 146 526.6 50.0 50.0 30.8 19.2 32.9 6.8 10.3Writing 145 7.7 59.3 40.7 <5.0 36.6 53.8 5.5 <5.0
11 Science 106 307.4 61.3 38.7 5.7 33.0 44.3 7.5 9.4Social Studies 106 301.2 50.9 49.1 12.3 36.8 36.8 9.4 <5.0
(Table continued on following page.)
102

TABLE 8DELAWARE STUDENT TESTING PROGRAM
PERCENTILE RANKINGS, STANDARDS-BASED SCORES, AND PERFORMANCE LEVELSSTATEWIDE AND DISTRICT RESULTS
FALL 2006 and SPRING 2007**
School District Content Area N PR N SBS
% Meets or Exceeds Standard
% Below Standard
% Well Below
% Below
% Meets
% Exceeds
% Distinguished
Performance LevelsNational
Percentile Rankings*Mean
Scores*
Gra
de
Smyrna 2 Reading 305 67 305 400.2 83.6 16.4 <5.0 16.4 50.5 33.1 <5.0Mathematics 329 66 329 402.9 92.1 7.9 <5.0 7.9 41.9 50.2 <5.0
3 Reading 267 77 267 454.7 92.1 7.9 <5.0 6.4 55.8 19.1 17.2Mathematics 293 79 294 446.7 86.4 13.6 <5.0 9.9 51.0 26.2 9.2Writing 293 7.5 77.5 22.5 <5.0 20.8 70.3 6.1 <5.0
4 Reading 287 82 287 472.0 87.8 12.2 <5.0 10.5 51.6 21.6 14.6Mathematics 324 78 325 464.6 83.1 16.9 5.5 11.4 47.1 23.1 12.9Writing 324 6.6 48.1 51.9 12.7 39.2 44.8 <5.0 <5.0Science 318 320.0 94.0 6.0 <5.0 <5.0 57.5 24.5 11.9Social Studies 317 307.5 76.0 24.0 8.2 15.8 61.8 9.8 <5.0
5 Reading 301 81 302 492.0 93.4 6.6 <5.0 6.0 57.6 26.2 9.6Mathematics 341 77 341 480.6 82.1 17.9 6.7 11.1 58.4 16.1 7.6Writing 342 7.6 58.8 41.2 <5.0 39.2 55.3 <5.0 <5.0
6 Reading 299 67 298 488.5 87.2 12.8 <5.0 10.4 59.7 24.8 <5.0Mathematics 338 67 340 492.1 77.9 22.1 11.5 10.6 56.5 10.6 10.9Writing 338 7.8 68.6 31.4 <5.0 29.3 64.8 <5.0 <5.0Science 333 315.0 86.5 13.5 <5.0 11.1 60.7 17.1 8.7Social Studies 333 306.8 70.3 29.7 <5.0 26.7 63.7 5.4 <5.0
7 Reading 331 76 331 502.2 90.3 9.7 <5.0 6.9 65.9 22.1 <5.0Mathematics 383 66 383 488.0 63.4 36.6 23.2 13.3 41.8 13.3 8.4Writing 382 7.2 49.2 50.8 7.3 43.5 47.6 <5.0 <5.0
8 Reading 374 71 374 519.8 82.4 17.6 <5.0 15.2 70.1 11.0 <5.0Mathematics 416 65 416 499.2 59.4 40.6 22.8 17.8 34.6 13.9 10.8Writing 414 7.6 60.6 39.4 <5.0 36.0 56.8 <5.0 <5.0Science 409 303.1 59.2 40.8 20.0 20.8 40.3 11.2 7.6Social Studies 410 298.4 48.3 51.7 15.9 35.9 42.7 <5.0 <5.0
9 Reading 319 71 319 517.2 74.9 25.1 8.2 16.9 64.6 6.9 <5.0Mathematics 338 77 339 516.5 53.4 46.6 14.7 31.9 42.5 <5.0 7.1Writing 335 7.9 65.4 34.6 <5.0 30.4 57.9 6.9 <5.0
10 Reading 233 74 233 512.4 67.8 32.2 9.0 23.2 64.4 <5.0 <5.0Mathematics 241 73 241 533.2 61.0 39.0 23.7 15.4 39.4 10.8 10.8Writing 241 7.7 56.4 43.6 <5.0 40.2 51.0 5.4 <5.0
11 Science 223 301.5 53.8 46.2 15.2 30.9 43.5 5.8 <5.0Social Studies 221 297.4 48.9 51.1 18.1 33.0 36.2 10.9 <5.0
(Table continued on following page.)
103

TABLE 8DELAWARE STUDENT TESTING PROGRAM
PERCENTILE RANKINGS, STANDARDS-BASED SCORES, AND PERFORMANCE LEVELSSTATEWIDE AND DISTRICT RESULTS
FALL 2006 and SPRING 2007**
School District Content Area N PR N SBS
% Meets or Exceeds Standard
% Below Standard
% Well Below
% Below
% Meets
% Exceeds
% Distinguished
Performance LevelsNational
Percentile Rankings*Mean
Scores*
Gra
de
Sussex Technical 8 Reading 2 56 2 504.0 - - - - - - -Mathematics 2 18 2 444.0 - - - - - - -Writing 2 8.5 - - - - - - -Science 2 276.0 - - - - - - -Social Studies 2 282.5 - - - - - - -
9 Reading 333 86 333 547.0 94.0 6.0 <5.0 <5.0 59.8 22.8 11.4Mathematics 347 87 347 536.1 74.6 25.4 5.5 19.9 45.0 15.0 14.7Writing 347 9.0 93.9 6.1 <5.0 6.1 74.6 19.0 <5.0
10 Reading 276 81 276 538.1 90.2 9.8 <5.0 8.0 71.7 14.5 <5.0Mathematics 284 79 284 546.4 75.7 24.3 8.8 15.5 42.3 18.0 15.5Writing 284 8.4 75.0 25.0 <5.0 24.3 55.3 18.7 <5.0
11 Science 291 313.5 74.9 25.1 7.2 17.9 45.0 16.5 13.4Social Studies 291 306.4 64.3 35.7 11.3 24.4 43.6 13.1 7.6
(Table continued on following page.)
104

TABLE 8DELAWARE STUDENT TESTING PROGRAM
PERCENTILE RANKINGS, STANDARDS-BASED SCORES, AND PERFORMANCE LEVELSSTATEWIDE AND DISTRICT RESULTS
FALL 2006 and SPRING 2007**
School District Content Area N PR N SBS
% Meets or Exceeds Standard
% Below Standard
% Well Below
% Below
% Meets
% Exceeds
% Distinguished
Performance LevelsNational
Percentile Rankings*Mean
Scores*
Gra
de
Woodbridge 2 Reading 130 60 130 392.7 75.4 24.6 <5.0 24.6 43.8 31.5 <5.0Mathematics 133 59 133 400.9 91.7 8.3 <5.0 8.3 48.1 43.6 <5.0
3 Reading 155 62 154 433.6 70.1 29.9 13.0 16.9 48.1 13.6 8.4Mathematics 158 57 158 422.3 65.8 34.2 13.9 20.3 48.7 15.2 <5.0Writing 157 7.0 67.5 32.5 <5.0 31.8 65.0 <5.0 <5.0
4 Reading 143 74 143 460.1 74.8 25.2 5.6 19.6 47.6 19.6 7.7Mathematics 147 70 149 453.8 73.2 26.8 9.4 17.4 45.0 22.8 5.4Writing 148 6.8 55.4 44.6 <5.0 39.9 54.7 <5.0 <5.0Science 147 317.9 93.2 6.8 <5.0 6.1 62.6 23.1 7.5Social Studies 147 304.4 66.7 33.3 9.5 23.8 58.5 6.1 <5.0
5 Reading 147 69 147 476.4 82.3 17.7 5.4 12.2 62.6 16.3 <5.0Mathematics 163 67 163 471.4 75.5 24.5 12.3 12.3 63.8 8.6 <5.0Writing 162 7.4 50.6 49.4 <5.0 46.9 50.0 <5.0 <5.0
6 Reading 144 60 144 482.9 79.9 20.1 <5.0 17.4 58.3 18.8 <5.0Mathematics 161 55 161 483.7 72.0 28.0 15.5 12.4 58.4 9.3 <5.0Writing 161 7.7 63.4 36.6 <5.0 34.2 60.9 <5.0 <5.0Science 164 314.6 87.2 12.8 <5.0 12.2 62.2 15.2 9.8Social Studies 164 305.2 64.0 36.0 5.5 30.5 56.7 5.5 <5.0
7 Reading 161 68 161 495.7 84.5 15.5 <5.0 13.7 67.7 15.5 <5.0Mathematics 189 54 189 481.2 62.4 37.6 21.2 16.4 52.4 7.9 <5.0Writing 189 7.1 43.9 56.1 5.8 50.3 42.9 <5.0 <5.0
8 Reading 131 66 131 515.0 74.0 26.0 <5.0 23.7 65.6 8.4 <5.0Mathematics 148 56 148 489.3 48.0 52.0 29.1 23.0 32.4 10.8 <5.0Writing 148 7.8 70.9 29.1 <5.0 27.0 68.2 <5.0 <5.0Science 145 304.3 60.7 39.3 15.9 23.4 42.1 11.0 7.6Social Studies 144 296.1 34.7 65.3 12.5 52.8 32.6 <5.0 <5.0
9 Reading 129 66 129 511.6 64.3 35.7 7.0 28.7 60.5 <5.0 <5.0Mathematics 157 67 159 500.0 30.2 69.8 33.3 36.5 21.4 5.0 <5.0Writing 158 7.9 63.3 36.7 <5.0 32.9 51.3 10.8 <5.0
10 Reading 98 69 98 508.8 57.1 42.9 8.2 34.7 52.0 5.1 <5.0Mathematics 103 60 106 520.2 42.5 57.5 39.6 17.9 28.3 6.6 7.5Writing 105 7.2 42.9 57.1 5.7 51.4 40.0 <5.0 <5.0
11 Science 93 301.1 61.3 38.7 11.8 26.9 54.8 5.4 <5.0Social Studies 93 294.4 39.8 60.2 20.4 39.8 29.0 7.5 <5.0
(Table continued on following page.)
105

TABLE 8DELAWARE STUDENT TESTING PROGRAM
PERCENTILE RANKINGS, STANDARDS-BASED SCORES, AND PERFORMANCE LEVELSSTATEWIDE AND DISTRICT RESULTS
FALL 2006 and SPRING 2007**
School District Content Area N PR N SBS
% Meets or Exceeds Standard
% Below Standard
% Well Below
% Below
% Meets
% Exceeds
% Distinguished
Performance LevelsNational
Percentile Rankings*Mean
Scores*
Gra
de
Academy of Dover 2 Reading 48 34 48 355.3 47.9 52.1 <5.0 52.1 41.7 6.3 <5.0Charter School Mathematics 48 27 48 351.4 41.7 58.3 <5.0 58.3 29.2 12.5 <5.0
3 Reading 33 36 33 398.9 24.2 75.8 33.3 42.4 18.2 6.1 <5.0Mathematics 36 34 36 385.1 27.8 72.2 47.2 25.0 27.8 <5.0 <5.0Writing 36 5.7 33.3 66.7 11.1 55.6 33.3 <5.0 <5.0
4 Reading 23 59 23 437.0 52.2 47.8 17.4 30.4 52.2 <5.0 <5.0Mathematics 24 53 24 426.1 37.5 62.5 29.2 33.3 33.3 <5.0 <5.0Writing 24 6.8 58.3 41.7 <5.0 37.5 58.3 <5.0 <5.0Science 27 309.6 88.9 11.1 <5.0 11.1 85.2 <5.0 <5.0Social Studies 27 287.6 25.9 74.1 37.0 37.0 25.9 <5.0 <5.0
5 Reading 18 61 18 463.9 66.7 33.3 11.1 22.2 61.1 <5.0 5.6Mathematics 19 42 19 439.1 36.8 63.2 36.8 26.3 36.8 <5.0 <5.0Writing 20 7.6 55.0 45.0 <5.0 45.0 55.0 <5.0 <5.0
6 Reading 14 53 14 464.1 - - - - - - -Mathematics 16 40 16 457.0 37.5 62.5 50.0 12.5 37.5 <5.0 <5.0Writing 16 8.3 75.0 25.0 <5.0 25.0 68.8 6.3 <5.0Science 17 300.6 52.9 47.1 17.6 29.4 52.9 <5.0 <5.0Social Studies 17 295.4 23.5 76.5 17.6 58.8 23.5 <5.0 <5.0
(Table continued on following page.)
106

TABLE 8DELAWARE STUDENT TESTING PROGRAM
PERCENTILE RANKINGS, STANDARDS-BASED SCORES, AND PERFORMANCE LEVELSSTATEWIDE AND DISTRICT RESULTS
FALL 2006 and SPRING 2007**
School District Content Area N PR N SBS
% Meets or Exceeds Standard
% Below Standard
% Well Below
% Below
% Meets
% Exceeds
% Distinguished
Performance LevelsNational
Percentile Rankings*Mean
Scores*
Gra
de
Campus Community 2 Reading 38 72 38 408.7 86.8 13.2 <5.0 13.2 47.4 39.5 <5.0Charter School Mathematics 41 49 41 387.0 80.5 19.5 <5.0 19.5 41.5 39.0 <5.0
3 Reading 37 79 37 452.1 89.2 10.8 <5.0 8.1 62.2 13.5 13.5Mathematics 38 71 38 449.1 84.2 15.8 <5.0 13.2 50.0 28.9 5.3Writing 38 7.7 78.9 21.1 <5.0 21.1 71.1 7.9 <5.0
4 Reading 42 86 42 477.5 88.1 11.9 <5.0 9.5 45.2 14.3 28.6Mathematics 42 82 42 471.7 88.1 11.9 <5.0 7.1 45.2 28.6 14.3Writing 42 7.2 64.3 35.7 <5.0 33.3 64.3 <5.0 <5.0Science 43 322.5 93.0 7.0 <5.0 7.0 44.2 34.9 14.0Social Studies 43 307.6 69.8 30.2 9.3 20.9 55.8 11.6 <5.0
5 Reading 42 82 42 495.2 88.1 11.9 <5.0 11.9 42.9 31.0 14.3Mathematics 44 70 44 485.1 81.8 18.2 9.1 9.1 47.7 29.5 <5.0Writing 44 8.0 72.7 27.3 <5.0 25.0 63.6 9.1 <5.0
6 Reading 47 68 47 487.3 80.9 19.1 6.4 12.8 57.4 21.3 <5.0Mathematics 47 56 47 485.8 72.3 27.7 21.3 6.4 51.1 10.6 10.6Writing 47 8.3 76.6 23.4 <5.0 23.4 66.0 10.6 <5.0Science 47 316.6 85.1 14.9 <5.0 14.9 53.2 25.5 6.4Social Studies 47 308.0 74.5 25.5 <5.0 23.4 70.2 <5.0 <5.0
7 Reading 48 81 48 509.9 91.7 8.3 <5.0 6.3 52.1 35.4 <5.0Mathematics 49 72 49 496.4 71.4 28.6 16.3 12.2 40.8 14.3 16.3Writing 49 8.1 71.4 28.6 <5.0 28.6 65.3 6.1 <5.0
8 Reading 72 73 72 522.9 84.7 15.3 <5.0 11.1 72.2 6.9 5.6Mathematics 72 65 72 494.7 54.2 45.8 26.4 19.4 29.2 15.3 9.7Writing 72 8.5 86.1 13.9 <5.0 13.9 77.8 8.3 <5.0Science 72 296.9 48.6 51.4 19.4 31.9 37.5 <5.0 6.9Social Studies 72 295.6 40.3 59.7 20.8 38.9 34.7 <5.0 <5.0
9 Reading 54 69 54 521.7 70.4 29.6 5.6 24.1 53.7 13.0 <5.0Mathematics 56 66 57 501.6 36.8 63.2 35.1 28.1 29.8 7.0 <5.0Writing 57 8.6 75.4 24.6 <5.0 24.6 54.4 21.1 <5.0
10 Reading 36 80 36 523.2 83.3 16.7 <5.0 13.9 72.2 8.3 <5.0Mathematics 36 74 36 532.2 61.1 38.9 22.2 16.7 44.4 8.3 8.3Writing 36 8.5 75.0 25.0 <5.0 25.0 52.8 22.2 <5.0
11 Science 35 308.4 65.7 34.3 <5.0 31.4 45.7 8.6 11.4Social Studies 35 302.3 42.9 57.1 <5.0 54.3 28.6 5.7 8.6
(Table continued on following page.)
107

TABLE 8DELAWARE STUDENT TESTING PROGRAM
PERCENTILE RANKINGS, STANDARDS-BASED SCORES, AND PERFORMANCE LEVELSSTATEWIDE AND DISTRICT RESULTS
FALL 2006 and SPRING 2007**
School District Content Area N PR N SBS
% Meets or Exceeds Standard
% Below Standard
% Well Below
% Below
% Meets
% Exceeds
% Distinguished
Performance LevelsNational
Percentile Rankings*Mean
Scores*
Gra
de
Charter School 9 Reading 242 97 242 591.6 >95 <5.0 <5.0 <5.0 13.2 35.5 51.2of Wilmington Mathematics 242 97 242 592.2 >95 <5.0 <5.0 <5.0 9.9 10.7 78.1
Writing 242 10.4 >95 <5.0 <5.0 <5.0 27.3 48.3 24.010 Reading 225 94 225 570.0 >95 <5.0 <5.0 <5.0 37.3 40.9 20.9
Mathematics 225 96 225 612.1 >95 <5.0 <5.0 <5.0 6.2 9.8 82.2Writing 225 10.1 >95 <5.0 <5.0 <5.0 39.1 45.3 15.6
11 Science 250 338.3 >95 <5.0 <5.0 <5.0 18.0 28.0 54.0Social Studies 250 338.7 >95 <5.0 <5.0 <5.0 17.2 26.0 56.0
Delaware Military 9 Reading 138 85 138 540.3 94.9 5.1 <5.0 <5.0 66.7 23.2 5.1Academy Mathematics 139 87 139 536.6 71.9 28.1 <5.0 23.7 43.9 12.9 15.1
Writing 138 9.0 >95 <5.0 <5.0 <5.0 78.3 18.1 <5.010 Reading 131 81 131 533.0 91.6 8.4 <5.0 6.9 77.9 13.0 <5.0
Mathematics 131 79 131 543.2 72.5 27.5 10.7 16.8 40.5 16.8 15.3Writing 131 8.8 91.6 8.4 <5.0 8.4 73.3 17.6 <5.0
11 Science 115 310.8 78.3 21.7 <5.0 20.0 60.9 11.3 6.1Social Studies 115 310.7 78.3 21.7 <5.0 20.0 56.5 17.4 <5.0
(Table continued on following page.)
108

TABLE 8DELAWARE STUDENT TESTING PROGRAM
PERCENTILE RANKINGS, STANDARDS-BASED SCORES, AND PERFORMANCE LEVELSSTATEWIDE AND DISTRICT RESULTS
FALL 2006 and SPRING 2007**
School District Content Area N PR N SBS
% Meets or Exceeds Standard
% Below Standard
% Well Below
% Below
% Meets
% Exceeds
% Distinguished
Performance LevelsNational
Percentile Rankings*Mean
Scores*
Gra
de
East Side 2 Reading 34 34 34 354.1 38.2 61.8 <5.0 61.8 32.4 5.9 <5.0Charter School Mathematics 36 24 36 339.7 36.1 63.9 <5.0 63.9 30.6 5.6 <5.0
3 Reading 30 53 30 421.2 53.3 46.7 6.7 40.0 43.3 <5.0 6.7Mathematics 32 47 32 402.8 37.5 62.5 15.6 46.9 34.4 <5.0 <5.0Writing 32 6.9 62.5 37.5 <5.0 37.5 62.5 <5.0 <5.0
4 Reading 17 55 17 426.9 41.2 58.8 29.4 29.4 41.2 <5.0 <5.0Mathematics 20 39 20 414.0 30.0 70.0 45.0 25.0 30.0 <5.0 <5.0Writing 20 5.4 10.0 90.0 20.0 70.0 10.0 <5.0 <5.0Science 20 310.0 75.0 25.0 5.0 20.0 55.0 20.0 <5.0Social Studies 20 297.1 40.0 60.0 25.0 35.0 35.0 5.0 <5.0
5 Reading 9 41 9 432.2 - - - - - - -Mathematics 12 35 12 427.3 - - - - - - -Writing 12 5.8 - - - - - - -
6 Reading 19 38 19 457.8 42.1 57.9 15.8 42.1 36.8 5.3 <5.0Mathematics 20 41 20 459.0 45.0 55.0 45.0 10.0 40.0 <5.0 5.0Writing 20 7.1 30.0 70.0 <5.0 70.0 30.0 <5.0 <5.0Science 21 298.9 52.4 47.6 9.5 38.1 52.4 <5.0 <5.0Social Studies 21 295.5 33.3 66.7 9.5 57.1 33.3 <5.0 <5.0
7 Reading 3 36 3 458.3 - - - - - - -Mathematics 6 18 6 433.7 - - - - - - -Writing 6 5.7 - - - - - - -
8 Reading 13 59 13 513.6 - - - - - - -Mathematics 14 37 14 464.5 - - - - - - -Writing 14 8.3 - - - - - - -Science 13 277.1 - - - - - - -Social Studies 13 280.8 - - - - - - -
(Table continued on following page.)
109

TABLE 8DELAWARE STUDENT TESTING PROGRAM
PERCENTILE RANKINGS, STANDARDS-BASED SCORES, AND PERFORMANCE LEVELSSTATEWIDE AND DISTRICT RESULTS
FALL 2006 and SPRING 2007**
School District Content Area N PR N SBS
% Meets or Exceeds Standard
% Below Standard
% Well Below
% Below
% Meets
% Exceeds
% Distinguished
Performance LevelsNational
Percentile Rankings*Mean
Scores*
Gra
de
Family Foundations 2 Reading 76 44 76 365.3 56.6 43.4 <5.0 43.4 43.4 13.2 <5.0Charter School Mathematics 77 32 79 361.6 58.2 41.8 <5.0 41.8 41.8 16.5 <5.0
3 Reading 67 56 67 425.9 55.2 44.8 17.9 26.9 38.8 7.5 9.0Mathematics 68 63 68 420.0 60.3 39.7 11.8 27.9 45.6 13.2 <5.0Writing 68 6.6 52.9 47.1 <5.0 44.1 50.0 <5.0 <5.0
Kuumba Academy 2 Reading 31 61 31 398.8 83.9 16.1 <5.0 16.1 51.6 32.3 <5.0Charter School Mathematics 34 77 34 403.4 91.2 8.8 <5.0 8.8 38.2 52.9 <5.0
3 Reading 40 56 40 417.2 57.5 42.5 22.5 20.0 52.5 <5.0 <5.0Mathematics 47 48 47 401.5 46.8 53.2 21.3 31.9 42.6 <5.0 <5.0Writing 47 6.5 48.9 51.1 <5.0 46.8 48.9 <5.0 <5.0
4 Reading 29 60 29 442.8 41.4 58.6 31.0 27.6 17.2 17.2 6.9Mathematics 37 63 37 433.9 40.5 59.5 29.7 29.7 27.0 10.8 <5.0Writing 37 6.8 54.1 45.9 <5.0 45.9 54.1 <5.0 <5.0Science 37 309.2 81.1 18.9 <5.0 18.9 73.0 5.4 <5.0Social Studies 37 299.4 45.9 54.1 16.2 37.8 43.2 <5.0 <5.0
5 Reading 31 65 31 465.6 71.0 29.0 9.7 19.4 64.5 6.5 <5.0Mathematics 36 45 36 445.7 36.1 63.9 30.6 33.3 30.6 <5.0 <5.0Writing 36 7.4 58.3 41.7 <5.0 41.7 58.3 <5.0 <5.0
(Table continued on following page.)
110

TABLE 8DELAWARE STUDENT TESTING PROGRAM
PERCENTILE RANKINGS, STANDARDS-BASED SCORES, AND PERFORMANCE LEVELSSTATEWIDE AND DISTRICT RESULTS
FALL 2006 and SPRING 2007**
School District Content Area N PR N SBS
% Meets or Exceeds Standard
% Below Standard
% Well Below
% Below
% Meets
% Exceeds
% Distinguished
Performance LevelsNational
Percentile Rankings*Mean
Scores*
Gra
de
Marion T. Academy 2 Reading 52 43 52 365.5 55.8 44.2 <5.0 44.2 44.2 11.5 <5.0Charter School Mathematics 59 30 63 354.1 55.6 44.4 <5.0 44.4 44.4 11.1 <5.0
3 Reading 52 52 52 415.4 55.8 44.2 19.2 25.0 51.9 <5.0 <5.0Mathematics 60 42 60 401.5 41.7 58.3 25.0 33.3 38.3 <5.0 <5.0Writing 60 6.3 51.7 48.3 8.3 40.0 50.0 <5.0 <5.0
4 Reading 47 70 47 449.6 61.7 38.3 8.5 29.8 53.2 8.5 <5.0Mathematics 63 49 63 427.1 49.2 50.8 34.9 15.9 41.3 7.9 <5.0Writing 63 6.2 47.6 52.4 22.2 30.2 46.0 <5.0 <5.0Science 65 306.4 67.7 32.3 <5.0 32.3 63.1 <5.0 <5.0Social Studies 65 289.8 26.2 73.8 46.2 27.7 23.1 <5.0 <5.0
5 Reading 31 68 31 473.8 74.2 25.8 6.5 19.4 45.2 25.8 <5.0Mathematics 33 54 33 454.2 57.6 42.4 15.2 27.3 57.6 <5.0 <5.0Writing 35 7.1 40.0 60.0 <5.0 57.1 40.0 <5.0 <5.0
6 Reading 29 47 29 461.8 48.3 51.7 13.8 37.9 41.4 6.9 <5.0Mathematics 36 31 36 453.2 27.8 72.2 50.0 22.2 25.0 <5.0 <5.0Writing 37 6.2 24.3 75.7 16.2 59.5 21.6 <5.0 <5.0Science 38 292.1 31.6 68.4 26.3 42.1 28.9 <5.0 <5.0Social Studies 38 290.2 13.2 86.8 26.3 60.5 13.2 <5.0 <5.0
7 Reading 28 60 28 476.0 57.1 42.9 14.3 28.6 39.3 14.3 <5.0Mathematics 30 46 30 465.0 43.3 56.7 46.7 10.0 40.0 <5.0 <5.0Writing 30 6.3 20.0 80.0 13.3 66.7 20.0 <5.0 <5.0
8 Reading 42 49 42 488.9 42.9 57.1 21.4 35.7 38.1 <5.0 <5.0Mathematics 48 40 48 461.3 12.5 87.5 68.8 18.8 10.4 <5.0 <5.0Writing 48 7.1 41.7 58.3 8.3 50.0 35.4 6.3 <5.0Science 41 274.0 9.8 90.2 73.2 17.1 7.3 <5.0 <5.0Social Studies 39 279.7 10.3 89.7 61.5 28.2 10.3 <5.0 <5.0
(Table continued on following page.)
111

TABLE 8DELAWARE STUDENT TESTING PROGRAM
PERCENTILE RANKINGS, STANDARDS-BASED SCORES, AND PERFORMANCE LEVELSSTATEWIDE AND DISTRICT RESULTS
FALL 2006 and SPRING 2007**
School District Content Area N PR N SBS
% Meets or Exceeds Standard
% Below Standard
% Well Below
% Below
% Meets
% Exceeds
% Distinguished
Performance LevelsNational
Percentile Rankings*Mean
Scores*
Gra
de
MOT Charter 2 Reading 72 72 72 406.2 83.3 16.7 <5.0 16.7 40.3 43.1 <5.0Mathematics 75 66 75 408.3 89.3 10.7 <5.0 10.7 38.7 50.7 <5.0
3 Reading 71 76 71 453.0 85.9 14.1 <5.0 9.9 47.9 23.9 14.1Mathematics 74 77 74 448.5 89.2 10.8 <5.0 9.5 50.0 32.4 6.8Writing 74 7.1 63.5 36.5 <5.0 36.5 59.5 <5.0 <5.0
4 Reading 70 83 70 478.0 94.3 5.7 <5.0 <5.0 52.9 24.3 17.1Mathematics 75 80 75 476.6 85.3 14.7 <5.0 12.0 32.0 30.7 22.7Writing 74 7.5 67.6 32.4 6.8 25.7 55.4 12.2 <5.0Science 75 324.7 >95 <5.0 <5.0 <5.0 42.7 38.7 17.3Social Studies 75 315.0 84.0 16.0 <5.0 14.7 60.0 17.3 6.7
5 Reading 73 86 73 500.3 93.2 6.8 <5.0 6.8 35.6 49.3 8.2Mathematics 74 83 74 492.5 89.2 10.8 <5.0 6.8 54.1 20.3 14.9Writing 74 8.1 74.3 25.7 <5.0 24.3 67.6 6.8 <5.0
6 Reading 70 68 70 493.7 90.0 10.0 <5.0 5.7 55.7 30.0 <5.0Mathematics 72 72 72 503.3 86.1 13.9 6.9 6.9 56.9 11.1 18.1Writing 72 8.2 77.8 22.2 <5.0 20.8 63.9 13.9 <5.0Science 75 316.9 89.3 10.7 <5.0 9.3 60.0 17.3 12.0Social Studies 75 310.2 77.3 22.7 <5.0 18.7 66.7 6.7 <5.0
7 Reading 72 77 72 509.0 >95 <5.0 <5.0 <5.0 66.7 23.6 5.6Mathematics 74 71 74 499.7 71.6 28.4 10.8 17.6 43.2 14.9 13.5Writing 74 8.4 85.1 14.9 <5.0 14.9 75.7 9.5 <5.0
8 Reading 71 85 71 546.2 >95 <5.0 <5.0 <5.0 57.7 31.0 8.5Mathematics 73 84 73 531.4 86.3 13.7 <5.0 9.6 31.5 19.2 35.6Writing 73 9.2 >95 <5.0 <5.0 <5.0 72.6 21.9 <5.0Science 73 325.6 91.8 8.2 <5.0 6.8 37.0 23.3 31.5Social Studies 73 313.2 75.3 24.7 <5.0 23.3 52.1 16.4 6.8
(Table continued on following page.)
112
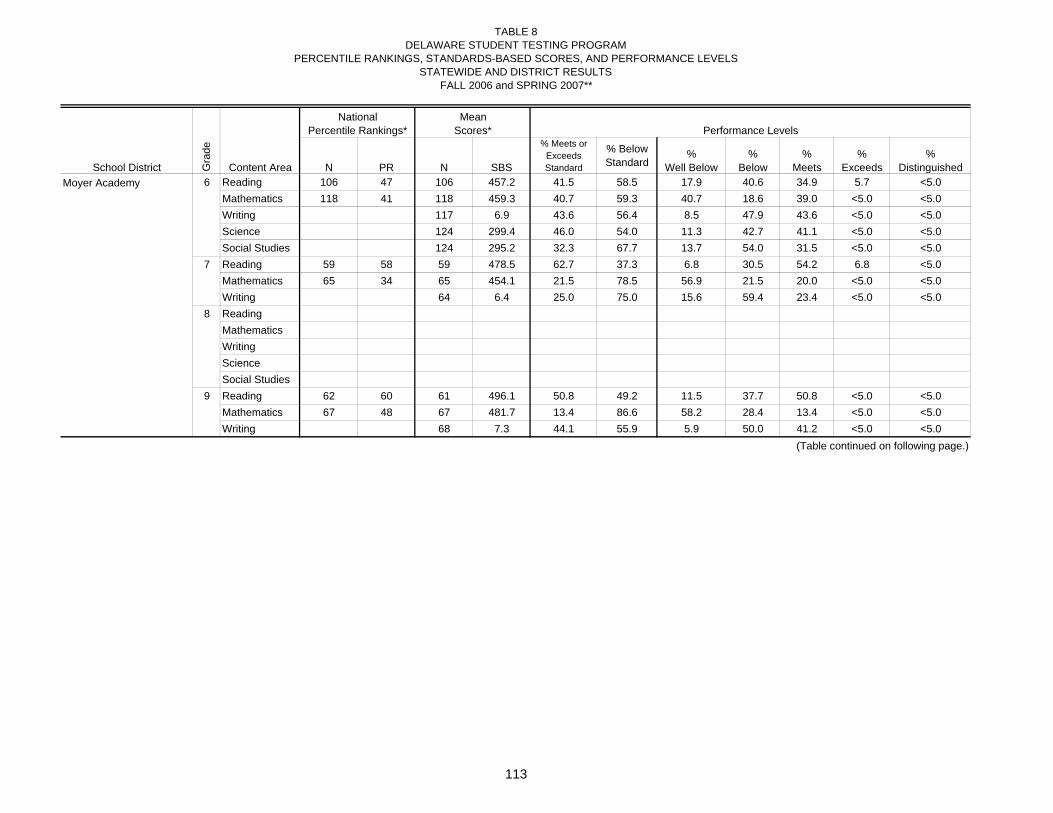
TABLE 8DELAWARE STUDENT TESTING PROGRAM
PERCENTILE RANKINGS, STANDARDS-BASED SCORES, AND PERFORMANCE LEVELSSTATEWIDE AND DISTRICT RESULTS
FALL 2006 and SPRING 2007**
School District Content Area N PR N SBS
% Meets or Exceeds Standard
% Below Standard
% Well Below
% Below
% Meets
% Exceeds
% Distinguished
Performance LevelsNational
Percentile Rankings*Mean
Scores*
Gra
de
Moyer Academy 6 Reading 106 47 106 457.2 41.5 58.5 17.9 40.6 34.9 5.7 <5.0Mathematics 118 41 118 459.3 40.7 59.3 40.7 18.6 39.0 <5.0 <5.0Writing 117 6.9 43.6 56.4 8.5 47.9 43.6 <5.0 <5.0Science 124 299.4 46.0 54.0 11.3 42.7 41.1 <5.0 <5.0Social Studies 124 295.2 32.3 67.7 13.7 54.0 31.5 <5.0 <5.0
7 Reading 59 58 59 478.5 62.7 37.3 6.8 30.5 54.2 6.8 <5.0Mathematics 65 34 65 454.1 21.5 78.5 56.9 21.5 20.0 <5.0 <5.0Writing 64 6.4 25.0 75.0 15.6 59.4 23.4 <5.0 <5.0
8 ReadingMathematicsWritingScienceSocial Studies
9 Reading 62 60 61 496.1 50.8 49.2 11.5 37.7 50.8 <5.0 <5.0Mathematics 67 48 67 481.7 13.4 86.6 58.2 28.4 13.4 <5.0 <5.0Writing 68 7.3 44.1 55.9 5.9 50.0 41.2 <5.0 <5.0
(Table continued on following page.)
113
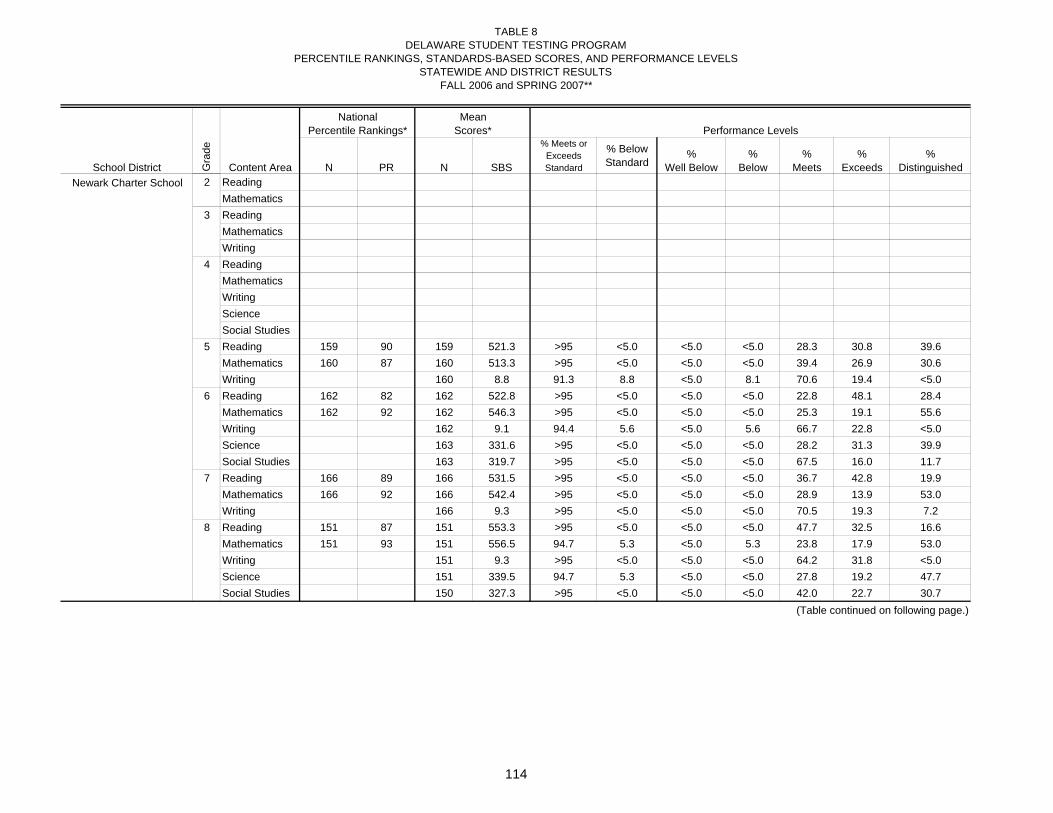
TABLE 8DELAWARE STUDENT TESTING PROGRAM
PERCENTILE RANKINGS, STANDARDS-BASED SCORES, AND PERFORMANCE LEVELSSTATEWIDE AND DISTRICT RESULTS
FALL 2006 and SPRING 2007**
School District Content Area N PR N SBS
% Meets or Exceeds Standard
% Below Standard
% Well Below
% Below
% Meets
% Exceeds
% Distinguished
Performance LevelsNational
Percentile Rankings*Mean
Scores*
Gra
de
Newark Charter School 2 ReadingMathematics
3 ReadingMathematicsWriting
4 ReadingMathematicsWritingScienceSocial Studies
5 Reading 159 90 159 521.3 >95 <5.0 <5.0 <5.0 28.3 30.8 39.6Mathematics 160 87 160 513.3 >95 <5.0 <5.0 <5.0 39.4 26.9 30.6Writing 160 8.8 91.3 8.8 <5.0 8.1 70.6 19.4 <5.0
6 Reading 162 82 162 522.8 >95 <5.0 <5.0 <5.0 22.8 48.1 28.4Mathematics 162 92 162 546.3 >95 <5.0 <5.0 <5.0 25.3 19.1 55.6Writing 162 9.1 94.4 5.6 <5.0 5.6 66.7 22.8 <5.0Science 163 331.6 >95 <5.0 <5.0 <5.0 28.2 31.3 39.9Social Studies 163 319.7 >95 <5.0 <5.0 <5.0 67.5 16.0 11.7
7 Reading 166 89 166 531.5 >95 <5.0 <5.0 <5.0 36.7 42.8 19.9Mathematics 166 92 166 542.4 >95 <5.0 <5.0 <5.0 28.9 13.9 53.0Writing 166 9.3 >95 <5.0 <5.0 <5.0 70.5 19.3 7.2
8 Reading 151 87 151 553.3 >95 <5.0 <5.0 <5.0 47.7 32.5 16.6Mathematics 151 93 151 556.5 94.7 5.3 <5.0 5.3 23.8 17.9 53.0Writing 151 9.3 >95 <5.0 <5.0 <5.0 64.2 31.8 <5.0Science 151 339.5 94.7 5.3 <5.0 <5.0 27.8 19.2 47.7Social Studies 150 327.3 >95 <5.0 <5.0 <5.0 42.0 22.7 30.7
(Table continued on following page.)
114

TABLE 8DELAWARE STUDENT TESTING PROGRAM
PERCENTILE RANKINGS, STANDARDS-BASED SCORES, AND PERFORMANCE LEVELSSTATEWIDE AND DISTRICT RESULTS
FALL 2006 and SPRING 2007**
School District Content Area N PR N SBS
% Meets or Exceeds Standard
% Below Standard
% Well Below
% Below
% Meets
% Exceeds
% Distinguished
Performance LevelsNational
Percentile Rankings*Mean
Scores*
Gra
de
Odyssey Charter 2 Reading 17 73 17 408.5 88.2 11.8 <5.0 11.8 35.3 52.9 <5.0Mathematics 17 81 17 419.2 94.1 5.9 <5.0 5.9 41.2 52.9 <5.0
3 ReadingMathematicsWriting
Pencader Business 9 Reading 217 77 217 525.7 75.1 24.9 6.5 18.4 51.6 19.8 <5.0 and Finance Mathematics 217 77 218 517.5 53.2 46.8 20.6 26.1 36.7 7.8 8.7
Writing 215 8.7 87.0 13.0 <5.0 12.6 71.2 15.3 <5.010 Reading 85 65 85 507.1 62.4 37.6 8.2 29.4 62.4 <5.0 <5.0
Mathematics 85 59 85 512.5 31.8 68.2 47.1 21.2 27.1 <5.0 <5.0Writing 85 7.8 62.4 37.6 <5.0 37.6 60.0 <5.0 <5.0
11 ScienceSocial Studies
(Table continued on following page.)
115

TABLE 8DELAWARE STUDENT TESTING PROGRAM
PERCENTILE RANKINGS, STANDARDS-BASED SCORES, AND PERFORMANCE LEVELSSTATEWIDE AND DISTRICT RESULTS
FALL 2006 and SPRING 2007**
School District Content Area N PR N SBS
% Meets or Exceeds Standard
% Below Standard
% Well Below
% Below
% Meets
% Exceeds
% Distinguished
Performance LevelsNational
Percentile Rankings*Mean
Scores*
Gra
de
Positive Outcomes 7 Reading 10 52 10 467.1 - - - - - - -Charter School Mathematics 13 44 13 455.6 - - - - - - -
Writing 13 4.6 - - - - - - -8 Reading 17 41 17 478.1 35.3 64.7 35.3 29.4 35.3 <5.0 <5.0
Mathematics 24 51 24 477.5 37.5 62.5 41.7 20.8 25.0 <5.0 8.3Writing 24 6.5 16.7 83.3 12.5 70.8 16.7 <5.0 <5.0Science 23 292.5 52.2 47.8 30.4 17.4 34.8 17.4 <5.0Social Studies 23 290.4 30.4 69.6 21.7 47.8 30.4 <5.0 <5.0
9 Reading 20 50 20 486.5 25.0 75.0 20.0 55.0 20.0 5.0 <5.0Mathematics 25 56 25 489.3 16.0 84.0 48.0 36.0 16.0 <5.0 <5.0Writing 25 6.4 36.0 64.0 16.0 48.0 32.0 <5.0 <5.0
10 Reading 16 61 16 499.3 56.3 43.8 18.8 25.0 50.0 6.3 <5.0Mathematics 18 66 19 521.4 26.3 73.7 47.4 26.3 15.8 5.3 5.3Writing 19 6.4 31.6 68.4 21.1 47.4 31.6 <5.0 <5.0
11 Science 13 292.8 - - - - - - -Social Studies 13 283.0 - - - - - - -
(Table continued on following page.)
116

TABLE 8DELAWARE STUDENT TESTING PROGRAM
PERCENTILE RANKINGS, STANDARDS-BASED SCORES, AND PERFORMANCE LEVELSSTATEWIDE AND DISTRICT RESULTS
FALL 2006 and SPRING 2007**
School District Content Area N PR N SBS
% Meets or Exceeds Standard
% Below Standard
% Well Below
% Below
% Meets
% Exceeds
% Distinguished
Performance LevelsNational
Percentile Rankings*Mean
Scores*
Gra
de
Providence Creek 2 Reading 54 56 54 384.5 74.1 25.9 <5.0 25.9 48.1 25.9 <5.0Charter School Mathematics 56 50 56 388.2 82.1 17.9 <5.0 17.9 48.2 33.9 <5.0
3 Reading 70 63 70 426.8 70.0 30.0 15.7 14.3 55.7 7.1 7.1Mathematics 73 61 73 420.4 65.8 34.2 16.4 17.8 49.3 13.7 <5.0Writing 72 6.0 38.9 61.1 <5.0 58.3 38.9 <5.0 <5.0
4 Reading 69 74 69 453.9 69.6 30.4 13.0 17.4 49.3 17.4 <5.0Mathematics 71 69 72 446.1 70.8 29.2 6.9 22.2 58.3 11.1 <5.0Writing 71 6.5 47.9 52.1 8.5 43.7 47.9 <5.0 <5.0Science 74 318.0 94.6 5.4 <5.0 5.4 63.5 25.7 5.4Social Studies 74 303.3 68.9 31.1 8.1 23.0 60.8 8.1 <5.0
5 Reading 68 70 68 471.8 72.1 27.9 10.3 17.6 48.5 23.5 <5.0Mathematics 74 54 75 456.5 58.7 41.3 29.3 12.0 45.3 12.0 <5.0Writing 75 7.1 50.7 49.3 5.3 44.0 50.7 <5.0 <5.0
6 Reading 66 60 66 477.4 77.3 22.7 10.6 12.1 59.1 16.7 <5.0Mathematics 72 51 72 470.3 58.3 41.7 30.6 11.1 50.0 5.6 <5.0Writing 72 7.7 69.4 30.6 5.6 25.0 65.3 <5.0 <5.0Science 76 312.0 85.5 14.5 5.3 9.2 69.7 7.9 7.9Social Studies 76 304.3 63.2 36.8 <5.0 32.9 57.9 <5.0 <5.0
7 Reading 71 70 71 496.1 78.9 21.1 5.6 15.5 53.5 25.4 <5.0Mathematics 74 64 74 479.5 63.5 36.5 23.0 13.5 55.4 <5.0 5.4Writing 73 7.6 63.0 37.0 5.5 31.5 57.5 5.5 <5.0
8 Reading 77 73 77 519.3 92.2 7.8 <5.0 5.2 83.1 9.1 <5.0Mathematics 78 66 78 494.8 59.0 41.0 19.2 21.8 43.6 9.0 6.4Writing 78 8.2 79.5 20.5 <5.0 16.7 73.1 6.4 <5.0Science 79 306.3 70.9 29.1 8.9 20.3 55.7 8.9 6.3Social Studies 78 298.7 47.4 52.6 9.0 43.6 43.6 <5.0 <5.0
(Table continued on following page.)
117

TABLE 8DELAWARE STUDENT TESTING PROGRAM
PERCENTILE RANKINGS, STANDARDS-BASED SCORES, AND PERFORMANCE LEVELSSTATEWIDE AND DISTRICT RESULTS
FALL 2006 and SPRING 2007**
School District Content Area N PR N SBS
% Meets or Exceeds Standard
% Below Standard
% Well Below
% Below
% Meets
% Exceeds
% Distinguished
Performance LevelsNational
Percentile Rankings*Mean
Scores*
Gra
de
Sussex Academy 6 Reading 114 80 114 514.3 >95 <5.0 <5.0 <5.0 26.3 55.3 15.8of Arts and Sciences Mathematics 115 81 115 519.5 >95 <5.0 <5.0 <5.0 44.3 27.8 24.3
Writing 115 8.9 91.3 8.7 <5.0 8.7 61.7 25.2 <5.0Science 117 324.7 94.0 6.0 <5.0 6.0 39.3 29.9 24.8Social Studies 117 315.5 88.0 12.0 <5.0 9.4 62.4 17.1 8.5
7 Reading 107 88 107 536.6 >95 <5.0 <5.0 <5.0 29.0 50.5 20.6Mathematics 107 83 107 523.6 94.4 5.6 <5.0 <5.0 43.0 24.3 27.1Writing 107 8.9 90.7 9.3 <5.0 8.4 67.3 21.5 <5.0
8 Reading 97 87 97 562.9 >95 <5.0 <5.0 <5.0 33.0 44.3 20.6Mathematics 97 93 97 555.5 >95 <5.0 <5.0 <5.0 20.6 21.6 53.6Writing 97 9.7 >95 <5.0 <5.0 <5.0 50.5 38.1 10.3Science 96 324.3 90.6 9.4 <5.0 8.3 40.6 26.0 24.0Social Studies 96 319.7 88.5 11.5 <5.0 10.4 51.0 15.6 21.9
(Table continued on following page.)
118

TABLE 8DELAWARE STUDENT TESTING PROGRAM
PERCENTILE RANKINGS, STANDARDS-BASED SCORES, AND PERFORMANCE LEVELSSTATEWIDE AND DISTRICT RESULTS
FALL 2006 and SPRING 2007**
School District Content Area N PR N SBS
% Meets or Exceeds Standard
% Below Standard
% Well Below
% Below
% Meets
% Exceeds
% Distinguished
Performance LevelsNational
Percentile Rankings*Mean
Scores*
Gra
de
Thomas A. Edison 2 Reading 113 42 113 365.2 54.0 46.0 <5.0 46.0 42.5 11.5 <5.0Charter School Mathematics 117 42 117 374.0 68.4 31.6 <5.0 31.6 49.6 18.8 <5.0
3 Reading 98 53 98 423.0 62.2 37.8 17.3 20.4 52.0 5.1 5.1Mathematics 104 53 104 414.9 61.5 38.5 13.5 25.0 52.9 6.7 <5.0Writing 104 5.8 29.8 70.2 5.8 64.4 29.8 <5.0 <5.0
4 Reading 79 67 79 448.8 60.8 39.2 11.4 27.8 45.6 10.1 5.1Mathematics 83 71 83 447.2 67.5 32.5 6.0 26.5 49.4 14.5 <5.0Writing 83 6.1 33.7 66.3 10.8 55.4 33.7 <5.0 <5.0Science 85 309.0 75.3 24.7 <5.0 23.5 64.7 9.4 <5.0Social Studies 85 296.1 43.5 56.5 22.4 34.1 40.0 <5.0 <5.0
5 Reading 67 53 67 456.6 53.7 46.3 22.4 23.9 43.3 7.5 <5.0Mathematics 71 63 71 454.1 52.1 47.9 22.5 25.4 46.5 <5.0 <5.0Writing 71 6.6 29.6 70.4 7.0 63.4 29.6 <5.0 <5.0
6 Reading 63 59 63 474.5 60.3 39.7 9.5 30.2 41.3 19.0 <5.0Mathematics 71 59 71 474.7 50.7 49.3 29.6 19.7 38.0 8.5 <5.0Writing 71 6.8 29.6 70.4 5.6 64.8 28.2 <5.0 <5.0Science 73 301.1 56.2 43.8 9.6 34.2 50.7 <5.0 <5.0Social Studies 73 293.6 28.8 71.2 20.5 50.7 28.8 <5.0 <5.0
7 Reading 54 80 54 508.2 90.7 9.3 <5.0 5.6 53.7 33.3 <5.0Mathematics 59 79 59 503.2 71.2 28.8 18.6 10.2 40.7 10.2 20.3Writing 59 8.1 78.0 22.0 <5.0 20.3 69.5 8.5 <5.0
8 Reading 55 67 55 518.1 81.8 18.2 <5.0 14.5 76.4 5.5 <5.0Mathematics 61 71 61 503.9 63.9 36.1 23.0 13.1 34.4 13.1 16.4Writing 61 8.1 75.4 24.6 <5.0 23.0 72.1 <5.0 <5.0Science 59 288.6 27.1 72.9 32.2 40.7 25.4 <5.0 <5.0Social Studies 57 292.6 43.9 56.1 19.3 36.8 43.9 <5.0 <5.0
**Results for test-takers with valid scores enrolled in public schools. Grades 4 and 6 Science and Social Studies results are from the Fall 2006 administration. All others are from Spring 2007.
*Percentile ranks range from 1 to 99. Reading and mathematics scales are progressive and range from 150 to 800. The writing raw score range is 0 to 15 at each grade.
The range for science and social studies scales is 100 to 500 at each grade.
For information on DSTP please visit our On-line Reports at: http://dstp.doe.k12.de.us/DSTPmart9
Source: Technology Management and Design
119

2007 2007
Notes: Public/Nonpublic results combined prior to 2007. Verbal Scores discontinued beginning in 2006, see previous reports for historical trends.
Source: Technology Management and Design120
FIGURE 51Scholastic Assessment Test: SAT I - Delaware and National Scores, 1992-2007
Recentered Scale Scores
SAT I Mathematics Average Score
450
460
470
480
490
500
510
520
1992 1993 1994 1995 1996 1997 1998 1999 2000 2001 2002 2003 2004 2005 2006 2007
Delaware
Nation
479 502
0
100
200
300
400
500
600
Sco
res
Delaware Nation
SAT I Critical Reading Average Score
467 494
0
100
200
300
400
500
Sco
res
Delaware Nation
SAT I Writing Average Score

TABLE 9SECONDARY SCHOOL GRADUATES BY SEX
September 1, 2006 - August 31, 2007
Diplomas IssuedRecords of Grand
District Females Males Total Performance TotalNEW CASTLE COUNTY
Appoquinimink Middletown . . . . . . . . . . . . . . . . . . . . . . 242 201 443 0 443
BrandywineBrandywine . . . . . . . . . . . . . . . . . . . . . 146 107 253 0 253Concord . . . . . . . . . . . . . . . . . . . . . . . . 113 128 241 2 243Mt. Pleasant . . . . . . . . . . . . . . . . . . . . . 99 94 193 1 194
ChristinaChristiana . . . . . . . . . . . . . . . . . . . . . . . 157 142 299 1 300Glasgow . . . . . . . . . . . . . . . . . . . . . . . . 152 130 282 1 283Newark . . . . . . . . . . . . . . . . . . . . . . . . . 153 179 332 13 345Margaret S. Sterck . . . . . . . . . . . . . . . . 2 3 5 0 5Brennen School . . . . . . . . . . . . . . . . . . 0 0 0 9 9
ColonialJohn G. Leach . . . . . . . . . . . . . . . . . . . 0 0 0 2 2William Penn . . . . . . . . . . . . . . . . . . . . 232 191 423 15 438
Red ClayAlexis I. duPont . . . . . . . . . . . . . . . . . . 128 114 242 5 247Cab Calloway School of the Arts . . . . . 65 28 93 1 94John Dickinson . . . . . . . . . . . . . . . . . . . 92 113 205 10 215Meadowood Program . . . . . . . . . . . . . . 0 0 0 0 0Thomas McKean . . . . . . . . . . . . . . . . . 95 109 204 0 204
New Castle County Vo-TechDelcastle . . . . . . . . . . . . . . . . . . . . . . . 167 146 313 9 322Hodgson . . . . . . . . . . . . . . . . . . . . . . . . 111 128 239 0 239Howard . . . . . . . . . . . . . . . . . . . . . . . . . 92 79 171 0 171
Charter School of Wilmington . . . . . . . . . . . . 108 118 226 0 226Delaware Military Academy . . . . . . . . . . . . . 33 86 119 0 119
Total New Castle County . . . . . 2,187 2,096 4,283 69 4,352KENT COUNTY
Caesar RodneyCaesar Rodney . . . . . . . . . . . . . . . . . . 202 176 378 16 394John S. Charlton . . . . . . . . . . . . . . . . . 0 0 0 15 15
Capital . . . . . . . . . . . . . . . . . . . . . . . . . . . . . . 168 142 310 6 316Lake Forest . . . . . . . . . . . . . . . . . . . . . . . . . . 93 65 158 7 165Milford . . . . . . . . . . . . . . . . . . . . . . . . . . . . . . 106 118 224 2 226Polytech . . . . . . . . . . . . . . . . . . . . . . . . . . . . 126 138 264 1 265Smyrna . . . . . . . . . . . . . . . . . . . . . . . . . . . . . 130 118 248 6 254Campus Community Charter . . . . . . . . . . . . 16 14 30 0 30Positive Outcomes Charter. . . . . . . . . . . . . . 4 7 11 2 13
Total Kent County . . . . . . . . . . . 845 778 1,623 55 1,678 (Table continued on following page)
121

TABLE 9 (Continued)SECONDARY SCHOOL GRADUATES BY SEX
September 1, 2006 - August 31, 2007
Diplomas IssuedRecords of Grand
District Females Males Total Performance TotalSUSSEX COUNTY
Cape HenlopenCape Henlopen . . . . . . . . . . . . . . . . . . 114 117 231 9 240Sussex Consortium . . . . . . . . . . . . . . . 0 0 0 0 0
Delmar . . . . . . . . . . . . . . . . . . . . . . . . . . . . . 56 58 114 4 118Indian River
Howard T. Ennis . . . . . . . . . . . . . . . . . 0 0 0 6 6Indian River . . . . . . . . . . . . . . . . . . . . . 78 94 172 0 172Sussex Central . . . . . . . . . . . . . . . . . . . 119 110 229 5 234
Laurel . . . . . . . . . . . . . . . . . . . . . . . . . . . . . . 51 33 84 6 90Seaford . . . . . . . . . . . . . . . . . . . . . . . . . . . . . 86 59 145 7 152Sussex Technical . . . . . . . . . . . . . . . . . . . . . 141 116 257 0 257Woodbridge . . . . . . . . . . . . . . . . . . . . . . . . . 35 42 77 1 78
Total Sussex County . . . . . . . . . 680 629 1,309 38 1,347JAMES H. GROVES
Appoquinimink . . . . . . . . . . . . . . . . . . . . . . . 4 1 5 0 5Baylor Women's Correctional Institute . . . . . 5 0 5 0 5Christina . . . . . . . . . . . . . . . . . . . . . . . . . . . . 13 5 18 0 18James T. Vaughn Correctional Center . . . . . 0 27 27 0 27Diploma at a Distance . . . . . . . . . . . . . . . . . . 22 21 43 0 43Howard R. Young Correctional Institution . . . 0 22 22 0 22New Castle County Vo-Tech . . . . . . . . . . . . 17 9 26 0 26Polytech . . . . . . . . . . . . . . . . . . . . . . . . . . . . 33 26 59 0 59Red Clay . . . . . . . . . . . . . . . . . . . . . . . . . . . . 23 19 42 0 42Sussex Correctional Institute . . . . . . . . . . . . 0 29 29 0 29Sussex Technical . . . . . . . . . . . . . . . . . . . . . 32 17 49 0 49
Total James H. Groves* . . . . . . 149 176 325 0 325TOTAL STATE REGULAR HIGH SCHOOL . . . . . 3,712 3,503 7,215 162 7,377TOTAL STATE REGULAR PLUS GROVES . . . . . 3,861 3,679 7,540 162 7,702Notes: *Does not include GED recipientsSource: Technology Management and Design
122

TABLE 10SECONDARY SCHOOL GRADUATES BY RACE
September 1, 2006 - August 31, 2007
Diplomas IssuedRecords of Grand
District Black White Other Total Performance TotalNEW CASTLE COUNTY
Appoquinimink Middletown . . . . . . . . . . . . . . . . . . . . . . 73 343 27 443 0 443
BrandywineBrandywine . . . . . . . . . . . . . . . . . . . . . . 69 167 17 253 0 253Concord . . . . . . . . . . . . . . . . . . . . . . . . 81 149 11 241 2 243Mt. Pleasant . . . . . . . . . . . . . . . . . . . . . 71 104 18 193 1 194
ChristinaChristiana . . . . . . . . . . . . . . . . . . . . . . . 146 112 41 299 1 300Glasgow . . . . . . . . . . . . . . . . . . . . . . . . 135 102 45 282 1 283Newark . . . . . . . . . . . . . . . . . . . . . . . . . 93 194 45 332 13 345Margaret S. Sterck . . . . . . . . . . . . . . . . 1 2 2 5 0 5Brennen School . . . . . . . . . . . . . . . . . . 0 0 0 0 9 9
ColonialJohn G. Leach . . . . . . . . . . . . . . . . . . . 0 0 0 0 2 2William Penn . . . . . . . . . . . . . . . . . . . . . 208 161 54 423 15 438
Red ClayAlexis I. duPont . . . . . . . . . . . . . . . . . . . 59 150 33 242 5 247Cab Calloway School of the Arts . . . . . 17 74 2 93 1 94John Dickinson . . . . . . . . . . . . . . . . . . . 80 93 32 205 10 215Meadowood Program . . . . . . . . . . . . . . 0 0 0 0 0 0Thomas McKean . . . . . . . . . . . . . . . . . 57 105 42 204 0 204
New Castle County Vo-TechDelcastle . . . . . . . . . . . . . . . . . . . . . . . . 85 210 18 313 9 322Hodgson . . . . . . . . . . . . . . . . . . . . . . . . 62 165 12 239 0 239Howard . . . . . . . . . . . . . . . . . . . . . . . . . 111 46 14 171 0 171
Charter School of Wilmington . . . . . . . . . . . . 18 157 51 226 0 226Delaware Military Academy 19 94 6 119 0 119
Total New Castle County . . . . . . 1,385 2,428 470 4,283 69 4,352KENT COUNTY
Caesar RodneyCaesar Rodney . . . . . . . . . . . . . . . . . . . 88 250 40 378 16 394John S. Charlton . . . . . . . . . . . . . . . . . . 0 0 0 0 15 15
Capital . . . . . . . . . . . . . . . . . . . . . . . . . . . . . . 128 151 31 310 6 316Lake Forest . . . . . . . . . . . . . . . . . . . . . . . . . . 25 131 2 158 7 165Milford . . . . . . . . . . . . . . . . . . . . . . . . . . . . . . 49 152 23 224 2 226Polytech . . . . . . . . . . . . . . . . . . . . . . . . . . . . . 51 199 14 264 1 265Smyrna . . . . . . . . . . . . . . . . . . . . . . . . . . . . . 51 190 7 248 6 254Campus Community Charter . . . . . . . . . . . . . 3 23 4 30 0 30Positive Outcomes Charter . . . . . . . . . . . . . . 0 11 0 11 2 13
Total Kent County . . . . . . . . . . . 395 1,107 121 1,623 55 1,678(Table continued on following page)
123
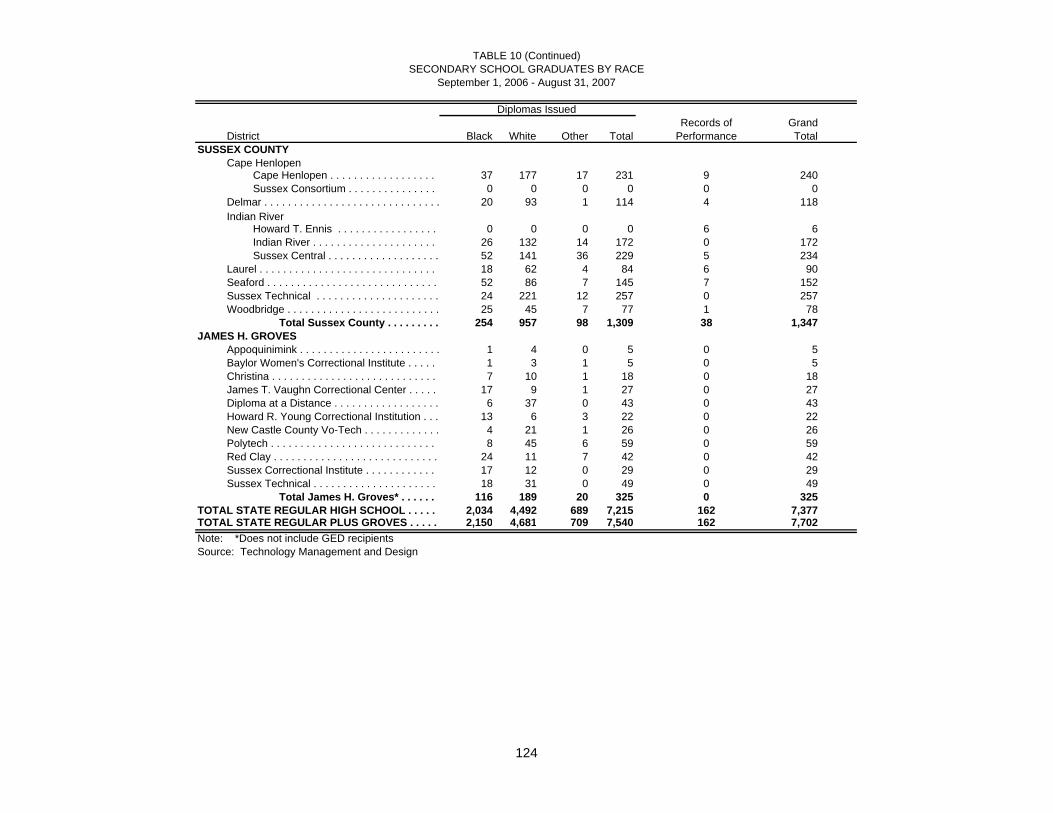
TABLE 10 (Continued)SECONDARY SCHOOL GRADUATES BY RACE
September 1, 2006 - August 31, 2007
Diplomas IssuedRecords of Grand
District Black White Other Total Performance TotalSUSSEX COUNTY
Cape HenlopenCape Henlopen . . . . . . . . . . . . . . . . . . . 37 177 17 231 9 240Sussex Consortium . . . . . . . . . . . . . . . 0 0 0 0 0 0
Delmar . . . . . . . . . . . . . . . . . . . . . . . . . . . . . . 20 93 1 114 4 118Indian River
Howard T. Ennis . . . . . . . . . . . . . . . . . 0 0 0 0 6 6Indian River . . . . . . . . . . . . . . . . . . . . . 26 132 14 172 0 172Sussex Central . . . . . . . . . . . . . . . . . . . 52 141 36 229 5 234
Laurel . . . . . . . . . . . . . . . . . . . . . . . . . . . . . . . 18 62 4 84 6 90Seaford . . . . . . . . . . . . . . . . . . . . . . . . . . . . . 52 86 7 145 7 152Sussex Technical . . . . . . . . . . . . . . . . . . . . . 24 221 12 257 0 257Woodbridge . . . . . . . . . . . . . . . . . . . . . . . . . . 25 45 7 77 1 78
Total Sussex County . . . . . . . . . 254 957 98 1,309 38 1,347JAMES H. GROVES
Appoquinimink . . . . . . . . . . . . . . . . . . . . . . . . 1 4 0 5 0 5Baylor Women's Correctional Institute . . . . . 1 3 1 5 0 5Christina . . . . . . . . . . . . . . . . . . . . . . . . . . . . 7 10 1 18 0 18James T. Vaughn Correctional Center . . . . . 17 9 1 27 0 27Diploma at a Distance . . . . . . . . . . . . . . . . . . 6 37 0 43 0 43Howard R. Young Correctional Institution . . . 13 6 3 22 0 22New Castle County Vo-Tech . . . . . . . . . . . . . 4 21 1 26 0 26Polytech . . . . . . . . . . . . . . . . . . . . . . . . . . . . . 8 45 6 59 0 59Red Clay . . . . . . . . . . . . . . . . . . . . . . . . . . . . 24 11 7 42 0 42Sussex Correctional Institute . . . . . . . . . . . . . 17 12 0 29 0 29Sussex Technical . . . . . . . . . . . . . . . . . . . . . 18 31 0 49 0 49
Total James H. Groves* . . . . . . . 116 189 20 325 0 325TOTAL STATE REGULAR HIGH SCHOOL . . . . . 2,034 4,492 689 7,215 162 7,377TOTAL STATE REGULAR PLUS GROVES . . . . . 2,150 4,681 709 7,540 162 7,702Note: *Does not include GED recipientsSource: Technology Management and Design
124

TABLE 11DROPOUT RATE, GRADES 9-12
GRADE BY RACE2006-2007
Black Hispanic White/Other* All Races
Grade
No. of Pupils
No. of Dropouts
Dropout Rate
No. of Pupils
No. of Dropouts
Dropout Rate
No. of Pupils
No. of Dropouts
Dropout Rate
No. of Pupils
No. of Dropouts
Dropout Rate
9............................... 4,143 326 7.9% 974 103 10.6% 6,663 329 4.9% 11,780 758 6.4%
10.............................. 3,233 247 7.6% 737 61 8.3% 5,800 255 4.4% 9,770 563 5.8%
11.............................. 2,328 150 6.4% 523 38 7.3% 5,370 184 3.4% 8,221 372 4.5%
12.............................. 2,056 105 5.1% 413 23 5.6% 5,013 205 4.1% 7,482 333 4.5%
TOTAL...................... 11,760 828 7.0% 2,647 225 8.5% 22,846 973 4.3% 37,253 2,026 5.4%
Note: *Includes American Indian and AsianSource: Technology Management and Design
TABLE 12 DROPOUT RATE, GRADES 9-12
SEX BY RACE2006-2007
Black Hispanic White/Other* All Races
Sex
No. of Pupils
No. of Dropouts
Dropout Rate
No. of Pupils
No. of Dropouts
Dropout Rate
No. of Pupils
No. of Dropouts
Dropout Rate
No. of Pupils
No. of Dropouts
Dropout Rate
Male........................ 5,916 501 8.5% 1,337 128 9.6% 11,807 578 4.9% 19,060 1,207 6.3%
Female.................... 5,844 327 5.6% 1,310 97 7.4% 11,039 395 3.6% 18,193 819 4.5%
TOTAL...................... 11,760 828 7.0% 2,647 225 8.5% 22,846 973 4.3% 37,253 2,026 5.4%
Note: *Includes American Indian and AsianSource: Technology Management and Design
125

FIGURE 52Countywide Dropout Rate By Race, 2006-2007
TABLE 13COUNTYWIDE DROPOUT RATE BY RACE
GRADES 9-122006-2007
Black Hispanic White/Other* All Races
CountyNo. of Pupils
No. of Dropouts
Dropout Rate
No. of Pupils
No. of Dropouts
Dropout Rate
No. of Pupils
No. of Dropouts
Dropout Rate
No. of Pupils
No. of Dropouts
Dropout Rate
New Castle................ 7,895 578 7.3% 1,821 167 9.2% 12,455 535 4.3% 22,171 1,280 5.8%Kent........................... 2,393 133 5.6% 387 28 7.2% 5,450 238 4.4% 8,230 399 4.8%Sussex....................... 1,472 117 7.9% 439 30 6.8% 4,941 200 4.0% 6,852 347 5.1%
TOTAL..................... 11,760 828 7.0% 2,647 225 8.5% 22,846 973 4.3% 37,253 2,026 5.4%
Note: *Includes American Indian and Asian
Source: Technology Management and Design
126
7.3%
5.6%
7.9%
9.2%
7.2%6.8%
4.3% 4.4% 4.0%
0.0%1.0%2.0%3.0%4.0%5.0%6.0%7.0%8.0%9.0%
10.0%
New Castle Kent Sussex
Dro
pout
Rat
eBlackHispanicWhite/Other

FIGURE 53Countywide Dropout Rate By Grade, 2006-2007
TABLE 14COUNTYWIDE DROPOUT RATE BY GRADE
GRADES 9-122006-2007
Grade 9 Grade 10 Grade 11 Grade 12 Total
CountyNo. of Pupils
No. of Dropouts
Dropout Rate
No. of Pupils
No. of Dropouts
Dropout Rate
No. of Pupils
No. of Dropouts
Dropout Rate
No. of Pupils
No. of Dropout
Dropout Rate
No. of Pupils
No. of Dropout
Dropout Rate
New Castle..... 6,939 504 7.3% 5,934 351 5.9% 4,841 217 4.5% 4,457 208 4.7% 22,171 1,280 5.8%Kent............... 2,726 149 5.5% 2,018 102 5.1% 1,806 77 4.3% 1,680 71 4.2% 8,230 399 4.8%Sussex........... 2,115 105 5.0% 1,818 110 6.1% 1,574 78 5.0% 1,345 54 4.0% 6,852 347 5.1%
TOTAL........... 11,780 758 6.4% 9,770 563 5.8% 8,221 372 4.5% 7,482 333 4.5% 37,253 2,026 5.4%
Source: Technology Management and Design
127
5.5%5.0%
5.9%
5.1%
6.1%
4.5% 4.3%5.0%
4.7%4.2% 4.0%
7.3%
0.0%
1.0%
2.0%
3.0%
4.0%
5.0%
6.0%
7.0%
8.0%
New Castle Kent Sussex
Dro
pout
Rat
e
Grade 9Grade 10Grade 11Grade 12

TABLE 15GRADES 9-12 ANNUAL DROPOUT RATES BY DISTRICT, 2004-2005 to 2006-2007
2004-2005 2005-2006 2006-2007TOTAL TOTAL DROPOUT TOTAL TOTAL DROPOUT TOTAL TOTAL DROPOUT
CODE DISTRICT ENROLLMENT DROPOUTS RATE ENROLLMENT DROPOUTS RATE ENROLLMENT DROPOUTS RATENew Castle County
29 Appoquinimink 1,805 46 2.5 2,067 27 1.3 2,107 76 3.631 Brandywine 3,358 109 3.2 3,332 131 3.9 3,361 132 3.970 Charter School of Wilmington 936 1 0.1 935 3 0.3 949 5 0.533 Christina 4,944 379 7.7 5,096 476 9.3 4,757 513 10.834 Colonial 2,437 214 8.8 2,400 174 7.3 2,403 179 7.479 Delaware Military Academy 414 10 2.4 509 7 1.4 518 12 2.375 Moyer Academy 0 0 0.0 0 0 0.0 70 6 8.638 NCC Voc Tech 3,354 74 2.2 3,375 98 2.9 3,792 112 3.083 Pencader Business 0 0 0.0 0 0 0.0 326 7 2.132 Red Clay 3,804 233 6.1 3,849 273 7.1 3,888 238 6.1
New Castle County Total 20,456 1253 6.1 21,053 1066 5.1 22,171 1,280 5.8
Kent County10 Caesar Rodney 1,873 98 5.2 1,992 82 4.1 2,011 141 7.074 Campus Community 196 15 7.7 210 17 8.1 183 13 7.113 Capital 1,523 112 7.4 1,612 119 7.4 1,597 73 4.615 Lake Forest 841 42 5.0 902 48 5.3 939 57 6.118 Milford 998 55 5.5 1,005 57 5.7 1,101 40 3.639 Polytech 1,149 4 0.3 1,150 5 0.4 1,162 4 0.371 Positive Outcomes 78 9 11.5 80 7 8.8 82 10 12.224 Smyrna 990 71 7.2 1,030 54 5.2 1,155 61 5.3
Kent County Total 7,648 406 5.3 7,981 389 4.9 8,230 399 4.8
Sussex County17 Cape Henlopen 1,206 57 4.7 1,173 82 7.0 1,172 39 3.337 Delmar 534 19 3.6 546 17 3.1 563 24 4.336 Indian River 1,953 142 7.3 2,047 122 6.0 2,136 97 4.516 Laurel 498 59 11.8 529 62 11.7 525 50 9.523 Seaford 884 72 8.1 821 66 8.0 770 76 9.940 Sussex Voc Tech 1,212 18 1.5 1,185 12 1.0 1,227 15 1.235 Woodbridge 509 44 8.6 452 56 12.4 459 46 10.0
Sussex County Total 6,796 411 6.0 6,753 417 6.2 6,852 347 5.1
STATE TOTAL 35,496 1,883 5.3 36,297 1,995 5.5 37,253 2,026 5.4
Note: Special Schools and ILC's are included in district dropout summary statistics.
Source: Technology Management and Design
128

TABLE 16GRADE 9-12 ANNUAL DROPOUT RATES BY SCHOOL, 2004-2005 to 2006-2007
2004-2005 2005-2006 2006-2007TOTAL TOTAL DROPOUT TOTAL TOTAL DROPOUT TOTAL TOTAL DROPOUT
CODE HIGH SCHOOLS ENROLLMENT DROPOUTS RATE ENROLLMENT DROPOUTS RATE ENROLLMENT DROPOUTS RATE
New Castle County292 A. I. duPont HS 1,270 62 4.9 1,286 51 4.0 1,361 26 1.924 Appoquinimink High 0 0 0.0 0 0 0.0 0 0 0.0190 Brandywine HS 1,272 26 2.0 1,191 57 4.8 1,238 52 4.2286 Calloway Arts Sch 373 2 0.5 388 1 0.3 414 1 0.2295 Charter Sch of Wilm 936 1 0.1 935 3 0.3 949 5 0.5390 Christiana HS 1,452 90 6.2 1,524 106 7.0 1,434 181 12.6194 Concord HS 1,136 45 4.0 1,158 39 3.4 1,154 44 3.8578 Delaware Mil. Acad. 414 10 2.4 509 7 1.4 518 12 2.380 Delcastle Tech HS 1,477 12 0.8 1,476 8 0.5 1,525 10 0.7
392 Glasgow HS 1,510 161 10.7 1,459 139 9.5 1,355 136 10.026 HowardTech HS 772 10 1.3 812 7 0.9 863 9 1.0
290 John Dickinson HS 1,007 80 7.9 946 88 9.3 912 88 9.7540 Margaret S. Sterck 48 1 2.1 38 5 13.2 42 3 7.118 Middletown HS 1,805 46 2.6 2,067 27 1.3 2,107 76 3.6196 Mt Pleasant HS 949 38 4.0 983 35 3.6 954 36 3.8394 Newark HS 1,815 121 6.7 1,854 147 7.9 1,663 124 7.5582 Pencader Business 0 0 0.0 0 0 0.0 326 7 2.266 Paul M. Hodgson 1,105 11 1.0 1,015 2 0.2 1,147 2 0.244 St. Georges Technical 0 0 0.0 0 0 0.0 257 1 0.4
294 Thomas McKean HS 1,053 67 6.4 1,061 115 10.8 1,044 90 8.6490 William Penn HS 2,369 201 8.5 2,331 165 7.1 2,330 169 7.3
New Castle County Total 20,763 984 4.7 21,033 1,002 4.8 21,593 1,072 5.0Kent County
626 Caesar Rodney HS 1,785 98 5.5 1,904 81 4.3 1,921 137 7.1573 Campus Community 196 15 7.7 210 17 8.1 183 13 7.1648 Dover HS 1,470 99 6.7 1,511 97 6.4 1,547 60 3.9665 Lake Forest HS 841 42 5.0 902 48 5.3 934 57 6.1678 Milford Sr HS 998 55 5.5 1,005 57 5.7 1,101 40 3.6652 POLYTECH HS 1,149 4 0.4 1,150 5 0.4 1,162 4 0.3570 Positive Outcomes 78 9 11.5 80 7 8.8 82 10 12.2688 Smyrna HS 990 71 7.2 1,030 54 5.2 1,155 61 5.3
Kent County Total 7,507 393 5.2 7,792 366 4.7 8,085 382 4.7Sussex County
726 Cape Henlopen HS 1,172 52 4.4 1,141 81 7.1 1,134 36 3.2730 Delmar Sr HS 534 19 3.6 546 17 3.1 563 24 4.3746 Indian River HS 758 62 8.2 771 40 5.2 801 27 3.4756 Laurel Sr HS 489 57 11.7 515 60 11.7 515 46 8.9766 Seaford Sr HS 884 72 8.1 821 66 8.0 770 76 9.9748 Sussex Central Sr HS 1,108 72 6.5 1,188 78 6.6 1,249 59 4.7770 Sussex Tech HS 1,212 18 1.5 1,185 12 1.0 1,227 15 1.2780 Woodbridge HS 509 44 8.6 452 56 12.4 459 46 10.0
Sussex County Total 6,666 396 5.9 6,619 410 6.2 6,718 329 4.9Note: Special Schools and ILC's are not included in this table. All schools include grades 9 thru 12.
Source: Technology Management and Design
129

TABLE 17PERCENT OF RETENTIONS BY GRADE AND BY SCHOOL DISTRICT
2006-2007
GradeDistrict Levels K 1 2 3 4 5 6 7 8 9 10 11 12 Total
NEW CASTLE COUNTY Appoquinimink . . . . . . . . . . . . . . . . . K-12 1.3 2.7 2.7 1.0 0.4 0.5 1.3 3.2 2.5 5.4 1.4 0.5 1.6 1.9 Brandywine . . . . . . . . . . . . . . . . . . . K-12 2.5 7.5 3.2 2.1 1.0 2.6 1.4 3.5 1.7 13.8 6.8 4.8 3.8 4.4 Christina . . . . . . . . . . . . . . . . . . . . . K-12 1.2 10.0 4.1 2.9 1.7 1.9 0.7 5.4 13.8 20.7 14.8 8.3 6.4 7.3 Colonial . . . . . . . . . . . . . . . . . . . . . . K-12 1.4 8.0 3.1 3.8 0.6 0.7 2.4 1.2 1.6 18.1 8.5 6.4 3.2 4.3 New Castle Vo Tech . . . . . . . . . . . . 8-12 0.0 0.0 0.0 0.0 0.0 0.0 0.0 0.0 0.0 1.4 0.7 0.8 0.8 0.9 Red Clay Consolidated . . . . . . . . . . K-12 3.1 5.7 2.4 3.6 1.0 1.9 0.2 0.5 5.6 18.1 12.7 6.6 3.6 4.9
KENT COUNTY Caesar Rodney . . . . . . . . . . . . . . . . K-12 1.6 1.5 0.6 0.4 0.6 0.0 2.8 4.2 2.3 19.3 4.2 2.3 8.0 4.0 Capital . . . . . . . . . . . . . . . . . . . . . . . K-12 5.9 6.0 2.0 1.2 0.9 0.7 1.3 8.6 17.0 20.6 10.6 7.3 3.4 6.9 Lake Forest . . . . . . . . . . . . . . . . . . . K-12 6.3 8.4 1.6 3.0 1.0 1.4 2.0 2.2 3.7 17.4 6.3 2.4 1.7 4.6 Milford . . . . . . . . . . . . . . . . . . . . . . . K-12 2.9 17.4 1.3 1.8 1.3 0.0 0.7 0.6 0.8 10.8 7.1 5.3 0.5 4.0 Polytech . . . . . . . . . . . . . . . . . . . . . . 8-12 0.0 0.0 0.0 0.0 0.0 0.0 0.0 0.0 0.0 2.5 1.9 1.4 0.7 1.7 Smyrna . . . . . . . . . . . . . . . . . . . . . . . K-12 4.0 4.0 2.1 1.4 0.0 0.3 0.6 4.5 2.6 19.7 10.2 4.4 1.6 4.3
SUSSEX COUNTY Cape Henlopen . . . . . . . . . . . . . . . . K-12 2.6 4.4 1.3 2.2 0.6 0.3 1.4 2.1 0.3 8.1 9.0 9.7 7.2 3.6 Delmar . . . . . . . . . . . . . . . . . . . . . . . K-12 0.0 0.0 0.0 0.0 0.0 0.0 2.9 3.0 3.2 6.4 2.2 2.4 0.9 3.2 Indian River . . . . . . . . . . . . . . . . . . . K-12 5.9 5.7 2.7 2.1 0.9 0.6 0.6 1.1 2.4 7.1 4.7 5.5 5.6 3.3 Laurel . . . . . . . . . . . . . . . . . . . . . . . . K-12 1.2 3.0 1.1 2.8 0.0 3.4 3.3 0.0 6.5 18.5 12.4 9.1 0.9 4.6 Seaford . . . . . . . . . . . . . . . . . . . . . . K-12 2.8 2.7 2.6 2.0 1.9 1.1 4.8 5.0 18.3 26.5 11.2 3.8 0.5 6.7 Sussex Technical . . . . . . . . . . . . . . . 8-12 0.0 0.0 0.0 0.0 0.0 0.0 0.0 0.0 0.0 7.0 2.7 0.7 1.2 3.1 Woodbridge . . . . . . . . . . . . . . . . . . . K-12 10.2 10.2 2.6 5.6 0.0 3.7 2.3 6.4 3.5 9.1 4.5 1.9 0.0 4.8
CHARTER SCHOOLS Academy of Dover . . . . . . . . . . . . . . K-6 8.3 12.1 11.0 7.3 10.5 8.6 5.9 0.0 0.0 0.0 0.0 0.0 0.0 9.4 Campus Community . . . . . . . . . . . . 1-12 0.0 2.6 0.0 7.0 2.3 0.0 3.8 2.3 17.6 21.7 9.6 5.1 0.0 8.2 Charter School of Wilmington . . . . . 9-12 0.0 0.0 0.0 0.0 0.0 0.0 0.0 0.0 0.0 0.0 0.4 0.0 0.0 0.1 Delaware Military Academy . . . . . . . 9-12 0.0 0.0 0.0 0.0 0.0 0.0 0.0 0.0 0.0 10.2 7.6 4.4 0.0 6.7 East Side . . . . . . . . . . . . . . . . . . . . . K-7 0.0 2.9 3.3 4.8 6.3 0.0 8.3 0.0 0.0 0.0 0.0 0.0 0.0 2.5 Kuumba Academy . . . . . . . . . . . . . . K-6 0.0 7.8 0.0 13.3 9.8 0.0 0.0 0.0 0.0 0.0 0.0 0.0 0.0 5.8 Marion T. Academy . . . . . . . . . . . . . K-8 5.1 5.6 3.7 7.1 10.4 3.4 5.1 2.0 5.9 0.0 0.0 0.0 0.0 5.2 Newark Charter . . . . . . . . . . . . . . . . 9-12 0.0 0.0 0.0 0.0 0.0 0.0 0.0 0.0 0.0 0.0 0.0 0.0 0.0 0.0 MOT . . . . . . . . . . . . . . . . . . . . . . . . . K-8 1.3 1.3 2.7 1.3 0.0 0.0 0.0 0.0 0.0 0.0 0.0 0.0 0.0 0.7 Positive Outcomes . . . . . . . . . . . . . . 7-12 0.0 0.0 0.0 0.0 0.0 0.0 0.0 7.7 4.8 11.1 20.8 0.0 5.6 9.7 Providence Creek . . . . . . . . . . . . . . K-8 1.4 0.0 1.4 0.0 1.4 0.0 2.9 1.3 0.0 0.0 0.0 0.0 0.0 1.0 Sussex Acad. Arts & Sciences . . . . . 6-8 0.0 0.0 0.0 0.0 0.0 0.0 2.5 2.9 1.0 0.0 0.0 0.0 0.0 2.2 Thomas Edison . . . . . . . . . . . . . . . . K-8 6.6 7.6 8.0 10.4 8.1 4.0 2.9 0.0 0.0 0.0 0.0 0.0 0.0 6.1
STATE TOTAL TOTAL 3.1 6.8 2.8 2.7 1.2 1.3 1.5 3.0 5.8 14.0 7.5 4.6 3.3 4.6
Note: Generally, special schools and learning centers are not included in district counts because most have ungraded programs. District retention policies and procedures vary greatly. These differences may be reflected in district retention rate patterns. Retention rates in this table are based on DelSIS student records.Source: Technology Management and Design
130
Grade