Embed Size (px)
DESCRIPTION
Text Categorization. Categorization. Given: A description of an instance, x X , where X is the instance language or instance space . A fixed set of categories: C= { c 1 , c 2 ,… c n } Determine: - PowerPoint PPT Presentation
Citation preview

1
Text Categorization
2
Categorization
• Given:– A description of an instance, xX, where X is
the instance language or instance space.– A fixed set of categories:
C={c1, c2,…cn}
• Determine:– The category of x: c(x)C, where c(x) is a
categorization function whose domain is X and whose range is C.
3
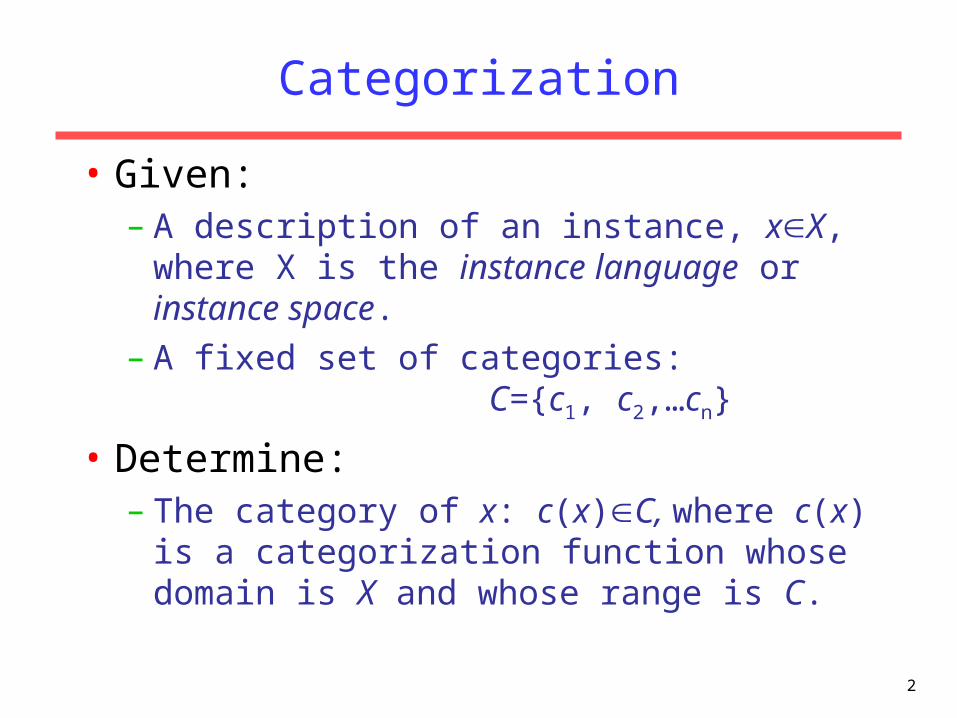
Learning for Categorization
• A training example is an instance xX, paired with its correct category c(x): <x, c(x)> for an unknown categorization function, c.
• Given a set of training examples, D.
• Find a hypothesized categorization function, h(x), such that:
)()(: )(, xcxhDxcx Consistency

4
Sample Category Learning Problem
• Instance language: <size, color, shape>– size {small, medium, large}
– color {red, blue, green}
– shape {square, circle, triangle}
• C = {positive, negative}
• D: Example Size Color Shape Category
1 small red circle positive
2 large red circle positive
3 small red triangle negative
4 large blue circle negative

5
General Learning Issues
• Many hypotheses are usually consistent with the training data.
• Bias– Any criteria other than consistency with the training
data that is used to select a hypothesis.
• Classification accuracy (% of instances classified correctly).– Measured on independent test data.
• Training time (efficiency of training algorithm).• Testing time (efficiency of subsequent
classification).
6
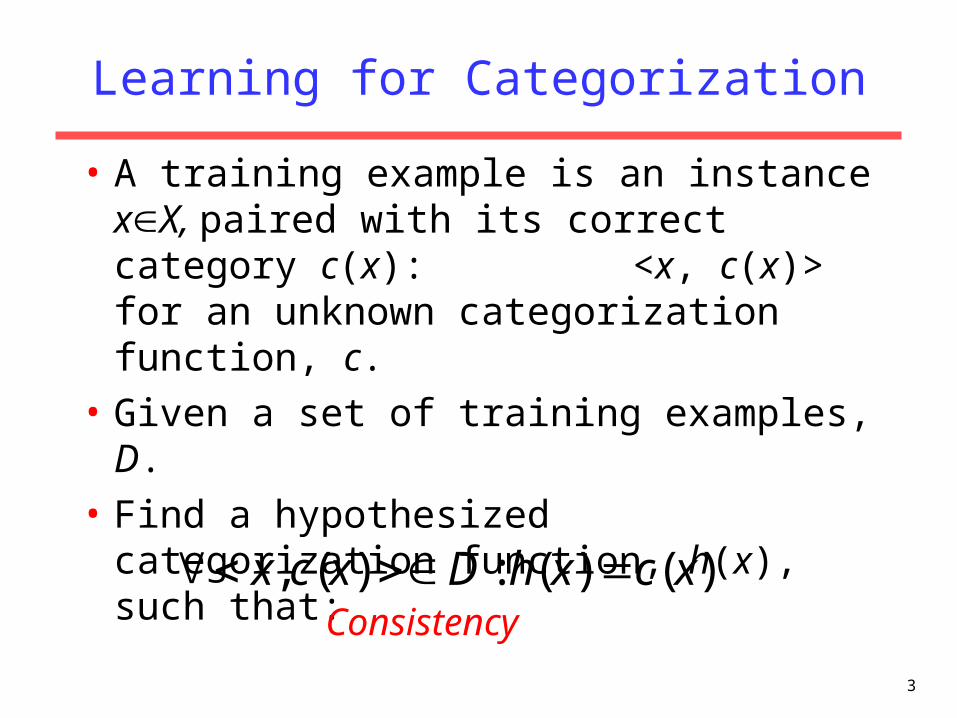
Generalization
• Hypotheses must generalize to correctly classify instances not in the training data.
• Simply memorizing training examples is a consistent hypothesis that does not generalize.
• Occam’s razor:– Finding a simple hypothesis helps ensure
generalization.

7
Text Categorization
• Assigning documents to a fixed set of categories.• Applications:
– Web pages • Recommending• Yahoo-like classification
– Newsgroup Messages • Recommending• spam filtering
– News articles • Personalized newspaper
– Email messages • Routing• Prioritizing • Folderizing• spam filtering

8
Learning for Text Categorization
• Manual development of text categorization functions is difficult.
• Learning Algorithms:– Bayesian (naïve)
– Neural network
– Relevance Feedback (Rocchio)
– Rule based (Ripper)
– Nearest Neighbor (case based)
– Support Vector Machines (SVM)

9
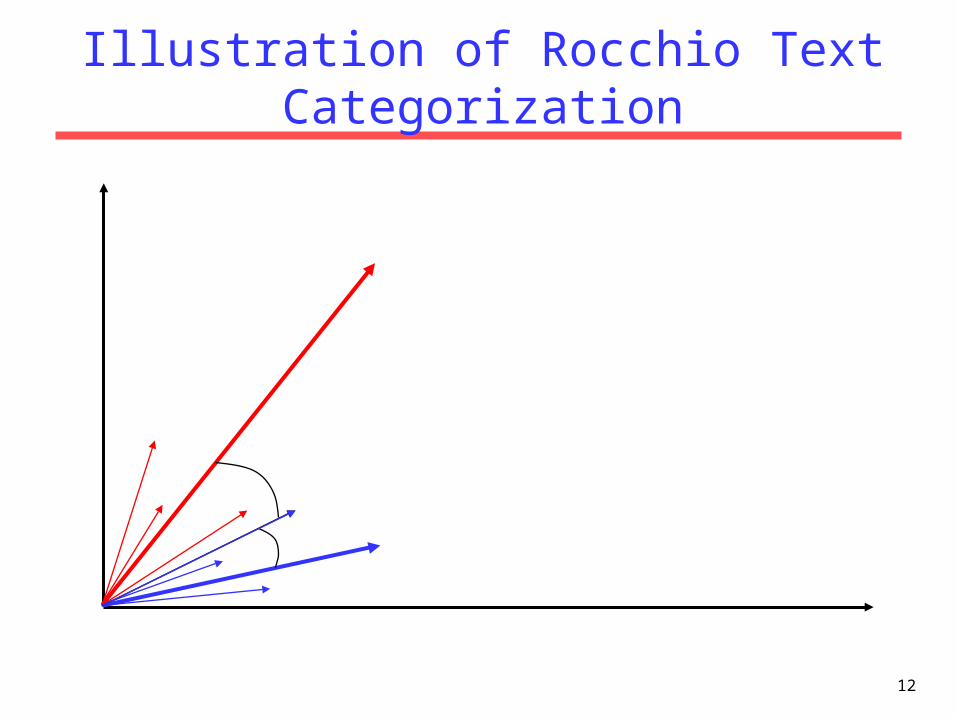
Using Relevance Feedback (Rocchio)
• Relevance feedback methods can be adapted for text categorization.
• Use standard TF/IDF weighted vectors to represent text documents (normalized by maximum term frequency).
• For each category, compute a prototype vector by summing the vectors of the training documents in the category.
• Assign test documents to the category with the closest prototype vector based on cosine similarity.

10
Rocchio Text Categorization Algorithm(Training)
Assume the set of categories is {c1, c2,…cn}For i from 1 to n let pi = <0, 0,…,0> (init. prototype vectors)
For each training example <x, c(x)> D Let d be the frequency normalized TF/IDF term vector for doc x Let i = j: (cj = c(x))
(sum all the document vectors in ci to get pi)
Let pi = pi + d

11
Rocchio Text Categorization Algorithm(Test)
Given test document xLet d be the TF/IDF weighted term vector for xLet m = –2 (init. maximum cosSim)For i from 1 to n: (compute similarity to prototype vector) Let s = cosSim(d, pi) if s > m let m = s let r = ci (update most similar class prototype)Return class r
12
Illustration of Rocchio Text Categorization
13
Rocchio Properties
• Does not guarantee a consistent hypothesis.• Forms a simple generalization of the
examples in each class (a prototype).• Prototype vector does not need to be
averaged or otherwise normalized for length since cosine similarity is insensitive to vector length.
• Classification is based on similarity to class prototypes.

14
Rocchio Time Complexity
• Note: The time to add two sparse vectors is proportional to minimum number of non-zero entries in the two vectors.
• Training Time: O(|D|(Ld + |Vd|)) = O(|D| Ld) where Ld is the average length of a document in D and Vd is the average vocabulary size for a document in D.
• Test Time: O(Lt + |C||Vt|) where Lt is the average length of a test document and |Vt | is the average vocabulary size for a test document.– Assumes lengths of pi vectors are computed and stored during
training, allowing cosSim(d, pi) to be computed in time proportional to the number of non-zero entries in d (i.e. |Vt|)

15
Nearest-Neighbor Learning Algorithm
• Learning is just storing the representations of the training examples in D.
• Testing instance x:– Compute similarity between x and all examples in D.– Assign x the category of the most similar example in D.
• Does not explicitly compute a generalization or category prototypes.
• Also called:– Case-based– Memory-based– Lazy learning
16
K Nearest-Neighbor
• Using only the closest example to determine categorization is subject to errors due to:– A single atypical example. – Noise (i.e. error) in the category label of a
single training example.
• More robust alternative is to find the k most-similar examples and return the majority category of these k examples.
• Value of k is typically odd to avoid ties, 3 and 5 are most common.

17
Similarity Metrics
• Nearest neighbor method depends on a similarity (or distance) metric.
• Simplest for continuous m-dimensional instance space is Euclidian distance.
• Simplest for m-dimensional binary instance space is Hamming distance (number of feature values that differ).
• For text, cosine similarity of TF-IDF weighted vectors is typically most effective.

18
3 Nearest Neighbor Illustration(Euclidian Distance)
.
..
.
. .. ....
19
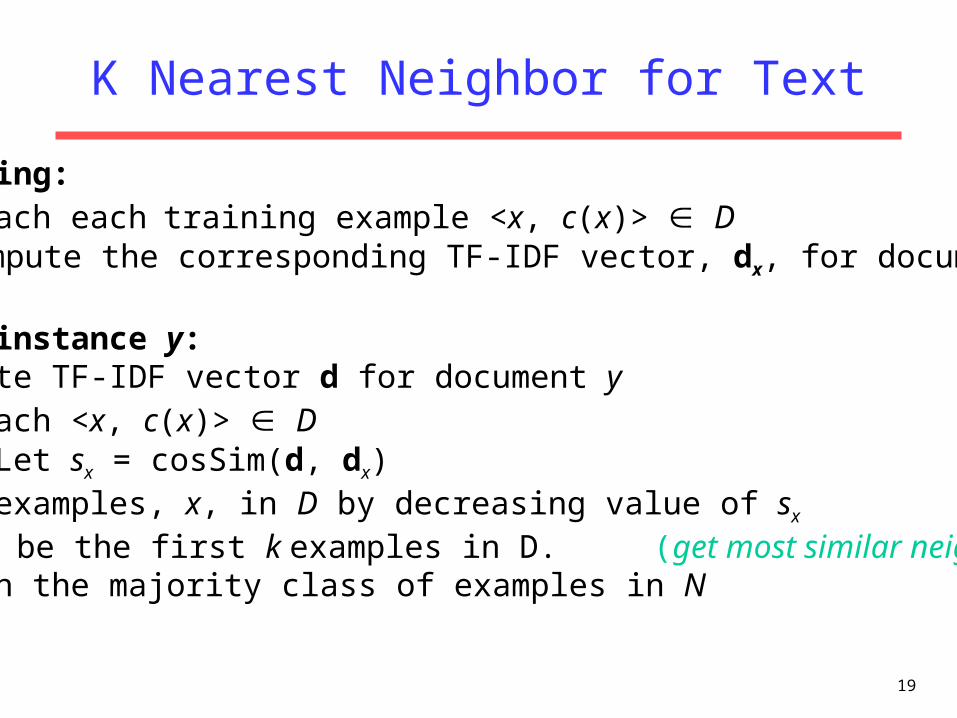
K Nearest Neighbor for Text
Training:For each each training example <x, c(x)> D Compute the corresponding TF-IDF vector, dx, for document x
Test instance y:Compute TF-IDF vector d for document yFor each <x, c(x)> D Let sx = cosSim(d, dx)Sort examples, x, in D by decreasing value of sx
Let N be the first k examples in D. (get most similar neighbors)Return the majority class of examples in N

20
Illustration of 3 Nearest Neighbor for Text

21
Rocchio Anomoly
• Prototype models have problems with polymorphic (disjunctive) categories.

22
3 Nearest Neighbor Comparison
• Nearest Neighbor tends to handle polymorphic categories better.
23
Nearest Neighbor Time Complexity
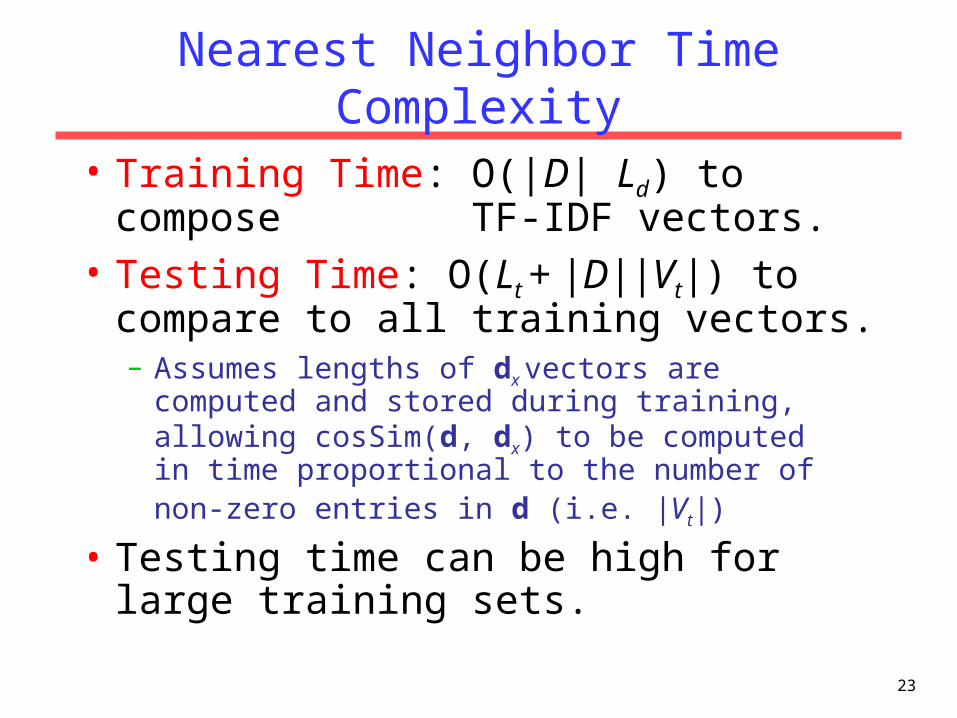
• Training Time: O(|D| Ld) to compose TF-IDF vectors.
• Testing Time: O(Lt + |D||Vt|) to compare to all training vectors.– Assumes lengths of dx vectors are computed and stored
during training, allowing cosSim(d, dx) to be computed in time proportional to the number of non-zero entries in d (i.e. |Vt|)
• Testing time can be high for large training sets.
24
Nearest Neighbor with Inverted Index
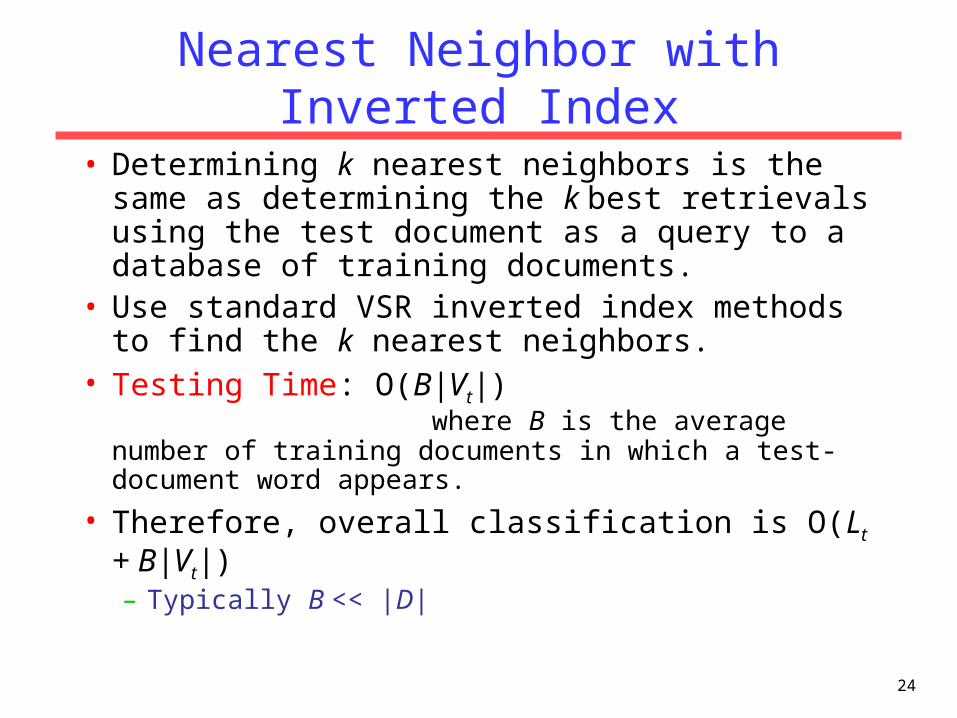
• Determining k nearest neighbors is the same as determining the k best retrievals using the test document as a query to a database of training documents.
• Use standard VSR inverted index methods to find the k nearest neighbors.
• Testing Time: O(B|Vt|) where B is the average number of training documents in which a test-document word appears.
• Therefore, overall classification is O(Lt + B|Vt|) – Typically B << |D|
25
Bayesian Methods
• Learning and classification methods based on probability theory.
• Bayes theorem plays a critical role in probabilistic learning and classification.
• Uses prior probability of each category given no information about an item.
• Categorization produces a posterior probability distribution over the possible categories given a description of an item.

26
Axioms of Probability Theory
• All probabilities between 0 and 1
• True proposition has probability 1, false has probability 0.
P(true) = 1 P(false) = 0.
• The probability of disjunction is:
1)(0 AP
)()()()( BAPBPAPBAP
A BBA

27
Conditional Probability
• P(A | B) is the probability of A given B
• Assumes that B is all and only information known.
• Defined by:
)(
)()|(
BP
BAPBAP
A BBA

28
Independence
• A and B are independent iff:
• Therefore, if A and B are independent:
)()|( APBAP
)()|( BPABP
)()(
)()|( AP
BP
BAPBAP
)()()( BPAPBAP
These two constraints are logically equivalent
29
Joint Distribution
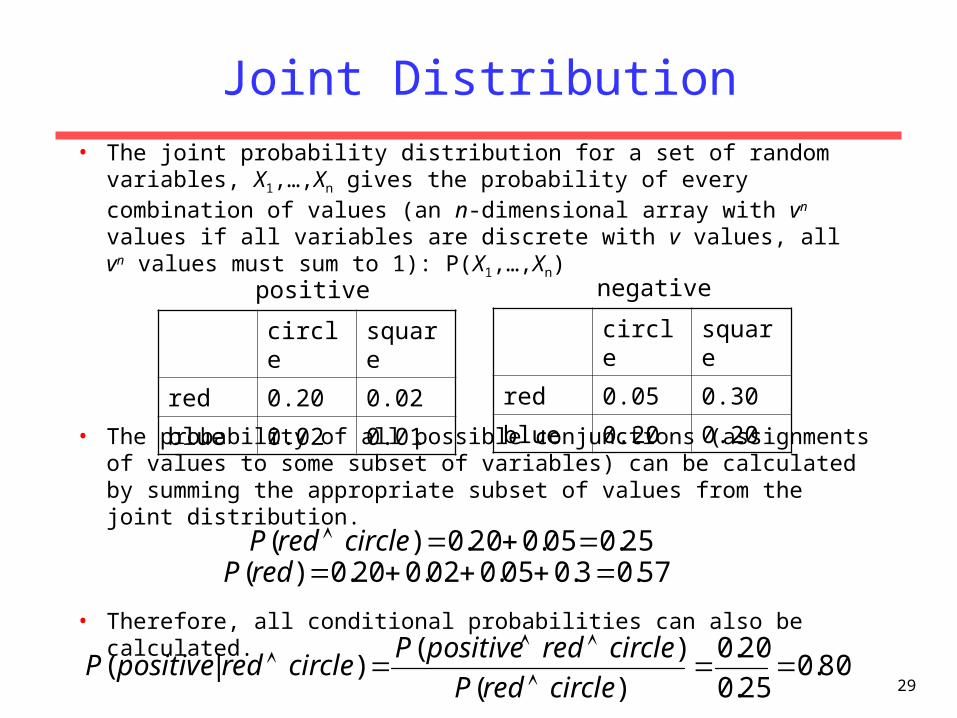
• The joint probability distribution for a set of random variables, X1,…,Xn gives the probability of every combination of values (an n-dimensional array with vn values if all variables are discrete with v values, all vn values must sum to 1): P(X1,…,Xn)
• The probability of all possible conjunctions (assignments of values to some subset of variables) can be calculated by summing the appropriate subset of values from the joint distribution.
• Therefore, all conditional probabilities can also be calculated.
circle square
red 0.20 0.02
blue 0.02 0.01
circle square
red 0.05 0.30
blue 0.20 0.20
positive negative
25.005.020.0)( circleredP
80.025.0
20.0
)(
)()|(
circleredP
circleredpositivePcircleredpositiveP
57.03.005.002.020.0)( redP

30
Probabilistic Classification
• Let Y be the random variable for the class which takes values {y1,y2,…ym}.
• Let X be the random variable describing an instance consisting of a vector of values for n features <X1,X2…Xn>, let xk be a possible value for X and xij a possible value for Xi.
• For classification, we need to compute P(Y=yi | X=xk) for i=1…m• However, given no other assumptions, this requires a table giving
the probability of each category for each possible instance in the instance space, which is impossible to accurately estimate from a reasonably-sized training set.– Assuming Y and all Xi are binary, we need 2n entries to specify P(Y=pos |
X=xk) for each of the 2n possible xk’s since P(Y=neg | X=xk) = 1 – P(Y=pos | X=xk)
– Compared to 2n+1 – 1 entries for the joint distribution P(Y,X1,X2…Xn)
31
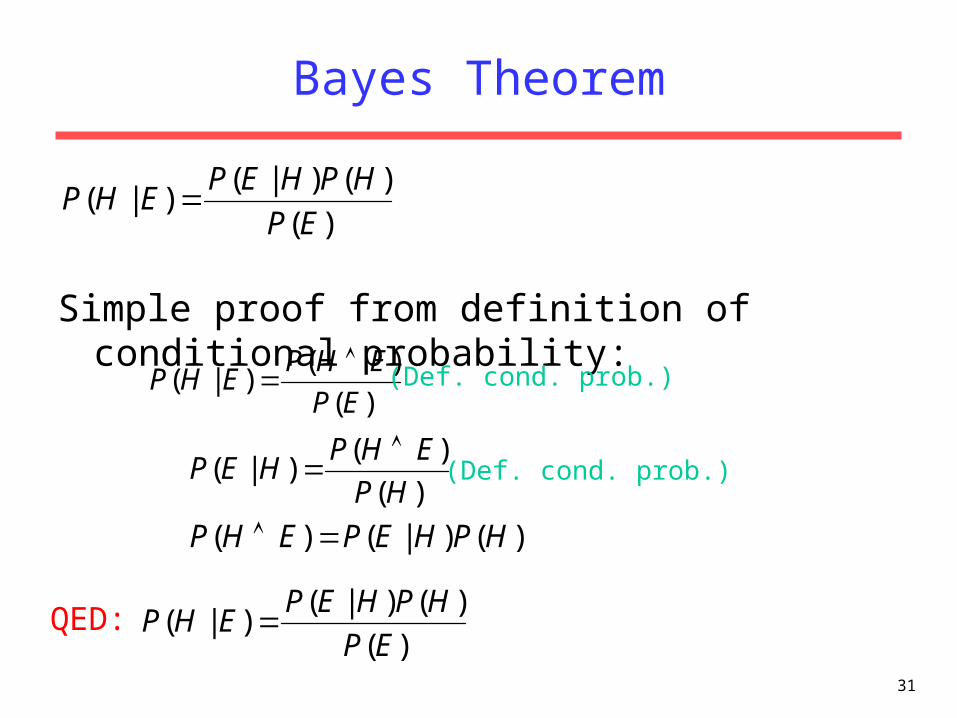
Bayes Theorem
Simple proof from definition of conditional probability:
)(
)()|()|(
EP
HPHEPEHP
)(
)()|(
EP
EHPEHP
)(
)()|(
HP
EHPHEP
)()|()( HPHEPEHP
QED:
(Def. cond. prob.)
(Def. cond. prob.)
)(
)()|()|(
EP
HPHEPEHP

32
Bayesian Categorization
• Determine category of xk by determining for each yi
• P(X=xk) can be determined since categories are complete and disjoint.
)(
)|()()|(
k
ikiki xXP
yYxXPyYPxXyYP
m
i k
ikim
iki xXP
yYxXPyYPxXyYP
11
1)(
)|()()|(
m
iikik yYxXPyYPxXP
1
)|()()(

33
Bayesian Categorization (cont.)
• Need to know:– Priors: P(Y=yi)
– Conditionals: P(X=xk | Y=yi)
• P(Y=yi) are easily estimated from data.
– If ni of the examples in D are in yi then P(Y=yi) = ni / |D|
• Too many possible instances (e.g. 2n for binary features) to estimate all P(X=xk | Y=yi).
• Still need to make some sort of independence assumptions about the features to make learning tractable.

34
Generative Probabilistic Models
• Assume a simple (usually unrealistic) probabilistic method by which the data was generated.
• For categorization, each category has a different parameterized generative model that characterizes that category.
• Training: Use the data for each category to estimate the parameters of the generative model for that category. – Maximum Likelihood Estimation (MLE): Set parameters to
maximize the probability that the model produced the given training data.
– If Mλ denotes a model with parameter values λ and Dk is the training data for the kth class, find model parameters for class k (λk) that maximize the likelihood of Dk:
• Testing: Use Bayesian analysis to determine the category model that most likely generated a specific test instance.
)|(argmax
MDP kk

35
Naïve Bayes Generative Model
Size Color Shape Size Color Shape
Positive Negative
posnegpos
pospos neg
neg
sm
medlg
lg
medsm
smmed
lg
red
redredred red
blue
bluegrn
circcirc
circ
circ
sqr
tri tri
circ sqrtri
sm
lg
medsm
lgmed
lgsmblue
red
grnblue
grnred
grnblue
circ
sqr tricirc
sqrcirc
tri
Category
36
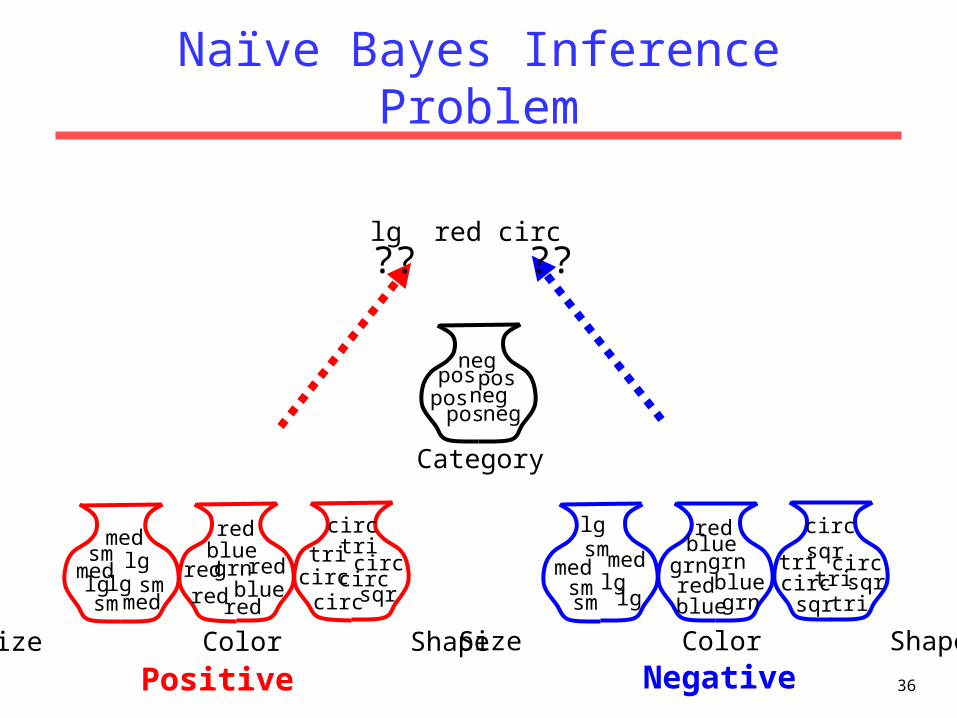
Naïve Bayes Inference Problem
Size Color Shape Size Color Shape
Positive Negative
posnegpos
pospos neg
neg
sm
medlg
lg
medsm
smmed
lg
red
redredred red
blue
bluegrn
circcirc
circ
circ
sqr
tri tri
circ sqrtri
sm
lg
medsm
lgmed
lgsmblue
red
grnblue
grnred
grnblue
circ
sqr tricirc
sqrcirc
tri
Category
lg red circ ?? ??
37
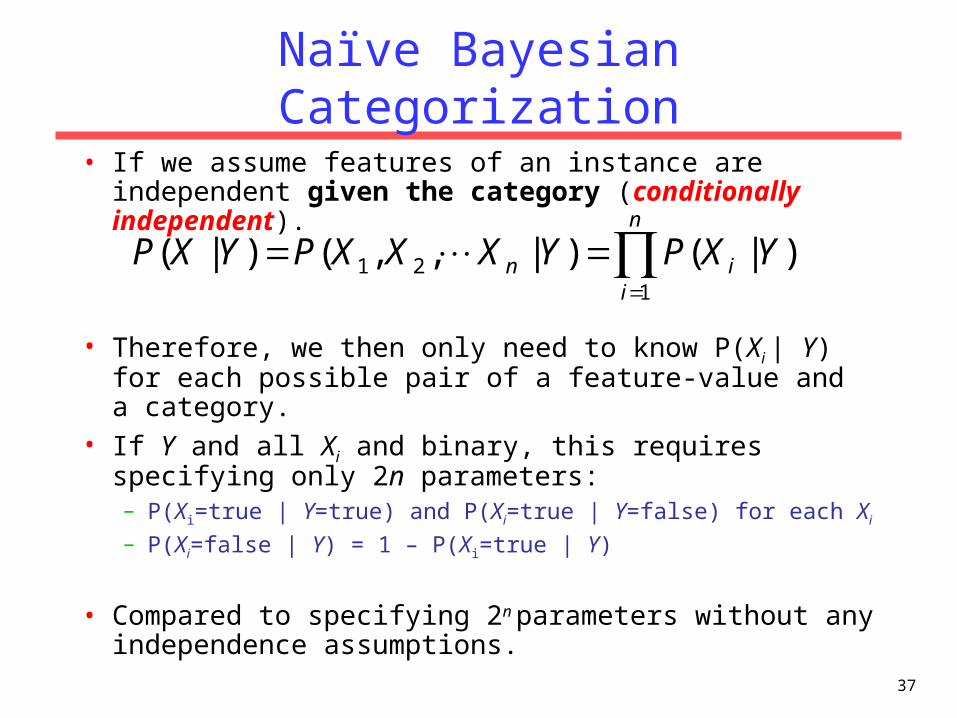
Naïve Bayesian Categorization
• If we assume features of an instance are independent given the category (conditionally independent).
• Therefore, we then only need to know P(Xi | Y) for each possible pair of a feature-value and a category.
• If Y and all Xi and binary, this requires specifying only 2n parameters:– P(Xi=true | Y=true) and P(Xi=true | Y=false) for each Xi
– P(Xi=false | Y) = 1 – P(Xi=true | Y)
• Compared to specifying 2n parameters without any independence assumptions.
)|()|,,()|(1
21
n
iin YXPYXXXPYXP

38
Naïve Bayes Example
Probability positive negative
P(Y) 0.5 0.5
P(small | Y) 0.4 0.4
P(medium | Y) 0.1 0.2
P(large | Y) 0.5 0.4
P(red | Y) 0.9 0.3
P(blue | Y) 0.05 0.3
P(green | Y) 0.05 0.4
P(square | Y) 0.05 0.4
P(triangle | Y) 0.05 0.3
P(circle | Y) 0.9 0.3
Test Instance:<medium ,red, circle>

39
Naïve Bayes Example
Probability positive negative
P(Y) 0.5 0.5
P(medium | Y) 0.1 0.2
P(red | Y) 0.9 0.3
P(circle | Y) 0.9 0.3
P(positive | X) = P(positive)*P(medium | positive)*P(red | positive)*P(circle | positive) / P(X) 0.5 * 0.1 * 0.9 * 0.9 = 0.0405 / P(X)
P(negative | X) = P(negative)*P(medium | negative)*P(red | negative)*P(circle | negative) / P(X) 0.5 * 0.2 * 0.3 * 0.3 = 0.009 / P(X)
P(positive | X) + P(negative | X) = 0.0405 / P(X) + 0.009 / P(X) = 1
P(X) = (0.0405 + 0.009) = 0.0495
= 0.0405 / 0.0495 = 0.8181
= 0.009 / 0.0495 = 0.1818
Test Instance:<medium, red, circle>
40
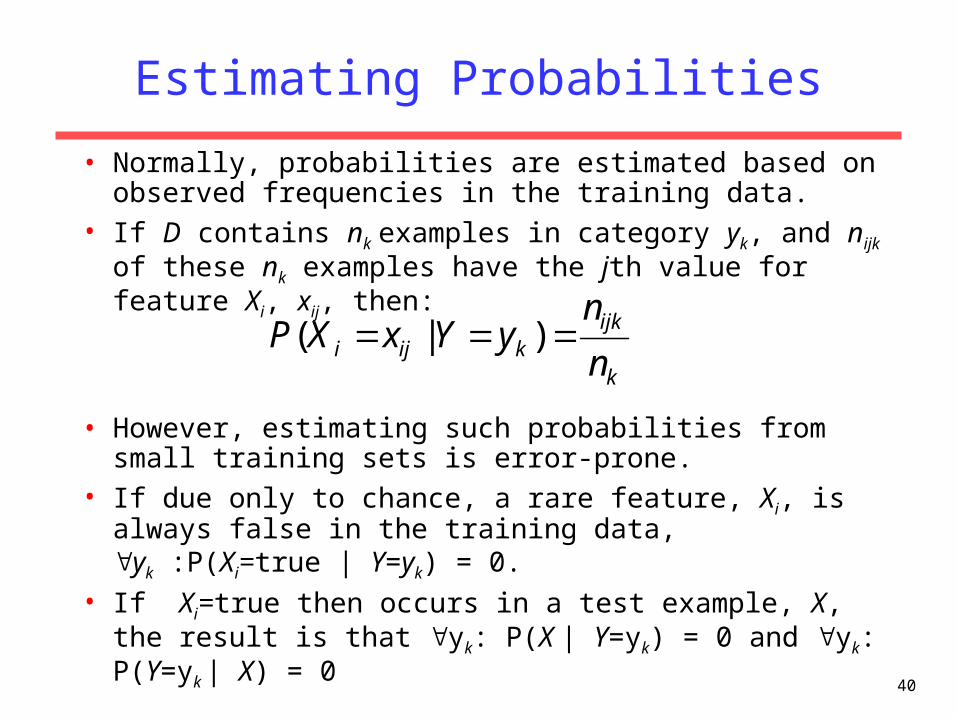
Estimating Probabilities
• Normally, probabilities are estimated based on observed frequencies in the training data.
• If D contains nk examples in category yk, and nijk of these nk examples have the jth value for feature Xi, xij, then:
• However, estimating such probabilities from small training sets is error-prone.
• If due only to chance, a rare feature, Xi, is always false in the training data, yk :P(Xi=true | Y=yk) = 0.
• If Xi=true then occurs in a test example, X, the result is that yk: P(X | Y=yk) = 0 and yk: P(Y=yk | X) = 0
k
ijkkiji n
nyYxXP )|(
41
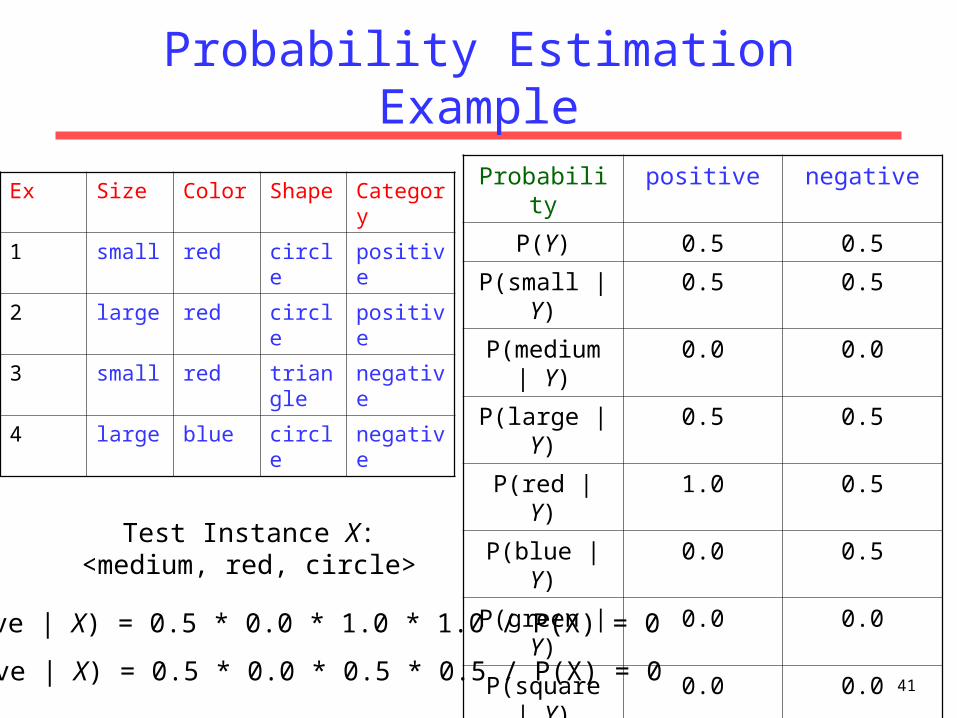
Probability Estimation Example
Probability positive negative
P(Y) 0.5 0.5
P(small | Y) 0.5 0.5
P(medium | Y) 0.0 0.0
P(large | Y) 0.5 0.5
P(red | Y) 1.0 0.5
P(blue | Y) 0.0 0.5
P(green | Y) 0.0 0.0
P(square | Y) 0.0 0.0
P(triangle | Y) 0.0 0.5
P(circle | Y) 1.0 0.5
Ex Size Color Shape Category
1 small red circle positive
2 large red circle positive
3 small red triangle negative
4 large blue circle negative
Test Instance X:<medium, red, circle>
P(positive | X) = 0.5 * 0.0 * 1.0 * 1.0 / P(X) = 0
P(negative | X) = 0.5 * 0.0 * 0.5 * 0.5 / P(X) = 0

42
Smoothing
• To account for estimation from small samples, probability estimates are adjusted or smoothed.
• Laplace smoothing using an m-estimate assumes that each feature is given a prior probability, p, that is assumed to have been previously observed in a “virtual” sample of size m.
• For binary features, p is simply assumed to be 0.5.
mn
mpnyYxXP
k
ijkkiji
)|(
43
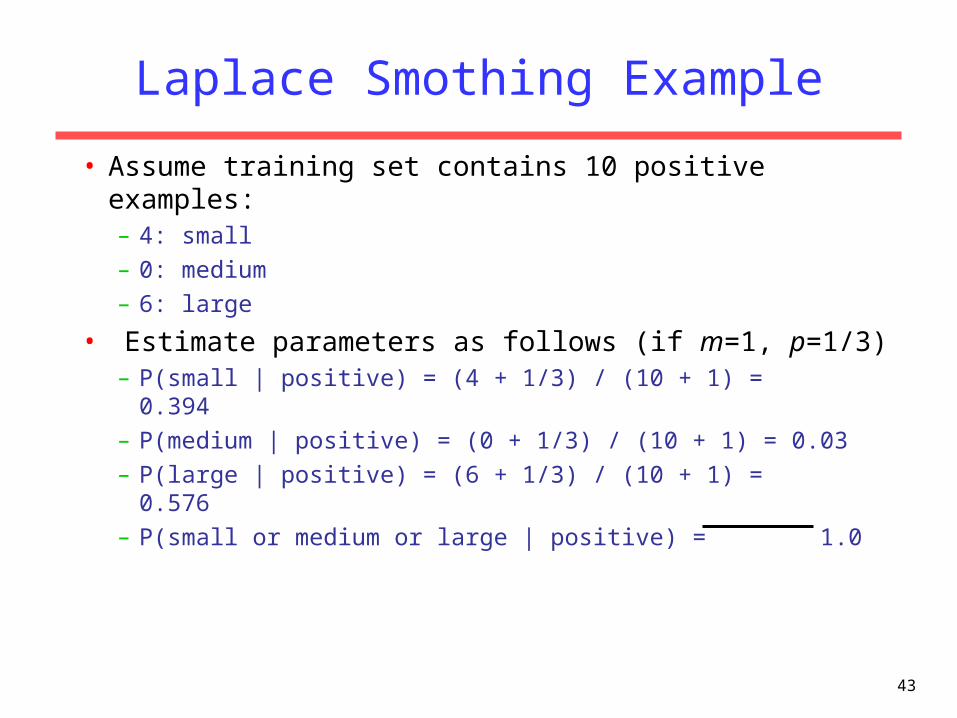
Laplace Smothing Example
• Assume training set contains 10 positive examples:– 4: small
– 0: medium
– 6: large
• Estimate parameters as follows (if m=1, p=1/3)– P(small | positive) = (4 + 1/3) / (10 + 1) = 0.394
– P(medium | positive) = (0 + 1/3) / (10 + 1) = 0.03
– P(large | positive) = (6 + 1/3) / (10 + 1) = 0.576
– P(small or medium or large | positive) = 1.0

44
Naïve Bayes for Text
• Modeled as generating a bag of words for a document in a given category by repeatedly sampling with replacement from a vocabulary V = {w1, w2,…wm} based on the probabilities P(wj | ci).
• Smooth probability estimates with Laplace m-estimates assuming a uniform distribution over all words (p = 1/|V|) and m = |V|– Equivalent to a virtual sample of seeing each word in each
category exactly once.

45
nudedealNigeria
Naïve Bayes Generative Model for Text
spam legit
hot
$Viagra
lottery
!!!
winFriday
exam
computer
May
PM
testMarch
scienceViagra
homeworkscore
!
spamlegitspam
spamlegit
spam
legit
legitspam
Category
Viagra
dealhot !!

46
Naïve Bayes Classification
nudedealNigeria
spam legit
hot
$Viagra
lottery
!!!
winFriday
exam
computer
May
PM
testMarch
scienceViagra
homeworkscore
!
spamlegitspam
spamlegit
spam
legit
legitspam
Category
Win lotttery $ !
?? ??

47
Text Naïve Bayes Algorithm(Train)
Let V be the vocabulary of all words in the documents in DFor each category ci C
Let Di be the subset of documents in D in category ci
P(ci) = |Di| / |D|
Let Ti be the concatenation of all the documents in Di
Let ni be the total number of word occurrences in Ti
For each word wj V Let nij be the number of occurrences of wj in Ti
Let P(wj | ci) = (nij + 1) / (ni + |V|)
48
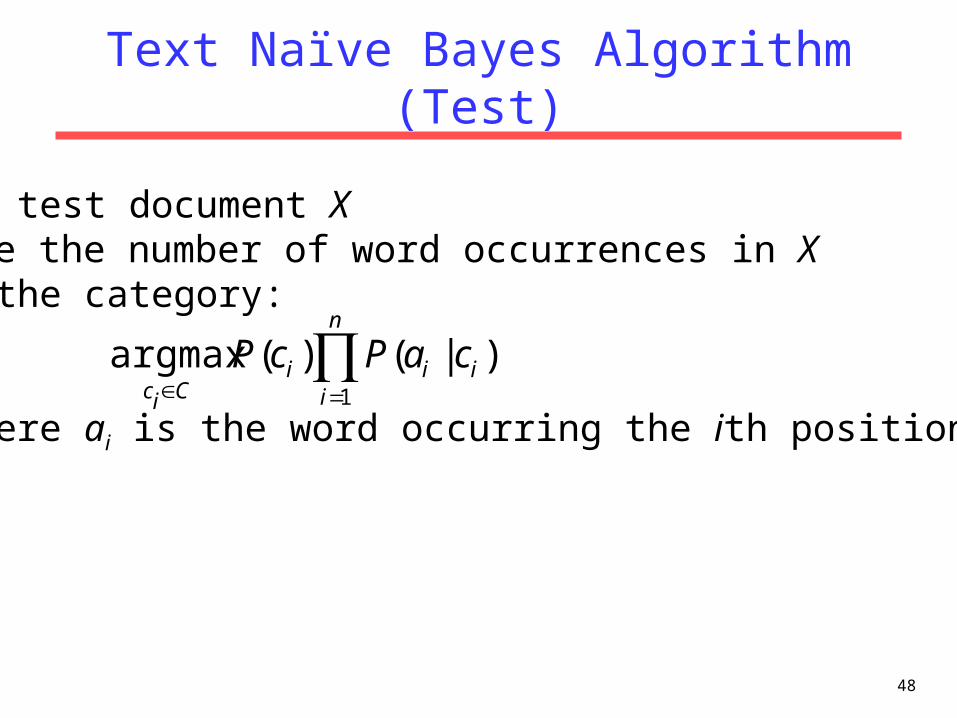
Text Naïve Bayes Algorithm(Test)
Given a test document XLet n be the number of word occurrences in XReturn the category:
where ai is the word occurring the ith position in X
)|()(argmax1
n
iiii
CiccaPcP

49
Underflow Prevention
• Multiplying lots of probabilities, which are between 0 and 1 by definition, can result in floating-point underflow.
• Since log(xy) = log(x) + log(y), it is better to perform all computations by summing logs of probabilities rather than multiplying probabilities.
• Class with highest final un-normalized log probability score is still the most probable.

50
Naïve Bayes Posterior Probabilities
• Classification results of naïve Bayes (the class with maximum posterior probability) are usually fairly accurate.
• However, due to the inadequacy of the conditional independence assumption, the actual posterior-probability numerical estimates are not.– Output probabilities are generally very close to
0 or 1.
51
Evaluating Categorization
• Evaluation must be done on test data that are independent of the training data (usually a disjoint set of instances).
• Classification accuracy: c/n where n is the total number of test instances and c is the number of test instances correctly classified by the system.
• Results can vary based on sampling error due to different training and test sets.
• Average results over multiple training and test sets (splits of the overall data) for the best results.

52
N-Fold Cross-Validation
• Ideally, test and training sets are independent on each trial.– But this would require too much labeled data.
• Partition data into N equal-sized disjoint segments.• Run N trials, each time using a different segment of
the data for testing, and training on the remaining N1 segments.
• This way, at least test-sets are independent.• Report average classification accuracy over the N
trials.• Typically, N = 10.

53
Learning Curves
• In practice, labeled data is usually rare and expensive.
• Would like to know how performance varies with the number of training instances.
• Learning curves plot classification accuracy on independent test data (Y axis) versus number of training examples (X axis).
54
N-Fold Learning Curves
• Want learning curves averaged over multiple trials.
• Use N-fold cross validation to generate N full training and test sets.
• For each trial, train on increasing fractions of the training set, measuring accuracy on the test data for each point on the desired learning curve.

55
Sample Learning Curve(Yahoo Science Data)