Embed Size (px)
Citation preview
@TexasDemography
Texas and MetroplexDemographics
Population Growth Forum
Region 10 Service Center
Dallas, Texas
July 14, 2016

Overview
• Texas demographics • Population growth• Race and ethnic trends• Migration• Geographic representation of characteristics
• Population projections• Demographics of education
2
0.00
5.00
10.00
15.00
20.00
25.00
30.00
1950 1960 1970 1980 1990 2000 2010 2011 2012 2013 2014 2015
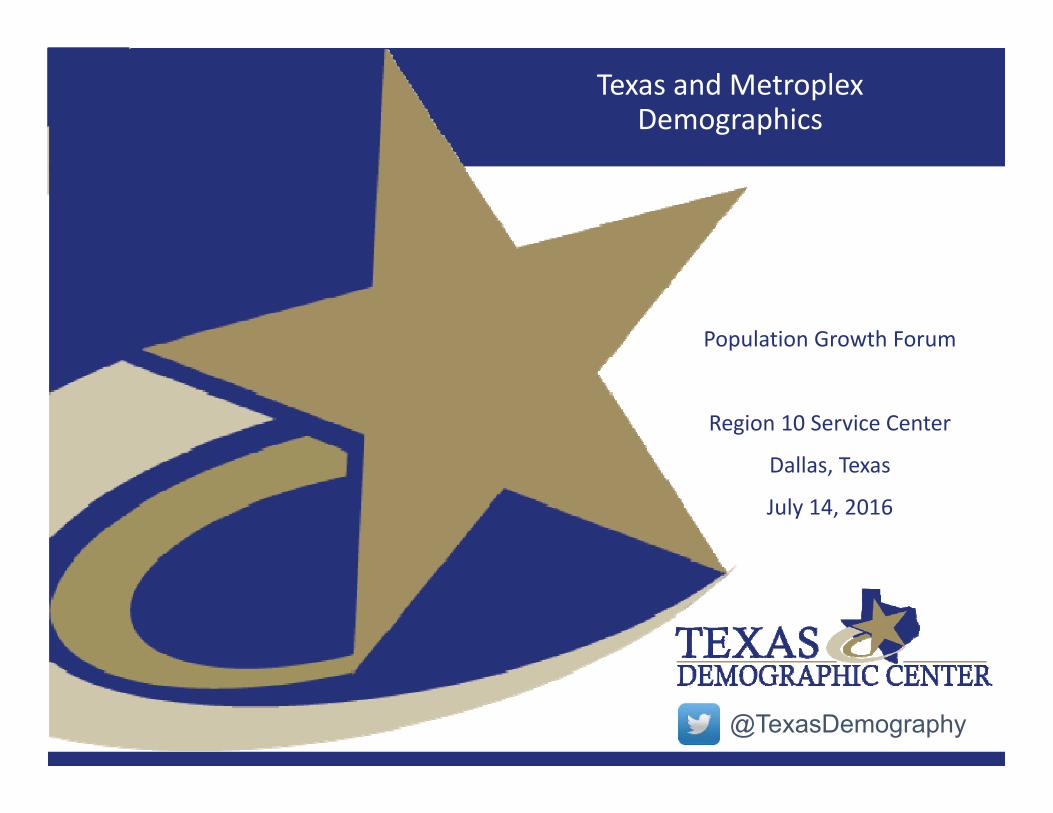
Numeric Change (Millions) Population (Millions)
3All values for the decennial dates are for April 1st of the indicated census year. Values for 2012-2014 are for July 1 as estimated by the U.S. Census Bureau.
Total Population and Components of Population Change in Texas, 1950‐2014
Source: U.S. Census Bureau, Census Counts and Population Estimates
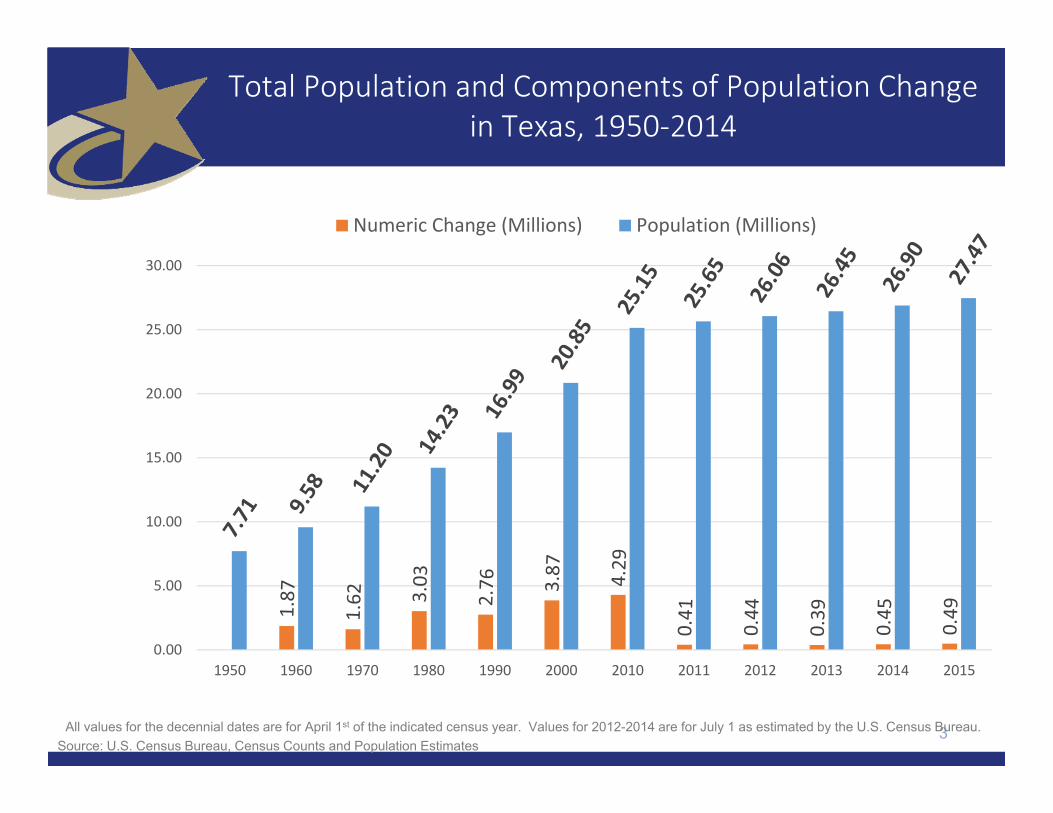
Population Growth, Texas, 1950‐2010
0
5,000,000
10,000,000
15,000,000
20,000,000
25,000,000
30,000,000
1950 1960 1970 1980 1990 2000 2010
Source: U.S. Census Bureau, Decennial Censuses4

Dallas
Howard
FoardFloyd
Brewster
FranklinHunt
Newton
Starr
Kinney
Collingsworth
TomGreen
Coleman
Brazoria
Leon
Duval
Lamb
Morris
Smith
Jackson
Medina
Wheeler
Dallam
Callahan
Lamar
Coryell
Gaines
Kendall
Nacogdoches
Milam
Hays
Willacy
Johnson
Reagan
Webb
Shackelford
Bowie
Scurry
Kenedy
Somervell
Oldham
Taylor
King
Borden
Walker
Stephens
DeafSmith
Roberts
Tyler
ValVerde
Brown
Parker
Harris
Zapata
RedRiver
Karnes
PaloPinto
Glasscock
Shelby
Wood
Crosby
Refugio
Burnet
Sterling
Montgomery
SanAugustine
Rains
Nueces
Jack
Swisher
Camp
Brazos
Orange
Colorado
Pecos
Cochran
Parmer
FreestoneWinkler
Wichita
Gray
Schleicher
Hardeman
TravisGillespie
Yoakum
Fayette
Uvalde
Grimes
VanZandt
Throckmorton
Falls
Grayson
Ellis
Hall
Dickens
TrinityReeves
Marion
Terrell
Lynn
La Salle
Jasper
Jones
Castro
Victoria
Kleberg
Briscoe
Clay
Matagorda
Brooks
Runnels
Carson
LibertyLee
Hale
Bexar
Garza
Montague
Upton
Hamilton
FisherDawson
Dimmit
Hutchinson
Llano
Presidio
Eastland
Wharton
Rusk
Tarrant
Lavaca
Childress
Hidalgo
Kaufman
Moore
Menard
Edwards
SanPatricio
Terry
Crockett
Houston
Waller
Coke
Ward
Titus
Lampasas
Haskell
Martin
Atascosa
HemphillHartley
Young
BurlesonHardin
Gonzales
McMullen
Erath
Galveston
Hopkins
McLennan
MadisonMcCulloch
Donley
Kent
Real
Sutton
Midland
Hudspeth
Zavala
Harrison
ComancheMitchell
Navarro
Crane
Lubbock
Wise
Washington
JeffDavis
El Paso
Gregg
Williamson
Lipscomb
Mason
Henderson
Hansford
Chambers
Hill
Potter
JimWells
DeltaStonewall
Ector
Cameron
Maverick
Collin
Baylor
Panola
Guadalupe
BastropAustin
Andrews
Anderson
Blanco
DeWitt
Bandera
Bell
Aransas
Archer
Armstrong
Bee
Angelina
Bailey
Jefferson
Frio
Fannin
Goliad
Loving
Cass
FortBend
Bosque
Hockley
SanSaba
Kerr
Mills
Cooke
Wilbarger
Irion
Caldwell
JimHogg
Culberson
Upshur
Cherokee
Denton
Concho
Randall
Kimble
Knox
Polk
Hood
SanJacinto
Robertson
Wilson
Nolan
Cottle
Calhoun
Rockwall
LiveOak
Motley
Sherman
Ochiltree
Comal
Total Estimated Population by County, Texas, 2015
Source: U.S. Census Bureau, 2015 Vintage Population Estimates
112 - 10,000
10,001 - 50,000
50,001 - 100,000
100,001 - 500,000
500,001 - 4,538,028
5

Estimated Population Change, Texas Counties, 2010 to 2015
6Source: U.S. Census Bureau Population Estimates, 2015 Vintage.
99 counties lost population over the five year period.
Dallas
Howard
FoardFloyd
Brewster
FranklinHunt
Newton
Starr
Kinney
Collingsworth
TomGreen
Coleman
Brazoria
Leon
Duval
Lamb
Morris
Smith
Jackson
Medina
Wheeler
Dallam
Callahan
Lamar
Coryell
Gaines
Kendall
Nacogdoches
Milam
Hays
Willacy
Johnson
Reagan
Webb
Shackelford
Bowie
Scurry
Kenedy
Somervell
Oldham
Taylor
King
Borden
Walker
Stephens
DeafSmith
Roberts
Tyler
ValVerde
Brown
Parker
Harris
Zapata
RedRiver
Karnes
PaloPinto
Glasscock
Shelby
Wood
Crosby
Refugio
Burnet
Sterling
Montgomery
SanAugustine
Rains
Nueces
Jack
Swisher
Camp
Brazos
Orange
Colorado
Pecos
Cochran
Parmer
FreestoneWinkler
Wichita
Gray
Schleicher
Hardeman
TravisGillespie
Yoakum
Fayette
Uvalde
Grimes
VanZandt
Throckmorton
Falls
Grayson
Ellis
Hall
Dickens
TrinityReeves
Marion
Terrell
Lynn
La Salle
Jasper
Jones
Castro
Victoria
Kleberg
Briscoe
Clay
Matagorda
Brooks
Runnels
Carson
LibertyLee
Hale
Bexar
Garza
Montague
Upton
Hamilton
FisherDawson
Dimmit
Hutchinson
Llano
Presidio
Eastland
Wharton
Rusk
Tarrant
Lavaca
Childress
Hidalgo
Kaufman
Moore
Menard
Edwards
SanPatricio
Terry
Crockett
Houston
Waller
Coke
Ward
Titus
Lampasas
Haskell
Martin
Atascosa
HemphillHartley
Young
BurlesonHardin
Gonzales
McMullen
Erath
Galveston
Hopkins
McLennan
MadisonMcCulloch
Donley
Kent
Real
Sutton
Midland
Hudspeth
Zavala
Harrison
ComancheMitchell
Navarro
Crane
Lubbock
Wise
Washington
JeffDavis
El Paso
Gregg
Williamson
Lipscomb
Mason
Henderson
Hansford
Chambers
Hill
Potter
JimWells
DeltaStonewall
Ector
Cameron
Maverick
Collin
Baylor
Panola
Guadalupe
BastropAustin
Andrews
Anderson
Blanco
DeWitt
Bandera
Bell
Aransas
Archer
Armstrong
Bee
Angelina
Bailey
Jefferson
Frio
Fannin
Goliad
Loving
Cass
FortBend
Bosque
Hockley
SanSaba
Kerr
Mills
Cooke
Wilbarger
Irion
Caldwell
JimHogg
Culberson
Upshur
Cherokee
Denton
Concho
Randall
Kimble
Knox
Polk
Hood
SanJacinto
Robertson
Wilson
Nolan
Cottle
Calhoun
Rockwall
LiveOak
Motley
Sherman
Ochiltree
Comal
-1,913 - 0
1 - 1,000
1,001 - 20,000
20,001 - 80,000
80,001 - 444,952

Estimated Percent Change of the Total Population by County, Texas, 2010 to 2015
7Source: U.S. Census Bureau Population Estimates, 2015 Vintage.
Dallas
Howard
FoardFloyd
Brewster
FranklinHunt
Newton
Starr
Kinney
Collingsworth
TomGreen
Coleman
Brazoria
Leon
Duval
Lamb
Morris
Smith
Jackson
Medina
Wheeler
Dallam
Callahan
Lamar
Coryell
Gaines
Kendall
Nacogdoches
Milam
Hays
Willacy
Johnson
Reagan
Webb
Shackelford
Bowie
Scurry
Kenedy
Somervell
Oldham
Taylor
King
Borden
Walker
Stephens
DeafSmith
Roberts
Tyler
ValVerde
Brown
Parker
Harris
Zapata
RedRiver
Karnes
PaloPinto
Glasscock
Shelby
Wood
Crosby
Refugio
Burnet
Sterling
Montgomery
SanAugustine
Rains
Nueces
Jack
Swisher
Camp
Brazos
Orange
Colorado
Pecos
Cochran
Parmer
FreestoneWinkler
Wichita
Gray
Schleicher
Hardeman
TravisGillespie
Yoakum
Fayette
Uvalde
Grimes
VanZandt
Throckmorton
Falls
Grayson
Ellis
Hall
Dickens
TrinityReeves
Marion
Terrell
Lynn
La Salle
Jasper
Jones
Castro
Victoria
Kleberg
Briscoe
Clay
Matagorda
Brooks
Runnels
Carson
LibertyLee
Hale
Bexar
Garza
Montague
Upton
Hamilton
FisherDawson
Dimmit
Hutchinson
Llano
Presidio
Eastland
Wharton
Rusk
Tarrant
Lavaca
Childress
Hidalgo
Kaufman
Moore
Menard
Edwards
SanPatricio
Terry
Crockett
Houston
Waller
Coke
Ward
Titus
Lampasas
Haskell
Martin
Atascosa
HemphillHartley
Young
BurlesonHardin
Gonzales
McMullen
Erath
Galveston
Hopkins
McLennan
MadisonMcCulloch
Donley
Kent
Real
Sutton
Midland
Hudspeth
Zavala
Harrison
ComancheMitchell
Navarro
Crane
Lubbock
Wise
Washington
JeffDavis
El Paso
Gregg
Williamson
Lipscomb
Mason
Henderson
Hansford
Chambers
Hill
Potter
JimWells
DeltaStonewall
Ector
Cameron
Maverick
Collin
Baylor
Panola
Guadalupe
BastropAustin
Andrews
Anderson
Blanco
DeWitt
Bandera
Bell
Aransas
Archer
Armstrong
Bee
Angelina
Bailey
Jefferson
Frio
Fannin
Goliad
Loving
Cass
FortBend
Bosque
Hockley
SanSaba
Kerr
Mills
Cooke
Wilbarger
Irion
Caldwell
JimHogg
Culberson
Upshur
Cherokee
Denton
Concho
Randall
Kimble
Knox
Polk
Hood
SanJacinto
Robertson
Wilson
Nolan
Cottle
Calhoun
Rockwall
LiveOak
Motley
Sherman
Ochiltree
Comal
-14.9% - 0%
0.1% - 2.5%
2.6% - 5%
5.1% - 10%
10.1% - 36.6%

CountyU.S. Rank Population Change
Population Change
Percent of Change from
Natural Increase
Percent Changefrom
Migration
Percent Change from International Migration
Harris 1 90,451 49.3% 50.7% 32.0%
Bexar 5 37,479 41.2% 58.8% 17.0%
Tarrant 6 36,152 46.3% 53.7% 20.2%
Dallas 9 33,760 68.1% 31.9% 39.0%
Fort Bend 13 29,437 20.7% 79.3% 16.5%
Collin 14 28,075 24.8% 75.2% 15.8%
Denton 16 25,820 25.5% 74.5% 11.7%
Travis 17 25,562 42.5% 57.5% 22.9%
Williamson 27 19,086 20.9% 79.1% 6.7%
Montgomery 29 18,505 19.2% 80.8% 9.9%*Dallas had net out domestic migration over this period. Source: U.S. Census Bureau, 2015 Vintage Population Estimates
Top Counties for Numeric Growth in Texas, 2014-2015

Top Counties for Percent Growth* in Texas, 2014-2015
County U.S. Rank
2014‐2015 Percent
Population Change
Percent Changefrom
Migration
Percent Change from InternationalMigration
Hays 1 5.2% 85.5% 1.9%Comal 2 4.5% 90.7% 2.1%
Fort Bend 4 4.3% 79.3% 16.5%Williamson 7 3.9% 79.1% 6.7%Montgomery 10 3.6% 80.8% 9.9%
Denton 12 3.4% 74.5% 11.7%Ector 18 3.3% 63.1% 3.1%
Midland 19 3.3% 66.2% 3.2%Collin 23 3.2% 75.2% 15.8%
Kaufman 25 3.1% 79.8% 3.2%Parker 29 2.8% 89.8% 2.2%Brazos 32 2.8% 69.2% 27.4%
Guadalupe 38 2.7% 78.8% 4.6%Ellis 39 2.7% 77.2% 2.7%
*Among Counties with 10,000 or more population in 2014Source: U.S. Census Bureau, 2015 Vintage Population Estimates

Percent Population by Race and Ethnicity, Texas, 2000 and 2014
Hispanic or Latino39%
NH White43%
NH Black 12%
NH Asian4%
NH Other2%
10
Hispanic or Latino32%
NH White52%
NH Black 11%
NH Asian3%
NH Other2%
Source: U.S. Census Bureau 2000 Decennial Census, SF1 and Population Estimates, 2104
20142000
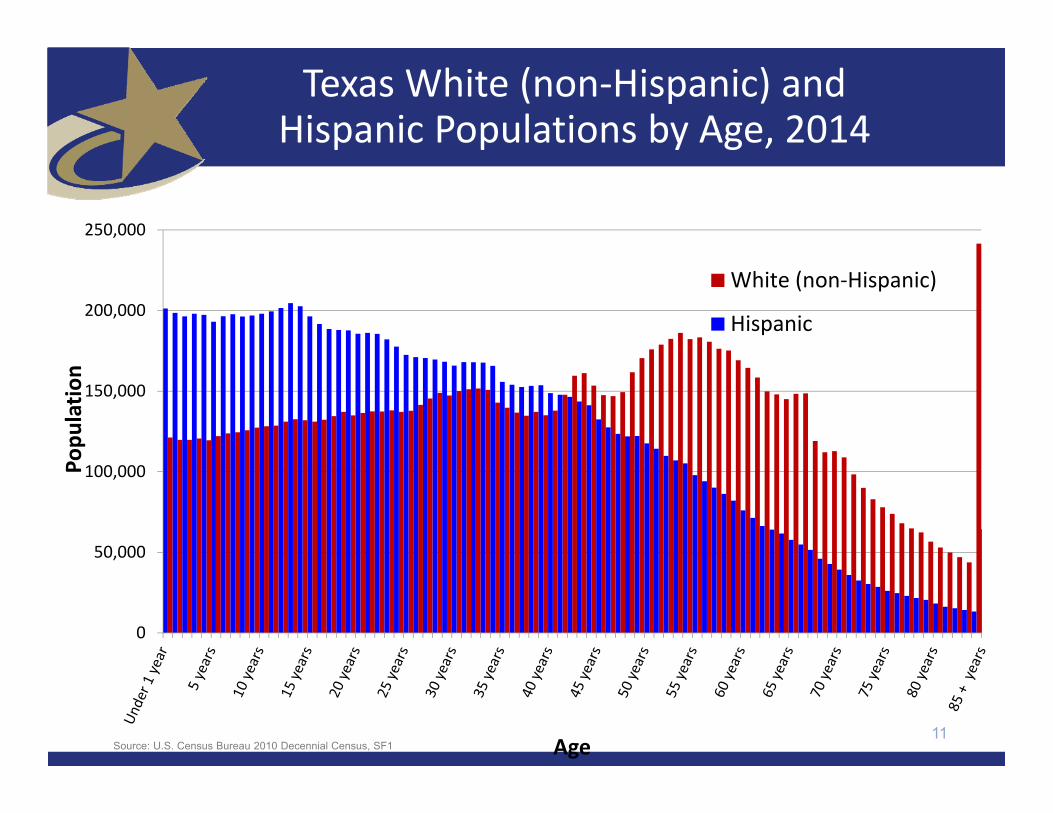
Texas White (non‐Hispanic) and Hispanic Populations by Age, 2014
0
50,000
100,000
150,000
200,000
250,000
Popu
latio
n
Age
White (non‐Hispanic)
Hispanic
11Source: U.S. Census Bureau 2010 Decennial Census, SF1

250,000 200,000 150,000 100,000 50,000 0 50,000 100,000 150,000 200,000 250,000Under 1 year
5 years
10 years
15 years
20 years
25 years
30 years
35 years
40 years
45 years
50 years
55 years
60 years
65 years
70 years
75 years
80 years
85 + years
Male White, Non‐Hispanic Female White, Non‐Hispanic
12
Texas Population Pyramid by Race/Ethnicity, 2014
Source: Texas Demographic Center, 2014 Population Estimates

250,000 200,000 150,000 100,000 50,000 0 50,000 100,000 150,000 200,000 250,000Under 1 year
5 years
10 years
15 years
20 years
25 years
30 years
35 years
40 years
45 years
50 years
55 years
60 years
65 years
70 years
75 years
80 years
85 + years
Male Black, Non Hispanic Male Other, Non Hispanic Male Hispanic Female Black, Non Hispanic Female Other, Non Hispanic Female, Hispanic
13
Texas Population Pyramid by Race/Ethnicity, 2014
Source: Texas Demographic Center, 2014 Population Estimates

250,000 200,000 150,000 100,000 50,000 0 50,000 100,000 150,000 200,000 250,000Under 1 year
5 years
10 years
15 years
20 years
25 years
30 years
35 years
40 years
45 years
50 years
55 years
60 years
65 years
70 years
75 years
80 years
85 + years
Male White, Non‐Hispanic Male Black, Non Hispanic Male Other, Non Hispanic Male Hispanic
Female White, Non‐Hispanic Female Black, Non Hispanic Female Other, Non Hispanic Female, Hispanic
14
Texas Population Pyramid by Race/Ethnicity, 2014
Source: Texas Demographic Center, 2014 Population Estimates

89.5% 86.7%
41.5%
65.9%49.7% 53.7%
10.5% 13.3%
58.5%
34.1%50.3% 46.3%
1950s 1960s 1970s 1980s 1990s 2000s
MigrationNatural Increase
Components of Population Change by Percent in Texas, 1950-2010
Source: U.S. Census Bureau, Population Estimates

The 10 U.S. States with the Largest Average Annual Net Domestic Migration by Rank, 2005‐2013
16
125,778
69,801
67,501
53,863
48,050
38,189
33,504
27,763
25,422
24,684
Texas
Florida
North Carolina
Arizona
Georgia
South Carolina
Colorado
Washington
Oregon
Tennessee
Source: U.S. Census Bureau, Population Estimates, 2015

Components of Population Change for the Top Five Growth States, 2013‐14
17
208,391 250,116
27,465 53,832 35,120
239,104 129,228
250,852
46,924 56,209
Texas California Florida Georgia Arizona
Natural Increase Net Migration
Source: U.S. Census Bureau, Population Estimates, 2015
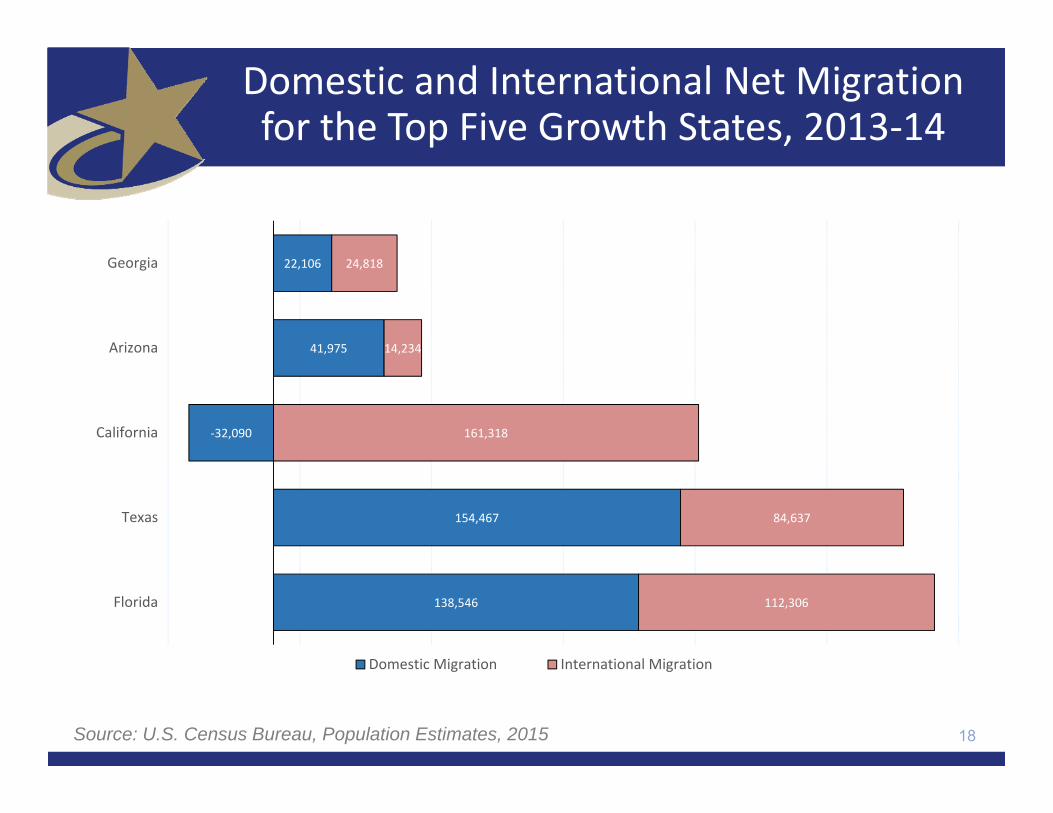
Domestic and International Net Migration for the Top Five Growth States, 2013‐14
18
138,546
154,467
‐32,090
41,975
22,106
112,306
84,637
161,318
14,234
24,818
Florida
Texas
California
Arizona
Georgia
Domestic Migration International Migration
Source: U.S. Census Bureau, Population Estimates, 2015

Top 10 Gross Migration States for Domestic Migration to Texas, 2013
19
62,386
28,906
33,321
28,457
30,672
19,139
19,451
22,049
21,129
18,924
31,499
29,051
19,988
22,259
12,719
23,141
18,428
15,504
14,803
14,715
California
Oklahoma
Florida
Louisiana
Illinois
Colorado
Arizona
New Mexico
New York
Georgia
Out‐Migrants From Texas In‐Migrants to Texas
U.S. Census Bureau ACS 1-Year PUMS,2013

Top 10 Destination Counties for Interstate Domestic Migration to Texas, 2009‐2013
20
74,661
42,472
40,259
37,521
30,340
24,540
21,653
20,687
17,351
14,693
52,968
32,995
37,448
28,556
21,309
23,990
17,669
16,100
12,351
6,042
Net Migration=21,693
Net Migration=2,811
Net Migration=9,477
Net Migration=8,965
Net Migration=9,031
Net Migration=550
Net Migration=3,984
Net Migration=4,587
Net Migration=5,000
Net Migration=8,651
Harris
Bexar
Dallas
Tarrant
Travis
El Paso
Bell
Collin
Denton
Williamson
Domestic Out‐Migration Domestic In‐Migration
U.S. Census Bureau ACS 5-Year Summary Data, 2009-2013

Annual Shares of Recent Non‐Citizen Immigrants to Texas by World Area of Birth, 2005‐2013

Shares of Recent Non‐Citizen Immigrants to Texas from Mexico, India, China, and All Other
Countries, 2005‐2012
0.8%
2.4%
2.5%
4.2%
1.3%
6.0%
3.9%
6.1%
5.3%
5.7%
7.0%
5.8%
6.9%
6.5%
8.6%
11.7%
56.8%
54.9%
51.3%
49.1%
39.5%
39.4%
45.4%
37.1%
37.1%
36.9%
39.2%
40.9%
52.3%
48.1%
42.1%
45.1%
2005
2006
2007
2008
2009
2010
2011
2012
China India Mexico All Others
Source: 1-Year ACS PUMS 2005-2012

23

24

25

26

Persons per Square Mile
0 – 10
11 – 50
51 – 500
501 – 4,000
4,001 – 56,000
1970 1980 1990
Density by Census Tract, MetroplexArea, 1970‐2010
Source: U.S. Census Bureau, decennial censuses. Geolytics, Neighborhood Change Database Tract Data from 1970-2010
Ellis
Hun
Wise Collin
Dallas
Denton
TarrantParker
Kaufman
JohnsonHood
H
Rockwall
Fannin
NavarroSomervell
Grayson
Hill
CookeMontague
Ellis
Collin
Dallas
Wise Denton
Tarrant
Hunt
Kaufman
Johnson
Parker
Hood
Rockwall
Henderson
Navarro
Fannin
Somervell
Van Zandt
Grayson
Hill
CookeMontague
Ellis
Collin
Dallas
Wise Denton
Tarrant
Hunt
Kaufman
Johnson
Parker
Hood
Rockwall
Henderson
Navarro
Fannin
Somervell
Van Zandt
Grayson
Hill
CookeMontague
Ellis
Collin
Dallas
Wise Denton
Tarrant
Hunt
Kaufman
Johnson
Parker
Hood
Rockwall
Henderson
Navarro
Fannin
Somervell
Van Zandt
Grayson
Hill
CookeMontague
2000
Ellis
Collin
Dallas
Wise Denton
Tarrant
Hunt
Kaufman
Johnson
Parker
Hood
Rockwall
Henderson
Navarro
Fannin
Somervell
Van Zandt
Grayson
Hill
CookeMontague
2010

Percent of Housing Units Built Before 1960, Census Tracts, Metroplex Area, Texas, 2009-2013
Source: U.S. Census Bureau, American Community Survey, 2009-2013 5-Year Sample
0% - 25%
25.1% - 45%
45.1% - 65%
65.1% - 80%
80.1% - 100%

Percent of Housing Units Built Between 1960 and 1999, Census Tracts, Metroplex Area, Texas, 2009-2013
Source: U.S. Census Bureau, American Community Survey, 2009-2013 5-Year Sample
0% - 25%
25.1% - 45%
45.1% - 65%
65.1% - 80%
80.1% - 100%

Percent of Housing Units Built After 1999, Census Tracts, Metroplex Area, Texas, 2009-2013
Source: U.S. Census Bureau, American Community Survey, 2009-2013 5-Year Sample
0% - 25%
25.1% - 45%
45.1% - 65%
65.1% - 80%
80.1% - 100%

Percent of the population that is Hispanic, Census Tracts, Metroplex Area, Texas, 2009‐2013
Dallas
Johnson
Parker
Ellis
Tarrant
Kaufman
Wise CollinDenton
Hood
Rockwall
31
p0% - 20%
20.1% - 35%
35.1% - 50%
50.1% - 80%
80.1% - 100%
Source: U.S. Census Bureau, American Community Survey, 5 Year Sample 2009-2013.

Percent of the population that is Black/African American, Census Tracts, Metroplex Area, Texas, 2009‐2013
32Source: U.S. Census Bureau, American Community Survey, 5 Year Sample 2009-2013.
0% - 5%
5.1% - 15%
15.1% - 30%
30.1% - 60%
60.1% - 99.3%
Dallas
Hunt
Johnson
Somervell
Parker
Grayson
Ellis
Montague
Tarrant
Kaufman
Navarro
Wise
Henderson
Henderson
Hill
Collin
Fannin
Bosque
Cooke
Denton
Hood
Rockwall
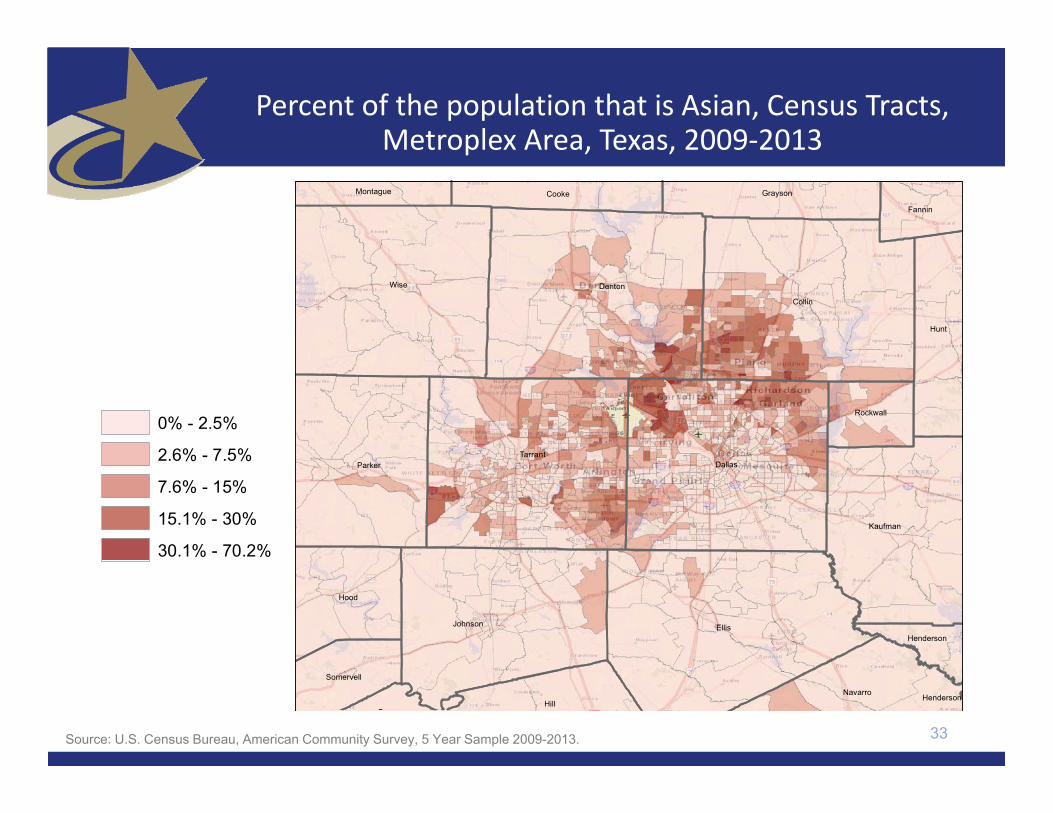
Percent of the population that is Asian, Census Tracts, Metroplex Area, Texas, 2009‐2013
33Source: U.S. Census Bureau, American Community Survey, 5 Year Sample 2009-2013.
0% - 2.5%
2.6% - 7.5%
7.6% - 15%
15.1% - 30%
30.1% - 70.2%
Dallas
Hunt
Johnson
Somervell
Parker
Grayson
Ellis
Montague
Tarrant
Kaufman
Navarro
Wise
Henderson
Henderson
Hill
Collin
Fannin
B
Cooke
Denton
Hood
Rockwall

Source: U.S. Census Bureau, American Community Survey, 2009-2013 5-Year Sample
Percent of the Population that was Born in Texas, Census Tracts, Metroplex Area, Texas, 2009-2013
0% - 20%
20.1% - 50%
50.1% - 60%
60.1% - 75%
75.1% - 100%
Dallas
Johnson
Parker
Ellis
Tarrant
Kaufman
Wise CollinDenton
Hood
Rockwall

Percent of the population that is foreign born, Census Tracts, Metroplex Area, Texas, 2009 ‐2013
35Source: U.S. Census Bureau, American Community Survey, 5 Year Sample 2009-2013.
0% - 5%
5.1% - 15%
15.1% - 25%
25.1% - 40%
40.1% - 73.1%

Source: U.S. Census Bureau, American Community Survey, 2009-2013 5-Year Sample
Percent of population speaking a language other than English at home and speak English less than very well, Census Tracts,
Metroplex Area, Texas, 2009-2013
0% - 5%
5.1% - 10%
10.1% - 20%
20.1% - 40%
40.1% - 77.9%
Dallas
Johnson
Parker
Ellis
Tarrant
Kaufman
Wise CollinDenton
Hood
Rockwall

Percent of the population living below poverty, Census Tracts, Metroplex, Texas, 2009‐2013
Dallas
Johnson
Parker
Ellis
Tarrant
Kaufman
Wise CollinDenton
Hood
Rockwall
37
0% - 10%
10.1% - 20%
20.1% - 30%
30.1% - 40%
40.1% - 91.5%
Source: U.S. Census Bureau, American Community Survey, 5 Year Sample 2009-2013.

Percentage of Population with Drive Times Longer than 25 Minutes, Texas Census Tracts, 1990 and 2010*
19901990 2010*2010*
Source: U.S. Census Bureau, 1990 decennial census and *American Community Survey, 2008-2012 5 Year Sample.

Mean Commute Time (minutes) of workers, Census Tracts, Metroplex Area, Texas, 2009‐2013
39Source: U.S. Census Bureau, American Community Survey, 5 Year Sample 2009-2013.
4.8 - 15
15.1 - 20
20.1 - 25
25.1 - 30
30.1 - 70
Dallas
Hunt
Johnson
Somervell
Parker
Grayson
Ellis
Montague
Tarrant
Kaufman
Navarro
Wise
Henderson
Hill
Collin
Fannin
Bosque
Cooke
Denton
Hood
Rockwall

Percent of workers who commute using public transportation, Census Tracts, Metroplex Area,Texas, 2009‐
2013
40
0% - 2%
2.1% - 5%
5.1% - 10%
10.1% - 15%
15.1% - 34.1%
Source: U.S. Census Bureau, American Community Survey, 5 Year Sample 2009-2013.
Dallas
Johnson
Parker
Ellis
Tarrant
Kaufman
Wise CollinDenton
Hood
Rockwall

Source: U.S. Census Bureau, American Community Survey, 2009-2013 5-Year Sample
Percent of population 25 years and older without a high school degree, Census Tracts, Metroplex Area, Texas 2009-2013
0% - 10%
10.1% - 20%
20.1% - 30%
30.1% - 50%
50.1% - 80%
Dallas
Johnson
Parker
Ellis
Tarrant
Kaufman
Wise CollinDenton
Hood
Rockwall

Dallas
Hunt
Johnson
Somervell
Parker
Jack
Ellis
Tarrant
Kaufman
Erath
Navarro
Wise
Henderson
Hill
Collin
Fannin
Bosque
Denton
Hood
Rockwall
42
0% - 15%
15.1% - 25%
25.1% - 45%
45.1% - 60%
60.1% - 92.2%
Percent of population 25 years and with a Bachelor’s degree or higher, Census Tracts, Metroplex Area, Texas 2009‐2013
Source: U.S. Census Bureau, American Community Survey, 2009-2013 5-Year Sample

Percent of population earning $75,000 per year or more, Census Tracts, Metroplex Area, Texas, 2009-2013
Source: U.S. Census Bureau, American Community Survey, 2009-2013 5-Year Sample
0% - 5%
5.1% - 10%
10.1% - 20%
20.1% - 30%
30.1% - 55.5%
Dallas
Johnson
Parker
Ellis
Tarrant
Kaufman
Kaufman
Wise CollinDenton
Hood
Rockwall
Sources: Esri, DeLorme, HERE, USGS, Intermap, increment P Corp., NRCAN, Esri Japan, METI, Esri China (Hong Kong), Esri(Thailand), TomTom

20
25
30
35
40
45
50
55
Millions
Zero Migration
0.5 of 2000‐2010 Migration
2000‐2010 Migration
Projected Population Growth in Texas, 2010‐2050
44Source: Texas State Data Center 2014 Population Projections

24
25
25
26
26
27
27
28
28
Millions
Zero Migration
0.5 of 2000‐2010 Migration
2000‐2010 Migration
Estimates
Projected and Estimated Population Growth in Texas, 2010‐2015
45Source: Texas State Data Center 2014 Population Projections and U.S. Census Bureau Population Estimates
‐
5,000,000
10,000,000
15,000,000
20,000,000
25,000,000
30,000,000
35,000,000
1950
1960
1970
1980
1990
2000
2010
2014
2020
2030
2040
2050
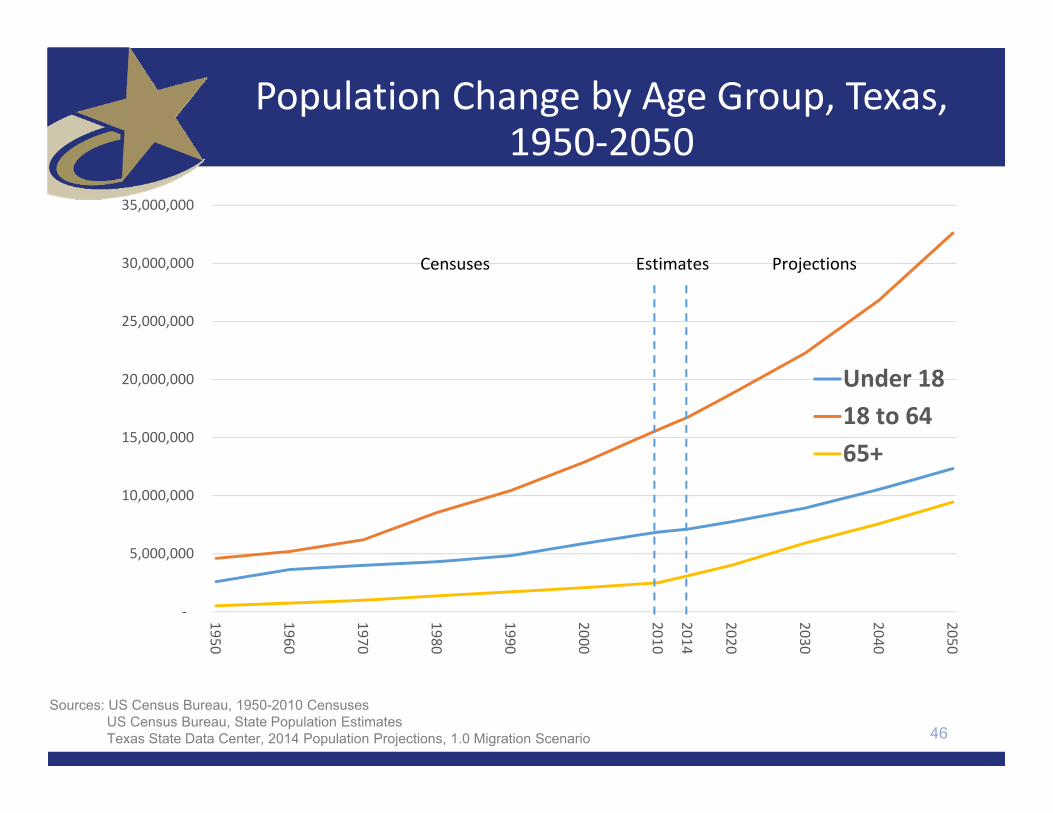
Under 1818 to 6465+
Censuses Estimates Projections
46
Population Change by Age Group, Texas, 1950‐2050
Sources: US Census Bureau, 1950-2010 Censuses US Census Bureau, State Population EstimatesTexas State Data Center, 2014 Population Projections, 1.0 Migration Scenario

Population Projections for Dallas‐Fort Worth‐Arlington Metropolitan Statistical Area, 2010‐2050
6,000,000
8,000,000
10,000,000
12,000,000
14,000,000
16,000,000
18,000,000
2010
2012
2014
2016
2018
2020
2022
2024
2026
2028
2030
2032
2034
2036
2038
2040
2042
2044
2046
2048
2050
2000‐2010
1/2 2000‐2010
No Migration
47Source: Texas State Data Center 2014 Population Projections

Population Estimates and Projections, MetroplexCounties, 2010‐2030
1500000
1700000
1900000
2100000
2300000
2500000
2700000
2900000
3100000
2010
2011
2012
2013
2014
2015
2016
2017
2018
2019
2020
2021
2022
2023
2024
2025
2026
2027
2028
2029
2030
Dallas .5 Tarrant .5
Dallas Tarrant
Dallas Est. Tarrant Est.
48Source: Texas State Data Center 2014 Population Projections
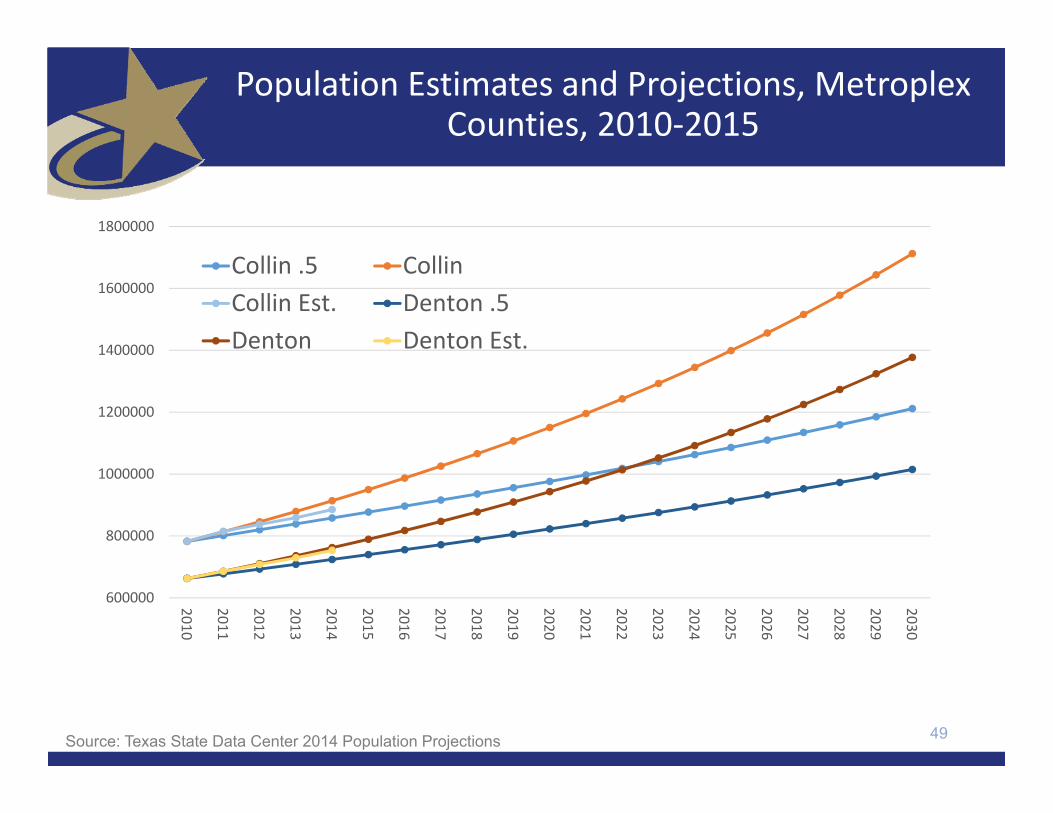
Population Estimates and Projections, MetroplexCounties, 2010‐2015
600000
800000
1000000
1200000
1400000
1600000
1800000
2010
2011
2012
2013
2014
2015
2016
2017
2018
2019
2020
2021
2022
2023
2024
2025
2026
2027
2028
2029
2030
Collin .5 CollinCollin Est. Denton .5Denton Denton Est.
49Source: Texas State Data Center 2014 Population Projections

Projected Racial and Ethnic Percent, Texas, 2010‐2050
0
5,000,000
10,000,000
15,000,000
20,000,000
25,000,000
30,000,000
35,000,000
NH‐WhiteNH‐BlackHispanicNH‐Other
50Source: Texas State Data Center 2012 Population Projections , 2000‐2010 Migration Scenario

Trends in Educational Attainment of Persons in the Labor Force (25‐64 Years of Age) in Texas by Race/Ethnicity –
High School Graduates and Above
50%
55%
60%
65%
70%
75%
80%
85%
90%
95%
100%
2001 2002 2003 2004 2005 2006 2007 2008 2009 2010 2011
White
Black
Hispanic
Other
Source: U.S. Census Bureau, American Community Survey, Public Use Micro Sample, 2001‐2011

Percent of the Civilian Labor Force (ages 25‐64) by Educational Attainment for 2011, 2030 Using Constant Rates,
Texas
52
15.0%
23.8%
31.3%
20.1%
9.8%
18.1%
24.0%
29.9%
18.7%
9.3%
0.0%
5.0%
10.0%
15.0%
20.0%
25.0%
30.0%
35.0%
Less than High School High School orEquivalent
Some College /Associate Degree
Bachelor's Degree Graduate orProfessional Degree
Percen
t of the
Civilian
Labor Force
Educational Attainment
2011 ACS
2030 Constant 2011 %
These should be going DOWN These should be going UP
Sources: U.S. Census Bureau, American Community Survey, 1-Year PUMS.Texas State Data Center, 2012 Vintage Population Projections, 0.5 Migration Scenario

Percent of the Civilian Labor Force (ages 25‐64) by Educational Attainment for 2011, and 2030 Using Trended
Rates, Texas
53
15.0%
23.8%
31.3%
20.1%
9.8%11.4%
20.4%
34.3%
22.1%
11.8%
0.0%
5.0%
10.0%
15.0%
20.0%
25.0%
30.0%
35.0%
40.0%
Less than High School High School orEquivalent
Some College /Associate Degree
Bachelor's Degree Graduate orProfessional Degree
Percen
t of the
Civilian
Labor Force
Educational Attainment
2011 ACS
2030 Trended (2001‐2011 Trend)
These should be going DOWN These should be going UP
Sources: U.S. Census Bureau, American Community Survey, 1-Year PUMS.Texas State Data Center, 2012 Vintage Population Projections, 0.5 Migration Scenario

Projected population of 18‐23 year old persons and projected college and university enrollment, Texas, 2010‐2050
0
500,000
1,000,000
1,500,000
2,000,000
2,500,000
3,000,000
3,500,000
4,000,000
4,500,000
.5 2000‐2010 Migration 2000‐2010 MigrationPublic Universities Public Two‐Year CollegesIndependent Universities TotalLinear (Public Universities) Linear (Public Two‐Year Colleges)
54Source: Texas State Data Center 2014 Population Projections and the Texas Higher Education Coordinating Board 2015 Enrollment Projections

High school graduation rates by race and ethnicity, Texas, 2007‐2014
70.7 68.5
88.284.2 85.5
93
0
10
20
30
40
50
60
70
80
90
100
African‐American Hispanic White2007 2008 2009 2010 2011 2012 2013 2014
55Source: Texas Education Agency, “Secondary School Completion and Dropouts in Texas Public Schools, 2013-14”

High school students who graduated in the school year prior to entering higher education in the fall semester, Texas, 2015
Total WhiteAfrican‐American Hispanic Asian
Native American
Enrolled 51.4% 55.2% 48.5% 47.2% 74.6% 50.8%
Not trackable 5.2% 1.6% 2.1% 8.8% 5.7% 2.2%
Not Found 43.5% 43.2% 49.4% 44.0% 19.7% 47.0%
56

Percent of persons aged 15 years and older enrolled in college or graduate school by public and private, Texas, 2010‐2014
7.0% 7.6% 7.6% 7.3% 7.3%
1.5%1.6% 1.5% 1.5% 1.5%
2010 2011 2012 2013 2014
Public Private
57Source: U.S. Census Bureau, American Community Survey, 2010-2014 1-Year Samples

Percent of Hispanics aged 25 years and older with associates degree or higher, U.S. and select states, 2014
20.4%
30.7%
24.2%
17.1%18.3%
0.0%
5.0%
10.0%
15.0%
20.0%
25.0%
30.0%
35.0%
US Florida New York California Texas
58Source: U.S. Census Bureau, American Community Survey, 2014 1-Year Sample

Percent of the population aged 25 years and older with associates degree or higher by sex and race and ethnicity, Texas, 2014
65.8%
44.4%
26.3%
18.6% 16.8%
60.8%
43.2%
32.2%
20.9% 19.7%
0.0%
10.0%
20.0%
30.0%
40.0%
50.0%
60.0%
70.0%
Asian NH White Black Other Hispanic
Male Female
59Source: U.S. Census Bureau, American Community Survey, 2014 1-Year Sample

Review
• Growth – significant, fast, uneven• Hispanic population driving growth
• Migration patterns are dynamic• Geographic variation of characteristics and trends at the State and local levels
• Challenges for closing gaps and achieving desired higher education outcomes
60

Contact
Office: (210) 458‐6530Email: [email protected]: demographics.texas.gov
Lloyd Potter, Ph.D.
@TexasDemography
61