Embed Size (px)
Citation preview

Texas A&M, May 2007
The Growth of LSS in a Dark Energy Dominated Universe
Marc Davis
UC Berkeley

The DEEP2 Collaboration
U.C. Berkeley
M. Davis (PI)
D. CrotonD. Croton
M. Cooper
B. Gerke
R. Yan
U.C. Santa Cruz
S. Faber (Co-PI)
D. Koo
P. Guhathakurta
U.C. Santa Cruz
D. Phillips
S. Kassin
K. Noeske
A. Metevier
L. Lin
N. Konidaris
G. Graves
J. Harker
Other InstitutionsJ. Newman (LBNL)
A. Coil (Arizona)C. Willmer (Arizona)B. Weiner (Arizona)R. Schiavon (UVA)
C. Conroy (Princeton)N. Kaiser (Hawaii)
D. Finkbeiner(Harvard)
A. Connolly (Pitt.)
The DEEP2 Galaxy Redshift Survey used the DEIMOS spectrograph at the Keck II telescope to study both galaxy
properties and large-scale structure at z~1.

Texas A&M, May 2007
DEEP2 has been made possible by DEIMOS, a new instrument on Keck II
DEIMOS:
• PI: Faber
• wide-field multiplexing (up to 160 slitlets over a 16’x4’ field)
• high resolution (R~5000)
• spectral range (~2600 Å at highest resolution)
• CCD array of 8k x 8k

Texas A&M, May 2007
DEEP2 pre-selects high-z galaxies using observed
colors

DEEP2 mask selection
Targeted galaxies are enclosed with white curves
Solid slits are objects selected on a given mask.
dotted and dashed lines are galaxies from neighboring masks.

Texas A&M, May 2007
DEEP2 slitmask spectroscopy
Using custom-milled slitmasks with DEIMOS we obtained spectra of ~150 targets at a time. A total of 400 slitmasks was required for the survey; we tilted slits up to 30 degrees to obtain rotation curves.
position

Texas A&M, May 2007
AEGIS: the All-wavelength Extended Groth Strip International Survey
Spitzer MIPS, IRAC
DEEP2 spectra and Caltech/JPL Ks imaging
HST/ACSV,I (Cycle 13)
DEEP2/CFHTB,R,I
GALEX NUV+FUV
Chandra & XMM:XMMChandra (1.6Ms)
Plus VLA (6 & 21 cm), SCUBA, etc….
Texas A&M, May 2007
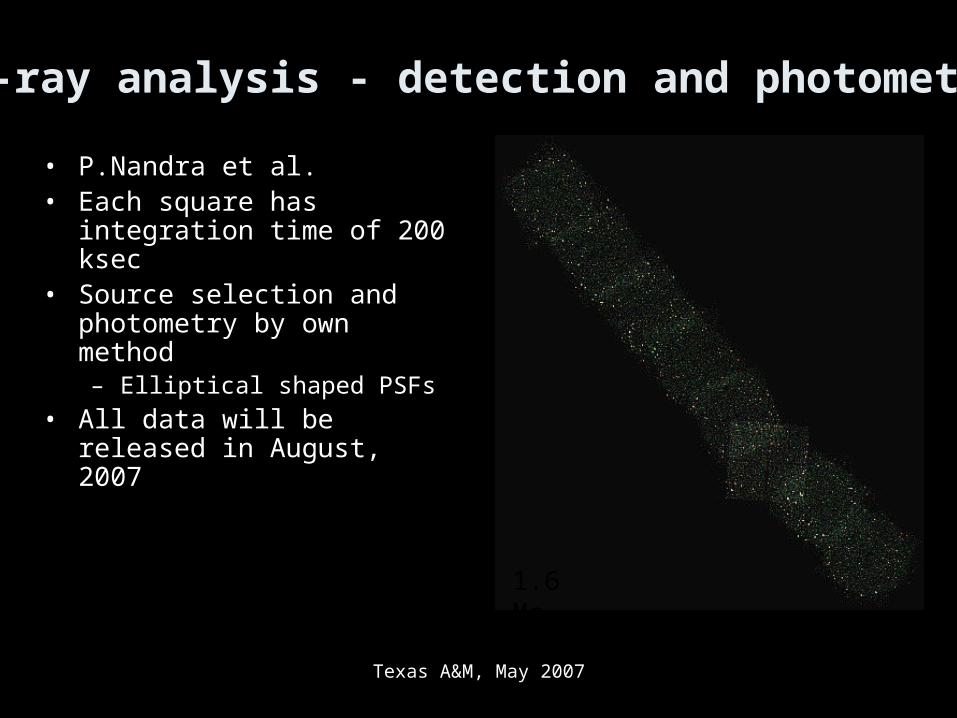
X-ray analysis - detection and photometry
• P.Nandra et al.• Each square has integration
time of 200 ksec• Source selection and
photometry by own method– Elliptical shaped PSFs
• All data will be released in August, 2007
1.6 Ms

Texas A&M, May 2007
A Redshift Survey at z=1:• 3 sq. degrees • 4 fields (0.5o x <2o)• 80 Keck nights, one-hour exposures to RAB=24.1• primarily z~0.75-1.4 (pre-selected using BRI photometry)• 46,585 unique redshifts, error ~30 km/s• ~5·106 h-3 Mpc3
• 1200 l/mm: ~6500-9200 Å• 1.0” slit: FWHM 68 km/s• z=0.7-1.4 spans lookback time ~6.0 - 8.0 Gyr ago• Within DEEP2 we are surveying 2.5 Gyr or ~20% of the history of the Universe, and SDSS/2dF comparisons give ~3x this baseline

Texas A&M, May 2007
Redshift Distribution of DEEP2 Survey

Texas A&M, May 2007
DEEP2 Status Update
• DEEP2 began observations in July 2002.
• Observations are now >95% finished, with >49k spectra in hand and 3 of 4 fields completed.
• Follow-up observations have begun.
• First season’s data is already public:
http://deep.berkeley.edu/DR1
• Next data release (DR2) includes ~75% of the data and has also been released! http://deep.berkeley.edu/DR2

Texas A&M, May 2007
Redshift Maps in 4 Fields: z=0.7-1.3
Cone diagram of 1/12 of the full DEEP2 sample

Texas A&M, May 2007
Galaxy groups in DEEP2
, zposition
•Overdensities identified in redshift space.
•Use the VDM algorithm of Marinoni et al. (2002).
•Group in early DEEP2 data s~250 km/sec
Texas A&M, May 2007
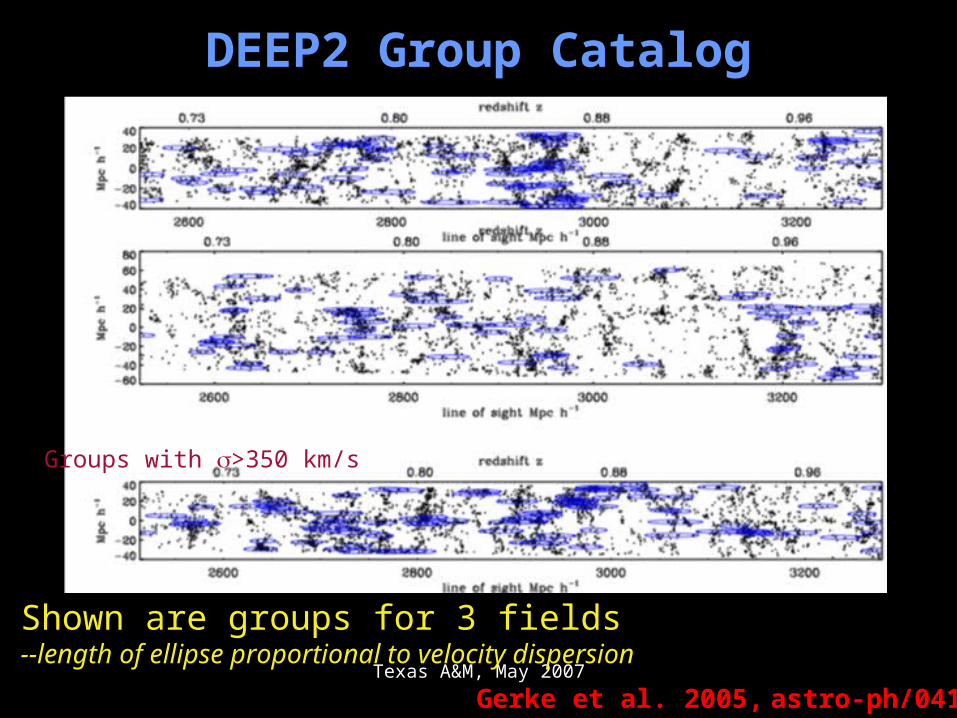
DEEP2 Group Catalog
Gerke et al. 2005, astro-ph/0410721
Shown are groups for 3 fields --length of ellipse proportional to velocity dispersion
Groups with >350 km/s
Texas A&M, May 2007
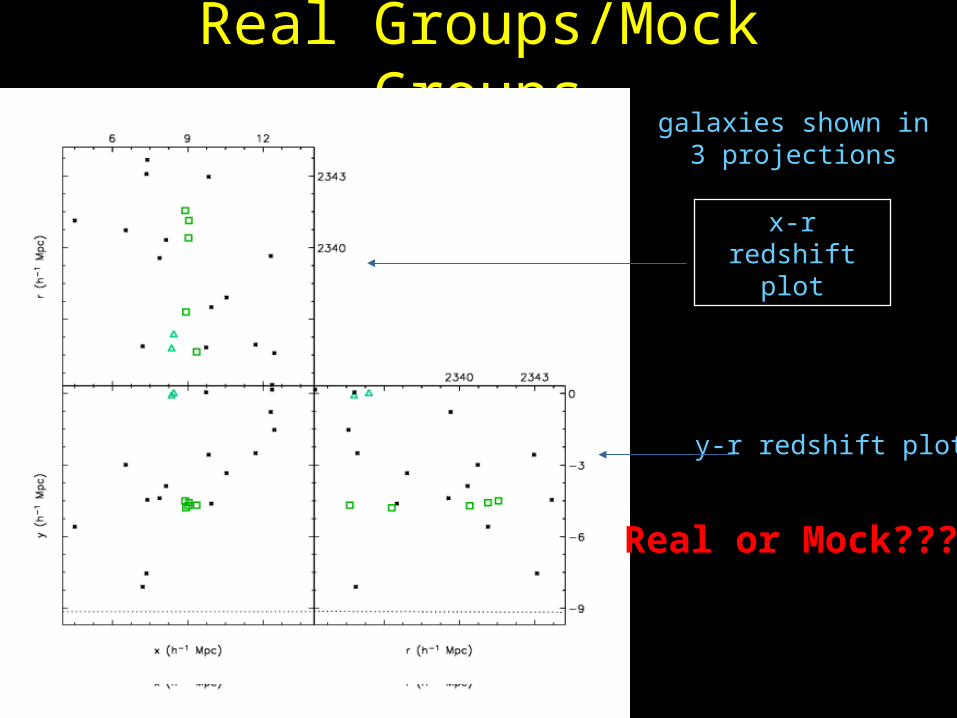
Real Groups/Mock Groups
x-r redshift plot
y-r redshift plot
X-y projected on sky
galaxies shown in 3 projections
Real or Mock???

Why search for groups in DEEP2?•Apparent abundance of groups: dN(,z)/dzd Provides a useful test of dark energy eq. of state (Newman et al, 2002)
•differences in the volume element varies by 3x between w=0 and w=-1
•For groups of modest-mass, the evolution of dispersion is 2nd order
•Heavy black curve is T=.3 DEIMOS took ~7 years to build; at time of designing science expt. T was still undetermined, and DE was not discussed.

Size of the Universe versus w

Abundance versus Redshift
Simulated Data!!

Measured dispersion with galaxies compared to reality-- tremendous scatter!

Texas A&M, May 2007
Dispersion with galaxies

Texas A&M, May 2007
Constraints expected on parameters w, 8, m
DEEP2 Cluster Counts
•DEEP2 survey counted ~300 groups•Velocity dispersion measured in each case•Counts of N(, z) is a strong test of w•B. Gerke will have results out “soon”

Texas A&M, May 2007
• DEEP2 observations are >96% done
• DR2 has occurred in January: http://deep.berkeley.edu/DR2
• AEGIS ApJL special issue
• Way too many new results to cover in one talk!
Conclusions on DEEP2
Texas A&M, May 2007
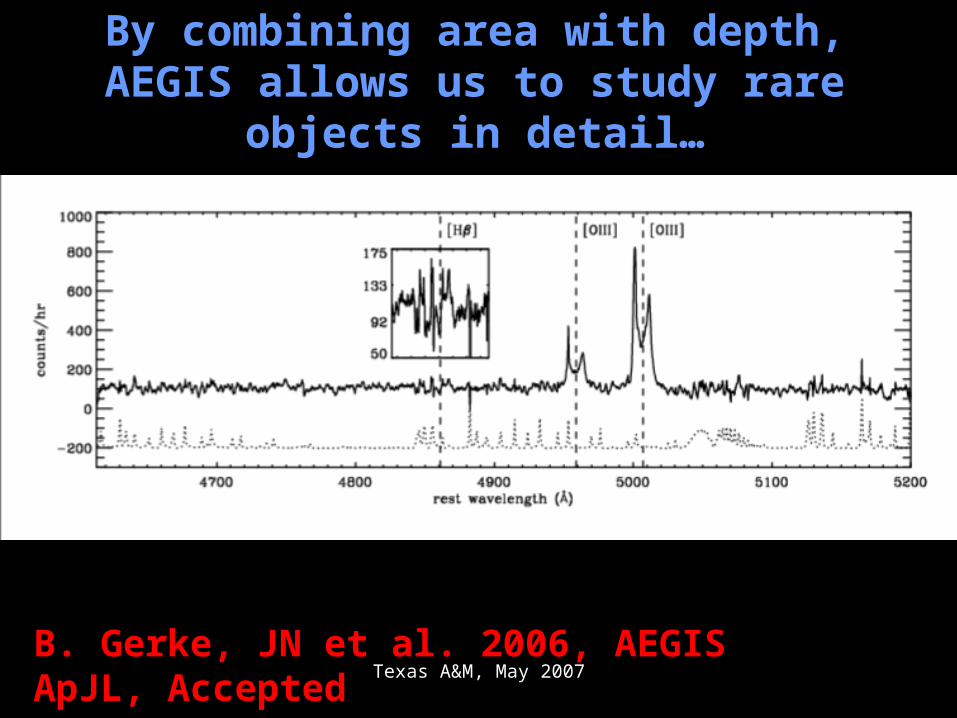
By combining area with depth, AEGIS allows us to study rare objects in detail…
B. Gerke, JN et al. 2006, AEGIS ApJL, Accepted

Texas A&M, May 2007
Like a spectroscopically identified, dual AGN at z=0.7
H
[OIII] 4959
[OIII]5007
/ z
posi
tion
Texas A&M, May 2007
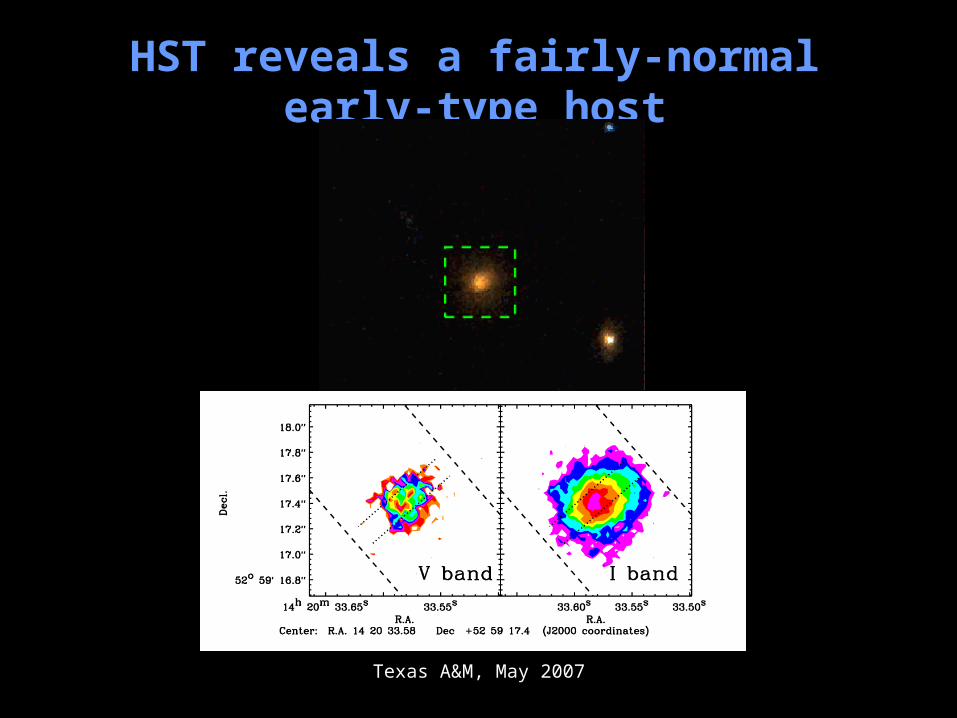
HST reveals a fairly-normal early-type host