Embed Size (px)
Citation preview

50
Tests of Visual Function
Address for Correspondance: Department of Biostatistics Amrita Institute of Medical Sciences & Research Centre, Ponekkara P.O. , Kochi-682041
Natasha Radhakrishnan MS, DNB, MRCOphth
Visual acuity
Snellens Chart
The distance central visual acuity is usually tested by Snellens test types.
The fact that two distant points can be visible as separate only when they subtend an angle of 1 min at the nodal point of the eye & each letter subtends an angle of 5 min at the nodal point of the eye, forms the basis of Snellens test types.
Snellen charts are named after the Dutch ophthalmologist Herman Snellen who developed the chart during 1862. Vision scientists now use a variation of this chart, designed by Ian Bailey and Jan Lovie.
The traditional Snellen chart is printed with eleven lines of block letters. The first line consists of one very large letter, which may be one of several letters, for example E, H, or N. Subsequent rows have increasing numbers of letters that decrease in size
The symbols on an acuity chart are formally known as "optotypes". In the case of the traditional Snellen chart, the optotypes have the appearance of block letters, and are intended to be seen and read as letters. They are not, however, letters from any ordinary typographer's font. They have a particular, simple geometry in which:
• the thickness of the lines equals the thickness of the white spaces between lines and the thickness of the gap in the letter "C"
• the height and width of the optotype (letter) is five times the thickness of the line.
Only the ten Sloan letters C, D, E, F, L, N, O, P, T, Z are used in the traditional Snellen chart. The perception of five out of six letters (or similar ratio) is judged to be the Snellen fraction.
Snellen fraction
Visual acuity = Distance at which test is made / distance at which the smallest optotype identified subtends an angle of 5 arcminutes.
"20/20" (or "6/6") vision
Snellen chart is placed at a standard distance, twenty feet in the US. Outside of the US, the standard chart distance is six meters, normal acuity is designated 6/6, and other acuities are expressed as ratios with a numerator of 6. Many rooms do not have 6 metres available, and either a half size chart
subtending the same angles at 3 metres, or a reversed chart projected and viewed by a mirror is used.
LogMAR charts
A visual acuity chart in which the rows of optotypes vary in a logarithmic progression. The multiplier of the geometric progression is usually equal to 1.2589 or 0.1 log unit. On one side of such a chart the rows of optotypes are usually labelled with the traditional snellen notation. On the other side of each row visual acuity is labelled as the logarithm of the minimum angle of resolution (log MAR), which is the logarithm to the base of 10 of the angular subtense of the stroke widths of the optotypes at a standard distance.
LogMAR means the logarithm of the Minimum Angle of Resolution. It is recommended that whenever research on visual acuity has to be done, the LogMAR chart is to be used. This has led to the assertion that researches done using a logarithmic progression in size of letters on test chart gives most accurate VA measurement. The LogMAR chart has equal graduation between the letters on a line as well as the space between lines. Again, there is a fixed number of letter - five letters on each line
The chart was designed by Bailey and Lovie in 1980.
Relation to the Snellen chart
Contrary to the LogMAR chart, the Snellen chart which is also used in assessing visual acuities has the following differences:
• Different number of letters on a line
• Unequal graduations from one line to the other
Recording Visual Acuity using the LogMAR chart
Each letter has a score value of 0.02 log units. Since there are 5 letters per line, the total score for a line on the LogMAR chart represents a change of 0.1 log units. The formula used in calculating the score is:
• LogMAR VA = 0.1 + LogMAR value of the best line read - 0.02 X (number of letters read)
Advantages of LogMAR over other charts
• Equal number of letter per line
• Regular spacing between lines and letters
• Uniform progression in letter size
• Final score based precisely on total of all letters read
Common Tests Simplified

51
• Finer grading scale allows greater accuracy and improved test/retest reliability
ETDRS Acuity Testing
ETDRS acuity testing has become the worldwide standard for visual acuity testing, replacing the Snellen and Sloan acuity tests. ETDRS stands for Early Treatment Diabetic Retinopathy Study.
The ETDRS acuity test was developed to aid in evaluating the changes in vision following pa-nretinal photocoagulation in patients with diabetic retinopathy
Standardized ETDRS - ESV-3000 (fig 8)
The ESV-3000 is the only large-format standardized ETDRS testing device. The ESV-3000 al-lows testing up to 20/200 ETDRS Acuity at a test distance of 4 meters (The CSV-1000 has a smaller footprint and allows testing up to 20/200 at a test distance of 8 feet.). The device is oper-ated by infrared remote control.
The ESV-3000 is designed specifically for clinical trials where large-format ETDRS testing (up to 20/200) is performed at 4 meters. Unlike other large-format back-lit devices for ETDRS eval-uation, the light level is calibrated and held constant, allowing the automatic replication of testing light levels from different clinical trials locations or for evaluating before and after treatment. Other devices are not standardized and cannot provide constant test lighting for ETDRS evalua-tion between locations or over time. A wide variety of ETDRS LogMAR tests are available, in-cluding Chart R, Chart 1, Chart 2, Tumbling E and many others.
ETDRS Design
The ETDRS test incorporates specific design criteria to make it more accurate than the Snellen or Sloan acuity tests. These include:
• Same number of letters per row (five letters per row)
• Equal spacing of the rows on a log scale (the rows are separated by 0.1. log unit)
• Equal spacing of the letters on a log scale
• Individual rows balanced for letter difficulty
To prevent memorization, different versions of the ETDRS test chart are available. The three standard versions of the ETDRS chart are R, 1 and 2.
ETDRS Standardization
To properly evaluate ETDRS, the test should be conducted under standardized lighting condi-tions. The CSV-1000 is the only device that self-standardizes the test lighting level to the rec-ommended photopic test level of 85 cd/m2. This light level has been recommended by the Na-tional Academy of
Sciences and by the American National Standards Institute for ETDRS and contrast sensitivity vision testing.
Scoring the ETDRS Chart
ETDRS scoring can be accomplished in a number of different ways. The two most common me-thods are described below. Both of these methods provide scores that can be used for statistical analysis, unlike the scores provided by the standard Snellen or Sloan Acuity tests.
ETDRS Scoring Method 1: The patient starts are the top of the chart and begins to read down the chart. The patient reads down the chart until he or she reaches a row where a minimum of three letters on a line cannot be read. The patient is scored by how many letters could be correctly identified.
ETDRS Scoring Method 2: The ETDRS charts were originally used in ETDRS studies where patients had relatively poor vision. For these studies, starting patients at the top of the chart to read down worked well since most patients could read only about half way down the chart. However, the ETDRS charts are now being widely used for many studies, including IOL and refractive surgery studies, where patients have very good vision. For these patients, it makes little sense to start them at the top of the chart and read down. For these patients, a second scoring method is used. The patient starts on the last row where he or she can read all of the letters, and then reads down until he or she reaches a row where a minimum of three lines cannot be read. For these patients, a decimal ETDRS acuity score can be used. To calculate the decimal acuity score, follow the guidelines below. (In reality, scoring method 1 can also be used for statistical analysis, by assuming that the patient could have read all of the letters above where he or she started on the test. Then add that number of letters on to the number of letters actually read by the patient.)
• Determine the last row where the patient can correctly identify all 5 letters on that row.
• Determine the log score for that row (these scores are shown in the margin of the ETDRS test, e.g. the 20/25 line has a log score of 0.1)
• subtract 0.02 log units for every letter that is correctly identified beyond the last row where all of the letters are correctly identified. For example, if the patient reads all of the letters correctly on the 20/30 row and then 3 letters correctly on the 20/25 row, the Log Score would be calculated as follows:
20/30 Row = 0.20
3 letters X 0.02 log/letter = - 0.06
ETDRS Acuity Log Score = 0.14
Are Bailey-Lovie and ETDRS Different?
Natasha Radhakrishnan - Tests of Visual Function

Vol. XXIV, No.1, Mar. 2012
52
Kerala Journal of Ophthalmology
Bailey-Lovie Charts and ETDRS are different. Bailey-Lovie charts incorporate the European de-sign of LogMAR; i.e. letter sizes are rectangular. For example, for the Bailey-Lovie Chart De-sign, a 20/20 letter is 4 minutes of arc in height by 5 minutes of arc in width. ETDRS letters are all square, i.e. 5 by 5.
Near Vision Charts
Jaeger’s Chart:- Jaeger in 1867, devised this NV chart , Patient’s NV acuity is labeled as JI-J7.
Roman test types:- The jaegers charts made from the modern fonts deviate considerably from the original standard, To overcome this theoretical problem the Faculty of ophthalmologists of Great Britain in 1952 deviced another NV chart. This consists of “Times Roman” type fonts with standard spacing. According to this chart the NV is recorded as N5,N6,N8,N10,N12,N18,N24,N36 & N48
Snellens NV charts:- Snellen introduced “snellens equivalent for near vision” on the same prin-ciples as his distant types.The graded thickness of the letters of different lines is about 1/17th of the distant-vision chart letters.In this event the letters equivalent to 6/6 line subtend an angle of 5 min at an average reading distance (35cm/14inches).Each eye tested separately. The NV chart is kept at a distance of 25-33cm, with good illumination thrown over Pt’s left shoulder.NV is rec-orded as
NV= J1 at 30mm (in Jaeger’s notation)
NV= N5 at 30mm (in Faculty notation)
Pediatric visual acuity
Measurement of Visual acuity in infants
Normal pupillary response, and elicitable Optokinetic response indicates good visual acuity. Fo-vea develops completely by 3 months. If child habitually fixates with one eye-poor vision in non fixating eye, and will resist occlusion of better eye. Fixation behaviour and bimocular fixation pattern can be assessed and monocular fixation can be rated whether central steady and manin-tained. At 3-6 months-infants have adequate refixation reflex to permit cover test.. Optokinetic nystagmus-remains asymmetric till 4 months of age. Till this age group, it does not give reliable equivalent of snellen’s visual acuity.
1) Optokinetic Nystagmus Test
Nystagmus is elicited by passing succession of black and white stripes around patient’s field of vision. Visual angle subtended by the smallest strip width that still elicits an eye move-ment(minimal separable) is a measurment of visual acuity
l Optokinetic nystagmus acuity is 6/120 in new born
l 6/60 at 2 months
l 6/30 at 6 months
l 6/6 at 20-30 months
Baby faces the screen, observer records the direction of the head movement in response to the appearance of the striped stimulus. Location of striped pattern is varied from left to right and fineness gradually reduced until there is no longer any correlation.
2) Preferential looking test
Presented with 2 adjacent stimulus fields, one of which is striped,other homogenous,infant will tend to look at the striped pattern for a greater portion of time. Examiner is hidden be-hind the screen on which one projects a homogenous surface on one side and black and white strips on the other side. Stimuli are alternated randomly and observer looks through a hole in the screen at the eyes of the infant. It is most suitable for infants upto 4 months since older infants are distracted. VA determined to range from 6/240 in newborn to 6/60 at 3 months to 6/6 at 36 months. Examples are Teller and Cardiff visual acuity charts(Fig 1)
Cardiff visual acuity charts
Positioned either at the top or at the bottom of grey card are pictures that will interest a child (house, car, duck etc.).There are eleven visual acuity levels, with three cards at each level. Begin with the largest picture, at a distance of either 1 meter or 50cm.The card is presented at the patient’s eye level and the examiner watches the child’s eye movement, whether up or down. Note this direction and then the second card is presented. Again the eye movement is observed. The examiner then checks the cards to see if both estimations are correct.If so, the next set of cards is presented in the same manner. If a wrong estimation of picture position or no definite fixation, then the previous set of cards is again presented, using all three cards. The end point is found when two of the three cards are consistently seen correctly.

53
3) Visual evoked response
EEG recording made from occipital lobe in response to visual stimuli. VER is the only clini-cally objective technique available to assess functional state of the visual system beyond re-tinal ganglion cells .Pattern reversal VER gives a rough assessment of visual acuity.The visual acuity in infants is 6/120 at 1 month by VER ,6/60 by 2 months and 6/6 to 6/12 by 1 yearVisually
4) Catford drum test
Child made to observe an oscillating drum with black dot of varying sizes. Smallest dot which evokes pendular eye movements-denotes the level of visual acuity. A detection acuity test it overestimates the visual acuity level.
1-2 years
1) Marble game test :
6-12 months –reaching or placing games-to estimate visual function.
Child is asked to place marbles in holes of card or box
Not to measure visual acuity but compares functioning of one eye with other closed.
2) Sheridans ball test-The smallest ball the infant can fixate and follow at a distance of 10 feet is noted-asking him to pick it up gives a rough estimate of visual acuity
3) Boeks candy bead test-asked to match beads at 40 cm
4) Worths ivory ball test
2-3 years
1) Dot Visual acuity test-illuminated box with different size dots-smallest dot identified de-notes visual acuity
2)Coin test
3)Miniature toy test
4) LEA SYMBOLS(Fig 2)
Developed by Dr Lea Hyvärinen .There are four familiar symbols: a circle (ring or ball) a square(block or box), a house, and an apple or heart .When no longer correctly recognized, the symbols transform into circles a called "rings" or "balls" by the patient …so no ‘failures’ .Equally sensitive to blur and equally difficult to distinguish, helping to eliminate guessing.It also eliminates problems with language barriers
3-5 years
1) Illiterate E cut Out tests- Child is asked to match the E given to E of various sizes
2) Tumbling E test-different size E in different directions
3) Isolated hand figure test-using the hand instead of the E
4) Sheriden gardiner HOTV test-to match the card given to chart
5) Pictorial vision charts-Presents familiar objects the child can easily identify eg The Kay picture test-from 6/6 to 6/60 can be assessed
6) Broken wheel test-to identify the car with the broken wheel in various sizes
Sheriden Gardiner HOTV test
The child and examiner are spaced 6 metres apart. .The child is provided with a seven letter card and the examiner with a set of single letter cards corresponding in size to Snellen letters. The child is then asked to point on their card to the letter shown to them by the examiner.
Contrast Sensitivity
In contrast sensitivity testing, the patient is presented with repetitive stimuli in the form of verti-cally-oriented gratings at various contrast levels. They may be square-wave gratings or sine-wave gratings. The gratings are designed so that the average luminance - half the sum of the luminance of the dark and light bars - is constant for all gratings.
The spacing between the outer edges of any two bars in a grating is the spatial frequency, which is analogous to the width of a stroke and a gap on a visual acuity chart. For example, a spatial frequency of 30 cycles per degree (30 bars and 30 gaps per degree) would indicate a stroke or gap width of one minute of arc, and would therefore be the equivalent of 20/20 (6/6) visual acui-ty. The first contrast sensitivity tests to be developed, which were used mainly for research, con-sisted of electronically-generated gratings.
The Arden Plate test. (Fig 3)
Introduced in 1978 by C.S. Arden , it was one of the first contrast sensitivity tests designed for clinical use. The test is in the form of a 6-page booklet, with each page displaying several sine-wave gratings of varying contrast and spatial frequency. Each grating is oriented vertically, with the contrast varying from the top to the bottom. For each grating, the examiner or the patient gradually moves a card (which masks the grating) downward over the page until the point is reached at which the grating is seen.
At that point, the examiner records the contrast from a scale provided with the grating. After a practice trial, the procedure
Figure 2 Lea symbols
Natasha Radhakrishnan - Tests of Visual Function
Vol. XXIV, No.1, Mar. 2012
54
Kerala Journal of Ophthalmology
is repeated for each of the six plates.
The Vistech chart. (Fig 4)
Developed in 1984 by Ginsberg , the Vistech chart is made up of 6 rows of 3-inch diameter sine wave gratings. Each row consists of a sample grating and various test gratings at a given spatial frequency but differing in contrast. Spatial frequencies utilized - from the top row to the bottom row - are 1, 2, 4, 8, and 16 cycles per degree. Each grating is oriented in one of 3 directions: ver-tical, slanted 15 degrees to the left, or slanted 15 degrees to the right.
The task of the patient is to report the orientation of each grating in each row until the orientation cannot be determined. When the test is completed, the data are plotted and compared to a ‘nor-mal’ contrast sensitivity curve. Two separate Vistech charts are available: the VCTS- 6500 for distance testing, and the VCTS-6000 for near testing. A projector slide, the VCTS-500S, is also available.
Figure 3. The Arden Plate test. Gratings (a) and (b) differ in spatial frequency, and gratings (b) and (c) differ in contrast.
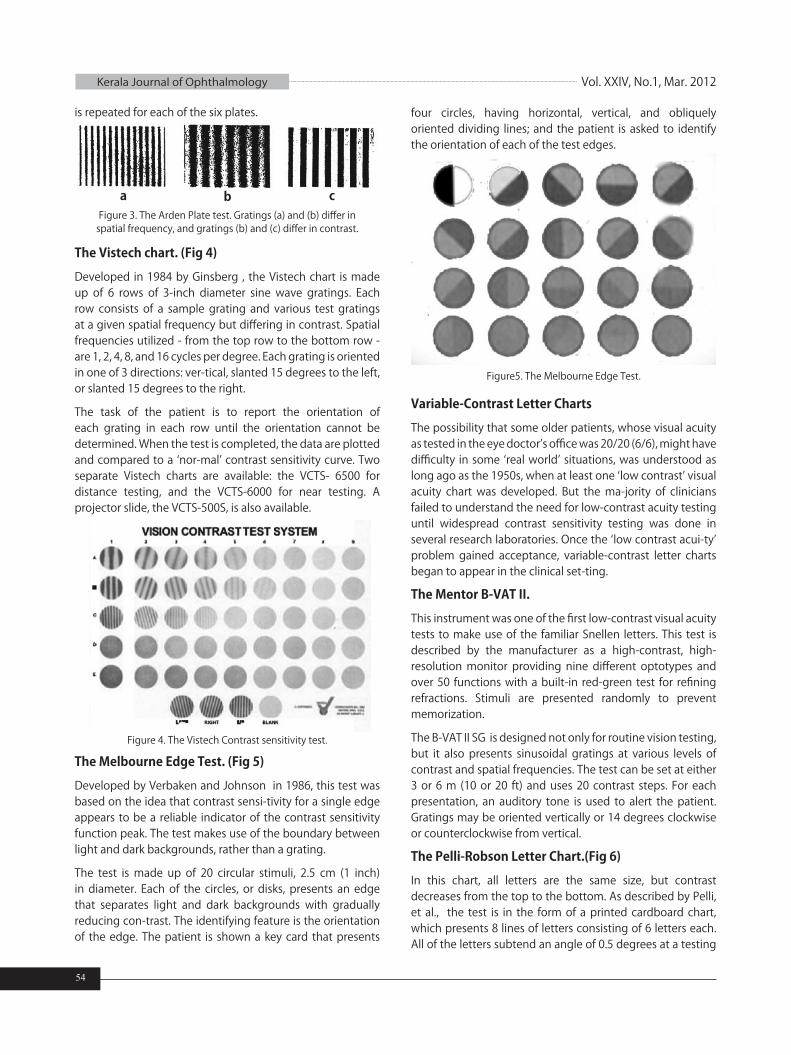
Figure5. The Melbourne Edge Test.
Figure 4. The Vistech Contrast sensitivity test.
The Melbourne Edge Test. (Fig 5)
Developed by Verbaken and Johnson in 1986, this test was based on the idea that contrast sensi-tivity for a single edge appears to be a reliable indicator of the contrast sensitivity function peak. The test makes use of the boundary between light and dark backgrounds, rather than a grating.
The test is made up of 20 circular stimuli, 2.5 cm (1 inch) in diameter. Each of the circles, or disks, presents an edge that separates light and dark backgrounds with gradually reducing con-trast. The identifying feature is the orientation of the edge. The patient is shown a key card that presents
four circles, having horizontal, vertical, and obliquely oriented dividing lines; and the patient is asked to identify the orientation of each of the test edges.
Variable-Contrast Letter Charts
The possibility that some older patients, whose visual acuity as tested in the eye doctor’s office was 20/20 (6/6), might have difficulty in some ‘real world’ situations, was understood as long ago as the 1950s, when at least one ‘low contrast’ visual acuity chart was developed. But the ma-jority of clinicians failed to understand the need for low-contrast acuity testing until widespread contrast sensitivity testing was done in several research laboratories. Once the ‘low contrast acui-ty’ problem gained acceptance, variable-contrast letter charts began to appear in the clinical set-ting.
The Mentor B-VAT II.
This instrument was one of the first low-contrast visual acuity tests to make use of the familiar Snellen letters. This test is described by the manufacturer as a high-contrast, high-resolution monitor providing nine different optotypes and over 50 functions with a built-in red-green test for refining refractions. Stimuli are presented randomly to prevent memorization.
The B-VAT II SG is designed not only for routine vision testing, but it also presents sinusoidal gratings at various levels of contrast and spatial frequencies. The test can be set at either 3 or 6 m (10 or 20 ft) and uses 20 contrast steps. For each presentation, an auditory tone is used to alert the patient. Gratings may be oriented vertically or 14 degrees clockwise or counterclockwise from vertical.
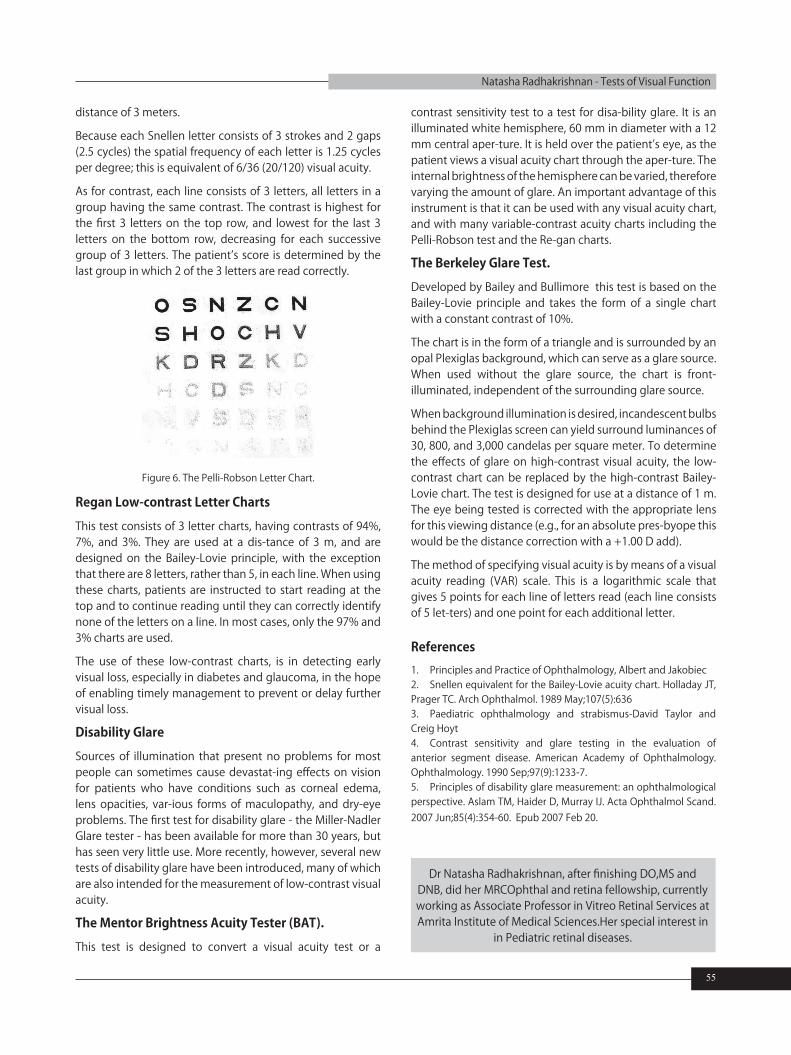
The Pelli-Robson Letter Chart.(Fig 6)
In this chart, all letters are the same size, but contrast decreases from the top to the bottom. As described by Pelli, et al., the test is in the form of a printed cardboard chart, which presents 8 lines of letters consisting of 6 letters each. All of the letters subtend an angle of 0.5 degrees at a testing
55
distance of 3 meters.
Because each Snellen letter consists of 3 strokes and 2 gaps (2.5 cycles) the spatial frequency of each letter is 1.25 cycles per degree; this is equivalent of 6/36 (20/120) visual acuity.
As for contrast, each line consists of 3 letters, all letters in a group having the same contrast. The contrast is highest for the first 3 letters on the top row, and lowest for the last 3 letters on the bottom row, decreasing for each successive group of 3 letters. The patient’s score is determined by the last group in which 2 of the 3 letters are read correctly.
Figure 6. The Pelli-Robson Letter Chart.
Regan Low-contrast Letter Charts
This test consists of 3 letter charts, having contrasts of 94%, 7%, and 3%. They are used at a dis-tance of 3 m, and are designed on the Bailey-Lovie principle, with the exception that there are 8 letters, rather than 5, in each line. When using these charts, patients are instructed to start reading at the top and to continue reading until they can correctly identify none of the letters on a line. In most cases, only the 97% and 3% charts are used.
The use of these low-contrast charts, is in detecting early visual loss, especially in diabetes and glaucoma, in the hope of enabling timely management to prevent or delay further visual loss.
Disability Glare
Sources of illumination that present no problems for most people can sometimes cause devastat-ing effects on vision for patients who have conditions such as corneal edema, lens opacities, var-ious forms of maculopathy, and dry-eye problems. The first test for disability glare - the Miller-Nadler Glare tester - has been available for more than 30 years, but has seen very little use. More recently, however, several new tests of disability glare have been introduced, many of which are also intended for the measurement of low-contrast visual acuity.
The Mentor Brightness Acuity Tester (BAT).
This test is designed to convert a visual acuity test or a
contrast sensitivity test to a test for disa-bility glare. It is an illuminated white hemisphere, 60 mm in diameter with a 12 mm central aper-ture. It is held over the patient’s eye, as the patient views a visual acuity chart through the aper-ture. The internal brightness of the hemisphere can be varied, therefore varying the amount of glare. An important advantage of this instrument is that it can be used with any visual acuity chart, and with many variable-contrast acuity charts including the Pelli-Robson test and the Re-gan charts.
The Berkeley Glare Test.
Developed by Bailey and Bullimore this test is based on the Bailey-Lovie principle and takes the form of a single chart with a constant contrast of 10%.
The chart is in the form of a triangle and is surrounded by an opal Plexiglas background, which can serve as a glare source. When used without the glare source, the chart is front-illuminated, independent of the surrounding glare source.
When background illumination is desired, incandescent bulbs behind the Plexiglas screen can yield surround luminances of 30, 800, and 3,000 candelas per square meter. To determine the effects of glare on high-contrast visual acuity, the low-contrast chart can be replaced by the high-contrast Bailey-Lovie chart. The test is designed for use at a distance of 1 m. The eye being tested is corrected with the appropriate lens for this viewing distance (e.g., for an absolute pres-byope this would be the distance correction with a +1.00 D add).
The method of specifying visual acuity is by means of a visual acuity reading (VAR) scale. This is a logarithmic scale that gives 5 points for each line of letters read (each line consists of 5 let-ters) and one point for each additional letter.
Natasha Radhakrishnan - Tests of Visual Function
References1. Principles and Practice of Ophthalmology, Albert and Jakobiec2. Snellen equivalent for the Bailey-Lovie acuity chart. Holladay JT, Prager TC. Arch Ophthalmol. 1989 May;107(5):6363. Paediatric ophthalmology and strabismus-David Taylor and Creig Hoyt4. Contrast sensitivity and glare testing in the evaluation of anterior segment disease. American Academy of Ophthalmology. Ophthalmology. 1990 Sep;97(9):1233-7.5. Principles of disability glare measurement: an ophthalmological perspective. Aslam TM, Haider D, Murray IJ. Acta Ophthalmol Scand. 2007 Jun;85(4):354-60. Epub 2007 Feb 20.
Dr Natasha Radhakrishnan, after finishing DO,MS and DNB, did her MRCOphthal and retina fellowship, currently working as Associate Professor in Vitreo Retinal Services at Amrita Institute of Medical Sciences.Her special interest in
in Pediatric retinal diseases.