Embed Size (px)
Citation preview
T E S T R E P O R T
Universal Bench – Regular
GAR Test R1234yf vs. R134aon PQ35 AC loop
SANDEN Technical Centre (Europe) GmbHAm Taubenbaum 35-37
61231 Bad NauheimGERMANY
LATEX
Project Number ..................... 0107 - 452
Responsible engineer ............. Christian Spiegel
Customer ............................... TCE engineering
Test period ............................ January / February 2008
Date ....................................... 15.02.2008
———————————— ————————————B. Zeitvogel, Test Manager Europe C. Spiegel, Test Engineer
ii
Setup Information
System:
VW Golf V (Loop PQ35)
Refrigerant:
R134aR1234yf
Compressor:
Type SANDEN, PXE16Model #0000S/N 6210807699
Evaporator:
only Evaporator (no HVAC)
System Charge:
R134a 618gR1234yf 610g
SP-10 110ml
iii
Contents
1 Objective of Tests 1
2 Test Constructions 1
3 Symbols, Units and Abbreviation 2
4 Sensor List 44.1 Refrigerant side . . . . . . . . . . . . . . . . . . . . . . . . . 44.2 Air Side . . . . . . . . . . . . . . . . . . . . . . . . . . . . . 5
5 Execution of tests 55.1 Charge Determination . . . . . . . . . . . . . . . . . . . . . . 65.2 Sensor verification test . . . . . . . . . . . . . . . . . . . . . 75.3 Test Condition . . . . . . . . . . . . . . . . . . . . . . . . . . 85.4 Test procedure . . . . . . . . . . . . . . . . . . . . . . . . . . 8
5.4.1 Test series I R134a . . . . . . . . . . . . . . . . . . . 85.4.2 Test series II R1234yf . . . . . . . . . . . . . . . . . . 85.4.3 Test series III R1234yf TXV . . . . . . . . . . . . . . 9
6 Results 9
7 Summary 17
A Fluiddata a
iv
List of Figures
2.1 AC–System Golf V Loop: PQ35 . . . . . . . . . . . . . . . . 14.1 AC–cycle with sensor position . . . . . . . . . . . . . . . . . 45.1 Charge determination R134a & R1234yf . . . . . . . . . . . . 65.2 Sensor verification test . . . . . . . . . . . . . . . . . . . . . 76.1 Air temperature evaporator outlet . . . . . . . . . . . . . . . 96.2 Cooling capacity air side . . . . . . . . . . . . . . . . . . . . 106.3 Cooling capacity refrigerant side . . . . . . . . . . . . . . . . 106.4 COP air side . . . . . . . . . . . . . . . . . . . . . . . . . . . 116.5 COP refrigerant side . . . . . . . . . . . . . . . . . . . . . . 116.6 Superheat evaporator out . . . . . . . . . . . . . . . . . . . . 126.7 Superheat compressor in . . . . . . . . . . . . . . . . . . . . 126.8 Subcooling TXV in . . . . . . . . . . . . . . . . . . . . . . . 136.9 Mechanical power compressor . . . . . . . . . . . . . . . . . . 136.10 Refrigerant massflow . . . . . . . . . . . . . . . . . . . . . . 146.11 Evaporation pressure . . . . . . . . . . . . . . . . . . . . . . 146.12 Discharge pressure . . . . . . . . . . . . . . . . . . . . . . . . 156.13 Delta pressure condenser . . . . . . . . . . . . . . . . . . . . 156.14 Condenser inlet temperature . . . . . . . . . . . . . . . . . . 166.15 Evaporator outlet temperature . . . . . . . . . . . . . . . . . 166.16 Body temperature . . . . . . . . . . . . . . . . . . . . . . . . 171.1 log p,h–Diagramm from R134a and R1234yf . . . . . . . . . . a1.2 log p,h–Diagramm from R134a . . . . . . . . . . . . . . . . . b
v
SANDEN Technical Centre (Europe) GmbH – Test DepartmentGAR Test R1234yf vs. R134aProject-Nr.: 0107–452 Name: C. Spiegel Date: 15.02.2008 1
1 Objective of Tests
Target is to compare the new “Global alternative refrigerant” (GAR) R1234yffrom DuPont and Honeywell with the actual refrigerant R134a.The comparison will be regarding a real “Drop-in”.
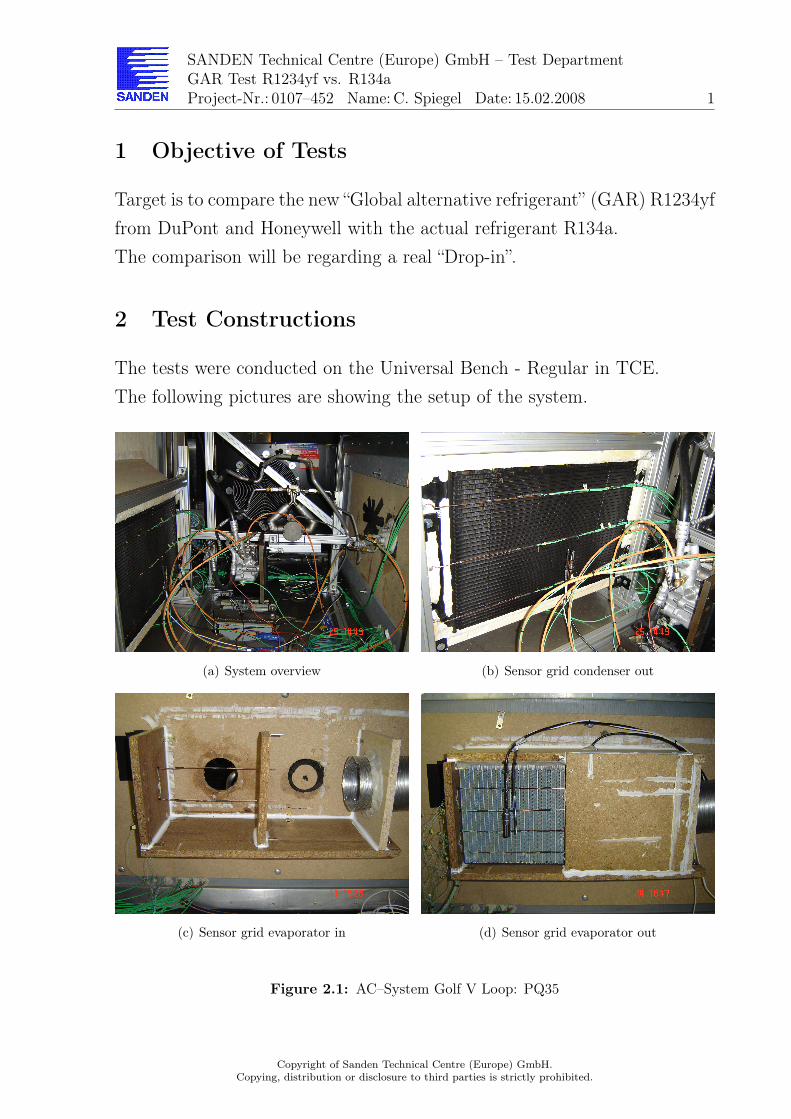
2 Test Constructions
The tests were conducted on the Universal Bench - Regular in TCE.The following pictures are showing the setup of the system.
(a) System overview (b) Sensor grid condenser out
(c) Sensor grid evaporator in (d) Sensor grid evaporator out
Figure 2.1: AC–System Golf V Loop: PQ35
Copyright of Sanden Technical Centre (Europe) GmbH.Copying, distribution or disclosure to third parties is strictly prohibited.
SANDEN Technical Centre (Europe) GmbH – Test DepartmentGAR Test R1234yf vs. R134aProject-Nr.: 0107–452 Name: C. Spiegel Date: 15.02.2008 2
3 Symbols, Units and Abbreviation
Note: All pressures are absolute pressures!
Symbol Unit Explanation
pV 1 bar Suction pressurepV 2 bar Discharge pressurepc1 bar Condenser inlet pressurepc2 bar Condenser outlet pressurepo1 bar Evaporator inlet pressurepo2 bar Evaporator outlet pressurepE1 bar Expansion valve inlet pressurepcc bar Crank case pressurepHX1 bar Internal HX inlet pressure high pressure sidepHX2 bar Internal HX outlet pressure high pressure sidepHX3 bar Internal HX inlet pressure low pressure sidepHX4 bar Internal HX outlet pressure low pressure side
tV 1◦C Saturated temperature based on pV1
tV 1h◦C Suction temperature
tV 2◦C Saturated temperature based on pV2
tV 2h◦C Discharge temperature
tc1◦C Saturated temperature based on pc1
tc1h◦C Condenser inlet temperature
tc2◦C Saturated temperature based on pc2
tc2u◦C Condenser outlet temperature
to1u◦C Evaporator inlet temperature
to2◦C Saturated temperature based on po2
to2h◦C Evaporator outlet temperature
tE1◦C Saturated temperature based on pE1
tE1u◦C Expansion valve inlet temperature
tcc◦C crank case temperature
tHX1u◦C Internal HX inlet temperature high pressure side
tHX2u◦C Internal HX outlet temperature high pressure side
tHX3h◦C Internal HX inlet temperature low pressure side
tHX4h◦C Internal HX outlet temperature low pressure side
Copyright of Sanden Technical Centre (Europe) GmbH.Copying, distribution or disclosure to third parties is strictly prohibited.
SANDEN Technical Centre (Europe) GmbH – Test DepartmentGAR Test R1234yf vs. R134aProject-Nr.: 0107–452 Name: C. Spiegel Date: 15.02.2008 3
ϕcL1 % r.H. Relative humidity condenser inletϕcL2 % r.H. Relative humidity condenser outletϕoL1 % r.H. Relative humidity evaporator inletϕoL2 % r.H. Relative humidity evaporator outlet
tcL1◦C Condenser inlet air temperature
tcL2◦C Condenser outlet air temperature
toL1◦C Evaporator inlet air temperature
toL2◦C Evaporator outlet air temperature
dtc1h K Superheat condenser inletdtc2u K Sub cooling condenser outletdtE1u K Sub cooling expansion valve inletdto2h K Superheat evaporator outletdtV 1h K Superheat compressor inletdtV 2h K Superheat compressor inletdpoL Pa Differential air pressure over HVAC
QoR W; kW Cooling capacity refrigerant sideQoL W; kW Cooling capacity air sideCOPR 1 COP refrigerant sideCOPL 1 COP air sidePV W; kW Power consumption compressorU0 V Voltage evaporator/HVAC blowerI0 A; mA Current evaporator/HVAC blowernV 1/min Compressor revolution speedMV Nm Compressor torque
mcL kg/h Mass flow air condensermoL kg/h Mass flow air evaporatormR kg/h Mass flow refrigerant
Abbreviation Explanation
COP Coefficient of performanceSC Sub coolingSH Super heatPWM Pulse width modulationHVAC Heating ventilation and air conditioning unit
Copyright of Sanden Technical Centre (Europe) GmbH.Copying, distribution or disclosure to third parties is strictly prohibited.
SANDEN Technical Centre (Europe) GmbH – Test DepartmentGAR Test R1234yf vs. R134aProject-Nr.: 0107–452 Name: C. Spiegel Date: 15.02.2008 4
4 Sensor List
All sensors and measurements according to TCE specification.
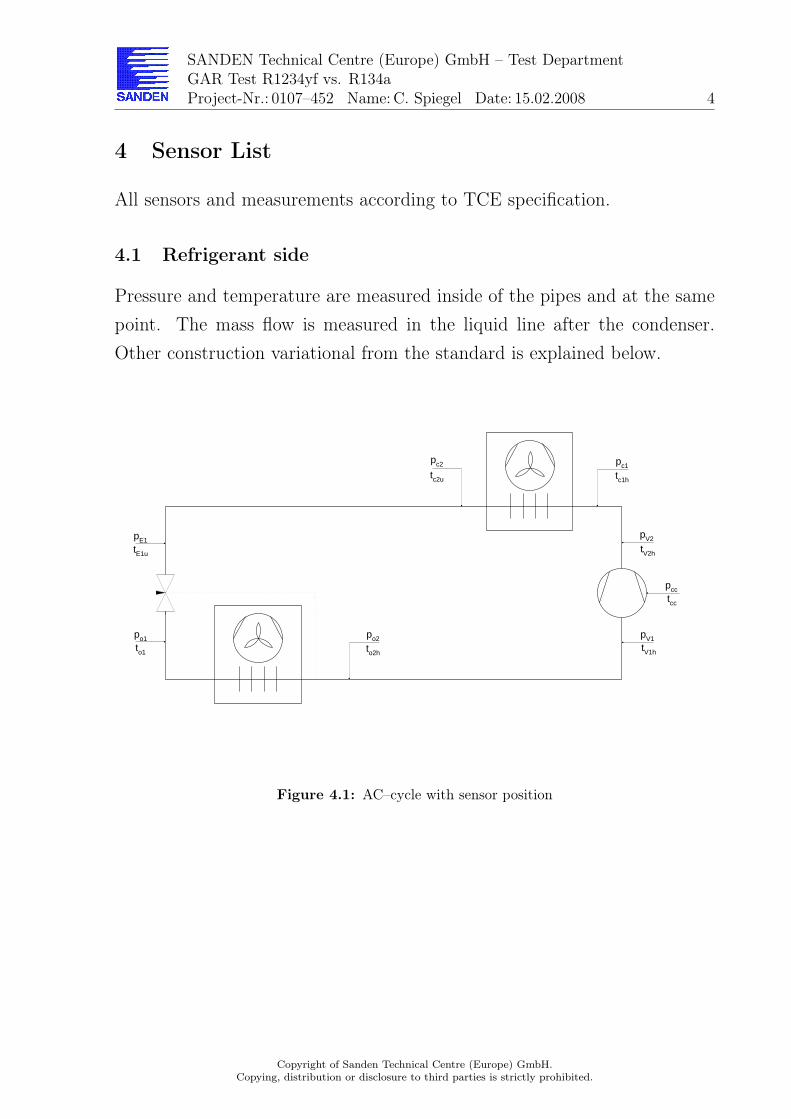
4.1 Refrigerant side
Pressure and temperature are measured inside of the pipes and at the samepoint. The mass flow is measured in the liquid line after the condenser.Other construction variational from the standard is explained below.
pV2
tV2h
pcc
pV1tV1h
pc1
tc1h
pc2
tc2u
pE1tE1u
po1to1
po2
to2h
tcc
Figure 4.1: AC–cycle with sensor position
Copyright of Sanden Technical Centre (Europe) GmbH.Copying, distribution or disclosure to third parties is strictly prohibited.
SANDEN Technical Centre (Europe) GmbH – Test DepartmentGAR Test R1234yf vs. R134aProject-Nr.: 0107–452 Name: C. Spiegel Date: 15.02.2008 5
This test set–up included the following sensors:
Compressor inlet: pressure & temperatureCompressor outlet: pressure & temperatureCondenser inlet: pressure & temperatureCondenser outlet: pressure & temperatureExpansion valve inlet: pressure & temperatureEvaporator outlet: pressure & temperature
4.2 Air Side
Air temperature measurement designed with thermocouple (TC) grids at theheat exchangers including one PT100 sensor. Humidity inlet and outlet ismeasured each with one sensor.
Condenser inlet: PT100Condenser outlet: PT100, 12×TCEvaporator inlet: PT100, 4×TCEvaporator outlet: PT100, 12×TC
5 Execution of tests
The tests have been conducted according to the following specifications.These conditions were used for the previous GAR tests, too.The data handling and interpretation is realized in MS Excel. The durationof the test is 30 minutes with constant conditions and the logging rate is 1Hz. The outcome of the average calculation is the result.Between the change from R134a to R1234yf the system was not flushed andthe oil was not changed. The first R1234yf test series were made as real“Drop-in” with no modification on hardware.
Copyright of Sanden Technical Centre (Europe) GmbH.Copying, distribution or disclosure to third parties is strictly prohibited.
SANDEN Technical Centre (Europe) GmbH – Test DepartmentGAR Test R1234yf vs. R134aProject-Nr.: 0107–452 Name: C. Spiegel Date: 15.02.2008 6
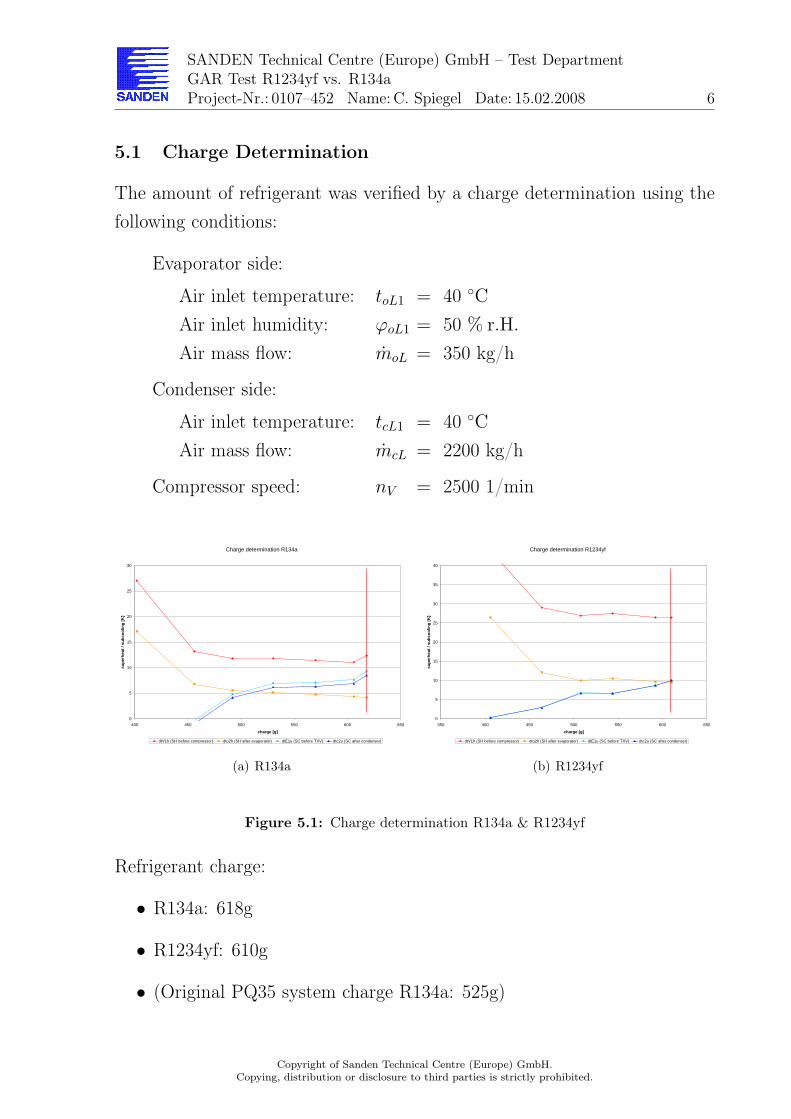
5.1 Charge Determination
The amount of refrigerant was verified by a charge determination using thefollowing conditions:
Evaporator side:
Air inlet temperature: toL1 = 40 ◦C
Air inlet humidity: ϕoL1 = 50 % r.H.
Air mass flow: moL = 350 kg/h
Condenser side:
Air inlet temperature: tcL1 = 40 ◦C
Air mass flow: mcL = 2200 kg/h
Compressor speed: nV = 2500 1/min
Charge determination R134a
0
5
10
15
20
25
30
400 450 500 550 600 650
charge [g]
sup
erh
eat
/ su
bco
olin
g [
K]
dtV1h (SH before compressor) dto2h (SH after evaporator) dtE1u (SC before TXV) dtc2u (SC after condenser)
(a) R134a
Charge determination R1234yf
0
5
10
15
20
25
30
35
40
350 400 450 500 550 600 650
charge [g]
sup
erh
eat
/ su
bco
olin
g [
K]
dtV1h (SH before compressor) dto2h (SH after evaporator) dtE1u (SC before TXV) dtc2u (SC after condenser)
(b) R1234yf
Figure 5.1: Charge determination R134a & R1234yf
Refrigerant charge:
• R134a: 618g
• R1234yf: 610g
• (Original PQ35 system charge R134a: 525g)
Copyright of Sanden Technical Centre (Europe) GmbH.Copying, distribution or disclosure to third parties is strictly prohibited.
SANDEN Technical Centre (Europe) GmbH – Test DepartmentGAR Test R1234yf vs. R134aProject-Nr.: 0107–452 Name: C. Spiegel Date: 15.02.2008 7
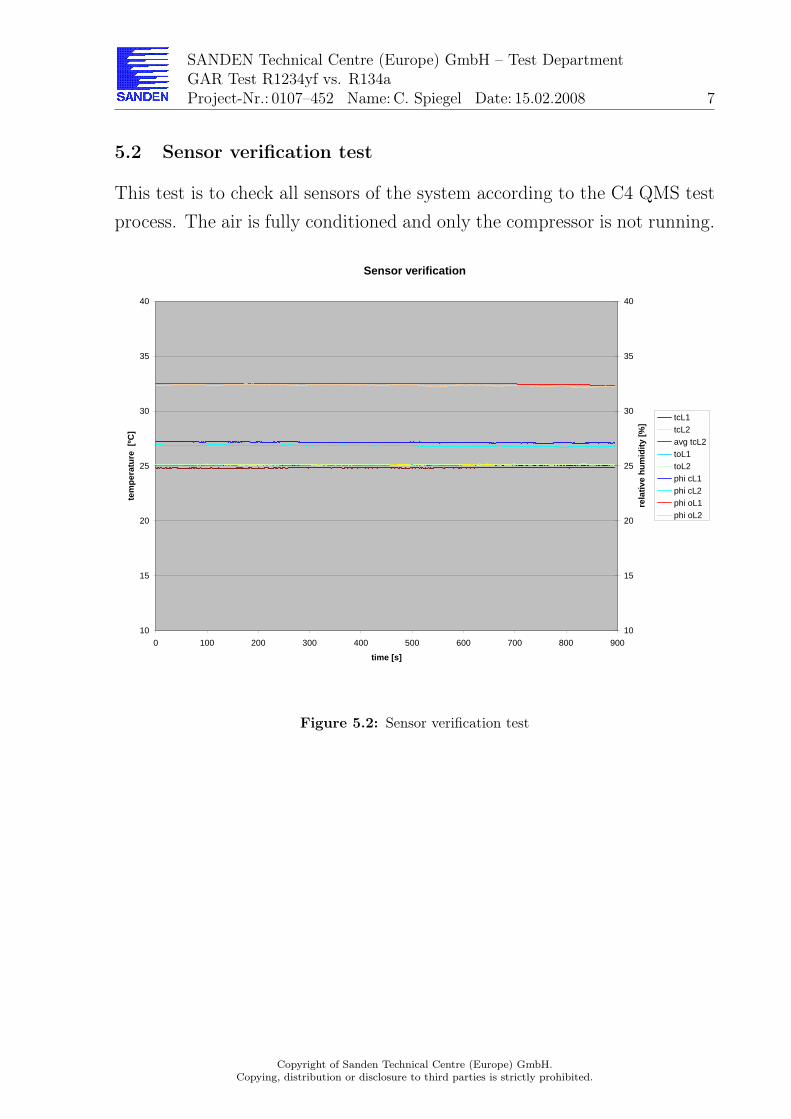
5.2 Sensor verification test
This test is to check all sensors of the system according to the C4 QMS testprocess. The air is fully conditioned and only the compressor is not running.
Sensor verification
10
15
20
25
30
35
40
0 100 200 300 400 500 600 700 800 900
time [s]
tem
pera
ture
[ºC
]
10
15
20
25
30
35
40
rela
tive
hum
idity
[%]
tcL1tcL2avg tcL2toL1toL2phi cL1phi cL2phi oL1phi oL2
Figure 5.2: Sensor verification test
Copyright of Sanden Technical Centre (Europe) GmbH.Copying, distribution or disclosure to third parties is strictly prohibited.
SANDEN Technical Centre (Europe) GmbH – Test DepartmentGAR Test R1234yf vs. R134aProject-Nr.: 0107–452 Name: C. Spiegel Date: 15.02.2008 8
5.3 Test Condition
Test nV mcL tcL1 moL toL1 ϕoL1 toL2 (target)
No. 1/min kg/h ◦C kg/h ◦C % r.H. ◦C
1.1 800 750 25 175 25 50 8,01.2 1500 1200 25 175 25 50 8,01.3 2500 2200 25 175 25 50 8,02.1 800 750 25 350 25 50 8,02.2 1500 1200 25 350 25 50 8,02.3 2500 2200 25 350 25 50 8,03.1 800 750 40 175 25 50 8,03.2 1500 1200 40 175 25 50 8,03.3 2500 2200 40 175 25 50 8,04.1 800 750 40 350 40 50 min4.2 1500 1200 40 350 40 50 min4.3 2500 2200 40 350 40 50 min
5.4 Test procedure
Target for all tests was to reach 8 ◦C evaporator air outlet temperature (toL2).This was reached by setting the PWM-signal of the ECV. To avoid the slip-stick effect of the wobble plate, which occurred by small angle changes, thePWM-signal was interrupted for a second.
5.4.1 Test series I R134a
This test series is used as a base line for comparison.
5.4.2 Test series II R1234yf
This test series is demonstrating a real “Drop-in” R1234yf.
Copyright of Sanden Technical Centre (Europe) GmbH.Copying, distribution or disclosure to third parties is strictly prohibited.
SANDEN Technical Centre (Europe) GmbH – Test DepartmentGAR Test R1234yf vs. R134aProject-Nr.: 0107–452 Name: C. Spiegel Date: 15.02.2008 9
5.4.3 Test series III R1234yf TXV
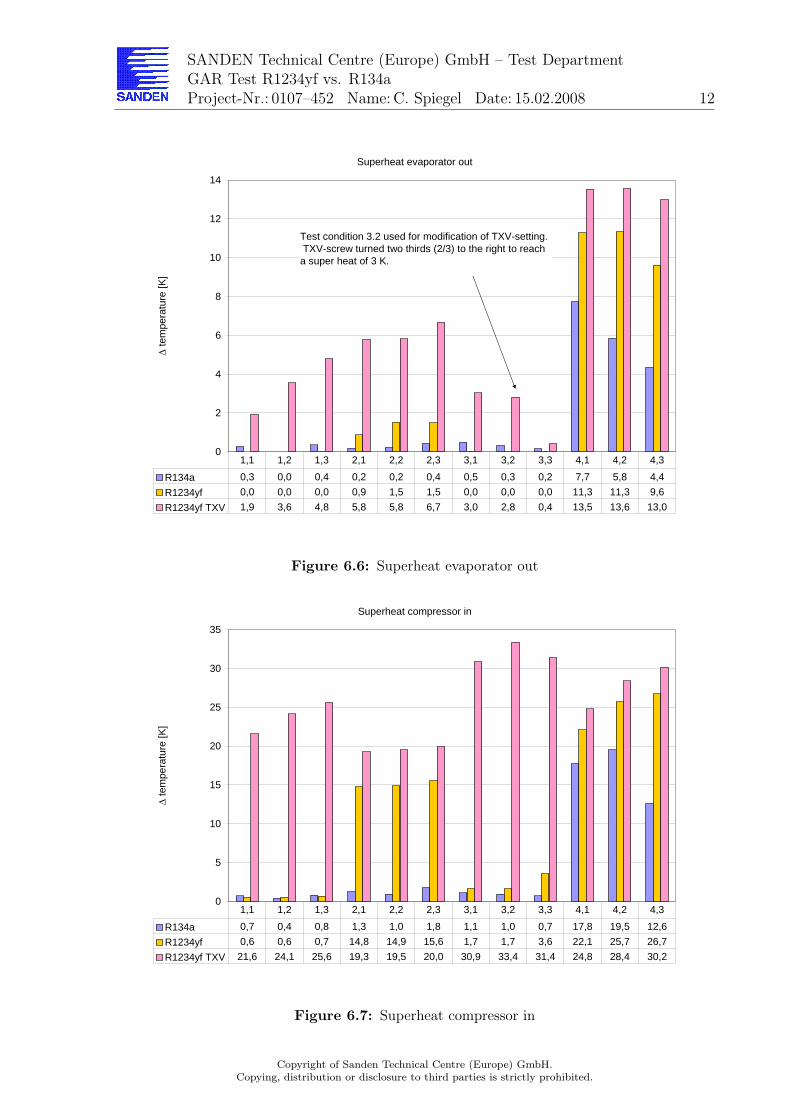
For the third test series the TXV setting was changed. The screw of theTXV was turned two thirds to the right to reach 3 K superheat evaporatoroutlet at test condition 3.2.
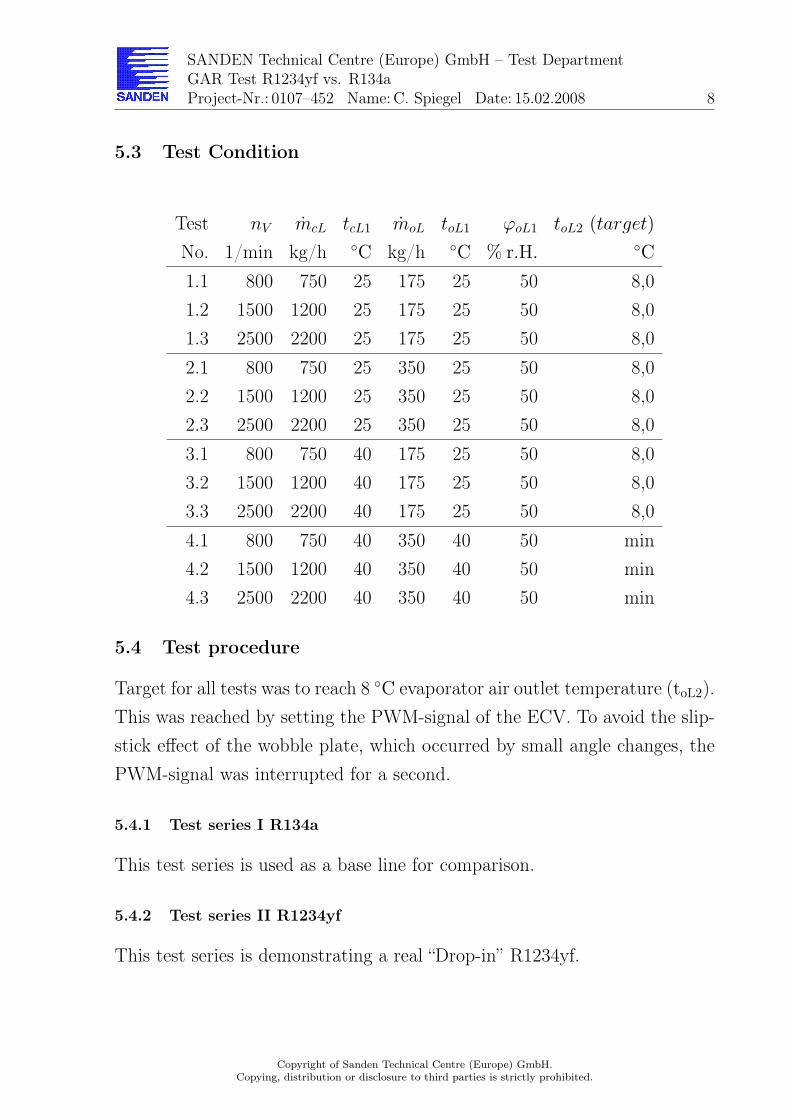
6 Results
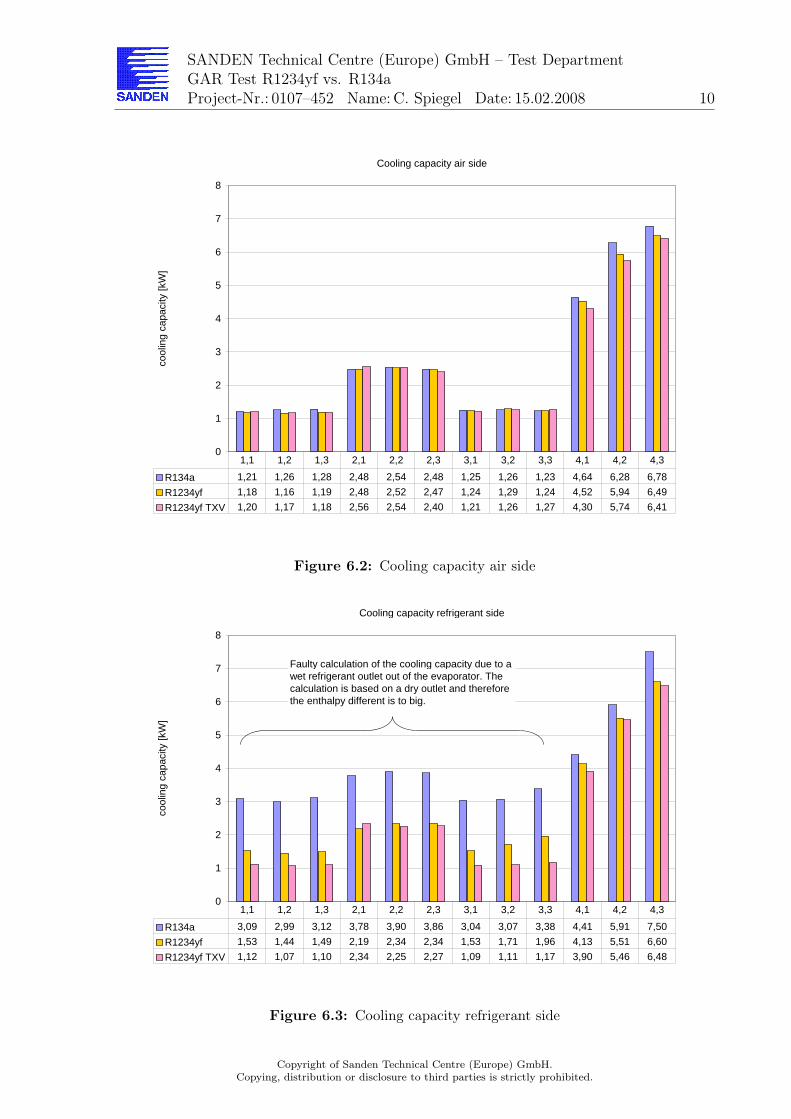
The results are showing a big deviation between cooling capacity calculatedover refrigerant side (QoR) and air side (QoL). Herefrom is the deviation inCOP large, too. This applies to the tests with part load (1.1 – 3.3). Thecause is a wet outlet out of the evaporator. The calculation is based on a dryoutlet. Hence, the enthalpy difference is bigger. In the tests with high load(4.1 – 4.3) the difference between QoR and QoL is small. For a comparisonof the cooling capacity the air side has to be used.
Air temperature evaporator outlet
0
2
4
6
8
10
12
14
16
18
20
22
tem
pera
ture
[ºC
]
R134a 8,2 7,8 7,7 8,0 7,7 8,0 7,9 7,6 7,9 18,6 12,6 10,6
R1234yf 8,4 8,5 8,4 7,9 7,8 8,1 8,0 7,6 7,9 19,1 14,2 11,9
R1234yf TXV 8,0 8,5 8,3 7,6 7,7 8,2 8,1 7,9 7,9 20,1 15,0 12,4
1,1 1,2 1,3 2,1 2,2 2,3 3,1 3,2 3,3 4,1 4,2 4,3
Figure 6.1: Air temperature evaporator outlet
Copyright of Sanden Technical Centre (Europe) GmbH.Copying, distribution or disclosure to third parties is strictly prohibited.
SANDEN Technical Centre (Europe) GmbH – Test DepartmentGAR Test R1234yf vs. R134aProject-Nr.: 0107–452 Name: C. Spiegel Date: 15.02.2008 10
Cooling capacity air side
0
1
2
3
4
5
6
7
8
cool
ing
capa
city
[kW
]
R134a 1,21 1,26 1,28 2,48 2,54 2,48 1,25 1,26 1,23 4,64 6,28 6,78
R1234yf 1,18 1,16 1,19 2,48 2,52 2,47 1,24 1,29 1,24 4,52 5,94 6,49
R1234yf TXV 1,20 1,17 1,18 2,56 2,54 2,40 1,21 1,26 1,27 4,30 5,74 6,41
1,1 1,2 1,3 2,1 2,2 2,3 3,1 3,2 3,3 4,1 4,2 4,3
Figure 6.2: Cooling capacity air side
Cooling capacity refrigerant side
0
1
2
3
4
5
6
7
8
cool
ing
capa
city
[kW
]
R134a 3,09 2,99 3,12 3,78 3,90 3,86 3,04 3,07 3,38 4,41 5,91 7,50
R1234yf 1,53 1,44 1,49 2,19 2,34 2,34 1,53 1,71 1,96 4,13 5,51 6,60
R1234yf TXV 1,12 1,07 1,10 2,34 2,25 2,27 1,09 1,11 1,17 3,90 5,46 6,48
1,1 1,2 1,3 2,1 2,2 2,3 3,1 3,2 3,3 4,1 4,2 4,3
Faulty calculation of the cooling capacity due to a wet refrigerant outlet out of the evaporator. The calculation is based on a dry outlet and therefore the enthalpy different is to big.
Figure 6.3: Cooling capacity refrigerant side
Copyright of Sanden Technical Centre (Europe) GmbH.Copying, distribution or disclosure to third parties is strictly prohibited.
SANDEN Technical Centre (Europe) GmbH – Test DepartmentGAR Test R1234yf vs. R134aProject-Nr.: 0107–452 Name: C. Spiegel Date: 15.02.2008 11
COP air side
0
1
2
3
4
5
CO
P [1
]
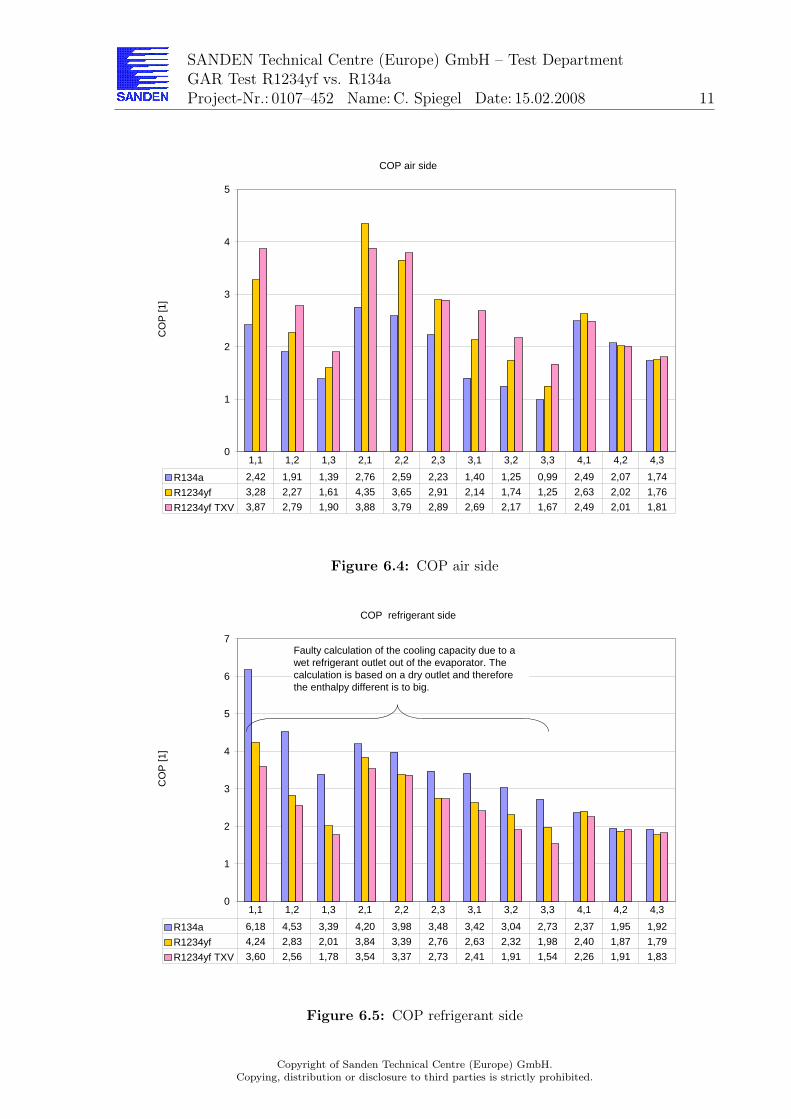
R134a 2,42 1,91 1,39 2,76 2,59 2,23 1,40 1,25 0,99 2,49 2,07 1,74
R1234yf 3,28 2,27 1,61 4,35 3,65 2,91 2,14 1,74 1,25 2,63 2,02 1,76
R1234yf TXV 3,87 2,79 1,90 3,88 3,79 2,89 2,69 2,17 1,67 2,49 2,01 1,81
1,1 1,2 1,3 2,1 2,2 2,3 3,1 3,2 3,3 4,1 4,2 4,3
Figure 6.4: COP air side
COP refrigerant side
0
1
2
3
4
5
6
7
CO
P [1
]
R134a 6,18 4,53 3,39 4,20 3,98 3,48 3,42 3,04 2,73 2,37 1,95 1,92
R1234yf 4,24 2,83 2,01 3,84 3,39 2,76 2,63 2,32 1,98 2,40 1,87 1,79
R1234yf TXV 3,60 2,56 1,78 3,54 3,37 2,73 2,41 1,91 1,54 2,26 1,91 1,83
1,1 1,2 1,3 2,1 2,2 2,3 3,1 3,2 3,3 4,1 4,2 4,3
Faulty calculation of the cooling capacity due to a wet refrigerant outlet out of the evaporator. The calculation is based on a dry outlet and therefore the enthalpy different is to big.
Figure 6.5: COP refrigerant side
Copyright of Sanden Technical Centre (Europe) GmbH.Copying, distribution or disclosure to third parties is strictly prohibited.
SANDEN Technical Centre (Europe) GmbH – Test DepartmentGAR Test R1234yf vs. R134aProject-Nr.: 0107–452 Name: C. Spiegel Date: 15.02.2008 12
Superheat evaporator out
0
2
4
6
8
10
12
14
∆ te
mpe
ratu
re [K
]
R134a 0,3 0,0 0,4 0,2 0,2 0,4 0,5 0,3 0,2 7,7 5,8 4,4
R1234yf 0,0 0,0 0,0 0,9 1,5 1,5 0,0 0,0 0,0 11,3 11,3 9,6
R1234yf TXV 1,9 3,6 4,8 5,8 5,8 6,7 3,0 2,8 0,4 13,5 13,6 13,0
1,1 1,2 1,3 2,1 2,2 2,3 3,1 3,2 3,3 4,1 4,2 4,3
Test condition 3.2 used for modification of TXV-setting. TXV-screw turned two thirds (2/3) to the right to reach a super heat of 3 K.
Figure 6.6: Superheat evaporator out
Superheat compressor in
0
5
10
15
20
25
30
35
∆ te
mpe
ratu
re [K
]
R134a 0,7 0,4 0,8 1,3 1,0 1,8 1,1 1,0 0,7 17,8 19,5 12,6
R1234yf 0,6 0,6 0,7 14,8 14,9 15,6 1,7 1,7 3,6 22,1 25,7 26,7
R1234yf TXV 21,6 24,1 25,6 19,3 19,5 20,0 30,9 33,4 31,4 24,8 28,4 30,2
1,1 1,2 1,3 2,1 2,2 2,3 3,1 3,2 3,3 4,1 4,2 4,3
Figure 6.7: Superheat compressor in
Copyright of Sanden Technical Centre (Europe) GmbH.Copying, distribution or disclosure to third parties is strictly prohibited.
SANDEN Technical Centre (Europe) GmbH – Test DepartmentGAR Test R1234yf vs. R134aProject-Nr.: 0107–452 Name: C. Spiegel Date: 15.02.2008 13
Subcooling TXV in
0
2
4
6
8
10
12
∆ te
mpe
ratu
re [K
]
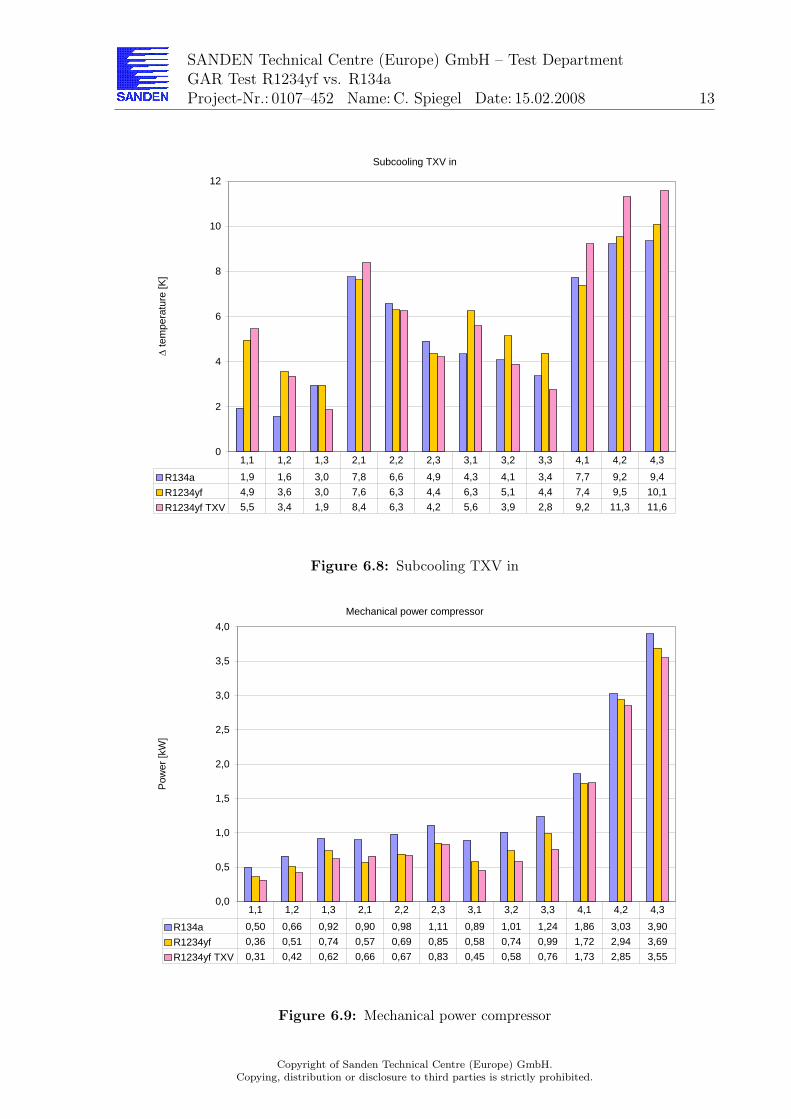
R134a 1,9 1,6 3,0 7,8 6,6 4,9 4,3 4,1 3,4 7,7 9,2 9,4
R1234yf 4,9 3,6 3,0 7,6 6,3 4,4 6,3 5,1 4,4 7,4 9,5 10,1
R1234yf TXV 5,5 3,4 1,9 8,4 6,3 4,2 5,6 3,9 2,8 9,2 11,3 11,6
1,1 1,2 1,3 2,1 2,2 2,3 3,1 3,2 3,3 4,1 4,2 4,3
Figure 6.8: Subcooling TXV in
Mechanical power compressor
0,0
0,5
1,0
1,5
2,0
2,5
3,0
3,5
4,0
Pow
er [k
W]
R134a 0,50 0,66 0,92 0,90 0,98 1,11 0,89 1,01 1,24 1,86 3,03 3,90
R1234yf 0,36 0,51 0,74 0,57 0,69 0,85 0,58 0,74 0,99 1,72 2,94 3,69
R1234yf TXV 0,31 0,42 0,62 0,66 0,67 0,83 0,45 0,58 0,76 1,73 2,85 3,55
1,1 1,2 1,3 2,1 2,2 2,3 3,1 3,2 3,3 4,1 4,2 4,3
Figure 6.9: Mechanical power compressor
Copyright of Sanden Technical Centre (Europe) GmbH.Copying, distribution or disclosure to third parties is strictly prohibited.
SANDEN Technical Centre (Europe) GmbH – Test DepartmentGAR Test R1234yf vs. R134aProject-Nr.: 0107–452 Name: C. Spiegel Date: 15.02.2008 14
Refrigerant massflow
0
50
100
150
200
250
mas
sflo
w [k
g/h]
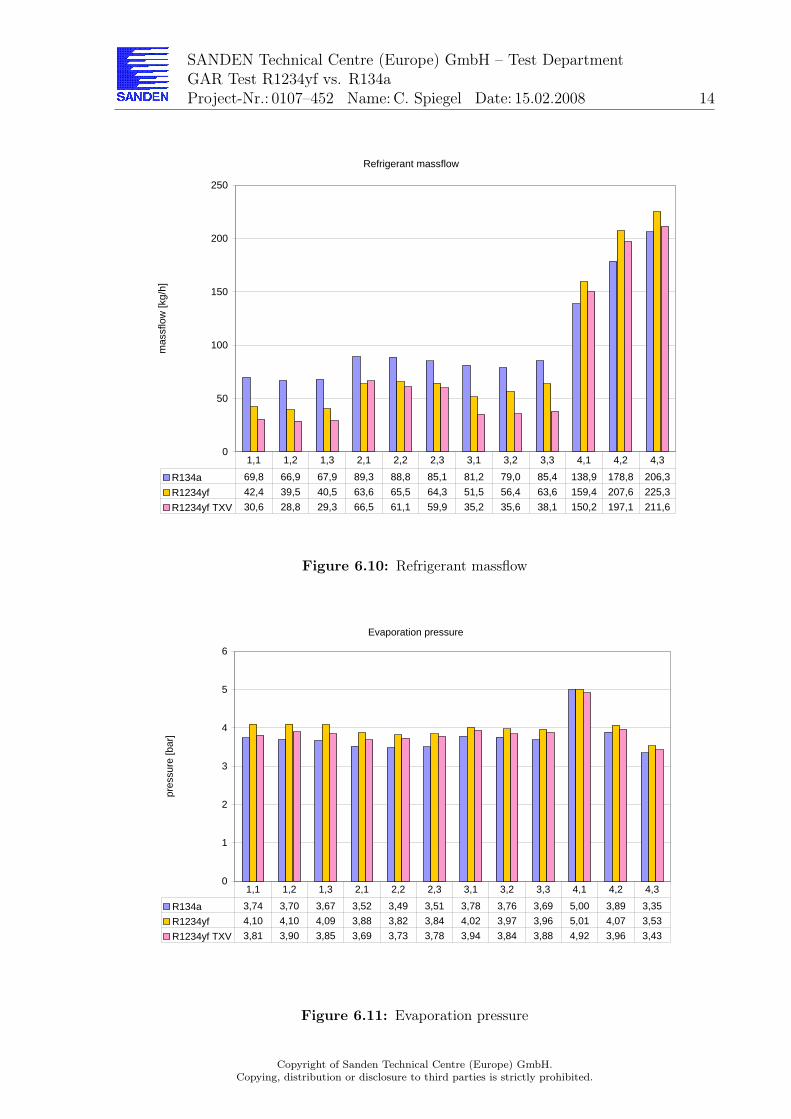
R134a 69,8 66,9 67,9 89,3 88,8 85,1 81,2 79,0 85,4 138,9 178,8 206,3
R1234yf 42,4 39,5 40,5 63,6 65,5 64,3 51,5 56,4 63,6 159,4 207,6 225,3
R1234yf TXV 30,6 28,8 29,3 66,5 61,1 59,9 35,2 35,6 38,1 150,2 197,1 211,6
1,1 1,2 1,3 2,1 2,2 2,3 3,1 3,2 3,3 4,1 4,2 4,3
Figure 6.10: Refrigerant massflow
Evaporation pressure
0
1
2
3
4
5
6
pres
sure
[bar
]
R134a 3,74 3,70 3,67 3,52 3,49 3,51 3,78 3,76 3,69 5,00 3,89 3,35
R1234yf 4,10 4,10 4,09 3,88 3,82 3,84 4,02 3,97 3,96 5,01 4,07 3,53
R1234yf TXV 3,81 3,90 3,85 3,69 3,73 3,78 3,94 3,84 3,88 4,92 3,96 3,43
1,1 1,2 1,3 2,1 2,2 2,3 3,1 3,2 3,3 4,1 4,2 4,3
Figure 6.11: Evaporation pressure
Copyright of Sanden Technical Centre (Europe) GmbH.Copying, distribution or disclosure to third parties is strictly prohibited.
SANDEN Technical Centre (Europe) GmbH – Test DepartmentGAR Test R1234yf vs. R134aProject-Nr.: 0107–452 Name: C. Spiegel Date: 15.02.2008 15
Discharge pressure
0
5
10
15
20
25
pres
sure
[bar
]
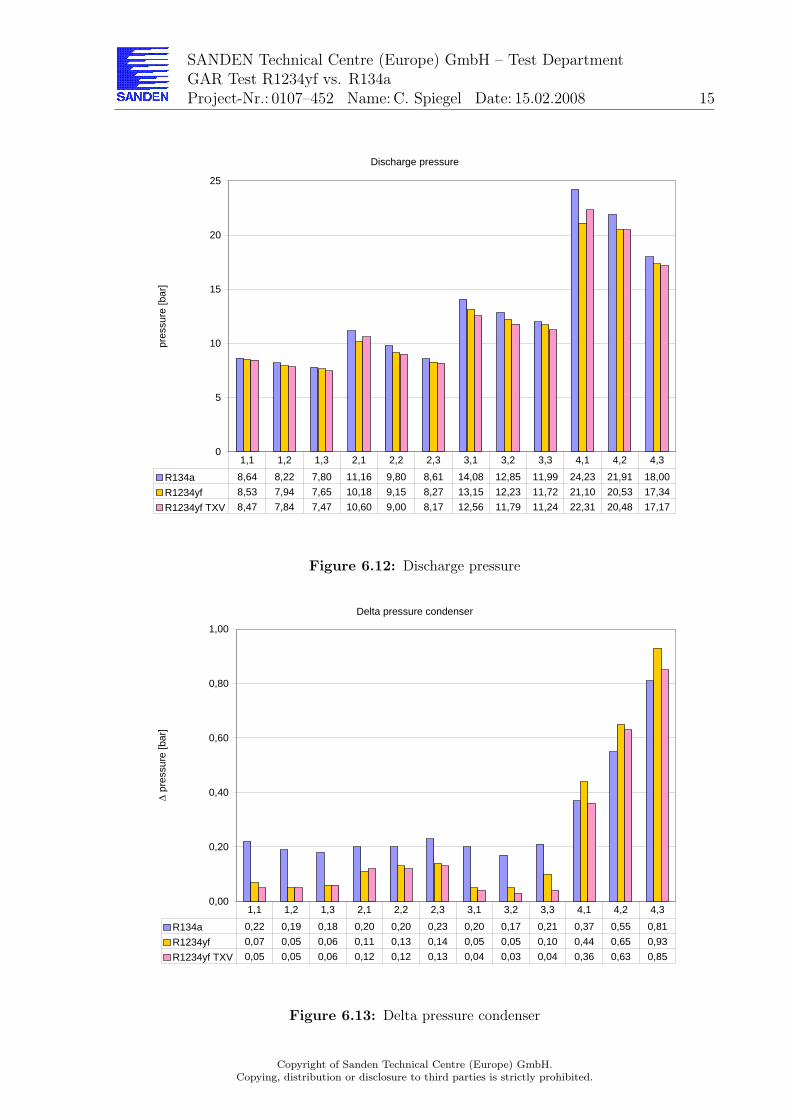
R134a 8,64 8,22 7,80 11,16 9,80 8,61 14,08 12,85 11,99 24,23 21,91 18,00
R1234yf 8,53 7,94 7,65 10,18 9,15 8,27 13,15 12,23 11,72 21,10 20,53 17,34
R1234yf TXV 8,47 7,84 7,47 10,60 9,00 8,17 12,56 11,79 11,24 22,31 20,48 17,17
1,1 1,2 1,3 2,1 2,2 2,3 3,1 3,2 3,3 4,1 4,2 4,3
Figure 6.12: Discharge pressure
Delta pressure condenser
0,00
0,20
0,40
0,60
0,80
1,00
∆ p
ress
ure
[bar
]
R134a 0,22 0,19 0,18 0,20 0,20 0,23 0,20 0,17 0,21 0,37 0,55 0,81
R1234yf 0,07 0,05 0,06 0,11 0,13 0,14 0,05 0,05 0,10 0,44 0,65 0,93
R1234yf TXV 0,05 0,05 0,06 0,12 0,12 0,13 0,04 0,03 0,04 0,36 0,63 0,85
1,1 1,2 1,3 2,1 2,2 2,3 3,1 3,2 3,3 4,1 4,2 4,3
Figure 6.13: Delta pressure condenser
Copyright of Sanden Technical Centre (Europe) GmbH.Copying, distribution or disclosure to third parties is strictly prohibited.
SANDEN Technical Centre (Europe) GmbH – Test DepartmentGAR Test R1234yf vs. R134aProject-Nr.: 0107–452 Name: C. Spiegel Date: 15.02.2008 16
Refrigerant temperature condenser inlet
0
20
40
60
80
100
tem
pera
ture
[ºC
]
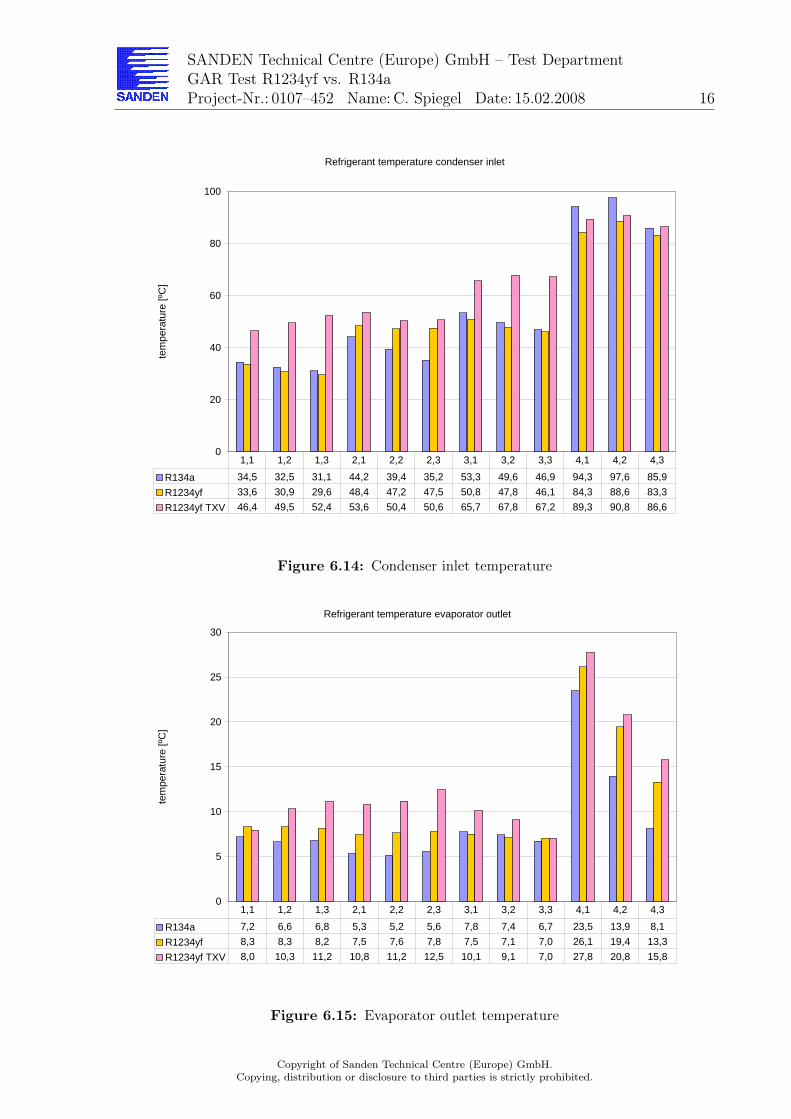
R134a 34,5 32,5 31,1 44,2 39,4 35,2 53,3 49,6 46,9 94,3 97,6 85,9
R1234yf 33,6 30,9 29,6 48,4 47,2 47,5 50,8 47,8 46,1 84,3 88,6 83,3
R1234yf TXV 46,4 49,5 52,4 53,6 50,4 50,6 65,7 67,8 67,2 89,3 90,8 86,6
1,1 1,2 1,3 2,1 2,2 2,3 3,1 3,2 3,3 4,1 4,2 4,3
Figure 6.14: Condenser inlet temperature
Refrigerant temperature evaporator outlet
0
5
10
15
20
25
30
tem
pera
ture
[ºC
]
R134a 7,2 6,6 6,8 5,3 5,2 5,6 7,8 7,4 6,7 23,5 13,9 8,1
R1234yf 8,3 8,3 8,2 7,5 7,6 7,8 7,5 7,1 7,0 26,1 19,4 13,3
R1234yf TXV 8,0 10,3 11,2 10,8 11,2 12,5 10,1 9,1 7,0 27,8 20,8 15,8
1,1 1,2 1,3 2,1 2,2 2,3 3,1 3,2 3,3 4,1 4,2 4,3
Figure 6.15: Evaporator outlet temperature
Copyright of Sanden Technical Centre (Europe) GmbH.Copying, distribution or disclosure to third parties is strictly prohibited.
SANDEN Technical Centre (Europe) GmbH – Test DepartmentGAR Test R1234yf vs. R134aProject-Nr.: 0107–452 Name: C. Spiegel Date: 15.02.2008 17
Body temperature
0
20
40
60
80
100
tem
pera
ture
[ºC
]
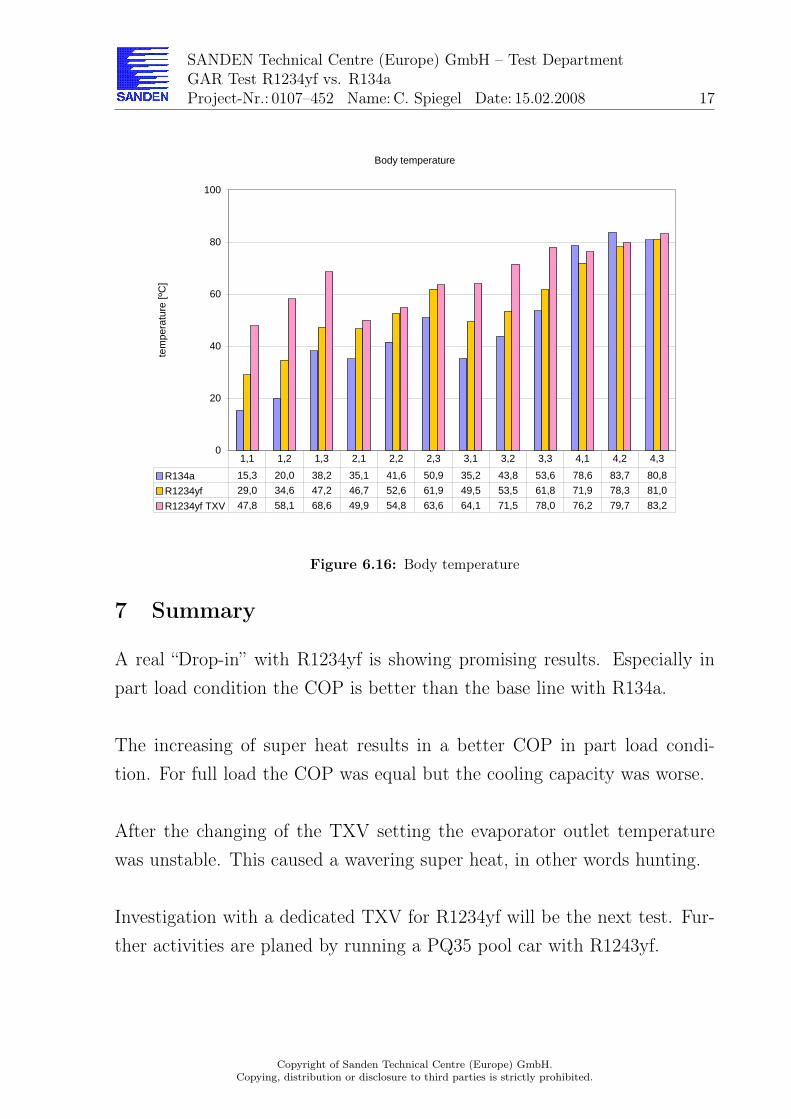
R134a 15,3 20,0 38,2 35,1 41,6 50,9 35,2 43,8 53,6 78,6 83,7 80,8
R1234yf 29,0 34,6 47,2 46,7 52,6 61,9 49,5 53,5 61,8 71,9 78,3 81,0
R1234yf TXV 47,8 58,1 68,6 49,9 54,8 63,6 64,1 71,5 78,0 76,2 79,7 83,2
1,1 1,2 1,3 2,1 2,2 2,3 3,1 3,2 3,3 4,1 4,2 4,3
Figure 6.16: Body temperature
7 Summary
A real “Drop-in” with R1234yf is showing promising results. Especially inpart load condition the COP is better than the base line with R134a.
The increasing of super heat results in a better COP in part load condi-tion. For full load the COP was equal but the cooling capacity was worse.
After the changing of the TXV setting the evaporator outlet temperaturewas unstable. This caused a wavering super heat, in other words hunting.
Investigation with a dedicated TXV for R1234yf will be the next test. Fur-ther activities are planed by running a PQ35 pool car with R1243yf.
Copyright of Sanden Technical Centre (Europe) GmbH.Copying, distribution or disclosure to third parties is strictly prohibited.
SANDEN Technical Centre (Europe) GmbH – Test DepartmentGAR Test R1234yf vs. R134aProject-Nr.: 0107–452 Name: C. Spiegel Date: 15.02.2008 a
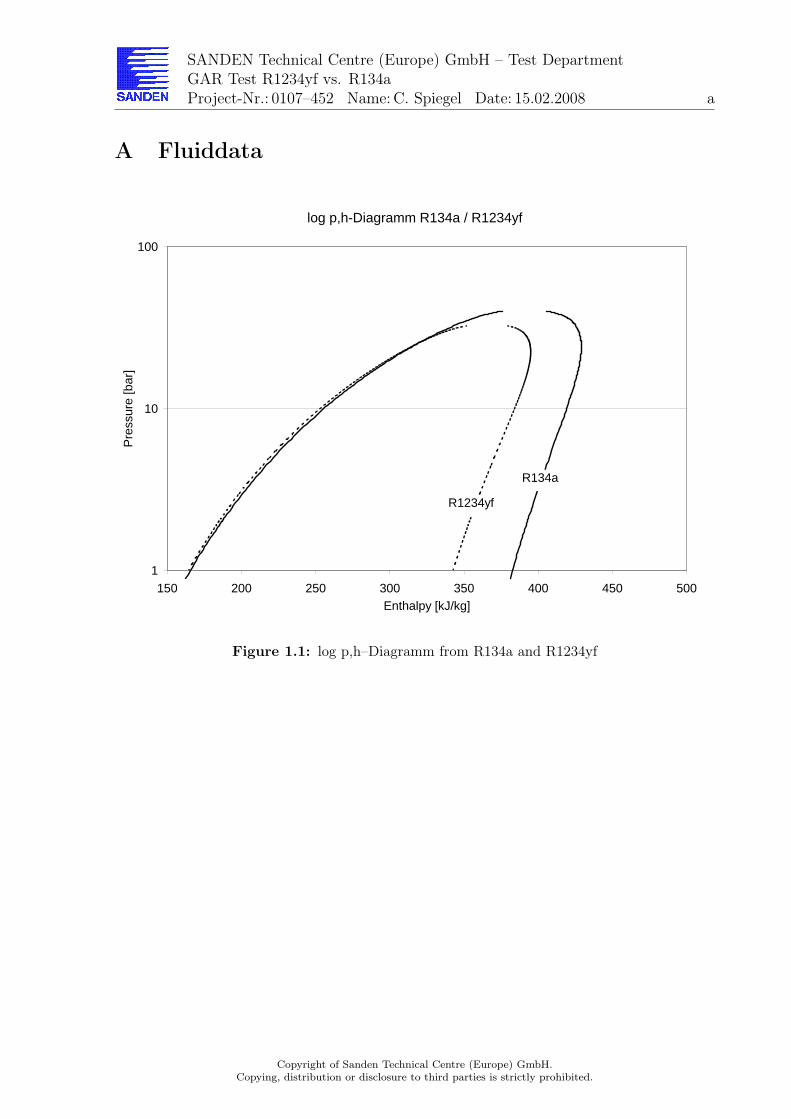
A Fluiddata
log p,h-Diagramm R134a / R1234yf
1
10
100
150 200 250 300 350 400 450 500Enthalpy [kJ/kg]
Pre
ssur
e [b
ar]
R1234yf
R134a
Figure 1.1: log p,h–Diagramm from R134a and R1234yf
Copyright of Sanden Technical Centre (Europe) GmbH.Copying, distribution or disclosure to third parties is strictly prohibited.
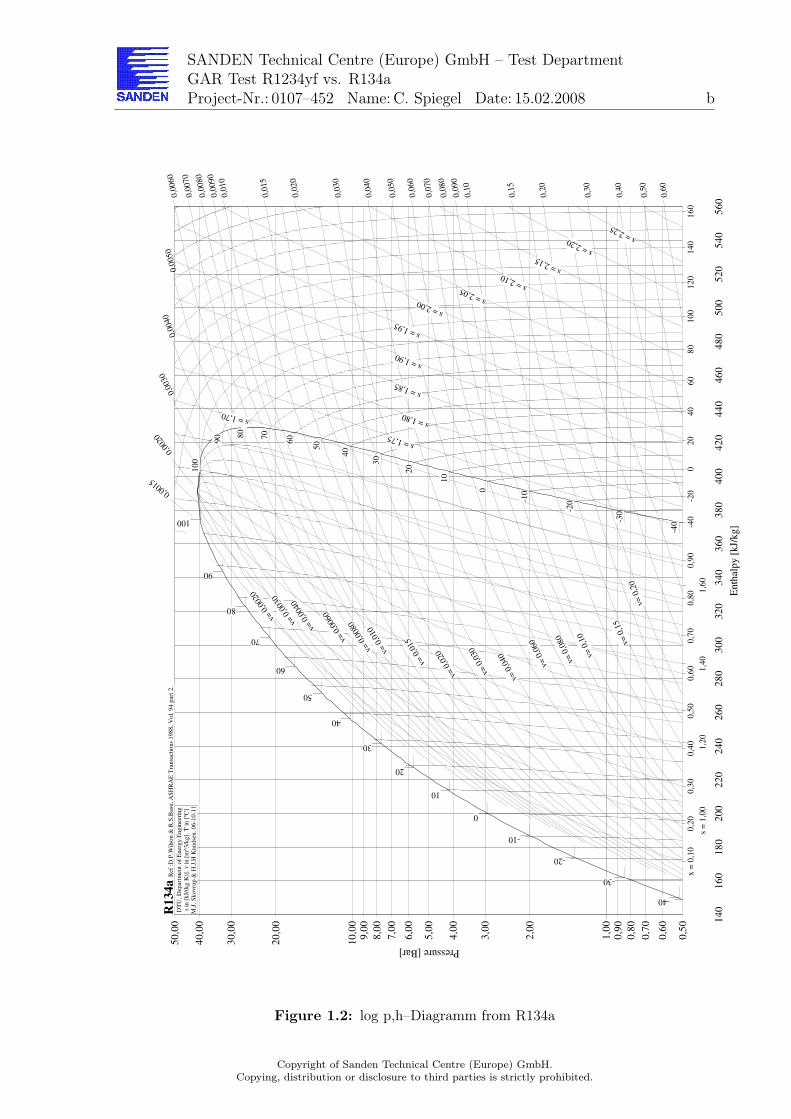
SANDEN Technical Centre (Europe) GmbH – Test DepartmentGAR Test R1234yf vs. R134aProject-Nr.: 0107–452 Name: C. Spiegel Date: 15.02.2008 b
Enth
alp
y [
kJ/
kg]
14
01
60
18
02
00
22
02
40
26
02
80
30
03
20
34
03
60
38
04
00
42
04
40
46
04
80
50
05
20
54
05
60
Pressure [Bar]
0,5
0
0,6
0
0,7
0
0,8
0
0,9
01
,00
1,0
0
2,0
0
3,0
0
4,0
0
5,0
0
6,0
0
7,0
0
8,0
0
9,0
01
0,0
0
20
,00
30
,00
40
,00
50
,00
s = 1,70
s = 1,75
s = 1,80
s = 1,85
s = 1,90
s = 1,95
s = 2,00 s =
2,05 s = 2,10
s = 2,15
s = 2,20 s =
2,25
-40
-40-3
0
-20
-20-1
0
0
0
10
20
20
30
40
405
0
60
607
0
80
80
90
10
0
10
0
12
01
40
16
0
0,0015
0,00
20
0,00
30
0,0
040
0,0
050
0,0
060
0,0
070
0,0
080
0,0
090
0,0
10
0,0
15
0,0
20
0,0
30
0,0
40
0,0
50
0,0
60
0,0
70
0,0
80
0,0
90
0,1
0
0,1
5
0,2
0
0,3
0
0,4
0
0,5
0
0,6
0
-40
-30
-20
-10
0
10
20
30
40
50
60
70
80
90
100
x =
0,1
00
,20
0,3
00
,40
0,5
00
,60
0,7
00
,80
0,9
0
s =
1,0
01
,20
1,4
01
,60
v= 0
,002
0
v= 0
,003
0
v= 0
,004
0
v= 0
,006
0
v= 0
,008
0
v= 0
,010
v= 0
,015
v= 0
,020
v= 0
,030
v= 0
,040
v= 0
,060
v= 0
,080
v= 0
,10
v= 0
,15
v= 0
,20
DT
U,
Dep
artm
ent
of
Ener
gy E
ngin
eeri
ng
s in
[kJ/
(kg K
)].
v in [
m^3/k
g].
T in [
ºC]
M.J
. S
ko
vru
p &
H.J
.H K
nudse
n.
06-1
0-1
1
R134a
Ref
:D
.P.W
ilso
n &
R.S
.Bas
u,
AS
HR
AE
Tra
nsa
ctio
ns
1988,
Vo
l. 9
4 p
art
2.
Figure 1.2: log p,h–Diagramm from R134a
Copyright of Sanden Technical Centre (Europe) GmbH.Copying, distribution or disclosure to third parties is strictly prohibited.


![R1234yf System Enhancements and Comparison to · PDF fileR1234yf System Enhancements and Comparison to R134a R1234yf System Enhancements and Comparison to R134a ... Pressure [kPaA]](https://img.dokumen.tips/doc/110x75/5a9e13977f8b9a39338c9243/r1234yf-system-enhancements-and-comparison-to-r1234yf-system-enhancements-and.jpg)