Embed Size (px)
Citation preview

Testing the SelectorateExplanation of the Democratic Peace
by
Bruce Bueno de Mesquita
(Hoover Institution, Stanford University and Department of Politics, New York University)
James D. Morrow
(Department of Political Science, University of Michigan)
Randolph M. Siverson
(Department of Political Science, University of California, Davis)
and
Alastair Smith
(Department of Political Science, Yale University)

Testing the SelectorateExplanation of the Democratic Peace
The democratic peace is the observation that democratic states are much less likely to
fight wars with one another than other pairs of states, even though democracies are not less likely
to fight wars in general. An earlier paper by Bueno de Mesquita, Morrow, Siverson and Smith
[hereafter BdM2S2] (1999), presented a formal model that provides an explanation of the known
empirical regularities collectively referred to as the democratic peace. That article also offered
formal proofs for untested novel hypotheses. Here we present tests of the novel hypotheses
derived from that argument, which we will refer to as the selectorate explanation.
Briefly recapping the theoretical argument, all political leaders must satisfy a winning
coalition to remain in power. This need to please backers affects how leaders fight wars and
which wars they choose to fight. The larger the winning coalition on which they depend to
remain in office, the more important successful foreign policy is for a leader’s survival in office.
Autocratic leaders, who generally depend on a small winning coalition, reserve resources from
the war effort to distribute as private benefits to their backers to ensure their hold on office.
Leaders of democracies normally rely on a large coalition for their hold on power; they commit
state resources towards victory even at the expense of private benefits for their supporters.
Further, leaders with a large winning coalition are willing to go to war only when they believe
they have an excellent chance of winning. Leaders who answer to a small winning coalition, in
contrast, can choose to accept less favorable chances of victory because they can placate
supporters with private goods. All else equal, democratic leaders choose their wars more
carefully and try harder to win than autocrats do; each regime type creates different incentives
for leaders.
Two exceptions to the claim that democracies “try harder” emerge from the selectorate
theory. First, democracies (i.e., generally large coalition systems) do not increase their effort
relative to autocracies (i.e., generally small coalition systems) if the initial belief is that victory is

virtually certain. In that case, the marginal improvement in the chance of victory is not worth the
added cost of trying hard. Second, autocrats, like democrats, try hard once the incumbent
recognizes that the dispute represents a significant threat to national or personal political
survival. In equilibrium however, the theory offers no anticipation of interstate war when a
party to the dispute believes the conflict will end in a loss of national sovereignty or personal
hold on office. Instead, such a party seeks a negotiated settlement and is willing to make
substantial concessions to avoid war. If, however, a war begins because such dire results were
not anticipated, once the risks of lost sovereignty become heightened, the theory anticipates that
all leaders, regardless of regime type, will try hard to win or at least prevent disaster.
The two exceptions to the “try harder” prediction provide an opportunity to test not only
the gross predictions of the selectorate explanation (i.e., democracies try harder in war), but the
subtleties as well (i.e., democracies try no harder in colonial wars and autocrats, like democrats,
try hard in world wars). In the case of colonial wars, democracies do not try harder because
victory is a virtual certainty even if they conserve resources. In the case of wars that expand to
become world wars, once such expansion has occurred all belligerents face a threat to survival
and so all must try hard, making autocrats behave just like democrats. With these observations
in mind, we test four novel propositions, each shown to follow logically from the selectorate
explanation (BdM2S2 1999):
(1) Democratic leaders try harder to win wars than do autocrats, except under two
conditions:
a) autocracies try hard when national survival is at risk, or
b) democracies do not try hard when the adversary is much weaker;
(2) Democracies show no reluctance to use force against other democracies in
situations in which the rival democracy is expected to capitulate rather than fight
back;
(3) Democracies show no reluctance to engage in wars against much weaker
adversaries;

(4) Colonial and imperial expansion are especially attractive for democracies when the
state’s “democraticness” outpaces the size of its “winning coalition.”
We believe that these hypotheses contradict the two most widely held explanations for
the democratic peace.1 The first hypothesis challenges other institutional explanations of the
democratic peace (Morgan and Campbell 1991; Bueno de Mesquita and Lalman 1992; Bueno de
Mesquita and Siverson 1995; Maoz and Russett 1993) by suggesting that democratic institutional
“constraints” operate selectively depending on specified circumstances while other institutional
accounts make no distinctions regarding expected democratic behavior across these
circumstances. Hypotheses 2 and 3 appear inconsistent with the normative explanation of the
democratic peace (Maoz and Russett 1993). The fourth hypothesis may be inconsistent with
both the normative and the institutional accounts.
We begin with a summary of the selectorate argument applied to the question of war.
This section presents a discussion of the origin of the four hypotheses. Tests of these hypotheses
follow in the next section. The paper concludes with a discussion of why alternative
explanations of the democratic peace cannot accommodate the results reported here.
The Dyadic Selectorate Model
The theory shows that leaders who require a large coalition to remain in office favor
spending resources on public goods rather than on private benefits for their coalition of
supporters (BdM2S2 2002a, b). Leaders who rely on a small winning coalition, such as
autocrats, hold power by spending resources disproportionately on private goods to reward their
backers. The central insight is that the resources committed to private goods are spread more
thinly as the winning coalition increases in size. Public goods become more attractive to leaders
1 We do not discuss the argument that the democratic peace is a statistical fluke explainedby common interests among democracies during the Cold War (Farber and Gowa 1995, Gowa1999) because that explanation cannot account for other observed regularities about democraciesand war that follow from the selectorate explanation.

with larger winning coalitions because their value to members of the winning coalition does not
decrease as the winning coalition increases in size.
In wartime, as in peacetime, the selectorate theory shows that large coalition polities (like
many democracies) seek gains in the form of public goods while small coalition systems (like
many autocracies) pursue the acquisition of private benefits. While each type of regime extracts
different goods from a victorious war, all else equal, all types of regimes provide incentives for
leaders to prefer victory over defeat. Victory itself is a public good. But whether victory is
sufficiently attractive to be worth making an extra effort to achieve – at the expense of risking
resources that might have been saved to satisfy cronies – is another matter.
To illustrate these central ideas, consider the limiting case. Suppose a leader must choose
between making an all-out effort that guarantees victory (with its possible access to new-found
resources and/or policy gains) and making no additional effort at all even though this makes
defeat inevitable. In the former case, the extra resources behind an all-out effort are not available
for distribution to the winning coalition as private goods. Say the leader has R resources that
could be committed to the war effort or distributed as private goods to her winning coalition, the
value of victory is v (with v including all public and private goods associated with victory in
war), the value of defeat 0, and the cost of fighting to the members of the winning coalition k. If
the leader makes an all out effort, her state wins the war, and her coalition receives a payoff of v-
k. If instead of making an all out effort she distributes the resources to the W members of her
winning coalition as private goods, their payoff is 0-k+R/W, assuming each coalition member
receives an equal share of the private goods.
Since survival in office depends upon maintaining the support of the winning coalition,
leaders pick the policies that their supporters prefer. Leaders who depend upon large coalitions
are more likely to try hard during conflict; it is more likely that v-k > R/W-k for these leaders
than for those who answer to a small winning coalition. The latter should provide private goods
to their supporters even though that act makes military defeat inevitable. Such leaders could
improve their chances of victory by trying harder but this is not incentive compatible with their
desire to stay in office.2 BdM2S2 (1999) shows theoretically that effort level increases with
coalition size, W, in general as well as in this limiting case.
This argument leads directly to our first hypothesis. In general, the larger the winning
coalition, the greater the effort a state makes during wartime. This leads to the novel substantive
conclusion that democrats generally try harder in wartime than do autocrats. There are, as noted
in the statement of the hypothesis, two exceptions.
First, defeat in some wars means that the leader will be removed by the victor or her
state, and therefore her position as leader will disappear. In World War II, Mussolini was
lynched, Tojo hanged by the Allies, and Hitler killed himself before he could be captured. Just
when these leaders were able to foresee their destiny if they were defeated we cannot say. They
did not believe that national sovereignty and personal survival faced such a serious threat when
they contemplated initiating war. If they had, then we would expect that either they would have
avoided war or even these autocratic leaders would have committed all possible resources to the
war effort from the start because defeat means loss of office (and, perhaps, loss of life). Once
participants perceive that a global war is under way, leaders of involved governments surely
discern that their expanded conflict presents a severe threat to their survival and so autocrats
should try as hard as democrats from that stage of the war onward to its end. In the case of the
two world wars, we treat the entire period (1914-1918 and 1939-1945) as the relevant time there
was a severe threat to political survival. Of course we cannot know when each leader actually
reached the conclusion that there was such a threat, but we know that in each world war, the
conflict expanded almost immediately beyond what the initial belligerents anticipated. The
Germans did not anticipate in either world war, for instance, that Britain and France would enter
2 One might argue that the value of remaining in office is a function of regime type. AsGoemans (2000) points out, being ousted is more often fatal for autocrats than democrats. Thisreinforces our conclusion. Our assumption is that the primary goal of all leaders is to keep theirjobs. Given this, the principle component in every leader's objective function is reselection. Itmay be true, conditional on being ousted, that autocrats are more likely to be killed or exiled thanare democrats, but it is also true that the risk of being ousted is most effectively diminished forautocrats by spending less on the war effort and reserving more for their domestic coalition.

the fray in defense of Serbia and Poland respectively. The entry of these major powers changed
the perceived character of the dispute from the start.
Second, at the other extreme, the salience of the war might be sufficiently low and the
prospects of victory sufficiently great that no political arrangements induce additional effort.
Extra effort in wars against weak rivals might have little effect on the chance of victory, so even
leaders with large winning coalitions will not make an extra effort to win. Wars of colonial and
imperial expansion against largely unarmed or under-armed indigenous adversaries fit this
category. This qualification yields the hypothesis that democracies, while trying harder to win
than autocrats in most wars, do not manifest this extra effort level in wars, like colonial and
imperial wars, against much weaker adversaries.
The importance that leaders with large winning coalitions place on success in war – other
than the exceptional circumstances noted above – also affects their judgments of which wars to
fight. As Bueno de Mesquita and Siverson (1995) have empirically demonstrated, the fate of
democratic leaders is more sensitive to the outcome of international conflict than are leaders who
rely on small coalitions. This makes democrats more reluctant to engage in international conflict
because, unless they are certain of victory, they realize conflict places their tenure in office in
serious jeopardy. They choose their fights more carefully (Bueno de Mesquita and Siverson
1995; Reiter and Stam 1998, Siverson 1995) than autocrats who are willing to fight even when
they are not so confident of victory. A democratic leader will offer more to avoid war when she
does not believe her state will win. Autocrats, being at the helm of small coalition governments,
rely on private goods to hold power. They are willing to accept a larger risk of defeat – except
when they anticipate that they are personally unlikely to survive defeat, as in a world war –
because for them the political consequences of defeat are smaller. This is our explanation for the
democratic peace. When two democrats confront each other in a dispute, they are more likely to
negotiate than fight (Lake 1992; Stam 1996, 176-78). When a democrat and an autocrat face off,
both may be willing to fight when the democracy is likely to win.

When two democracies face off in a dispute, at least one leader is likely to believe that
she is uncertain of victory and so is unwilling to use force to achieve her objectives. If a
democracy uses force against another democracy in a dispute, the second is especially likely to
back down without retaliating in kind. Our second hypotheses is that there will be a large
difference in the hostility levels of the sides when a democracy uses force against another
democracy exactly because the target is expected to back down.
Democratic leaders, in our argument, are unwilling to fight wars when they are likely to
lose. Weak opponents are attractive targets for democracies. The targets of colonial and
imperial expansion typically are very weak states or peoples who can easily be defeated. So,
democracies, like autocracies, are not immune from the temptations of colonial and imperial
expansion according to the model. Our third hypothesis is that democracies are not less likely to
engage in colonial wars than other types of states.
The selectorate theory distinguishes between coalition size and nominal regime labels
like democracy or autocracy. While it is convenient to think of democracies as large coalition
systems, in fact they vary in the size of their coalition, while averaging larger coalitions than are
found in autocracies. The variance in coalition size within democracies is due in part to how
encompassing the rules of enfranchisement are. In the nineteenth century, for instance,
nominally democratic systems frequently had great restrictions in their franchise so that winning
coalitions were smaller than the label “democracy” implies. Coalition size has grown with
expanded enfranchisement, a factor this is captured by our empirical indicator of coalition size
which is explained later.
Our fourth hypothesis exploits the difference between the degree of democracy and
coalition size to predict that when the coalition is small relative to recorded “democraticness”
then there is a greater interest in private goods such as could be extracted through colonialism
and imperialism than might be expected just from the degree of democraticness. Recall that the
selectorate theory leads to the conclusion that the smaller the coalition size the greater the
emphasis on private goods.

Empirical Assessments
To test our hypotheses, we construct a data set in which the unit of analysis is a country-
year. The data are organized around up to 172 different countries, spanning the years 1816-
1992. For each nation-year we collect data on military expenditures taken from the Correlates of
War (COW) capabilities data (Singer, Bremer and Stuckey. 1972), data on war and crisis
involvement taken from the COW project, and data on institutional arrangements taken primarily
from POLITY.
In assessing how hard nations try in war, we focus on differences in military spending per
capita across regime types, controlling for prior military spending per capita. It hardly needs
saying that such per capita expenditures are the way societies pay for war. Any shift of resources
into war effort above and beyond “normal” military spending reflects a decision to try harder,
depriving the citizenry either of government services sacrificed to pay for the extra war effort or
of personal income not taxed by the government before the war. This is true even if the extra
effort (as is possible in an autocracy) goes into military and civilian leaders using the opportunity
to steal more from the people through defense contract kickbacks and the like. To the extent that
such extra kickbacks arise, they undermine the empirical observation of the main effects
predicted by our first hypothesis.
We construct a per capita indicator of military spending (MilEx per Capita) by dividing
the Correlates of War Project’s raw military expenditures (in constant dollars) data for each
country each year by its total population. To capture magnitude effects we focus on the
logarithm of the resulting variable (Ln(MilEx per Capita)). The logarithm is used because we
are interested in the magnitude of changed effort indexed by per capita military spending
conditional on the advent or unfolding of war and on regime type. The variable Ln(MilEx per
Capita) is our dependent variable for all tests regarding war effort.
War, extra-systemic war and crisis data are taken from COW. War is as defined by the
Correlates of War (Singer and Small 1972. The data are downloadable from
http://pss.la.psu.edu/). The War variable is coded as 1 every year that a leader’s country is
involved in an interstate war. The variable is coded as 0 for all other country-years. In addition
to evaluating effort levels in interstate wars, we must also assess effort levels in wars of colonial
and imperial expansion and in world wars. To test the selectorate claims regarding these disputes
we construct two dummy variables called Colonial/Imperial War and World War respectively.
We code the Colonial/Imperial War variable as 1 in any year a leader fought in a colonial or
imperial war; that is, a war categorized by the Correlates of War Project as extra systemic.
Otherwise it is coded as zero. To evaluate effort in the world wars we assigned a value of 1 to
those fighting in the World Wars for any year of involvement between 1914-1918 and 1939-
1945 respectively.
To construct the test of the second hypothesis that examines the incidence of democracies
(or large coalition polities) engaging other democracies in violent disputes we used the dyadic
version of the Militarized Interstate Dispute data (Jones, Bremer and Singer 1996; Maoz 1999
downloadable via http://garnet.acns.fsu.edu/~phensel/intlconf.html#crisis).
We offer two estimates of coalition size. The indicators are labeled respectively as W
and Democracy. We also construct a variable called W/D to evaluate the size of the coalition
relative to the degree of democracy as required by the fourth hypothesis. We now describe each
institutional indicator.
The Polity II collection of data include a number of institutional variables, four of which
provide a first approximation of an index of the size of W for the years up to 1992 (http://k-
gleditsch.socsci.gla.ac.uk/Polity.html).3 We estimate W as a composite index based on the
variables REGTYPE, XRCOMP XROPEN, and PARCOMP in Polity II. When REGTYPE is
not missing data and is not equal to codes 2 or 3 in the Polity dataset, so that the regime type was
3 Unfortunately one of the indicators used to construct the index of coalition size has notbeen updated by Polity in any releases beyond Polity II. We are working on developing analternative indicator that can be used beyond 1992 but for now are restricted to excluding casesbeyond that time. The COW data, in any event, are not readily available beyond 1992 so thatexpansion of our data beyond that date is at present difficult for each of our key indicators.

not a military or military/civilian regime, we award one point to W. When XRCOMP, that is, the
competitiveness of executive recruitment, is larger than or equal to code 2 then another point is
assigned to W. An XRCOMP code of 1 means that the chief executive was selected by heredity
or in rigged, unopposed elections, suggesting dependence on few people. Code values of 2 and 3
refer to greater degrees of responsiveness to supporters, indicating a larger winning coalition.
XROPEN, the openness of executive recruitment, contributes an additional point to W if the
executive is recruited in a more open setting than heredity (that is, the variable's value is greater
than 2). Finally, one more point can be contributed to the index of W if PARCOMP,
competitiveness of participation, is coded as a 5, meaning that “there are relatively stable and
enduring political groups which regularly compete for political influence at the national level”
(Polity II, p. 18). We divide by the maximum value, which is 4. The minimum value, then, is 0
and the maximum is 1.
The Polity data contain widely used scales of democracy and autocracy, each ranging
between 0 and 10. We subtract the autocracy score from the democracy score (Maoz and Russett
1993). This yields a variable that ranges between -10 and +10. We add 10 to the score and
divide by 20. Thus, our variable Democracy varies between 0 and 1, with scores closer to zero
reflecting autocratic governments and scores closer to 1 reflecting more democratic
governments.
W/D is simply W divided by Democracy and is set equal to 1 in those cases in which
Democracy = 0 and W = 0. This variable is used to test the fourth hypothesis. We also make use
of a dichotomous variant W/D* which is coded as 1 if W Æ Democracy or if Democracy equals
0, and is otherwise coded as 0.
Table 1 displays the bivariate correlations among the institutional indicators. Although all
are, as expected, correlated significantly with one another, they each clearly capture different
aspects of a polity’s institutional make-up. Even the strongest association – between W and
Democracy – leaves about one third of the variance between them unexplained. What is more,
this correlation somewhat overstates the relationship. Among the 6,897 observations for which
Democracy equals 0 nor 1, the bivariate correlation with W is 0.63. The correlation between W
and Democracy at their boundary values is nearly perfect, but in the interior of the two measures
there are substantial differences. W is often more subtle at recognizing changes in or restrictions
on enfranchisement or other indicators of coalitional inclusiveness (BdM2S2 2000, 2001). With
this information in hand we can be confident that tests across these indicators will capture
complementary aspects of political institutions.
Table 1 About Here
Table 1: Correlations Between W, Democracy, and W/D
W Democracy W/D
Democracy 0.831
W/D -0.041 -0.421
W/D* 0.286 -0.168 0.335
N = 9,289
Whenever feasible, the cross-sectional, time-series analyses we examine include controls
for the interaction of geographic region-year as a set of fixed effects dummy variables. We
include these fixed effects because there may be spatiotemporal dependence in the data resulting,
for instance, from factors that influence fluctuations in economic growth rates or the persistence
of peace in particular parts of the world in particular years (Green, Kim, and Yoon 2001). In this
way we recognize that war, drought, the business cycle and a host of other factors have an
impact on government performance at different times in different places.
We specify six geographic regions for the region-year fixed effects. These are: Europe,
South and Central America, North America and the Caribbean, Asia, the Middle East, and
Africa. We do not discuss the fixed effects as they are strictly statistical corrections of no
substantive interest. Their presence, however, makes our tests especially demanding as we have
removed the effects of any temporal and spatial factors that might be the actual explanation for
shifts in the values of our dependent variables. The number of fixed effects variables is
relatively large, so success at finding substantively and statistically significant institutional
effects would provide considerable encouragement for further refinement and testing of the
selectorate theory. As appropriate we also control for major power status, reporting those effects
in footnotes.
Testing the Predictions
Hypothesis 1: Challenging Other Institutional Accounts
The first hypothesis maintains that large coalition, democratic states try harder in war
than their small coalition, autocratic counterparts except under special circumstances tested as
hypothesis 1a and 1b. To evaluate the main part of the first hypothesis (i.e., large coalition
polities generally try harder in war) we initially construct two different tests. The dependent
variable in each is the logarithm of per capita military expenditures. The independent variables
for these tests include the lagged institutional indicator (i.e., Lagged W or Lagged Democracy), a
dummy variable that identifies countries embroiled in a war, the war indicator times the lagged
institutional factor, the lagged logarithm of military expenditures and the fixed effects for
region-year. Control for the lagged logarithm of per capita military expenditures makes our tests
especially demanding. The difference between the current year’s Ln(Milex per Capita) and the
previous years’s Ln(Milex per Capita) reflects the proportionate change in military expenditures
over the previous year’s spending. Virtually all the variance in a given year’s military spending
level is likely to be explained by the previous year’s spending. Controlling for lagged
expenditures, then, demands that the marginal change in spending be attributed to the presence of
a large coalition system. These tests are then replicated, adding control for major power status,
to see if power, rather than regime type, explains differences in effort level.
The selectorate theory specifically predicts that each test involving War will show a
significant positive coefficient associated with the interaction term for War*Lagged W (or
Lagged Democracy) and that the coefficient will be so large that the sum of the coefficients
associated with War and War*Lagged W (or Lagged Democracy) will be significant and
positive. The theory makes no prediction about the sign or magnitude of War by itself.

Table 2 presents the results for the two models that assess the relationship between war,
political institutions(W and Democracy) and military effort. The findings are consistent with the
prediction derived from the dyadic selectorate model (BdM2S2 1999). In fact, Table 2 offers a
perhaps surprising, interesting perspective on warfare. The fact that a country finds itself
enmeshed in a war does not generally imply that it increases its military spending regardless of
regime type. The coefficient associated with the variable War by itself is not significant in any
of the tests. So, not only do democratic, large-coalition regimes try harder in war than autocratic
regimes; the latter – on average – spend no more on the military in wartime than in peacetime,
nor do they spend more, again on average, as a multi-year war unfolds.
Table 2 About Here
Table 2: Do Large Coalition or Democratic Leaders Try Harder in Wartime?
Log(Milex per Capita) Log(Milex per Capita)
Variables Coefficient (Std. Error)
Probability
Coefficient (Std. Error)
Probability
Lagged Log(Milex) 0.937 (0.004) 0.000 0.941 (0.004) 0.000
Lag W 0.063 (0.015) 0.000
Lag Democracy 0.042 (0.012) 0.001
War 0.003 (0.067) 0.969 0.075 (0.050 ) 0.134
War*Lagged W 0.413 (0.107) 0.000
War*Lagged Democracy 0.288 (0.097) 0.001
Constant 0.109 (0.010) 0.000 0.125 (0.008) 0.000
Summary Statistics N = 7,524 Fixed Effects =
861 R2 = 0.98 F = 14,915 p =
0.0000
N = 6,921 Fixed Effects=859
R2 = 0.97 F = 14,308.26 p =
0.0000
Test of War+War*Lagged W: F - 51.11 p = 0.0000; Test of War+War*Lagged Democracy: F =
37.89 p = 0.0000

The selectorate model predicts that large coalition leaders generally try harder in wartime
than do small coalition leaders, but it makes no specific prediction about whether small coalition
leaders try harder than when they are not at war. That is, the theory makes the novel predictions
that War*Lagged W (or War*Lagged Democracy) will be positive and significant and that War
+ War*Lagged W (or War*Lagged Democracy) will also be significant and positive. Each of
these expectations is reinforced by the evidence. However, the selectorate model does not
specify that War itself will be significant and positive. Such a result, along with the results
predicted by the dyadic selectorate model, would have indicated that war leads to a general
increase in military spending, but that the increase is greater among large coalition regimes than
small coalition regimes.
Instead, we find that the small coalition regimes, on average, do not increase their effort
over what they were doing the year before the war began. Perhaps they geared up earlier. Yet
tests that assess whether a conflict began or escalated over the previous year or two before the
war began continue to show that small coalition regimes do not gear up, while large coalition
regimes continue to try significantly harder. So, not only do large coalition leaders try harder in
wartime than their small coalition counterparts, the small coalition leaders do not even try harder
than their effort level before the war began.4 Apparently it is true that democratic leaders, with
their dependence on a large winning coalition, generally try harder that autocrats in wartime.5
When Colonial/Imperial War or the latter stages of World War are substituted for War
then the selectorate theory does not expect significant coefficients associated with these types of
4 This result suggests that money spent on corrupt practices, such as military leadersskimming resources for their own use, may be equally feasible in peacetime and wartime. We donot explore this possibility here, but mention it as a topic for future study.5 The replication that controls for major power status and the interaction between majorpower status and War, shows no consequential change in the results. While major powers, onaverage, spend more on the military, they do not generally try harder in wartime (i.e., theinteraction term War*Major is not significant). With these controls, it still remains true thatlarge coalition systems try harder in wartime (coefficient = 0.406, Std. Error = 0.107 and p =0.000), as do democracies (coefficient = 0.301, Std. Error = 0.087, p = 0.001).

war interacted with the lagged institutional indicators. Leaders generally do not need to try
harder when fighting in colonial wars because these wars involve a near certainty of victory from
the start. Therefore, neither the dummy variable Colonial/Imperial War nor its interaction with
regime type is expected to be significant. In the case of World War, the effort level of regimes is
not expected to be different once the war’s true risks to political survival are evident. At that
point, there should be no significant difference in the effort of leaders who depend on a small
coalition from those who rely on a large coalition. That is, the variable World War is expected to
be significant – reflecting a general increase in effort level – while the interaction term between
World War and regime type is not expected to be significant.
To test these special cases from hypothesis 1, we first examine a regression analysis that
controls for the previous year’s per capita military expenditures, the previous year’s institutional
value (i.e., Lagged W or Lagged Democracy), the dummy variables for the two war types
(Colonial/Imperial and World War) and the dummy variables interacted with the relevant lagged
regime indicator. We do not use fixed effects here for region-year as this will, effectively,
eliminate the ability to test the effort level during world wars (and to a lesser extent the
colonial/imperial wars) since they represent a block of years and these war years are
concentrated in the European and Asian regions (or, in the case of colonial and imperial wars,
regional areas where colonization took place). Following this test, we replicate the regression
analysis, while adding War and War times the relevant lagged institutional variables so that we
can see the separate effects of regime type simultaneously across the three kinds of war. Table 3
summarizes the regression analysis for Colonial/Imperial War and World War while Table 4
replicates Table 3 adding War and the appropriate interactive lagged institutional effects.
Table 3 About Here
Table 3: Do Large Coalition or Democratic Leaders Try Harder in

Colonial Wars or World Wars?
Log(Milex per Capita) Log(Milex per Capita)
Variables Coefficient (Std. Error)
Probability
Coefficient (Std. Error)
Probability
Lagged Log(Milex) 0.986 (0.002) 0.000 0.987 (0.002) 0.000
Lag W 0.053 (0.015) 0.001
Lag Democracy 0.033 (0.001) 0.007
World War 0.579 (0.160) 0.000 0.433 (0.125) 0.001
World War*Lagged W 0.308 (0.225) 0.172)
World War*Lagged Democracy 0.477 (0.177) 0.007
Colonial/Imperial War -0.079 (0.093) 0.395 -0.058 (0.078) 0.459
Colonial/Imperial War * Lagged W 0.149 (0.165) 0.366
Colonial/Imperial War * Lagged
Democracy
0.099 (0.142) 0.486
Region-Year 0.000 (0.00002) 0.000 0.0001 (0.00002) 0.000
Constant -0.010 (0.0140) 0.492 0.006 (0.012) 0.633
Summary Statistics N = 7,524 R2 = 0.97 F =
39,900 p = 0.0000
N = 6,921 R2 = 0.98 F =
38,812 p = 0.0000
The tests generally bears out the theoretical expectation. Neither regression model in
Table 3 shows anything remotely approaching statistical significance in terms of effort level for
large (or small) coalition polities when engaged in colonial and imperial wars. In these disputes,
as predicted, no regime type tries especially hard. Conversely, large coalition systems and small
coalition systems both try harder during world wars. The large coalition polities do not outstrip
their smaller coalition counterparts in effort level during world wars. When democracy is
substituted for coalition size – which we do for completeness though the selectorate predictions
(BdM2S2 1999) are derived from variation in W, not democracy – then again in the world wars

both types of states try hard, while in colonial and imperial wars neither regime type tries hard.
However, democratic states try even harder that autocrats in world wars.
Table 4 About Here
Table 4: Do Large Coalition or Democratic Leaders Try Harder in
Colonial Wars, World Wars, or All Other Wars?
Log(Milex per Capita) Log(Milex per Capita)
Variables Coefficient (Std. Error)
Probability
Coefficient (Std. Error)
Probability
Lagged Log(Milex) 0.986 (0.002) 0.000 0.987 (0.002) 0.000
Lag W 0.050 (0.015) 0.001
Lag Democracy 0.031 (0.012) 0.012)
War 0.045 (0.073) 0.535 0.060 (0.057) 0.286
War*Lagged W 0.231 (0.124) 0.062)
War*Lagged Democracy 0.186 (0.104) 0.075
World War 0.535 (0.175) 0.002 0.374 (0.137) 0.006
World War*Lagged W 0.078 (0.256) 0.760
World War*Lagged Democracy 0.293 (0.204) 0.151
Colonial/Imperial War -0.078 (0.093) 0.406 -0.056 (0.078) 0.473
Colonial/Imperial War * Lagged W 0.152 (0.165) 0.358
Colonial/Imperial War * Lagged
Democracy
0.100 (0.142) 0.481
Region-Year 0.0001 (0.00002) 0.000 0.0001 (0.00002) 0.000
Constant -0.009 (0.014) 0.519 0.006 (0.013) 0.606
Summary Statistics N = 7,524 R2 = 0.97 F =
31,137 p = 0.0000
N = 6,921 R2 = 0.98 F =
30,258 p = 0.0000

Table 4 reinforces the results reported in Tables 2 and 3. Large coalition systems try
harder in war (test War + War*Lagged W > 0, F = 16.18, p = 0.000). So do democracies (F =
12.24, p = 0.001). Wars of colonial and imperial expansion lead to no extra effort regardless of
regime type and world wars lead to extra effort, also regardless of regime type. These are
precisely the expectations deduced in the selectorate model (BdM2S2 1999) and stated as
hypothesis 1 (including special cases a and b).6
The evidence leads to direct conclusions. When at war, dependence on a large coalition
encourages leaders to shift more resources into achieving military success except when victory is
a virtual certainty. Those whose leadership depends on a smaller coalition only make an extra
war effort under the extreme conditions of world war; otherwise pre-war military spending per
capita seems to prove sufficient for them; they do not shift more resources into the war effort.
When victory is assured, no one puts extra effort into the pursuit of victory regardless of regime
type. The novel effort-level hypotheses derived from the selectorate explanation of the
democratic peace are supported by the evidence.
Hypotheses 2, 3 and 4: The Normative Challenge
The second hypothesis represents an important challenge for those who explain the
democratic peace by appealing to differences in norms. Using the dyadic version of the
Militarized Interstate Dispute data (MID) we examine how coalition size of the protagonist states
influences the extent to which a target of violence will retaliate. The selectorate theory does not
preclude democratic states from using violence against other democracies. Rather the theory
predicts it is unlikely, although not impossible, for a democracy to use force against another
6 We also replicated these results while controlling for whether the state in question was amajor power. The test included interaction terms as well for each war type and whether or not astate was a major power, using the COW definition of the major powers. None of the resultschanged. Large coalition regimes continue to show extra effort in all wars other thancolonial/imperial wars. Small coalition systems continue to demonstrate extra effort only inworld wars. Major powers in general spend more per capita on the military, but otherwise makeno significant extra effort in wartime.

democracy that results in war. Using force against a democracy and then having the dispute
settled short of war is predicted by the selectorate account.
The MID data provide the level of violence that states involved in crises use against each
other on a five point scale, where a score of four indicates the use of violence and a score of five
indicates that the violence surpasses the COW project’s thresholds to be assessed as a war (for
example, a thousand battle fatalities). Table 5 is a 2-by-2 table showing the number of instances
when both the initiator and the target in a crisis used violence. For clarity of presentation, we
consider a dichotomous classification of states.
Table 5 About Here
Table 5: The Incidences of Mutually Violent Disputes
by the Institutions of the Protagonists.
Target State
Small Coalition
(W<0.75)
Large Coalition
(W>=0.75)
Initiator State Small Coalition (W<0.75) 964 466
Large Coalition
(W>=0.75)
719 186
The presence of events in the bottom right cell is inconsistent with the norms argument. It
is legitimate to argue that large coalition size does not reflect democracy; yet this pattern is
sustained when measures of democracy are substituted for W. Indeed, substituting large coalition
size for the most rigorous definition of democratic states (Democracy=1), there are still 24 events
in the bottom right cell. Admittedly, none of these events involve both states using a hostility
level of five, the COW definition of war, but there clearly are numerous instances of a
democracy using force against other democracies. Some examples include lethal naval clashes

between Iceland and the United Kingdom over fishing rights during the 1970s or Japan and
Papua-New Guinea in 1988, as well as Norway and Denmark in 1969 and so forth.
While there are events in each of the cells in Table 5, the mutual use of violence is less
likely to occur between large coalition states than between other combinations of states. The
likelihood ratio 02 statistic is 40.981 which, at the 0.000 level, rejects the null hypothesis that the
cell entries are the product of row and column frequencies. Such evidence is entirely consistent
with the selectorate theory.
Large coalition systems have no moral prohibition against the use of violence. However,
they are unlikely to do so in instances when violence is likely to lead to war between two large
coalition systems. As a consequence, democracies attack other democracies only when they
expect the target to backdown. An ordered logit analysis of the difference between the hostility
levels used by the initiator and target when the initiator uses violence (i.e., at least a score of 4 in
the MIDs data) reinforces these results. If an initiator of violence is from a large coalition
system (e.g., a democracy) and the target is also from a large coalition system, then the target is
significantly more likely to back down than if the target were from a small coalition polity (such
as an autocracy).
These findings both complement and challenge work by Schultz (1998, 1999, 2001).
Building on research on audience costs (Fearon 1994, Smith 1998), Schultz argues that
democracies are less likely to engage in foreign adventures because of constraints imposed by
the domestic opposition when adventures are expected to turn out badly. This is consistent with
our expectation that democracies (i.e., large coalition systems) need to be especially confident of
victory before engaging in the use of force. However, Schultz’s argument is not developed for
the case where both the target and initiator are democratic. In those cases, one might conjecture
from his theory that both parties are subject to the same constraint. However, if the prospective
initiator knows that the target, being a democracy, is subject to domestic pressures not to fight
when the odds are not exceptionally good, then the first-party may be encouraged to take greater

risks because it anticipates that the second party will back down. This claim follows directly in
the selectorate explanation of the democratic peace, but is not developed in Schultz’s analysis.
The existence of even one violent dispute between democracies or large coalition systems
represents a fundamental challenge to the normative account of the democratic peace. While
these cases appear to contradict the normative explanation of the democratic peace, they are
entirely consistent with the expectations derived from the selectorate theory and some other
institutional explanations.
To test hypotheses 3-4 we examine three logit analyses. The first is between
Colonial/Imperial War, region-year fixed effects and Democracy. The second also includes the
region-year fixed effects and substitutes W for Democracy. The third replaces W with W/D. If
the selectorate account is supported, then whether W or Democracy is 1 or 0, there is no
significant change in the likelihood of Colonial/Imperial War. The smaller W/D is, the greater
the prospects of such wars, commensurate with the greater interest in private goods as W gets
smaller. In addition to the logit analysis on this question, we also examine the relationship
between the advent of such wars and the dichotomous indicator W/D*. The three logit analyses,
reported in Table 6 present an interesting picture.
Democracy has, by itself, a significant impact on the likelihood of extra systemic war in
the opposite direction from that anticipated by those who advocate a normative explanation of
the democratic peace. That is, democracies are more likely to engage in wars of colonial and
imperial expansion than are non-democracies.7 The selectorate theory is agnostic about
democracy per se. The logit analysis based on the coalition size indicators show, as expected,
that a large coalition system and a small coalition system are – in a statistical sense – equally
7 We introduce a control for whether the state is a major power, as well as an interactionterm that is the product of major-power status times Democracy. The significant positive impactof Democracy on colonial and imperial war disappears, with significance residing in whether thestate in question was a major power or not.
likely to engage in such wars.8 This is precisely the prediction from the dyadic selectorate
model, reinforcing the claims for a “selectorate peace”.
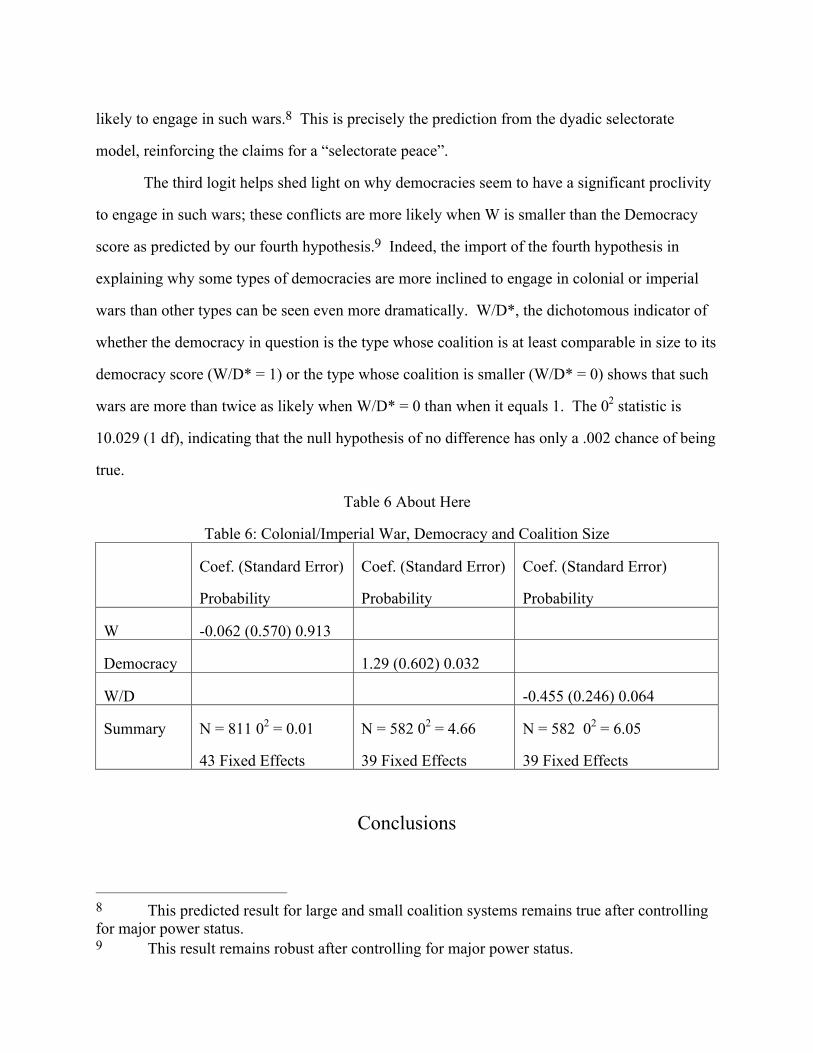
The third logit helps shed light on why democracies seem to have a significant proclivity
to engage in such wars; these conflicts are more likely when W is smaller than the Democracy
score as predicted by our fourth hypothesis.9 Indeed, the import of the fourth hypothesis in
explaining why some types of democracies are more inclined to engage in colonial or imperial
wars than other types can be seen even more dramatically. W/D*, the dichotomous indicator of
whether the democracy in question is the type whose coalition is at least comparable in size to its
democracy score (W/D* = 1) or the type whose coalition is smaller (W/D* = 0) shows that such
wars are more than twice as likely when W/D* = 0 than when it equals 1. The 02 statistic is
10.029 (1 df), indicating that the null hypothesis of no difference has only a .002 chance of being
true.
Table 6 About Here
Table 6: Colonial/Imperial War, Democracy and Coalition Size
Coef. (Standard Error)
Probability
Coef. (Standard Error)
Probability
Coef. (Standard Error)
Probability
W -0.062 (0.570) 0.913
Democracy 1.29 (0.602) 0.032
W/D -0.455 (0.246) 0.064
Summary N = 811 02 = 0.01
43 Fixed Effects
N = 582 02 = 4.66
39 Fixed Effects
N = 582 02 = 6.05
39 Fixed Effects
Conclusions
8 This predicted result for large and small coalition systems remains true after controllingfor major power status.9 This result remains robust after controlling for major power status.

We have shown that novel hypotheses derived from our explanation of the democratic
peace are consistent with observed evidence. Leaders who answer to a large winning coalition
apparently do make greater efforts to win during wars (other than colonial/imperial wars, as
predicted); are willing to use force against weaker opponents (including democratic, large
coalition opponents), especially when their seemingly democratic system still has a relatively
small coalition; and are unwilling to fight back when stronger states use force against them.
We now ask whether competing explanations of the democratic peace can account for
these regularities. The normative explanation contends that democratic leaders externalize their
domestic norm of political competition when that norm is expected to be reciprocated.
Democracies then do not go to war with one another because they share norms of peaceful
resolution of disputes (Maoz and Russett 1993, Dixon 1994). When facing an autocracy in a
dispute, democracies understand that their opponent does not share their values of peaceful
resolution and so they must adopt the means of power politics to protect themselves. Our results
on the willingness of democracies to use force against other democracies and in colonial wars
seems to contradict the normative explanation. If democracies are normatively bound from the
use of violence against one another, we should not observe any use of violence by one
democracy against another. Instead, we find democracies do use force against other democracies
when the latter is unlikely to resist. If democracies only abandoned their norms against violence
when they were threatened, they should not fight weak polities in colonial and extra-systemic
wars. We do not see how a normative explanation could account for these patterns.
The constraints argument states that domestic constraints make it difficult for democratic
leaders to garner the support they need to wage war. The democratic peace occurs because the
leaders of two such constrained states will not both be able to gain the necessary support to go to
war. Our evidence on the greater wartime effort of systems with large winning coalitions seems
inconsistent with this argument. Once at war, democracies are more able to mobilize resources
for victory. Autocratic leaders, according to the constraints argument, should be more able to
mobilize resources for war because they face fewer constraints yet they turn out only to increase
the resources they commit to war when faced with the threat of total annihilation. Again, we do
not see how the constraint argument could explain the observed pattern in which autocracies fail
to mobilize as much as democracies once a war begins except in the case of world wars.
References
Bueno de Mesquita, Bruce and David Lalman. 1992. War and Reason. New Haven:
Yale University Press.
Bueno de Mesquita, Bruce, James D. Morrow, Randolph M. Siverson and Alastair Smith.
2002a. “Political Institutions, Policy Choice and the Survival of Leaders,” British Journal of
Political Science, forthcoming.
Bueno de Mesquita, Bruce, James D. Morrow, Randolph M. Siverson and Alastair Smith.
1999. “An Institutional Explanation of the Democratic Peace” American Political Science
Review 93(December):791-807.
Bueno de Mesquita, Bruce, James D. Morrow, Randolph M. Siverson and Alastair Smith.
“Political Institutions and Incentives to Govern Effectively” (with James D. Morrow, Randolph
Siverson and Alastair Smith) Journal of Democracy 12 (January 2001):58-72.
Bueno de Mesquita, Bruce, Alastair Smith, Randolph M. Siverson and James D. Morrow.
2002b. The Logic of Political Survival. Book ms., forthcoming.
Bueno de Mesquita, Bruce and Randolph M. Siverson. 1995. “War and the Survival of
Political Leaders: A Comparative Study of Regime Types and Political Accountability,”
American Political Science Review, December.
Dixon, William. 1994. "Democracy and the Peaceful Settlement of International
Conflict" American Political Science Review 88 (March): 14-32.
Farber, Henry S. and Joanne Gowa. 1995. “Polities and Peace,” International Security
20:123-46.
Fearon, James D. 1994. "Domestic political audiences and the escalation of international
disputes." American Political Science Review. v. 88 Sept. '94 p. 577-92.
Goemans, Hein E. 2000. “Fighting for Survival: The Fate of Leaders and the Duration
of War,: Journal of Conflict Resolution (October).

Gowa, Joanne. 1999. Ballots and Bullets: The Elusive Democratic Peace. Princeton, NJ:
Princeton University Press.
Green, Donald, Soo Yeon Kim, and David Yoon. 2001. “Dirty Pool,” International
Organization.
Jones, Daniel M. Stuart A. Bremer and J. David Singer (1996) ."Militarized Interstate
Disputes, 1816-1992: Rationale, Coding Rules, and Empirical Patterns." Conflict Management
and Peace Science, 15(2): 163:213.
Lake, David A. 1992. “Powerful pacifists: democratic states and war” American Political
Science Review 86(Mar.): 24-37.
Maoz, Zeev. 1999. Dyadic Militarized Interstate Disputes (DYMID1.1)
Dataset—Version 1.1 Tel-Aviv University.
Maoz, Zeev and Bruce Russett, “Normative and Structural Causes of the Democratic
Peace,” American Political Science Review 87 (September 1993):624-38.
Morgan, T. Clifton and Sally Howard Campbell. 1991. “ Domestic Structure, Decisional
Constraints, and War: So Why Kant Democracies Fight?” Journal of Conflict Resolution 35
(June) 187-211.
Reiter, Dan and Allan Stam, III, 1998a. “Democracy, War Initiation and Victory,”
American Political Science Review. 92(June): 377-389.
Schultz, Kenneth A. 2001. “Looking for Audience Costs: A Research Note.”
Journal of Conflict Resolution 45, 1(February):32-60.
Schultz, Kenneth A 1998. “Domestic Opposition and Signaling in International Crisis.”
American Political Science Review 92, 4 (December): 829-44.
Schultz, Kenneth A 1999. Do Democratic Institutions Constrain or Inform? International
Organization. 53( 2 Spring):233-266.
Smith, Alastair. 1998. "International Crises and Domestic Politics" American Political
Science Review, September Vol. 92. No.3. p. 623-638.

Singer, J. D. S. Bremer and J. Stuckey. 1972. Capability Distribution, Uncertainty, and
Major Power War, 1820-1965.” in B. Russett (ed.) Peace, War and Numbers. Beverly Hills:
Sage.
Singer, J. David, and Melvin Small (1972). The Wages of War, 1816-1965: A Statistical
Handbook. New York: John Wiley.
Siverson, Randolph M. 1995. “Democracies and War Participation: In Defense of
Institutional Constraints,” The European Journal of International Relations, 1, 4:481-88.
Smith, Alastair. 1998. "International Crises and Domestic Politics" American Political
Science Review, September Vol. 92. No.3. p. 623-638.Stam, Allan C., 1996. Win, Lose or Draw: Domestic Politics and the Crucible of War.
Ann Arbor, MI: The University of Michigan Press.


![Democratic peace theory_&_the_unintended_consequences_of[1]](https://img.dokumen.tips/doc/110x75/55c2c366bb61ebc3178b4660/democratic-peace-theorytheunintendedconsequencesof1.jpg)