Embed Size (px)
Citation preview

Testing the Market Timing Theory of Capital Structure
Rongbing Huang* Kennesaw State University
Mail Drop #0403 Kennesaw, GA 30144
678.797.2081 voice [email protected]
Jay R. Ritter
University of Florida P.O. Box 117168
Gainesville, FL 32611-7168 352.846.2837 voice
[email protected] http://bear.cba.ufl.edu/ritter/
September 15, 2004
* We wish to thank Chunrong Ai, Ralf Elsas, Mark Flannery, Gabriel Ramirez, Jason Karceski, M. Nimalendran, Andy Naranjo, and seminar participants at the University of Florida and Kennesaw State University for comments. We also thank Vidhan Goyal and Richard Warr for programming assistance. This paper is based on Rongbing Huang’s 2004 University of Florida doctoral dissertation.

1
Testing the Market Timing Theory of Capital Structure
Abstract
This paper examines time-series patterns of external financing decisions. Consistent with the
market timing theory of capital structure, publicly traded U.S. firms fund a much larger
proportion of their financing deficit with net external equity when the expected equity risk
premium is lower, the first-day returns of initial public offerings are higher, and prior (post)
realizations of the Fama-French value factor are lower (higher). Inconsistent with the pecking
order theory, equity issues are frequent, and announcement effects of seasoned equity offerings
are only weakly related to the volume of external equity financing. Inconsistent with the static
tradeoff theory, firms adjust very slowly toward target leverage, and past securities issues have
strong and long-lasting effects on capital structure even after controlling for target leverage.

2
1. Introduction
Firms may fund their investment projects with internally generated funds, debt, and/or
external equity. What determines their financing decisions? The static tradeoff theory and the
pecking order theory try to address this question.
Under the static tradeoff theory, firms compare the costs and the benefits of debt. The
costs of debt include potential bankruptcy costs and agency conflicts between bondholders and
shareholders. The benefits of debt include the deductibility of interest expenses and the
mitigation of agency conflicts between managers and shareholders. According to the static
tradeoff theory, if firms seek external financing, they should issue equity when their leverage is
above the desired target leverage, issue debt when their leverage is below the target, or issue debt
and equity proportionately to stay close to the target.
The pecking order theory proposes that firms follow the standard pecking order in their
financing decisions. Firms prefer internally generated funds, and raise external funds only if
internal funds are insufficient. If external funds are required, they prefer straight debt, then
convertible debt, and finally external equity. Target leverage is of second-order importance under
the pecking order theory. Firms may take “extended excursions away from their targets” because
of past profits and losses and their financing needs (Myers (1984)).
How successful are these two theories in explaining the time-series patterns of financing
activities? Figure 1A shows the average financing activities of publicly traded U.S. firms from
1963 to 2001, using information from the balance sheet. The average firm increasingly relied on
the external capital market over this period. In the choice between debt and equity, firms issued
increasingly more external equity relative to debt in the 1990s. These facts are inconsistent with
the pecking order prediction that securities issues, especially equity issues should be rare.
The averages weigh the financing activities of small firms heavily. To capture the
economic significance of large firms, Figure 1B shows the aggregate financing activities. At the
aggregate level, firms issue more debt than external equity during almost all years. The aggregate
amount of net external equity peaked at over seven percent of aggregate assets in 2000. Again,
this pattern cannot be easily reconciled with the pecking order prediction that equity issues
should be a last resort and a rarity. Both the average and aggregate net debt and equity issuance

3
fluctuates substantially. The static tradeoff theory has been unable to provide a satisfactory
explanation for the magnitude of these fluctuations.
A third theory, the market timing theory, has increasingly challenged both the static
tradeoff theory and the pecking order theory. The market timing (or windows of opportunity)
theory, states that firms prefer external equity when the cost of equity is low, and prefer debt
otherwise. According to the market timing theory, corporate executives sometimes perceive their
risky securities as misvalued by the market. Conditional on having financing needs, firms issue
equity when they perceive the relative cost of equity as low, and issue debt when they perceive
the relative cost of equity as high. How do they judge the relative cost of equity? On the one
hand, they may know themselves or their industries better. On the other hand, they may follow
certain psychological patterns. For example, reference points, as suggested by prospect theory,
may play a role.1
The pecking order theory assumes semi-strong form market efficiency, while the market
timing theory does not rely on this assumption. If markets are not semi-strong form efficient,
then external equity is not necessarily more expensive than external debt, and a firm might want
to take advantage of a temporary overvaluation of debt or equity by raising external capital
before the overvaluation disappears. Therefore, while the pecking order theory predicts equity
issues to be rare, the market timing theory does not make such a prediction. In fact, the standard
pecking order is just a special case under the market timing theory. We summarize different
financing hierarchies under different scenarios in Table 1. Under normal market conditions,
firms follow the standard pecking order. When external equity is less expensive than debt, firms
prefer external equity if they seek external financing. When external equity is really cheap,
issuing equity is the first choice. Similarly, when debt is really cheap, issuing debt becomes the
first choice. Firms may issue equity or debt even if they have no immediate financing needs and
do not need to adjust their capital structure, because issuing overvalued securities is itself a
positive NPV project.
Fama and French (2004) document that equity issues have been increasingly frequent and
firms issue equity even when they could have used internally generated funds or issued debt.
They interpret this as evidence against the pecking order theory. They suggest that new external
1 Casual conversations with investment bankers suggest that when they advise their clients on the choice between debt and external equity financing, the most important factor they consider is whether their clients’ stock prices are at a 52-week high.

4
equity financing tools, such as stock-financed acquisitions and employee stock option plans,
involve less severe information asymmetry, leading to the increased use of external equity
financing over time. However, they do not provide an explanation for why firms are more likely
to fund acquisitions with external equity in the 1990s, and why employee stock option plans,
which have been around for a long time, have become more popular over time as a mechanism
for external equity financing. Furthermore, even within each decade, financing activities show
substantial variations that need to be explained.
Like Fama and French (2004), we question the importance of the pecking order theory.
Our study also goes one step further. We find that by dropping the assumption of semi-strong
form market efficiency, the market timing theory based on the relative cost of equity provides a
better explanation for observed time-series patterns of financing decisions than alternative
theories. To our knowledge, our study is the first to systematically link the time series of capital
structure choices to the time-varying relative cost of equity for a large sample of U.S. publicly
traded firms, other than the Korajczyk, Lucas, and McDonald (1990) analysis.
We begin with the pecking order test in Shyam-Sunder and Myers (1999), who run a
regression with a firm’s change in debt as the dependent variable and its financing deficit as the
explanatory variable. Instead of pooling all years together, we conduct this pecking order test
each year, examine time-series properties of the slope coefficient, and link it to proxies for the
time-varying relative cost of equity. Our proxies for the cost of equity include lagged values of
the implied equity market risk premium, the average first-day return of initial public offerings
(IPOs), and the average closed-end fund discount. We also include lagged realized market
returns, and the realizations of the Fama-French size factor SMB and value factor HML. Since
the pecking order theory assumes that markets are semi-strong form efficient, the announcement
effect associated with equity issues should be the primary proxy for the level of information
asymmetry. The average announcement effect of seasoned equity offerings (SEOs) is thus
included to directly test the pecking order theory.
Consistent with the market timing theory, firms fund a large proportion of their financing
deficit with external equity when the cost of equity is low, and fund a large proportion of their
financing deficit with debt when the cost of equity is high. The magnitude of the effect is
economically and statistically significant. For example, an increase in the implied equity market

5
risk premium from three percent to four percent results in approximately three percent more
(e.g., from 32 percent to 35 percent) of the financing deficit being funded with net debt.
Frank and Goyal (2002) and others have documented that the pecking order slope
coefficient has weakened over time. Lemmon and Zender (2002) argue that the weakening of the
standard pecking order in the 1990s is due largely to the increased proportion of small growth
firms among the pool of publicly traded firms. They argue that these small growth firms are
debt-constrained, and must fund their growth opportunities with external equity. Our study
shows that small growth firms rely heavily on debt financing, and only resort to equity markets
when the cost of equity is low. This finding is consistent with the market timing theory rather
than the debt market constraints view. Furthermore, excluding small growth firms from our
sample does not change our qualitative results, although the magnitude of the change is reduced.
Mergers and acquisitions are frequent. Consistent with the market timing theory, firms
are less likely to make stock-financed acquisitions from 1974 to 1978 when the relative cost of
equity was high, and more likely to do so from 1996 to 2001 when the relative cost was low (see
also Dong, Hirshleifer, Richardson, and Teoh (2004), and Rhodes-Kropf, Robinson, and
Viswanathan (2004)). However, firms involved in mergers and acquisitions do not drive our
major results.
The static tradeoff theory stresses the role of target leverage in security issues and
buybacks. Changing target leverage could potentially lead to swings of financing activities. To
address this issue, we first estimate target leverage using lagged firm characteristics that are
identified by previous studies to be important determinants of capital structure. We then re-run
the pecking order tests controlling for partial adjustment toward target leverage. Consistent with
Shyam-Sunder and Myers (1999), these additional tests suggest that target leverage is of only
secondary importance in securities issue decisions.
Chirinko and Singha (2000) question the validity of Shyam-Sunder and Myers’ pecking
order tests. To gain more intuition for our regression results, we present scatter-plots of net debt
financing versus net external financing for selected years for which the pecking order slope
coefficient is especially strong or weak. We also conduct alternative tests. Using pre-issue firm
characteristics and market conditions, we estimate logit and multinomial logit regressions to
predict the propensity to issue equity. We find stronger support for the market timing theory
based on the relative costs of debt versus equity. Firms are more likely to issue equity instead of

6
debt when the implied equity market risk premium is lower, the first-day return of IPOs is
higher, the closed-end fund discount is smaller, prior (post) market returns are higher (lower),
prior (post) realizations of SMB are larger (lower), prior (post) realizations of HML are lower
(higher), and the expected default spread is higher, even after controlling for firm characteristics.
Lagged announcement effects of seasoned equity offerings are positively related to the
propensity to issue equity, but are less important economically and statistically, suggesting that
the assumption of semi-strong form market efficiency is questionable.
Some recent papers have examined whether historical securities issues have strong and
long-lasting effects on capital structure (e.g., Kayhan and Titman (2004)). We find that the
adjustment speed toward target leverage is slow, and past securities issues have strong and long-
lasting effects on capital structure, after controlling for firm characteristics that determine target
leverage.
The rest of this paper is organized as follows. Section 2 reviews the related literature.
Section 3 describes the data and summary statistics. Section 4 presents the empirical results.
Section 5 concludes.
2. Existing Capital Structure Research
In the perfect world of Modigliani and Miller (1958) with no frictions such as transaction
costs and taxes, capital structure is irrelevant. Various theories have been developed through
adding back frictions.
2.1. Static Tradeoff Theory
The static tradeoff theory focuses on the tradeoff between the cost of debt and the benefit
of debt. Evidence supporting the static tradeoff theory is mixed. On the one hand, evidence
suggests that target leverage, if it exists, is not important. Many studies find that higher
profitability leads to lower leverage, inconsistent with the tradeoff prediction that more profitable
firms should borrow more to reduce their tax liabilities (for example, Titman and Wessels
(1988), Rajan and Zingales (1995), and Fama and French (2002b)). Graham (2000) estimates the
cost and benefit of debt, and finds that large, liquid, profitable firms with low expected distress
costs use debt conservatively.2 One classic example is Microsoft, which has been very profitable
2 Graham (2003) reviews the literature on taxes and capital structure.

7
and has maintained a zero-debt policy. Surveyed corporate executives also indicate that their
target leverage is soft (Graham and Harvey (2001)). Jalilvand and Harris (1984) and Fama and
French (2002b) show that the speed of adjustment toward target leverage is slow. Welch (2004)
finds that prior stock returns are the main determinant of market leverage (leverage measured
using the market value of equity), and firms do not actively offset the effects of stock returns on
their capital structure.
On the other hand, several studies support the tradeoff theory. Marsh (1982),
Hovakimian, Opler, and Titman (1999), Korajczyk and Levy (2003), Hovakimian (2004), and
Hovakimian, Hovakimian, and Tehranian (2004) confirm the role of target leverage in security
issues and repurchases. Frank and Goyal (2004) examine the relative importance of 39 factors in
leverage decisions, and argue in favor of the tradeoff theory. Flannery and Rangan (2004)
disagree with Welch and find that firms quickly offset the effects of prior stock price movements
when target market leverage is allowed to vary with firm characteristics and firm fixed effects
are controlled for. Leary and Roberts (2004) show that firms are inactive with respect to their
financial policy most of the time, but do issue or buy back securities in clusters to adjust toward
target leverage. Hennessy and Whited (2004) and Strebulaev (2004) try to reconcile empirical
findings inconsistent with the tradeoff theory in a dynamic framework.
2.2. Pecking Order Theory
The pecking order theory is formally proposed in Myers (1984) and Myers and Majluf
(1984). In the theoretical framework of Myers and Majluf, investors are willing to buy risky
securities only at a discount because of the information asymmetry between managers and
outside investors. Expecting this problem, managers prefer internally generated funds. External
funds are raised only when internal funds are insufficient. When external funds have to be raised,
firms prefer straight debt, then convertible debt, with external equity issued as a last resort.
Although the information asymmetry in Myers and Majluf is one potential reason, the standard
pecking order may arise for other reasons. Donaldson (1961) cites transaction costs. The
preference for debt over equity could also be driven by managerial optimism (Lee (1997),
Heaton (2002), and Hackbarth (2003)). Optimistic entrepreneurs are unwilling to issue external
equity because they think their stock is undervalued. Graham (1999) finds that the majority of
corporate executives surveyed believed that their common equity was undervalued even when
the Dow was approaching 10,000 in 1999.

8
Empirical tests of the pecking order theory only started to receive attention more than ten
years after the theory was formally proposed. Helwege and Liang (1996) find that the decision to
raise external capital is unrelated to the shortfall in internally generated funds for a sample of
firms that went public in 1983, inconsistent with the pecking order theory. Shyam-Sunder and
Myers (1999) provide an influential empirical test of the pecking order theory against the
tradeoff theory. Using a sample of 157 firms that had traded continuously from 1971 to 1989,
they find that the basic pecking order model, which predicts external debt financing driven by the
financing deficit, has much greater explanatory power than the static tradeoff model. Chirinko
and Singha (2000) question the validity of the simple pecking order tests of Shyam-Sunder and
Myers by showing that the tests may generate misleading inferences when evaluating plausible
patterns of external financing. Fama and French (2002b) find that more profitable firms are less
levered, consistent with the pecking order model. Frank and Goyal (2003) extend the pecking
order tests for a much larger sample of U.S. firms, and find that net equity issues track the
financing deficit more closely, especially in the 1990s. Lemmon and Zender (2002) argue that
the large proportion of debt-constrained small growth firms weakens the standard pecking order
in the 1990s. Fama and French (2004) challenge the pecking order theory by showing that firms
frequently issue and repurchase equity. They suggest that external equity can be raised with
financing tools that involve less information asymmetry.
Under the pecking order theory, on average any misvaluation is corrected at the
announcement of equity issuance. If this is true, then time-varying announcement effects of
seasoned equity offerings should help explain time-varying financing activities. Consistent with
this conjecture, Choe, Masulis, and Nanda (1993), Bayless and Chaplinsky (1996), and
Korajczyk and Levy (2003) find that firms are more likely to conduct seasoned equity offerings
when the announcement effects are less negative.
2.3. Market Timing Theory
The static tradeoff theory and the pecking order theory implicitly assume semi-strong
form market efficiency. What if capital markets are inefficient? If firms seek to minimize their
cost of capital, market inefficiencies have important implications for corporate financing (Stein
(1996)). A large literature on long-run stock performance suggests market inefficiency at the
firm level (Loughran and Ritter (1995), Spiess and Affleck-Graves (1995), Ikenberry,

9
Lakonishok, and Vermaelen (1995), Loughran and Vijh (1997), Billett, Flannery and Garfinkel
(2001), and Hertzel, Lemmon, Linck and Rees (2002)).3
Several studies also suggest market inefficiency at the industry level and the market
level. Loughran, Ritter, and Rydqvist (1994) document IPO clustering for 15 countries, and find
that IPO volume is positively correlated with the inflation-adjusted level of the stock market in
14 of them. Pagano, Panetta, and Zingales (1998) note that the most important determinant of
Italian firms’ going-public decision is the industry’s market-to-book ratio. They argue that the
ratio is a proxy for mispricing as well as growth opportunities. Baker and Wurgler (2000) find
that the share of equity in aggregate securities issuance predicts aggregate stock-market returns.
Lowry (2003) shows that the volume of IPOs is partly determined by proxies for investor
sentiment.
In practice, corporate executives seem to actively engage in market timing in their
financing decisions. Two-thirds of corporate executives agree that “the amount by which our
stock is undervalued or overvalued was an important or very important consideration” in equity
issue decisions in surveys by Graham and Harvey (2001).
The key difference between the pecking order theory and the market timing theory is
whether the assumption of semi-strong form market efficiency is maintained. The pecking order
theory assumes markets are semi-strong efficient, thus the announcement effect of securities
issues is the primary proxy for the degree of information asymmetry. The market timing theory
does not rely on the assumption of semi-strong form market efficiency. Windows of opportunity
exist as long as the relative cost of equity varies over time for either rational or irrational reasons.
Most of the literature relies on realized returns to estimate the cost of equity. However,
Fama and French (1997) conclude that the estimation of the cost of equity using realized returns
is “unavoidably imprecise” because of the difficulty in identifying the right asset-pricing model
and the imprecision in the estimation of factor loadings and factor risk premia. Furthermore,
what happened in the past does not necessarily repeat itself in the future. An alternative approach
estimates the implied equity risk premium with valuation models using accounting fundamentals
(for example, Claus and Thomas (2001), Gebhardt, Lee, and Swaminathan (2001), Ritter and
Warr (2002), and Fama and French (2002a)). Although there could be plausible rational and
irrational explanations for the time-variation in the expected equity risk premium, academics
3 See Table 5 in Ritter (2003) for a summary of recent studies in this area.

10
tend to agree that the expected equity risk premium has declined over the last several decades.
The market timing theory simply argues that the time-variation in the relative cost of equity,
whether it is due to rational or irrational investors, has important implications for capital
structure choices.
Only recently has empirical work started to directly link the cost of equity to capital
structure. Baker and Wurgler (2002) find that an external finance-weighted average of historical
market-to-book ratios is negatively related to current market leverage, and they interpret this as
evidence for market timing. Aydogan (2004), Hovakimian (2004), and Kayhan and Titman
(2004) confirm the existence of market timing for securities issuance, though they disagree with
Baker and Wurgler on the persistence of the effect of market timing on capital structure.
3. Data and Summary Statistics
3.1. Data
The firm-level data are from CRSP and Compustat. The sample consists of firms from
1963 to 2001. To be included in the sample for calendar year t, a firm must have total assets
(Compustat item 6), total liabilities (181) and retained earnings (36) for the fiscal years ending in
calendar years t-1 and t. Firms must also have CRSP share codes of 10 or 11, and stock price
(199) and shares outstanding (25) for the fiscal year ending in calendar year t-1 to ensure that
they are publicly traded. IPO firms are thus excluded from the sample until their second fiscal
year as a publicly traded firm. Missing R&D (46), capital expenditures (30), and convertible debt
(79) are set to zero to avoid losing most observations in the analyses.
Utilities (4900-4949) and financial firms (6000-6999) are excluded because they were
regulated during most of the sample period. A small number of firms with a format code of 4, 5,
or 6 are also excluded from the sample.4 Firm years with beginning-of-year book assets of less
than $10 million, measured in terms of 1998 purchasing power, are also excluded to reduce the
effect of outliers and eliminate very small firms. Finally, we exclude firm-year observations
4 Format code 5 is for Canadian firms, and format codes 4 and 6 are not defined in Compustat.

11
where there was an accounting change for adoption of Statement of Financial Accounting
Standards (SFAS) No. 94.5
3.2. Summary Statistics of Firm Characteristics
Summary statistics of firm characteristics are presented by year because we analyze the
time-series properties of financing activities. Figure 1 presents financing activities using
information from the balance sheet. Net debt is defined as the change in book debt. Net equity is
defined as the change in book equity minus the change in retained earnings. Following Baker and
Wurgler (2002) and Fama and French (2002b), book debt is defined as total liabilities plus
preferred stock (10) minus deferred taxes (35) and convertible debt (79), and book equity is total
assets less book debt.6
In Figure 1, the average ratios are the annual averages of net financing scaled by
beginning-of-year assets (in percent), and the aggregate ratios are the annual aggregate amount
of net financing of all firms scaled by the aggregate amount of beginning-of-year total assets (in
percent). The average ratios weigh small firms heavily, while the aggregate ratios weigh large
firms heavily. Focusing on the average ratios misses the economic significance of large firms,
while focusing on the aggregate ratios misses the financing behavior of small firms. The average
net debt increase exceeded 10 percent of beginning-of-year assets in 1966, 1968, 1973-74,
1978-79, and 1997-98. The average net equity issuance exceeded six percent in 1969, 1983, and
1992-2001. The pecking order theory gains some support during 1974-78, when the average
percent of net equity issuance was below two percent. The aggregate amount of net debt issuance
exceeded seven percent of the aggregate assets in 1966-68, 1974, 1978-79, 1989, and 1998-2000.
The aggregate amount of net equity issuance exceeded two percent in 1966, 1969, 1980-81,
1983, and 1996-2001.
5 We exclude 201 such firm years identified with Compustat footnote codes. The FASB issued SFAS No. 94 in late 1987. Heavy equipment manufacturers and merchandise retailers were most affected by the standard, because they made extensive use of unconsolidated finance subsidiaries. For example, Ford, General Motors, General Electric, and International Business Machines all had a huge increase in debt on their balance sheet from fiscal year 1987 to 1988. More specifically, Ford had a debt increase of about $93.8 billion while its end-of-year total assets were $45.0 billion in 1987 and $143.4 billion in 1988, largely because Ford Credit was consolidated under the new standard. This standard also caused some firms to divest themselves of unconsolidated subsidiaries, because otherwise they would violate debt covenant agreements on the maximum amount of leverage, and their return on assets would appear too low and financial leverage would appear too high. It is desirable for future empirical studies of capital structure using lagged accounting variables to remove the inconsistencies due to accounting changes, discontinued operations, acquisitions or divestures. 6 When preferred stock is missing, it is replaced with the redemption value of preferred stock (56). When the redemption value is also missing, it is replaced with the carrying value of preferred stock (130).

12
The pecking order theory predicts that equity issues should be rare. However, during
most years from 1991 to 2001, the average ratio of net equity issuance was more than the
average ratio of net debt issuance, inconsistent with the pecking order theory. Even at the
aggregate level, net equity issuance was over four percent of assets in 1999, and over seven
percent of assets in 2000.
Figure 1 uses information from the balance sheet. Alternatively, the financing deficit and
net security issues and buybacks can be defined using information from the statement of cash
flows (Fama and French (2002b), Lemmon and Zender (2002), and Frank and Goyal (2003)).
One problem with this approach is that non-cash transactions, such as stock-finance acquisitions
and exchange offers, do not show up in the statement of cash flows.7
Figure 2 presents financing activities using information from the statement of cash flows
to get a sense of how much the statement of cash flows understates security issues and buybacks.
The difference between the balance sheet and the statement of cash flows is large. For example,
in 2000, the average percent of net equity peaked at about 12 percent in Figure 2, compared with
about 20 percent in Figure 1. In Figure 1, the aggregate percent of net equity to assets peaked at
7.2 percent in 2000, while it was only 0.5 percent in the same year in Figure 2. Because of the
difference between the balance sheet and the statement of cash flows, we check our results in
section 4 using the statement of cash flows in unreported analyses. No major results are affected.
Figures 1 and 2 understate net security issues and buybacks because they are mixed
together. For example, the average percent of net equity can be near zero if net equity
repurchases by some firms offset net equity issues by other firms. Table 2 separates net security
issues from net security buybacks. Once we separate net security issues from net security
buybacks, we see much more frequent financing activities. The proportion of firms with net debt
issuance of at least five percent of assets was never below 28 percent. The pecking order theory
predicts the rarity of equity issues. However, the proportion of equity issuers (firms issuing at
least five percent of assets) never drops below 6.6 percent in any year, peaks at over 34 percent
in 1969, and is at least 25 percent from 1995 to 2001.
Since small growth firms are more likely to require external funds, we also present the
proportions of debt and equity issuers for small growth firms. We annually sort all NYSE listed
7 For example, Apple Computer issued common equity of $654 million, about 15 percent of its beginning-of-year assets of $4.3 billion, for redemption of its long-term debt in 1999. This transaction showed up on its balance sheet, but did not show up on its statement of cash flows.

13
firms by total assets and use the quartile cutoff points to categorize firms in our sample into four
size groups. We also sort all NYSE-listed firms by asset growth and use the quartile cutoff points
to categorize all our sample firms into four growth groups. In each year, small growth firms are
defined as those in both the bottom size quartile and the top asset growth quartile. Small growth
firms rely heavily on external debt. During all years, over 66 percent of them raised external debt
of at least five percent of beginning-of-year assets. However, small growth firms do not always
rely on external equity. Less than 17 percent of them raised equity of at least five percent of
assets in each of the years 1974-77 (cold equity markets), while more than 50 percent of them
did so each year in 1968-69, 1983, 1992-93, and 1995-2001 (hot equity markets).
The financing method of mergers and acquisitions is relevant for capital structure
choices. In the last three columns of Table 2, we present the percent of debt and equity issues for
firms involved in mergers and acquisitions identified with Compustat footnote codes.8 More than
800 firms were involved in mergers and acquisitions during each of the years from 1995 to 2001.
The balance sheet approach defines debt and equity issues using the difference between end-of-
year and beginning-of-year assets. Different accounting practices for mergers and acquisitions
may lead to complications for this definition.9 However, it is still informative to see how the
balance sheet changes when a merger or acquisition occurs. Around mergers and acquisitions,
over 50 percent of firms have a net debt increase of at least five percent of beginning-of-year
assets in each year of our sample period. Over 40 percent of them have a net equity increase of at
least five percent in each of the years 1968-69 and 1992-2001. At the other extremity, less than
18 percent of them do so each year from 1974 to 1977. Firms seem to be more likely to fund
mergers and acquisitions with net equity issuance when equity market valuation is high,
consistent with the evidence in Loughran and Vijh (1997).
Table 3 reports the median firm characteristics for all firms in our sample. The median
asset growth, net sales growth, and capital expenditures do not show a clear time trend. The
median total assets, net sales, profitability, and tangibility have declined over time, partly
because of the failure of Compustat to cover many smaller firms at the beginning of our sample
8 Compustat footnote codes AA, AB, AR, AS, FA, FB, FC, FD, FE, and FF are used to identify all major and minor mergers or acquisitions. Compustat defines a merger or acquisition as a major one (footnote code AB) if the effects on the prior year’s sales constitute 50 percent or more of the reported sales for that year. 9 The pooling of interest method combines the balance sheet of the acquirer and the target. The purchase method adds the payment to both sides of the balance sheet of the acquirer. In practice, the two methods can be used in combination.

14
period in the 1960s. The market-to-book ratio for assets, often used as a proxy for Tobin’s Q, is
defined as market assets to book assets. It was below one from 1973 to 1979 and above one
during other years.
Figure 3 plots the median book and market leverage. Book leverage is defined as book
debt to book assets. Market leverage is defined as book debt to market assets. The median book
leverage is quite stable, hovering around 45 percent with a slight uptrend. The median market
leverage, however, fluctuates over time. It was below the median book leverage in the 1960s,
above the median book leverage in most of the 1970s, and below the median book leverage in
the 1980s and the 1990s. This pattern is consistent with Welch’s (2004) finding that firms do not
quickly rebalance away the effects of stock returns on their market leverage.
Overall, our summary statistics of firm characteristics are consistent with other studies
(Fama and French (2002b), Fama and French (2004)) that cast doubt on the pecking order theory
as a theory that is capable of describing most of observed capital structures and call for an
alternative explanation for changing financing activities.
3.3. Summary Statistics of Time-Series Variables
Table 4 reports summary statistics of time-series variables. Our first proxy for the cost of
equity is the lagged implied equity market risk premium, estimated using analyst forecasts at the
year-end for the 30 stocks in the Dow Jones Industrial Average.10 The implied equity risk
premium is defined as the internal rate of return that equates the current stock price to the present
value of all future cash flows to common shareholders of the firm, minus the risk-free rate (the
return on one-month Treasury bills from Ibbotson Associates). The equally weighted average of
the implied equity premium for each of the Dow 30 stocks is used as an estimate of the equity
risk premium for the market. The time-variation of the implied equity risk premium may be due
10 By using the lagged year-end values, we are using the Dec. 31 of year t-1 accounting information and stock price during year t for a firm with a Dec. 31 fiscal year. For a firm with a June 30 fiscal year, we use the June 30 of year t-1 accounting information and Dec. 31 of year t-1 stock price during year t. Our study closely follows Ritter and Warr (2002) and corrects for inflation-induced distortions in the estimation of the implied equity risk premium. We use forecasts from Value Line for 1968-1976 and from I/B/E/S for 1977-2001. We hand-collected Value Line data from Value Line Investment Survey for early years when the I/B/E/S database was not available. Because previous studies document that I/B/E/S and Value Line analysts make systematically different forecasts, we estimate the implied equity risk premium for 1977 using analyst forecasts from both sources and then adjust the implied equity risk premia for 1968-1976 by multiplying the ratio of the 1977 premium using I/B/E/S and the 1977 premium using Value Line. Brav, Lehavy, and Michaely (2003) estimate the implied equity risk premium using target prices and future dividends from Value Line for 1975-2001. Using their series instead does not change our major results.

15
to either the time-variation of risk aversion of investors (a rational reason) or the time-variation
of investor sentiment (an irrational reason).
If investors occasionally become overly optimistic, then the cost of equity for firms is
low when this occurs. The average first-day return of IPOs and the closed-end fund discount are
two well-known proxies for investor sentiment. The first-day returns of IPOs are sensitive to
investor sentiment because IPO firms have no observable market price prior to the offering, and
many of them have little operating history and face a lot of uncertainties (Ibbotson, Sindelar, and
Ritter (1994), and Lowry and Schwert (2002)).
The discount on a closed-end fund is the difference between its net asset value (NAV)
and market price as a fraction of its NAV. The average discount is the value-weighted average of
discounts on closed-end funds.11 Lee, Shleifer, and Thaler (1991) find that closed-end funds are
mostly held by individual investors, and argue that investor sentiment explains much of the
variation of the discount. When their sentiment is high, investors pay relatively more for shares
of closed-end funds, and the discount is smaller.
We use realized returns as alternative proxies for the cost of equity. Lowry (2003) uses
future market returns as a proxy for investor sentiment and finds that there is a negative relation
between IPO volume and future market returns for the U.S., a pattern also documented by
Loughran, Ritter, and Rydqvist (1994) for nine out of 13 other countries. If the cost of equity
falls, then future stock-market returns should be low. Marsh (1982), Korajczyk, Lucas, and
McDonald (1990), Loughran and Ritter (1995), and others document that aggregate equity
issuance is positively related to past stock-market performance. Although there are other possible
explanations, past market returns may reflect changes in the cost of equity. A stock market
run-up may occur if the equity premium falls.
We also include the lagged realizations of the value effect and the size effect. The value
effect is defined as the difference in the average return on portfolios of value stocks and
portfolios of growth stocks (HML), and the size effect is defined as the difference in the average
return on portfolios of small stocks and portfolios of big stocks (SMB). The value effect may
capture investor sentiment toward growth stocks. If investors become overly optimistic about
growth firms following strong performance of growth stocks, then growth firms are more likely
to issue equity and their subsequent performance should be poor. Similarly, the size effect may
11 We thank Jeffrey Wurgler for providing the average discount on closed-end funds.

16
measure investor sentiment toward small stocks. Since the majority of stocks are small (relative
to the median NYSE firm), we expect that in our regressions, where all firms are weighted
equally, high realizations of SMB will be associated with more external equity financing in the
next year.
We further include the lagged average announcement effect in our regressions to see
whether the pecking order theory is able to explain time-varying financing activities with time-
varying information asymmetry.
Our control variables include contemporaneous measures of inflation, the statutory
corporate tax rate, the real GDP growth rate, and the lagged default spread. The statutory
corporate tax rate has changed over time and may have a major influence on financing decisions
of U.S. firms.12 The real GDP growth rate controls for growth opportunities. The default spread,
defined as the yield difference between Moody’s Baa rated and Aaa rated corporate bonds at the
year-end, is used as a proxy for time-varying bankruptcy costs of debt.
Inflation, measured using the Consumer Price Index, and the real rate of GDP growth are
plotted in Figure 4. Inflation was below seven percent during the 1960s, rose above eight percent
during 1973-74 and 1978-81, and then fell below seven percent during 1982-2001, a long period
of low inflation. Inflation peaked at over 13 percent in 1979, and bottomed out at about one
percent in 1964 and 1986. The real rate of GDP growth ranges from -2 percent in 1982 to over
seven percent in 1984.
Figure 5 shows the equity market risk premium and the default spread at the end of each
calendar year. The equity risk premium fluctuates dramatically, while the default spread shows
less fluctuation. The implied equity risk premium turned negative from 1996-2001, suggesting
overvaluation of the stock market.
The average first-day return of IPOs and the closed-end fund discount are plotted in
Figure 6. The average first-day return of IPOs fluctuates dramatically, ranging from –1.7 percent
in 1975 to 69.5 percent in 1999. The historical low of the closed-end fund discount was -10
percent in 1969, and the historical high was 24 percent in 1975. These figures suggest that the
implied equity market risk premium is positively correlated with the closed-end fund discount,
and is negatively correlated with the average first-day return of IPOs. In 1974, when the implied
12 The statutory corporate tax rate was 52 percent in 1963, 50 percent in 1964, 48 percent from 1965-67, 52.8 percent from 1968-69, 49.2 percent in 1970, 48 percent from 1971-78, 46 percent from 1979-86, 40 percent in 1987, 34 percent from 1988-92, and 35 percent from 1993-2001.

17
equity market risk premium peaked at 11.4 percent, the closed-end fund discount was around 23
percent, while the average first-day return of IPOs was near zero. In 1999 when the implied
equity premium dropped below negative four percent, the average first-day return of IPOs
reached over 69 percent. The closed-end fund discount, however, was near its unconditional
average at the end of 1999.
4. Empirical Results
This section reports and discusses the results from pecking order regressions for the
proportion of the financing deficit funded with net debt, time-series regressions linking the
pecking order slope coefficient to the time-varying cost of equity, logit regressions for the choice
between debt and equity issues, multinomial logit regressions for the joint decision of whether to
issue securities and which security to issue, and Fama-MacBeth regressions for the effects of
past securities issues.
4.1. Pecking order Tests
Following Shyam-Sunder and Myers (1999), we first estimate
ititttit uDEFbaD ++=∆ , (1)
where �Dit is the change in book debt scaled by beginning-of-year assets for firm i at the end of
the fiscal year ending in calendar year t, and DEFit is the change in assets minus the change in
retained earnings scaled by beginning-of-year assets. Instead of pooling all firm years together,
we estimate this equation each year and report the results in Table 5. The estimated coefficient,
b̂ , shows very interesting time-series patterns. It ranges from 0.67 to 0.92 in the 1960s and the
1970s, from 0.48 to 0.79 in the 1980s, and from 0.27 to 0.58 from 1990 to 2001. Frank and
Goyal (2002) find that the coefficient was low in the 1990s as well. However, a time trend does
not explain everything. Even within each decade, there are ups and downs which need to be
explained.
Figure 7 plots the estimated pecking order coefficient. Comparing Figure 7 with Figures
5 and 6, it is not difficult to see that the pecking order coefficient is positively correlated with
lagged values of the implied equity risk premium and the closed-end fund discount, and
negatively correlated with the lagged average first-day return of IPOs.

18
In Table 6, the time-series of the slope coefficient is linked to cost-of-equity proxies by
estimating the following equation:
) variablescontrol proxies,equity ofcost (ˆ fbt = . (2)
If the cost of equity varies over time, then firms are more likely to issue equity when the cost of
equity is relatively low, and the pecking order slope coefficient, b̂ , will be smaller. Our proxies
for the cost of equity are highly correlated, so we do not include all of them in one regression to
avoid potential multicollinearity. We also include an autoregressive term to control for residual
serial correlation.
The results provide relatively strong support for the market timing theory. Firms finance
a large proportion of their financing deficit with net external equity when the cost of equity is
low. Six specifications are reported. In specification (1), the lagged implied equity risk premium
is positively related to the pecking order coefficient. In economic terms, a one-standard-deviation
increase (or 3.7 percent) in the implied equity risk premium is associated with 10.1 percent more
of the financing deficit being funded with net debt (for example, from 40 percent to 50.1
percent). The lagged average first-day return of IPOs is used as an alternative proxy for the cost
of equity in specification (2). A one-standard-deviation increase in the lagged average first-day
return of IPOs results in 7.2 percent less of the financing deficit being funded with net debt.
When the closed-end fund discount is included in (3), it has the expected sign, but the relation is
not statistically significant at conventional levels.
Realized EW stock market returns are included in specification (4). Firms tend to fund a
smaller proportion of their financing deficit with net debt after stock market price run-ups and
before market downturns, though neither lagged nor future realized returns are statistically
significant at conventional levels. The statistical insignificance does not lead us to reject the
importance of the cost of equity, however. Realized return is a noisy proxy for the expected cost
of equity, because it might be difficult for arbitrageurs to eliminate low-frequency market-level
misvaluations (Shleifer and Vishny (1997)).
In specification (5), firms fund a larger proportion of their financing deficit with net
equity after strong performance and before poor performance of growth stocks. A one-standard
deviation change in HML is associated with around a 3.5 percent change in the proportion of
financing deficit being funded with debt. The size effect also has the expected sign, but is not
statistically significant.

19
Specification (6) includes the average announcement effect of SEOs as an explanatory
variable. Its sign is consistent with previous studies, but the relation is not economically or
statistically significant, suggesting that announcement effects are of secondary importance, and
other factors such as equity market valuation are more important in equity issue decisions.
Focusing on the control variables, firms fund a larger proportion of their financing deficit
with net debt when the corporate tax rate is higher. The tax rate effect is weaker in specification
(1) because the time trend in the corporate tax rate is highly correlated with the equity risk
premium (�=0.71 in Table 4). The real GDP growth rate and the business expansion dummy are
never significant at the 10 percent level, suggesting that investment opportunities do not drive
the changing financing behaviors. We do not expect inflation to have an impact on the choice
between debt and external equity if it is neutral. However, inflation may have real implications,
perhaps due to tax reasons. If inflation is positively related to the relative cost of equity versus
debt, then firms are expected to issue more debt in the presence of high inflation. This is indeed
what we reliably find in specifications (2), (4), and (5). The expected default spread is never
significant, possibly because the cost of debt does not vary as much as the cost of equity.
Since small growth firms are more likely to be outliers and could potentially have a large
influence on the pecking order slope coefficient, in unreported results we re-estimate equations
(1) and (2) excluding small growth firms. We also exclude firms involved in mergers and
acquisitions to check whether they drive our results. The results, which are available on request,
are the essentially same.
In the above analysis, we first estimate the pecking order slope coefficient each year, and
then link the slope coefficient to the time-varying relative cost of equity. Instead of the two-step
approach, we also estimate for all years a firm fixed-effects regression where the dependent
variable is the net debt issuance and the independent variables are the financing deficit and the
interactions of the financing deficit and macro variables. We do not report the results because
they are similar to what we find with the two-step approach.
The pecking order test implicitly assumes that real investment needs are exogenous. It
could be argued that investing and financing activities are jointly determined (Hennessey and
Whited (2004)). To remove potential endogeneity, we use the lagged financing deficit as an
alternative measure for the expected financing deficit in unreported analyses. Our major results
do not change.

20
Since firm characteristics have changed substantially over time, target leverage should
have also changed over time under the static tradeoff theory. Can the time-series patterns of
financing activities be explained by time-varying target leverage?
We estimate, annually, the pecking order equation with partial adjustment:
ititittitttit uLTLcDEFbaD +−++=∆ − )( 1 , (3)
where TLit is the fitted value for firm i at the end of the fiscal year ending in calendar year t from
target book leverage regression (1) in Table A1. We also try using target leverage estimated
using other regressions in Table A1, and the major results are not affected.
Table 7 reports the results. Partial adjustment indeed occurs in most years. However, the
adjustment coefficient is below 12 percent for all years, suggesting that the adjustment speed is
slow. During 1995-2001, the partial adjustment coefficient becomes negative, inconsistent with
partial adjustment. Furthermore, the t-statistics for the adjustment coefficients are small. The
pecking order coefficients, however, have much larger t-statistics. Shyam-Sunder and Myers
(1999) report similar results, leading them to question the importance of the static tradeoff
theory. After controlling for partial adjustment toward target leverage, we once again link the
pecking order coefficient to proxies for the cost of equity. Table 8 reports the results. Firms still
prefer debt when the cost of equity is high and prefer equity when the cost of equity is low. The
statistical and economic significance is still very impressive. These results should not be
surprising, given that the only difference between Tables 6 and 8 is that Table 8 controls for
partial adjustment, and this effect is quite modest.
4.2. Scatter-Plots
The regression approach has both advantages and disadvantages. The advantages include
the summarization of information in the pecking order coefficient, the convenience for analyzing
a large number of firms, and the convenience for controlling for other factors in a multivariate
framework. The disadvantages include the large influence of a few outliers and the
oversimplification of information. Consequently, we present additional checks.
Figure 8 shows different scenarios of net external financing. If a firm funds 100 percent
of its financing deficit with net debt, then it should lie on the 45-degree line. A firm with
negative net equity issuance should lie on the left hand side of the 45-degree line, while a firm
with positive net equity issuance should lie on the right hand side of the 45-degree line.

21
To gain additional insight, we randomly select 100 firms each year and draw a
scatter-plot. We limit the number of randomly selected firms to only 100 per year because a
larger number makes it difficult to visually identify meaningful patterns. We report the
scatter-plots for only six years in Figure 9 because those for other years with similar slope
coefficients are qualitatively the same. In 1975, when the slope coefficient is 0.909, only a small
number of firms deviate from the 45-degree line. In 2000, however, around 20 percent of the
points are to the far right of the 45-degree line. These firms raise a lot of equity to finance their
financing deficit or to retire debt. Only a few firms are noticeably to the left of the 45-degree
line, suggesting that firms only infrequently repurchase shares in a quantitatively important
manner.
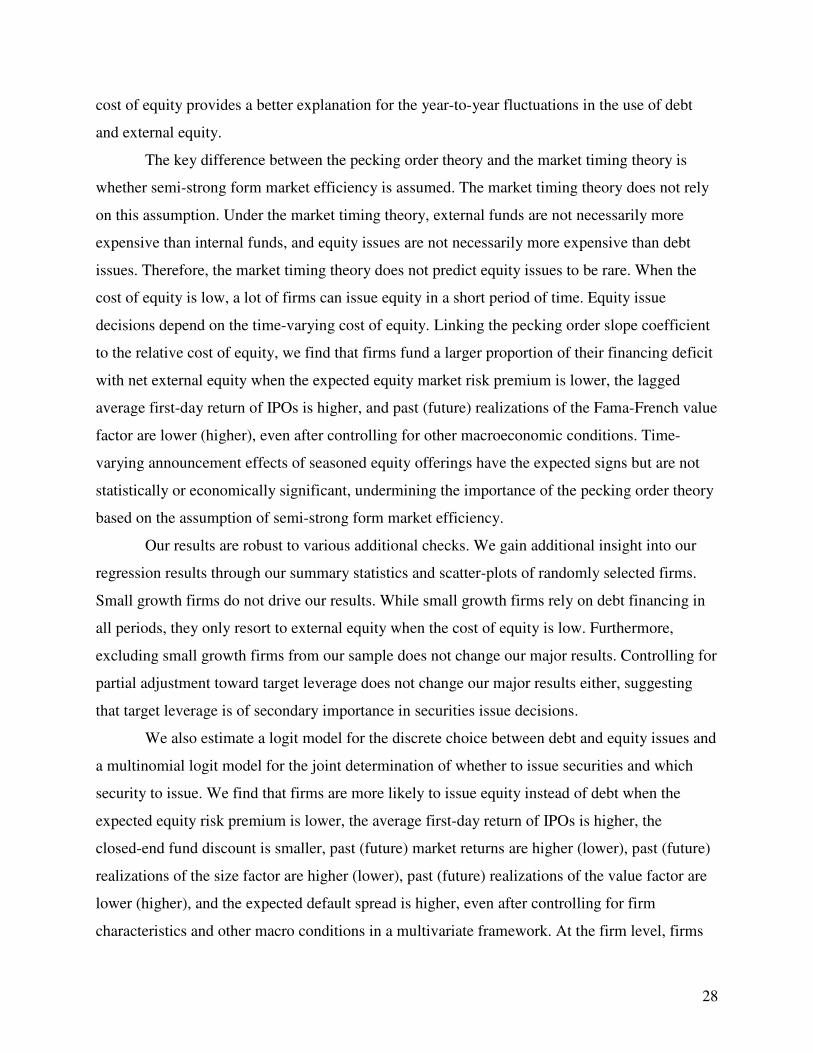
4.3. Logit Model for the Choice between Debt and Equity
Since Chirinko and Singha (2000) point out that the pecking order tests may generate
misleading inferences, we try alternative tests for the market timing theory. Instead of estimating
the pecking order equation to examine continuous financing decisions for all firms, we focus on
the subsample of firms that have issued a significant amount of debt or equity and estimate a
logit regression for the discrete choice between debt and equity issues, using pre-issue firm
characteristics and market conditions. We estimate pooled logit regressions for all firm years.
When we instead estimate firm fixed-effects regressions in unreported analyses, our major
results are not affected.
The dependent variable equals one if the firm issues external equity, and equals zero if
the firm issues debt. We follow Hovakimian et al. (2001) and Korajczyk and Levy (2003) in the
use of the five percent rule to define debt and equity issues. A firm is defined as issuing debt if
net debt is at least five percent of its beginning-of-year assets. Similarly, a firm is defined as
issuing equity if net equity is at least five percent of its beginning-of-year assets.13
The explanatory variables include financial slack (the sum of cash and short-term
investments scaled by assets), a dummy for whether the firm pays dividends, profitability, Q
(market-to-book ratio for assets), R&D, the logarithm of net sales, the logarithm of the number
of years the firm has been listed on CRSP, the leverage deficit, lagged leverage, the
market-adjusted return during the previous fiscal year, and the market-adjusted return during the
13 For convenience, firm years when both debt and equity are issued are excluded in the logit regressions.

22
three following fiscal years.14 The leverage deficit is defined as the fitted value from target
leverage regression (1) in Table A1 minus lagged leverage. In addition to firm characteristics, we
also include our proxies for the relative cost of equity and macro conditions.
The results are reported in Table 9. In all specifications, small, high Q, and high R&D
firms are more likely to issue equity, consistent with the existing literature. Firms with more cash
on hand and non-dividend payers are more likely to issue equity rather than debt.
The static tradeoff theory predicts firms with a large leverage deficit, defined as the
difference between target leverage and lagged leverage, will issue debt to adjust toward their
target leverage. Surprisingly, we find that firms with a large leverage deficit are more likely to
issue equity. When we use the industry median leverage as target leverage instead to define the
leverage deficit in unreported analyses, however, firms with a large leverage deficit are more
likely to issue debt. This is partially consistent with Hovakimian et al. (2001), who find that the
median industry leverage is more important than the estimated target leverage in securities issue
decisions.
Consistent with the existing literature, firms are more likely to issue equity following
stock price run-ups. Consistent with the long-run performance studies of SEOs by Loughran and
Ritter (1995) and Spiess and Affleck-Graves (1995), firms that subsequently underperform are
more likely to issue equity instead of debt. In contrast, Jung, Kim, and Stulz (1996) do not find
any statistical significance of the post-issue return for a small sample of U.S. firms from 1977 to
1984. The difference arises partly because the sample employed in our study is larger than their
sample. Since the post-issue return is a noisy measure of misvaluation, only a large sample is
able to detect any statistically significant relation. The important role of Tobin’s Q, the pre-issue
market-adjusted firm return, and the post-issue firm return in the choice between debt and equity
issues is supportive of the market timing theory at the firm level.
Unlike most of the literature, we are also interested in examining the role of the relative
cost of equity at the market level. All our cost-of-equity proxies are statistically significant and
have the expected sign, even after controlling for firm characteristics. Since we have at most 39
data points for these variables, it is amazing that their statistical significance is comparable to
that of firm specific characteristics. In economic terms, an increase of one standard deviation in
the implied equity risk premium and the closed-end fund discount reduces the average propensity
14 Excluding the market-adjusted return during the three following fiscal years does not change our major results.

23
to issue equity by 2.1 percent in specification (1) and by 3.7 percent in (3), respectively, while an
increase of one standard deviation in the lagged average return of IPOs increases the propensity
by 3.7 percent in (2).
Although realized returns are insignificantly related to the pecking order slope
coefficient, they are significantly related to the propensity to issue equity at the one percent level.
In specification (4), firms are more likely to issue equity following stock market run-ups. The
propensity to issue equity increases by 2.3 percent per standard deviation increase in the
pre-issue market return. The importance of past market returns is consistent with the market
timing theory. The average propensity to issue equity decreases by 2.3 percent per standard
deviation increase in the post-issue market return. Neither the static tradeoff theory nor the
pecking order theory can explain this.
In specification (5), past realizations of the Fama-French size factor are positively related
to the propensity to issue equity, while future realizations are negatively related. Past realizations
of the value factor are negatively related to the propensity to issue equity, while future
realizations are positively related.
In specification (6), confirming Bayless and Chaplinsky (1996), the average
market-adjusted announcement effect of SEOs is positively related to the propensity to issue
equity. However, in terms of economic significance, the propensity to issue equity increases by
only 1.7 percent per standard deviation increase in the average announcement effect.
Surprisingly, although the statutory corporate tax rate is positively related to the
proportion of the financing deficit being funded with net debt, it has a very modest impact on the
discrete choice between debt and equity issues. There is a negative relation between inflation and
the propensity to issue equity in each specification. In specification (1), the propensity to issue
equity decreases by 3.6 percent per standard increase in the rate of inflation. The importance of
inflation suggests that inflation is not neutral and is linked to the relative cost of equity versus
debt. The coefficient on the lagged default spread is significant and positive, consistent with
Korajczyk and Levy (2003). Economically, a one-standard-deviation increase in the lagged
default spread raises the propensity to issue equity by 2.5 percent in specification (1).
Overall, the logit regression results are supportive of the market timing theory. The
choice between debt and equity depends largely on the relative cost of equity versus debt, even
after controlling for firm characteristics. It is difficult to explain all these results simultaneously

24
unless the relative cost of equity varies across time, and firms take advantage of this in their
securities issue decisions.
4.4. Multinomial Logit Model for the Joint Decision
A firm may jointly decide whether to issue securities and which security to issue. For
example, it is possible that a firm chooses between issuing equity and not issuing any securities,
without even thinking of issuing debt. Therefore, we also estimate a multinomial logit model for
the joint decision. The dependent variable equals two if the firm issues equity, one if the firm
issues debt, and zero if the firm issues neither equity nor debt. We use non-issuers as the base
category. 15
Table 10 reports the results, which are generally in line with the logit regression results.
However, it is interesting to note that some variables are more important for the decision to issue
equity, while others are more important for the decision to issue debt. Therefore, our motivation
for estimating the multinomial logit model is justified. Future studies of financing decisions
should consider the joint determination of whether to issue any securities and which security to
issue.
Consistent with the pecking order prediction, firms with a lot of cash on hand avoid
issuing securities, especially debt, and dividend payers also avoid issuing securities. These firms
have less need for external funds. The coefficients on Tobin’s Q are all significant and positive
for the decision to issue securities, especially equity. Profitable firms are less likely to issue debt,
contrary to the static tradeoff prediction that these firms should issue debt to reduce agency costs
and tax liabilities. Small and high R&D firms are more likely to issue equity, but are less likely
to issue debt. The coefficients on AGE are all significant and negative, suggesting that young
firms rely more on external funds.
Firms with a large leverage deficit are less likely to issue debt and more likely to issue
equity. This is not predicted by the tradeoff theory. Firms that have recently experienced a stock
price run-up are more likely to issue securities, especially equity. Unlike most of the literature,
our study has included subsequent market-adjusted firm returns in our regressions. Firms that
subsequently underperform are more likely to issue equity. In contrast, there is no statistically
significant relation between debt issuance and subsequent market-adjusted returns.
15 For convenience, firm years when both debt and equity are issued are excluded in the logit regressions and the multinomial logit regressions. The major results are the same when they are included. For characteristics of firms issuing both debt and equity, see Hovakimian et al. (2004). We keep these firms in other analyses.

25
The multinomial logit results provide stronger support for the market timing theory. In all
specifications, Tobin’s Q and pre-issue market-adjusted returns have much larger t-statistics than
other variables in the decision to issue equity. The subsequent market-adjusted return also has a
large t-statistic in the decision to issue equity. The primary importance of price levels and
changes in the decision to issue equity can be explained with the market timing theory based on
the relative cost of equity.
Our proxies for the relative cost of equity at the market level are also important,
statistically and economically, even after controlling for firm characteristics. In specification (1),
an increase of one standard deviation in the expected equity market risk premium reduces the
propensity to issue equity by 3.8 percent. And it is interesting to note that the expected equity
risk premium has no material impact on the decision to issue debt.
The lagged first-day return of IPOs tends to increase the propensity to issue equity and
decrease the propensity to issue debt. In economic terms, the propensity to issue equity increases
by 3.2 percent per standard deviation increase in the lagged first-day return of IPOs, while the
propensity to issue debt decreases by 1.3 percent. The closed-end fund discount is positively
related to the propensity to issue debt, but is negatively related to the propensity to issue equity.
Firms are more likely to issue equity and less likely to issue debt after a stock market run-up and
before a stock market downturn. In specification (5), firms are more likely to issue equity and
less likely to issue debt after superior performance and before poor performance of small growth
stocks. Finally, firms also tend to issue equity when the announcement effect of SEOs is less
negative, and issue debt otherwise. All these results are consistent with the market timing theory
based on the time-varying cost of capital.
Surprisingly, the statutory tax rate has no material effect. The real GDP growth rate is
positively related to the likelihood of debt issuance, but is not reliably related to the likelihood of
equity issuance. The business expansion dummy has no reliable relation with securities issue
decisions. Inflation is positively related to the propensity to issue debt, but is not reliably related
to the decision to issue equity. One possible explanation is that inflation actually reduces the real
cost of debt, perhaps due to the tax deductibility of nominal interest payment. The expected
default spread is negatively related to the propensity to issue debt. In contrast, it is not always
significantly related to the propensity to issue equity.

26
In summary, the logit and multinomial logit results provide substantial support for the
market timing theory, although the results do not imply that other theories are irrelevant. In
unreported analyses, we also estimate the propensity to issue equity each year using only
pre-issue firm characteristics, and then link market conditions to the annual average of the
predicted propensity to issue equity. We find that our cost-of-equity proxies greatly help explain
the average predicted propensity to issue equity. Therefore, we believe that our findings are
robust to various methodologies.
4.5. Effects of securities issues on capital structure
Firms may adjust their capital structure with internal funds or external funds. The pecking
order theory assumes that external funds are more expensive than internal funds, and external
equity is more expensive than external debt. Therefore, securities issues, especially equity issues,
should be rare and only have material impact on capital structure of firms with insufficient
internal funds. The market timing theory does not make these assumptions, allowing securities
issues to play a more important role in determining capital structure. According to the static
tradeoff theory, securities are issued mainly to help firms adjust toward their target leverage.
Once target leverage is properly controlled for, past securities should have no material impact on
current leverage (although with adjustment costs, Leary and Roberts (2004) and others allow for
a role). Therefore, it is important to examine the effects of past securities issues in order to
compare the relative strength of each theory.
Table 11 presents leverage levels around securities issues. The median book leverage of
firms issuing equity and retiring debt in year 0 decreases from 51 percent at the end of year –1 to
42 percent at the end of year 0, then gradually increases to about 47 percent over a ten-year
period. Their median market leverage declines from 42 percent at year –1 to 35 percent at year 0,
and reverts back to 42 percent over the next six years. Firms issuing both equity and debt
experience an increase in leverage at year 0 and a continuous increase over the next ten years.
The median leverage of firms issuing debt and retiring equity increases from year –1 to year 0,
but the pattern over the next ten years is not clear. Finally, firms retiring both debt and equity
reduce their leverage from year –1 to year 0. Over the next ten years, their market leverage
gradually increases, but their book leverage does not show a clear pattern.

27
Analyses of medians camouflage the underlying difference in firm characteristics that
determine target leverage. To control for target leverage, we estimate the following regression
each year:
), ,..., , ,..., ,( 1111 −−−−−−−= ktkttktttt LDebtNetDebtNetEquityNetEquityNetsticsCharacterifL (4)
Table 12 reports the Fama-MacBeth results. While the existing literature has identified them as
the most important determinants of target leverage, the t-statistics of target leverage proxies are
not very impressive. Among all target leverage proxies, profitability has the largest t-statistic.
However, the relation between leverage and profitability is not predicted by the static tradeoff
theory. On the other hand, past net debt and net equity have very large t-statistics. Their effects
are also economically important. For example, if a firm with a beginning book leverage ratio of
50 percent issues net debt of 10 percent of its beginning assets, then its book leverage will be
54.5 percent immediately after the net debt issue (because the numerator increases by 20 percent
and the denominator increases by ten percent) and 51.5 percent seven years later. Similarly, if
this firm issued net equity of 10 percent of its assets, then its book leverage will be 45.5 percent
immediately after the net equity issue and 47.8 percent seven years later. The effects of debt and
equity on market leverage are weaker, possibly because of stock price fluctuations. Our results
also suggest that the speed of adjustment toward target leverage is slow. For example, a
coefficient of 0.621 on BL t-6 implies that over six years a firm only closes 38 percent of the gap
between its desired target book leverage and book leverage at year t-6. Firms adjust a little faster
toward their target market leverage. But it still takes about six years to close half of the gap.
The weak role of target leverage in securities issue decisions, the large effects of
securities issues on leverage after controlling for target leverage, and the slow adjustment toward
target leverage are inconsistent with the static tradeoff theory. The strong effects of securities
issues, especially equity issues, are inconsistent with the pecking order theory.
5. Conclusions
The time-series variation of financing decisions of U.S. firms has been explored only
recently. Neither the static tradeoff theory nor the pecking order theory provides an adequate
explanation for these variations. The market timing theory based on time-variation in the relative
28
cost of equity provides a better explanation for the year-to-year fluctuations in the use of debt
and external equity.
The key difference between the pecking order theory and the market timing theory is
whether semi-strong form market efficiency is assumed. The market timing theory does not rely
on this assumption. Under the market timing theory, external funds are not necessarily more
expensive than internal funds, and equity issues are not necessarily more expensive than debt
issues. Therefore, the market timing theory does not predict equity issues to be rare. When the
cost of equity is low, a lot of firms can issue equity in a short period of time. Equity issue
decisions depend on the time-varying cost of equity. Linking the pecking order slope coefficient
to the relative cost of equity, we find that firms fund a larger proportion of their financing deficit
with net external equity when the expected equity market risk premium is lower, the lagged
average first-day return of IPOs is higher, and past (future) realizations of the Fama-French value
factor are lower (higher), even after controlling for other macroeconomic conditions. Time-
varying announcement effects of seasoned equity offerings have the expected signs but are not
statistically or economically significant, undermining the importance of the pecking order theory
based on the assumption of semi-strong form market efficiency.
Our results are robust to various additional checks. We gain additional insight into our
regression results through our summary statistics and scatter-plots of randomly selected firms.
Small growth firms do not drive our results. While small growth firms rely on debt financing in
all periods, they only resort to external equity when the cost of equity is low. Furthermore,
excluding small growth firms from our sample does not change our major results. Controlling for
partial adjustment toward target leverage does not change our major results either, suggesting
that target leverage is of secondary importance in securities issue decisions.
We also estimate a logit model for the discrete choice between debt and equity issues and
a multinomial logit model for the joint determination of whether to issue securities and which
security to issue. We find that firms are more likely to issue equity instead of debt when the
expected equity risk premium is lower, the average first-day return of IPOs is higher, the
closed-end fund discount is smaller, past (future) market returns are higher (lower), past (future)
realizations of the size factor are higher (lower), past (future) realizations of the value factor are
lower (higher), and the expected default spread is higher, even after controlling for firm
characteristics and other macro conditions in a multivariate framework. At the firm level, firms

29
that subsequently underperform are more likely to issue equity. In the multinomial logit model,
we also find that Tobin’s Q and the past market-adjusted firm return have much larger t-statistics
than other variables in explaining the decision to issue equity. The role of target leverage in
securities issue decisions, however, is not robust.
Because the market timing theory does not predict securities issues, especially equity
issues, to be rare, it allows debt and equity issues to play a more important role in determining
capital structure. We find that the effects of equity and debt issues are strong and last for over ten
years, even after controlling for firm characteristics that have been identified as the most
important determinants of capital structure. We also find that firms adjust very slowly toward
their target leverage. These findings are inconsistent with the static tradeoff theory.
Overall, our results favor the market timing theory over alternative theories as an
explanation for observed time-series patterns of external financing decisions of U.S. publicly
traded firms. Because of the importance of the time-varying cost of equity in observed external
financing decisions, future theoretical work on capital structure should take it into consideration.
We also feel that it would be fruitful to explore the importance of the implied equity risk
premium for corporate financing decisions in other countries.

30
Appendix
A.1. Determinants of Target Leverage
In the body of our paper we find that the market timing theory based on the relative cost
of equity greatly help explain the time-series patterns of financing activities. Can the static
tradeoff theory provide a satisfactory explanation? Target leverage changes as firm
characteristics change. To determine whether the time-series patterns of financing activities can
be explained by time-varying target leverage, we first estimate the target leverage regression:
)sticscharacteri firm( 1-itfLit = . (A1)
The dependent variable, Lit, is either book leverage or market leverage as defined earlier
for firm i at the end of the fiscal year ending in calendar year t. Firm characteristics include the
lagged values of the market-to-book ratio for assets (or Tobin’s Q), R&D, capital expenditure,
the logarithm of net sales, operating income before depreciation, a dividend paying dummy,
tangibility, intangibility, inventory, net operating loss carry forwards, and investment tax credits.
These variables have been documented to be important determinants of capital structure.
Because the static tradeoff theory is silent on whether firms should target book leverage
or market leverage, we try both. We also try various empirical methodologies to deal with
potential econometric problems (Fama and French (2002b)). The results are reported in Table
A1. The first four specifications estimate the fixed-effects model with time dummies. This
methodology requires the same coefficient over time for each independent variable, with
time-series variations being explained by time dummies. Specifications (5) and (6) do not impose
this restriction. The target leverage regression is estimated annually, and the annual averages of
the coefficients are reported. The t-statistic for the average coefficient is calculated as the
average coefficient divided by its time series standard deviation, following Fama and MacBeth
(1973).
In all regressions, large firms, low R&D firms, and firms with more collateral as
measured by tangibles, intangibles, and inventories, have higher target leverage, consistent with
the static tradeoff theory. Investment tax credits, which can serve as non-debt tax shields,
decrease target leverage, also consistent with the tradeoff theory.
However, profitable firms have lower targets, and firms with large net operating loss
carry forwards have higher targets. This is not consistent with the tradeoff prediction that

31
profitable firms should have high leverage to reduce tax liability and agency costs associated
with free cash flows, and firms with non-debt tax shields such as net operating loss carry
forwards should prefer lower leverage. The pecking order theory gains support here. According
to the pecking order theory, firms simply accumulate past profits and losses, with leverage being
changed mechanically.
Dividend-paying firms have lower target leverage in all specifications. The static tradeoff
theory does not provide a clear prediction on whether dividend payers should have lower or
higher target leverage. Tobin’s Q switches signs in different regressions. In specification (1) it
increases target book leverage, while it reduces target leverage in other specifications, especially
when market leverage is the dependent variable. The negative relation between Q and market
leverage should not receive too much attention. As pointed out in Titman and Wessels (1988),
Fama and French(2002), Baker and Wurgler (2002) and Goyal, Lehn, and Racic (2002), this
relation is largely mechanical. Capital expenditure also switches signs, possibly because of the
competition between the pecking order effect and the static tradeoff effect.

32
References
Alti, Aydogan, 2004, How persistent is the impact of market timing on capital structure? Unpublished working paper, University of Texas at Austin.
Baker, Malcolm, and Jeffrey Wurgler, 2000, The equity share in new issues and aggregate stock returns, Journal of Finance 55, 2219-2257.
Baker, Malcolm, and Jeffrey Wurgler, 2002, Market timing and capital structure, Journal of Finance 57, 1-32.
Bayless, Mark, and Susan Chaplinsky, 1996, Is there a window of opportunity for seasoned equity issuance? Journal of Finance 51, 253-278.
Billett, Matthew T., Mark J. Flannery, and Jon A. Garfinkel, 2001, The long-run performance of firms following loan announcements, Unpublished working paper, University of Florida.
Brav, Alon, Reuven Lehavy, and Roni Michaely, 2003, Using expectations to test asset pricing models, Unpublished working paper, Duke University.
Chirinko, Robert S., and Anuja R. Singha, 2000, Testing static tradeoff against pecking order models of capital structure: A critical comment, Journal of Financial Economics 58, 412-425.
Choe, Hyuk, Ronald W. Masulis, and Vikran Nanda, 1993, Common stock offerings across the business cycle: Theory and evidence, Journal of Empirical Finance 1, 3-31.
Claus, James, and Jacob Thomas, 2001, Equity premia as low as three percent? Evidence from analysts’ earnings forecasts for domestic and international stock markets, Journal of Finance 56, 1629-1666.
Donaldson, Gordon, 1961, Corporate debt capacity: A study of corporate debt policy and the determination of corporate debt capacity, Harvard Business School, Division of Research.
Dong, Ming, David Hirshleifer, Scott Richardson, and Siew Hong Teoh, 2004, Does Investor Misvaluation Drive the Takeover Market, Unpublished Ohio State University working paper
Fama, Eugene, and Kenneth French, 1997, Industry costs of equity, Journal of Financial Economics 43, 153-93.
Fama, Eugene, and Kenneth French, 2001, Disappearing dividends: Changing firm characteristics or lower propensity to pay? Journal of Financial Economics 60, 3-43.
Fama, Eugene, and Kenneth French, 2002a, The equity premium, Journal of Finance 57, 637-659.

33
Fama, Eugene, and Kenneth French, 2002b, Testing tradeoff and pecking order predictions about dividends and debt, Review of Financial Studies 15, 1-33.
Fama, Eugene, and Kenneth French, 2004, Financing decisions: Who issues stock? Journal of Financial Economics, forthcoming.
Fama, Eugene, and James D. MacBeth, 1973, Risk, return, and equilibrium: empirical tests, Journal of Political Economy 81, 607-636.
Flannery, Mark J., and Kasturi P. Rangan, 2004, Partial adjustment and target capital structures, Unpublished working paper, University of Florida.
Frank, Murray, and Vidhan Goyal, 2002, Testing the pecking order theory of capital structure, Journal of Financial Economics 67, 217-248.
Frank, Murray, and Vidhan Goyal, 2004, Capital structure decisions, Unpublished working paper, University of British Columbia.
Gebhardt, William, Charles M. C. Lee, and Bhaskaran Swaminathan, 2001, Toward an implied cost-of-capital, Journal of Accounting Research 39, 135-176.
Goyal, V. K., K. Lehn, and S. Racic (2002), Growth opportunities and corporate debt policy: the case of the U.S. defense industry, Journal of Financial Economics 64, 35-59.
Graham, John R., 1999, Quarter 2, 1999 FEI survey, http://www.duke.edu/~jgraham.
Graham, John R., 2000, How big are the tax benefits of debt? Journal of Finance 55, 1901-1941.
Graham, John R., 2003, Taxes and corporate finance: A review, Review of Financial Studies 16, 1074-1128.
Graham, John R., and Campbell R. Harvey, 2001, The theory and practice of corporate finance: evidence from the field, Journal of Financial Economics 60, 187-243.
Hackbarth, Dirk, 2003, Determinants of corporate borrowing: A behavioral perspective, Unpublished working paper, Indiana University.
Harris, Milton, and Arthur Raviv, 1991, The theory of capital structure, Journal of Finance 39, 127-145.
Heaton, J.B., 2002, Managerial optimism and corporate finance, Financial Management 31, 33-45.
Helwege, Jean, and Nelie Liang, 1996, Is there a pecking order? Evidence from a panel of IPO firms, Journal of Financial Economics 40, 429-458.

34
Hertzel, Michael, Michael Lemmon, James S. Linck, and Lynn Rees, 2002, Long-run performance following private placements of equity, Journal of Finance 57, 2595-2617.
Hennessy, Christopher A. and Toni Whited, 2004, Debt Dynamics, Journal of Finance, forthcoming.
Hovakimian, Armen, 2004, Are observed capital structures determined by equity market timing? Unpublished working paper, Baruch College.
Hovakimian, Armen, 2004, The role of target leverage in security issues and repurchases, Journal of Business 77, forthcoming.
Hovakimian, Armen, Gayane Hovakimian, and Hassan Tehranian, 2004, Determinants of target capital structure: The case of dual debt and equity issuers, Journal of Financial Economics 71, forthcoming.
Hovakimian, Armen, Tim Opler and Sheridan Titman, 2001, The debt-equity choice, Journal of Financial and Quantitative Analysis 36, 1-24.
Ibbotson, Roger, Jody Sindelar, and Jay Ritter, 1994, The market’s problems with the pricing of initial public offerings, Journal of Applied Corporate Finance 7, 66-74.
Ikenberry, David, Josef Lakonishok, and Theo Vermaelen, 1995, Market underreaction to open market share repurchases, Journal of Financial Economics 39, 181-208.
Jalilvand, Abolhassan, and Robert S. Harris, 1984, Corporate behavior in adjusting to capital structure and dividend targets: An econometric study, Journal of Finance 39, 127-145.
Jensen, Michael C., 1986, Agency costs of free-cash-flow, corporate finance, and takeovers, American Economic Review 76, 323-329.
Jensen, Michael C., and William H. Meckling, 1976, Theory of the firm: Managerial behavior, agency costs and ownership structure, Journal of Financial Economics 3, 305-360.
Jung, Kooyul, Yong-Cheol Kim, and Rene M. Stulz, 1996, Timing, investment opportunities, managerial discretion, and the security issuing decision, Journal of Financial Economics 42, 159-185.
Kayhan, Ayla, and Sheridan Titman, 2004, Firms’ histories and their capital structure, Unpublished working paper, University of Texas at Austin.
Korajczyk, Robert A., and Amnon Levy, 2003, Capital structure choice: Macroeconomic conditions and financial constraints, Journal of Financial Economics 68, 75-109.

35
Korajczyk, Robert A., Deborah Lucas, and Robert McDonald, 1990, Understanding stock price behavior around the time of equity issues, in R. Glenn Hubbard, Ed.: Asymmetric Information, Corporate Finance, and Investment (University of Chicago Press, Chicago).
Leary, Mark T. and Michael R. Roberts, 2004, Do firms rebalance their capital structure? Unpublished working paper, Duke University.
Lee, Charles, Andrei Shleifer, and Richard H. Thaler, 1991, Investor sentiment and the closed-end fund puzzle, Journal of Finance 46, 75-109.
Lee, Inmoo, 1997, Do managers knowingly sell overvalued equity? Journal of Finance 52, 1439-1466.
Lemmon, Michael L., and Jaime F. Zender, 2002, Debt capacity and tests of capital structure theories, Unpublished working paper, University of Utah.
Loughran, Tim, and Jay R. Ritter, 1995, The new issues puzzle, Journal of Finance 50, 23-51.
Loughran, Tim, Jay R. Ritter, and Kristian Rydqvist, 1994, Initial public offerings: International insights, Pacific-Basin Finance Journal 2, 165-199.
Loughran, Tim, and Anand M. Vijh, 1997, Do long-term shareholders benefit from corporate acquisitions? Journal of Finance 52, 1765-1790.
Lowry, Michelle, 2003, Why does IPO volume fluctuate so much? Journal of Financial Economics 67, 3-40.
Lowry, Michelle, and William Schwert, 2003, IPO market cycles: Bubbles or sequential learning? Journal of Finance 57, 1171-1200.
Marsh, Paul, 1982, The choice between equity and debt: An empirical study, Journal of Finance 37, 121-144.
Modigliani, Franco, and Merton Miller, 1958, The cost of capital, corporation finance and the theory of investment, The American Economic Review 48, 261-297.
Myers, Stewart C., 1977, Determinants of corporate borrowing, Journal of Financial Economics 5, 147-175.
Myers, Stewart C., 1984, The capital structure puzzle, Journal of Finance 39, 575-592.
Myers, Stewart C., and Nicholas Majluf, 1984, Corporate financing and investing decisions when firms have information that investors do not have, Journal of Financial Economics 13, 187-222.

36
Neal, Robert, and Simon Wheatley, 1998, Do measures of investor sentiment predict stock returns?, Journal of Financial and Quantitative Analysis 33, 523-547.
Pagano, Marco, Fabio Panetta, and Luigi Zingales, 1998, Why do companies go public? An empirical analysis, Journal of Finance 53, 27-64.
Rajan, Raghuram G. and Luigi Zingales, 1995, What do we know about capital structure? Some evidence from international data, Journal of Finance 50, 1421-1460.
Rhodes-Kropf, Matthew, David T. Robinson, and S. Viswanathan, 2004, Valuation waves and merger activity: The empirical evidence, Journal of Financial Economics, forthcoming.
Ritter, Jay R., 2003, Investment banking and securities issuance, Chapter 5 of Handbook of the Economics of Finance, ed., George Constantinides, Milton Harris, and Rene Stulz, Amsterdam: North-Holland.
Ritter, Jay R., and Richard S. Warr, 2002, The decline of inflation and the bull market of 1982-1999, Journal of Financial and Quantitative Analysis 37, 29-61.
Schultz, Paul H., 2003, Pseudo market timing and the long-run performance of IPOs, Journal of Finance 58, 483-518.
Shleifer, Andrei, and Robert Vishny, 1997, The limits of arbitrage, Journal of Finance 52, 35-55.
Shyam-Sunder, Lakshimi, and Stewart Myers, 1999, Testing static tradeoff against pecking order models of capital structure, Journal of Financial Economics 51, 219-244.
Spiess, Katherine, and John Affleck-Graves, 1995, The long-run performance following seasoned equity offerings, Journal of Financial Economics 38, 243-267.
Stein, Jeremy C., 1996, Rational capital budgeting in an irrational world, Journal of Business 69, 429-455.
Strebulaev Ilya A., 2004, Do tests of capital structure mean what they say? Unpublished London Business School working paper.
Titman, Sheridan, and Roberto Wessels, 1988, The determinants of capital structure choice, Journal of Finance 43, 1-21.
Welch, Ivo, 2004, Capital structure and stock returns, Journal of Political Economy 112, 106-131.

37
Table 1. Alternative pecking orders by financing cost assumptions Normal market conditions
When external equity is less expensive than debt
When external equity is really cheap, and debt is expensive
1) Internal equity 1) Internal equity 1) External equity 2) Debt 2) External equity 2) Internal equity 3) External equity 3) Debt 3) Debt When external equity is really cheap, and debt is cheap
When debt is really cheap, and external equity is expensive
When debt is really cheap, and external equity is cheap
1) External equity 1) Debt 1) Debt 2) Debt 2) Internal equity 2) External equity 3) Internal equity 3) External equity 3) Internal equity

38
Table 2. Percent of firms in different financing groups A firm is defined as issuing debt if �D scaled by beginning-of-year assets is at least 5%, where �D is the change in debt and preferred stock (Compustat item 181+10-35-79) from year t-1 to year t, or issuing equity if �E scaled by assets is at least 5%, where �E is the change in equity and convertible debt (6-181-10+35+79) minus the change in retained earnings (36). The percent of debt and equity issuers do not necessarily add up to 100 because firms can issue both debt and equity or neither debt nor equity. We annually sort all NYSE listed firms separately both by total assets and asset growth and use the quartile cutoff points to independently categorize firms in our sample into four size and growth groups. Each year, small growth firms are defined as those in both the bottom size quartile and the top growth quartile. Mergers and acquisitions are identified with Compustat footnote codes. Firms with beginning of the year assets of less than $10 million (1998 purchasing power) are excluded
All firms Small growth firms M&A firms Year
N
Debt issues (%)
Equity issues (%)
N
Debt issues (%)
Equity issues (%)
N
Debt issues (%)
Equity issues (%)
1963 129 33.3 16.3 15 86.7 26.7 10 50.0 20.0 1964 465 35.7 12.0 26 88.5 34.6 41 56.1 26.8 1965 558 45.9 14.3 26 92.3 26.9 67 73.1 32.8 1966 722 54.2 16.3 38 97.4 36.8 97 78.4 21.6 1967 1316 43.8 16.6 107 87.9 49.5 223 73.5 29.1 1968 1570 53.9 24.5 150 89.3 57.3 339 77.3 44.0 1969 1929 47.4 34.1 208 90.4 58.2 418 69.6 48.3 1970 2211 40.9 14.7 274 91.6 32.8 472 61.2 25.2 1971 2493 33.8 14.4 322 85.1 33.2 425 53.2 25.2 1972 2739 43.0 16.7 405 86.7 39.0 571 62.7 29.1 1973 2986 58.6 10.4 538 94.1 25.1 525 78.9 21.9 1974 3039 57.9 6.8 449 96.0 15.1 337 84.0 16.9 1975 3097 28.1 6.6 442 81.9 13.1 259 56.4 14.3 1976 3046 38.6 8.1 430 88.4 15.8 279 71.0 16.1 1977 2986 46.9 7.9 482 93.6 17.0 345 79.7 15.7 1978 2875 57.7 9.5 422 94.1 22.5 350 83.7 17.4 1979 2905 56.9 11.6 407 94.3 30.0 379 80.5 20.3 1980 2975 45.5 15.4 390 88.5 38.2 384 72.9 27.1 1981 2915 42.4 19.3 427 81.0 48.2 369 68.8 28.7 1982 3073 34.8 13.1 491 83.3 31.8 381 63.3 26.8 1983 3065 35.7 23.1 492 77.6 53.9 398 61.6 39.4 1984 3146 45.3 17.7 507 86.8 39.8 504 71.4 30.4 1985 3210 40.2 16.4 498 85.7 37.3 529 69.2 31.4 1986 3079 39.6 19.4 387 83.5 48.1 520 72.1 35.2 1987 3104 43.9 19.8 420 86.4 44.3 490 74.7 32.7 1988 3097 44.4 14.8 468 89.1 36.8 490 74.9 30.8 1989 3075 41.2 14.7 490 82.9 35.5 443 74.9 26.2 1990 3063 39.7 13.5 477 78.6 35.6 425 70.1 24.2 1991 3041 30.6 16.2 519 66.5 38.2 369 62.1 33.9 1992 3133 35.8 21.8 540 69.4 51.9 476 63.7 45.8 1993 3380 40.2 24.0 614 75.9 52.6 520 70.8 43.7 1994 3715 45.0 24.5 719 83.6 49.9 718 77.2 44.6 1995 3944 47.6 25.2 761 83.3 53.4 841 76.1 44.1 1996 4214 43.5 29.7 705 75.7 70.9 929 73.5 52.2 1997 4543 44.8 29.5 756 83.2 68.1 1036 75.5 52.2 1998 4564 49.5 27.4 730 86.2 59.7 1286 75.5 46.2 1999 4366 44.7 26.7 771 82.6 59.1 1073 72.2 45.7 2000 4202 43.1 31.5 852 76.8 62.8 944 66.8 51.3 2001 4160 28.4 27.7 595 66.2 58.7 808 51.0 51.1

39
Table 3. Median firm characteristics Assets (Compustat item 6) are in millions of constant 1998 dollars. Firm years with beginning book assets of less than $10 million are excluded. SALE is the net sales (12) in millions of constant 1998 dollars. Q is the market-to-book ratio of assets, where the market value of assets is defined as the book value of total assets minus the book value of equity plus the market value of equity (Compustat item 181+10-35+25*199) at the end of the year t fiscal year. �A is the change in total assets divided by beginning-of-year assets. �SALE is the change in the net sales from year t-1 to t divided by the net sales of year t-1. OIBD is operating income before depreciation (13) scaled by end-of-year assets. CAPEX is capital expenditure (128) scaled by end-of-year assets. TANG is property, plant, and equipment (PPE) (8) scaled by end-of-year assets. Year
N
Assets
SALE
Q
�A (%)
�SALE (%)
OIBD (%)
CAPEX (%)
TANG (%)
1963 129 250 329 1.16 4.6 6.8 16.0 4.9 43.2 1964 465 409 456 1.22 6.4 8.1 15.8 5.1 35.8 1965 558 417 514 1.36 8.3 9.7 16.2 6.1 35.0 1966 722 355 495 1.18 9.2 9.7 16.2 6.7 35.0 1967 1316 272 356 1.46 6.7 4.9 15.4 6.4 34.4 1968 1570 257 348 1.67 8.5 7.7 15.6 6.0 31.8 1969 1929 218 299 1.33 5.6 6.3 14.9 6.6 31.6 1970 2211 196 261 1.11 1.9 1.4 13.5 6.1 32.1 1971 2493 182 245 1.21 2.8 3.7 13.1 5.0 31.9 1972 2739 174 235 1.20 5.6 9.7 13.9 5.3 31.2 1973 2986 165 235 0.93 4.2 8.4 14.8 6.2 30.2 1974 3039 162 233 0.81 0.7 5.0 15.3 6.2 30.2 1975 3097 151 218 0.85 -2.9 -0.9 14.7 5.3 30.9 1976 3046 157 235 0.93 3.3 7.4 15.9 5.1 30.2 1977 2986 160 244 0.93 3.3 5.6 16.0 5.9 30.5 1978 2875 170 260 0.96 3.7 5.7 16.6 6.4 30.7 1979 2905 158 238 0.98 0.4 2.6 16.3 6.8 30.8 1980 2975 139 212 1.00 -2.2 0.0 15.3 7.1 31.5 1981 2915 136 199 1.01 0.6 1.5 14.7 6.8 32.0 1982 3073 122 159 1.02 0.3 -0.5 12.8 6.4 33.3 1983 3065 122 149 1.21 2.9 2.8 12.6 5.5 31.6 1984 3146 120 150 1.14 4.8 10.2 13.6 6.5 31.4 1985 3210 111 136 1.20 2.6 3.8 12.2 6.3 31.4 1986 3079 117 135 1.23 4.7 6.7 11.5 5.7 30.4 1987 3104 113 136 1.21 2.6 7.4 12.0 5.2 28.7 1988 3097 105 125 1.20 2.9 8.9 11.9 5.3 28.1 1989 3075 114 139 1.25 1.7 6.1 12.0 5.1 27.8 1990 3063 120 148 1.11 -1.0 2.3 12.0 5.2 28.0 1991 3041 119 146 1.20 -0.8 0.9 11.6 4.6 27.9 1992 3133 114 143 1.31 1.1 4.6 12.0 4.5 27.1 1993 3380 113 135 1.44 2.7 6.1 11.9 4.7 25.6 1994 3715 118 140 1.39 6.0 10.3 12.5 5.1 25.3 1995 3944 120 145 1.46 7.3 11.7 12.5 5.2 24.3 1996 4214 120 144 1.50 5.2 9.9 12.2 5.0 23.3 1997 4543 119 133 1.58 6.2 11.2 11.8 4.9 22.2 1998 4564 131 141 1.42 6.6 9.7 11.0 4.9 21.6 1999 4366 142 149 1.36 3.5 7.2 10.7 4.4 21.1 2000 4202 158 154 1.24 2.2 8.2 10.3 4.3 20.5 2001 4160 151 141 1.32 -3.2 1.6 8.1 3.7 19.5

40
Table 4. Summary statistics of time-series variables, 1963-2001 ERP is the implied market equity risk premium at the year-end, estimated using analyst forecasts for the Dow 30 stocks from Value Line for 1968-1976 and from I/B/E/S for 1977-2001. RIPO is the annual average of initial returns of initial public offerings at http://bear.cba.ufl.edu/ritter/ipodata.htm. CEFD is the value-weighted average of the closed-end fund discount at the year-end from Malcolm Baker and Jeffrey Wurgler, who construct the series by combining several sources (Neal and Wheatley, 1962-1993; CDA/Weisenberger, 1994-1998; and the Wall Street Journal, 1999-2001). EWR is the annual equally weighted market return from CRSP. SMB is the difference in the average return on portfolios of small stocks and portfolios of big stocks, and HML is the difference in the average return on portfolios of value stocks and portfolios of growth stocks from Kenneth French, both on an annualized basis. RSEO is the annual average of market-adjusted returns from one day before to one day after the file date of seasoned equity offerings (SEOs) from Thomson Financial. The average announcement effect is calculated from 1980, the first year the file date is available for most SEOs. TAXR is the statutory corporate tax rate. RGDP is the real GDP growth rate from the Bureau of Economic Analysis, Department of Commerce. INF is the inflation rate from CRSP. DSP is the default spread calculated as the yield difference between Moody’s Baa rated and Aaa rated corporate bonds at the year-end. The subscripts denote years. The superscripts a, b, and c denote statistical significance at the 1%, 5%, and 10% levels in a two-tailed test.
ERP t-1 RIPO t-1 CEFD t-1 EWR t-1 EWR t+1 SMB t-1 SMB t+1 HML t-1 HML t+1 RSEO t-1 TAXR t RGDP t INF t DSP t-1 N 33 39 39 39 39 39 39 39 39 21 39 39 39 39 Mean 0.031 0.176 0.088 0.158 0.161 0.026 0.039 0.044 0.046 -0.018 0.430 0.033 0.047 0.011 Std Dev 0.037 0.161 0.081 0.260 0.258 0.149 0.152 0.144 0.147 0.005 0.067 0.022 0.031 0.005 Min -0.043 -0.017 -0.104 -0.356 -0.356 -0.239 -0.239 -0.394 -0.394 -0.028 0.340 -0.020 0.010 0.003 Median 0.037 0.135 0.097 0.188 0.202 0.004 0.044 0.078 0.058 -0.017 0.460 0.036 0.038 0.009 Max 0.114 0.695 0.237 0.774 0.774 0.506 0.506 0.246 0.273 -0.008 0.528 0.073 0.133 0.023 Correlation ERP t-1 1 RIPO t-1 -0.42b 1 CEFD t-1 0.33c -0.21 1 EWR t-1 -0.09 0.33b 0.04 1 EWR t+1 0.29 -0.26 0.29c -0.18 1 SMB t-1 0.23 0.38b 0.04 0.80a -0.08 1 SMB t+1 0.18 -0.04 0.39b 0.04 0.77a 0.10 1 HML t-1 0.29 -0.43a -0.04 -0.16 0.06 -0.03 -0.07 1 HML t+1 0.09 0.19 0.07 -0.11 -0.13 -0.05 0.06 -0.19 1 RSEO t-1 0.19 0.23 0.28 0.41c 0.23 0.22 0.07 -0.39 1 TAXR t 0.71a -0.12 0.11 0.09 0.03 0.30c 0.13 0.24 0.14 0.42c 1 RGDP t -0.18 -0.08 -0.01 0.49a -0.20 0.27c -0.07 0.01 -0.28c 0.08 0.16 1 INF t 0.56a 0.07 0.48a 0.06 0.23 0.16 0.18 -0.06 0.04 0.36 0.32c -0.27c 1 DSP t-1 0.48a -0.07 0.02 -0.03 -0.08 -0.02 -0.12 0.10 0.41a 0.39c 0.13 -0.36b 0.15 1

41
Table 5. Pecking order tests Coefficients are computed annually from the cross-sectional regression
ititttit uDEFbaD ++=∆ . The net debt issuance, �Dit, is the change in debt (Compustat item 181+10-35-79) scaled by beginning-of-year assets, �Dit = (Dit – Dit-1) /Ait-1. The financing deficit, DEFit, is the change in assets (6) minus the change in Compustat’s adjusted value of balance sheet retained earnings (36) scaled by beginning-of-year assets, DEFit = ((Ait-Ait-1)-(REit-REit-1)) /Ait-1. Firm years with a net debt or net equity amount of over 400 % of beginning-of-year assets are excluded to remove the large influence of a few outliers. Year bt t(bt) at t(at) N Adj. R2 1963 0.733 20.6 -0.008 -1.5 129 0.767 1964 0.797 57.9 -0.004 -1.7 465 0.878 1965 0.867 69.2 -0.008 -2.9 558 0.896 1966 0.917 95.0 -0.011 -4.7 722 0.926 1967 0.671 66.5 0.006 1.9 1316 0.771 1968 0.723 90.0 -0.003 -1.1 1570 0.838 1969 0.727 94.9 -0.023 -9.2 1929 0.823 1970 0.799 108.0 -0.010 -6.1 2211 0.841 1971 0.707 92.8 -0.008 -5.0 2493 0.776 1972 0.684 96.0 -0.004 -2.4 2738 0.771 1973 0.797 134.3 0.005 3.4 2986 0.858 1974 0.911 266.4 0.000 0.5 3039 0.959 1975 0.909 196.4 -0.009 -12.6 3097 0.926 1976 0.877 185.3 -0.006 -7.2 3046 0.919 1977 0.897 190.2 -0.004 -4.8 2986 0.924 1978 0.871 179.0 -0.002 -1.5 2875 0.918 1979 0.846 139.4 -0.001 -0.7 2905 0.870 1980 0.735 112.1 -0.007 -4.1 2975 0.809 1981 0.626 77.4 -0.006 -2.4 2915 0.673 1982 0.768 118.3 -0.010 -6.0 3073 0.820 1983 0.482 61.0 -0.010 -3.8 3064 0.548 1984 0.724 112.6 -0.004 -1.8 3146 0.801 1985 0.714 110.9 -0.006 -2.6 3210 0.793 1986 0.657 87.6 -0.006 -2.2 3079 0.714 1987 0.739 106.6 -0.010 -4.1 3104 0.785 1988 0.768 118.4 -0.002 -0.8 3097 0.819 1989 0.773 127.7 -0.006 -2.9 3075 0.841 1990 0.582 79.9 0.004 1.7 3063 0.676 1991 0.440 53.2 -0.007 -2.5 3040 0.482 1992 0.423 52.7 -0.005 -1.8 3131 0.470 1993 0.444 57.9 -0.003 -1.1 3380 0.498 1994 0.517 75.1 0.002 0.8 3713 0.603 1995 0.445 68.1 0.011 3.6 3939 0.541 1996 0.375 57.9 0.004 1.3 4204 0.443 1997 0.480 81.0 0.003 1.1 4543 0.591 1998 0.518 89.2 0.013 4.2 4560 0.636 1999 0.420 67.3 0.012 3.6 4353 0.510 2000 0.268 48.6 0.016 4.4 4173 0.362 2001 0.340 54.8 -0.017 -6.8 4155 0.420

Table 6. Time-series of the pecking order slope coefficient The following equation is estimated:
) variablescontrol proxies,equity ofcost (ˆ fbt = . The dependent variable is the estimated pecking order slope coefficient from Table 5. ERP is the implied market equity risk premium at the year-end, estimated using analyst forecasts for the Dow 30 stocks from Value Line for 1968-1976 and from I/B/E/S for 1977-2001. RIPO is the annual average of initial returns of initial public offerings at http://bear.cba.ufl.edu/ritter/ipodata.htm. CEFD is the value-weighted average of the closed-end fund discount at the year-end from Malcolm Baker and Jeffrey Wurgler, who construct the series by combining several sources (Neal and Wheatley, 1962-1993; CDA/Weisenberger, 1994-1998; and the Wall Street Journal, 1999-2001). EWR is the equally weighted market returns from CRSP. SMB is the difference in the average return on portfolios of small stocks and portfolios of big stocks, and HML is the difference in the average return on portfolios of value stocks and portfolios of growth stocks from Kenneth French. RSEO is the annual average of market-adjusted returns from one day before to one day after the file date of seasoned equity offerings (SEOs) from Thomson Financial. The average announcement effect is calculated from 1980, the first year the file date is available for most SEOs. TAXR is the statutory corporate tax rate. RGDP is the real GDP growth rate from the Bureau of Economic Analysis, Department of Commerce. INF is the inflation rate from CRSP. DSP is the default spread calculated as the yield difference between Moody’s Baa rated and Aaa rated corporate bonds at the year-end. An autoregressive term, AR (1), is included to account for residual serial correlation. The subscripts denote years. t-statistics are reported in parentheses.
(1) (2) (3) (4) (5) (6) coeff t-stat coeff t-stat coeff t-stat coeff t-stat coeff t-stat coeff t-stat
ERP t-1 2.74 3.23 RIPO t-1 -0.45 -4.43 CEFD t-1 0.48 1.58 EWR t-1 -0.10 -1.26 EWR t+1 0.11 1.57 SMB t-1 -0.09 -0.75 SMB t+1 0.15 1.30 HML t-1 0.24 2.04 HML t+1 -0.24 -1.96 RSEO t-1 -3.97 -0.58 TAXR t 0.84 1.78 1.50 4.89 1.71 3.99 1.66 4.40 1.61 4.45 1.07 0.92 RGDP t 0.48 0.54 0.56 0.74 -0.11 -0.13 1.43 1.25 0.76 0.76 0.52 0.26 INF t 1.04 1.29 1.91 3.17 0.88 1.09 1.47 1.94 1.63 2.38 1.66 0.79 DSP t-1 -4.64 -0.87 -2.67 -0.70 -3.77 -0.76 0.58 0.12 2.71 0.59 4.70 0.38 Constant 0.19 1.11 0.02 0.15 -0.12 -0.63 -0.17 -1.09 -0.16 -1.07 -0.06 -0.15 AR (1) -0.22 -1.13 -0.26 -1.51 -0.42 -2.60 -0.29 -1.70 -0.26 -1.44 -0.21 -0.80 Adjusted R2 0.772 0.798 0.720 0.721 0.772 0.430 N 33 39 39 39 39 22

Table 7. Pecking order tests with partial adjustment Coefficients are computed annually from the cross-sectional regression:
ititittitttit uLTLcDEFbaD +−++=∆ − )( 1 . The net debt issuance, �Dit, is the change in debt (Compustat item 181+10-35-79) scaled by beginning-of-year assets, �Dit = (Dit – Dit-1) /Ait-1. The financing deficit, DEFit, is the change in assets (6) minus the change in Compustat’s adjusted value of balance sheet retained earnings (36) scaled by beginning-of-year assets, DEFit = ((Ait-Ait-1)-(REit-REit-1)) /Ait-1. TLit are the fitted values from target leverage regression (1) in Table A1. Target leverage and leverage (L) are measured using book values. Year bt t(bt) ct t(ct) at t(at) N Adj. R2 1963 0.737 19.7 0.011 0.4 -0.008 1.4 123 0.765 1964 0.798 49.3 0.036 2.5 -0.004 1.6 364 0.870 1965 0.819 53.8 0.033 2.1 -0.004 1.4 439 0.871 1966 0.926 85.8 0.034 2.4 -0.013 4.4 562 0.930 1967 0.642 52.6 -0.019 0.9 0.008 1.8 962 0.750 1968 0.729 76.9 0.116 6.3 -0.004 1.1 1124 0.842 1969 0.735 86.1 0.121 9.2 -0.021 6.9 1443 0.837 1970 0.802 106.1 0.032 3.4 -0.009 5.3 2110 0.842 1971 0.706 91.7 0.038 4.2 -0.006 4.0 2438 0.777 1972 0.680 91.8 0.023 2.3 -0.003 1.8 2681 0.759 1973 0.799 132.7 0.022 2.8 0.005 3.4 2918 0.858 1974 0.910 260.3 -0.007 1.5 0.000 0.4 2920 0.959 1975 0.910 197.2 0.013 3.1 -0.008 11.0 2972 0.930 1976 0.878 186.9 0.025 5.3 -0.005 5.7 2934 0.923 1977 0.896 186.6 0.021 3.9 -0.004 3.8 2871 0.924 1978 0.865 171.3 0.026 4.4 -0.001 0.5 2764 0.914 1979 0.849 136.3 0.018 2.3 -0.001 0.6 2792 0.870 1980 0.744 112.4 0.009 1.1 -0.007 4.4 2853 0.816 1981 0.623 75.4 0.023 2.0 -0.004 1.7 2798 0.670 1982 0.762 114.5 0.020 2.6 -0.009 5.3 2964 0.817 1983 0.474 59.0 0.052 4.3 -0.007 2.6 2963 0.547 1984 0.724 113.7 0.031 3.9 -0.003 1.5 3051 0.809 1985 0.710 107.8 0.004 0.4 -0.006 2.7 3118 0.789 1986 0.655 85.6 -0.004 0.4 -0.006 2.0 2974 0.711 1987 0.737 105.0 0.024 2.6 -0.010 4.0 3008 0.787 1988 0.771 117.1 0.009 1.1 -0.002 0.9 2995 0.821 1989 0.768 123.3 -0.017 2.2 -0.006 2.6 2965 0.837 1990 0.588 80.6 0.012 1.5 0.003 1.4 2963 0.688 1991 0.451 52.6 0.008 0.9 -0.008 2.9 2945 0.493 1992 0.414 50.3 0.011 1.2 -0.005 1.9 3038 0.463 1993 0.462 59.7 0.017 1.9 -0.004 1.5 3286 0.526 1994 0.530 76.0 0.009 1.0 0.000 0.1 3622 0.619 1995 0.459 69.5 -0.036 3.4 0.012 3.8 3833 0.559 1996 0.393 59.1 -0.041 3.5 0.004 1.1 4099 0.462 1997 0.484 80.9 -0.041 4.0 0.006 1.9 4414 0.597 1998 0.523 89.0 -0.042 4.3 0.017 5.3 4446 0.641 1999 0.436 68.7 -0.058 5.5 0.015 4.4 4241 0.527 2000 0.274 47.5 -0.044 3.9 0.020 5.3 4078 0.362 2001 0.354 55.6 -0.032 4.3 -0.013 4.9 4045 0.434

44
Table 8. Time-series of the pecking order slope coefficient with partial adjustment The following equation is estimated:
) variablescontrol proxies,equity ofcost (ˆ fbt = . The dependent variable is the estimated pecking order slope coefficient from Table 7. ERP is the implied market equity risk premium at the year-end, estimated using analyst forecasts for the Dow 30 stocks from Value Line for 1968-1976 and from I/B/E/S for 1977-2001. RIPO is the annual average of initial returns of initial public offerings at http://bear.cba.ufl.edu/ritter/ipodata.htm. CEFD is the value-weighted average of the closed-end fund discount at the year-end from Malcolm Baker and Jeffrey Wurgler, who construct the series by combining several sources (Neal and Wheatley, 1962-1993; CDA/Weisenberger, 1994-1998; and the Wall Street Journal, 1999-2001). EWR is the equally weighted market returns from CRSP. SMB is the difference in the average return on portfolios of small stocks and portfolios of big stocks, and HML is the difference in the average return on portfolios of value stocks and portfolios of growth stocks from Kenneth French. RSEO is the annual average of market-adjusted returns from one day before to one day after the file date of seasoned equity offerings (SEOs) from Thomson Financial. The average announcement effect is calculated from 1980, the first year the file date is available for most SEOs. TAXR is the statutory corporate tax rate. RGDP is the real GDP growth rate from the Bureau of Economic Analysis, Department of Commerce. INF is the inflation rate from CRSP. DSP is the default spread calculated as the yield difference between Moody’s Baa rated and Aaa rated corporate bonds at the year-end. An autoregressive term, AR (1), is included to account for residual serial correlation. The subscripts denote years. t-statistics are reported in parentheses.
(1) (2) (3) (4) (5) (6) coeff t-stat coeff t-stat coeff t-stat coeff t-stat coeff t-stat coeff t-stat
ERP t-1 2.71 3.24 RIPO t-1 -0.44 -4.47 CEFD t-1 0.44 1.45 EWR t-1 -0.10 -1.22 EWR t+1 0.11 1.66 SMB t-1 -0.09 -0.72 SMB t+1 0.15 1.40 HML t-1 0.25 2.15 HML t+1 -0.24 -2.02 RSEO t-1 -4.25 -0.63 TAXR t 0.81 1.75 1.44 4.97 1.66 4.02 1.59 4.39 1.54 4.41 1.03 0.91 RGDP t 0.40 0.46 0.58 0.76 -0.05 -0.06 1.45 1.28 0.70 0.77 0.45 0.23 INF t 1.04 1.30 2.01 3.46 1.02 1.27 1.56 2.10 1.71 2.56 1.69 0.81 DSP t-1 -5.15 -0.98 -2.42 -0.65 -3.43 -0.70 0.66 0.14 2.65 0.59 4.02 0.33 Constant 0.22 1.27 0.04 0.31 -0.10 -0.57 -0.15 -0.98 -0.13 -0.91 -0.04 -0.10 AR (1) -0.21 -1.11 -0.20 -1.15 -0.38 -2.33 -0.26 -1.51 -0.24 -1.32 -0.20 -0.77 Adjusted R2 0.768 0.788 0.701 0.710 0.770 0.409 N 33 39 39 39 39 22
45
Table 9. Logit regressions Logit regressions are estimated and marginal effects are reported. The dependent variable equals one if the firm issues equity, and zero if the firm issues debt. Debt issuers are the base category. �D is the change in debt and preferred stock (Compustat item 181+10-35-79). �E is the change in equity and convertible debt (6-181-10+35+79) minus the change in retained earnings (36). A firm is defined as issuing debt if �D/A t-1 � 0.05. Similarly, a firm is defined as issuing equity if �E/A t-1 � 0.05. CASH is the sum of cash and short-term investments (1) scaled by assets. DIVID equals one if a firm pays dividend. OIBD is operating income before depreciation (13) scaled by assets. CAPEX is the capital expenditure (128) scaled by assets. Q is the market-to-book ratio of assets. R&D is the intensity of research and development (46) scaled by assets. SALE is the logarithm of net sales (12). AGE is the logarithm of the number of years the firm has been listed on CRSP. LDEF it is the leverage deficit, LDEF it = TL it - L it-1, where TL it is the fitted value from target leverage regression (1) in Table A1, and L it-1 is lagged leverage. ERET it-1 is the market-adjusted returns during the previous fiscal year, measured as the difference between the firm raw return and the value-weighted market return in the preceding fiscal year. ERET it+1, t+3 is the market-adjusted returns during the three fiscal years after events, measured as the difference between the firm raw return and the value-weighted market return in the following three fiscal years. If a firm is delisted, its post-event three-year raw return is calculated by compounding the CRSP value-weighted market return for remaining months. The calculation of post-event returns will not be affected if a firm changes its fiscal year-end month. ERP is the implied market equity risk premium at the year-end, estimated using analyst forecasts for the Dow 30 stocks from Value Line for 1968-1976 and from I/B/E/S for 1977-2001. RIPO is the annual average of initial returns of initial public offerings at http://bear.cba.ufl.edu/ritter/ipodata.htm. CEFD is the value-weighted average of the closed-end fund discount at the year-end from Malcolm Baker and Jeffrey Wurgler, who construct the series by combining several sources (Neal and Wheatley, 1962-1993; CDA/Weisenberger, 1994-1998; and the Wall Street Journal, 1999-2001). EWR is the equally weighted market returns from CRSP. SMB is the difference in the average return on portfolios of small stocks and portfolios of big stocks, and HML is the difference in the average return on portfolios of value stocks and portfolios of growth stocks from Kenneth French. RSEO is the annual average of market-adjusted returns from one day before to one day after the file date of seasoned equity offerings (SEOs) from Thomson Financial. The average announcement effect is calculated from 1980, the first year the file date is available for most SEOs. TAXR is the statutory corporate tax rate. RGDP is the real GDP growth rate from the Bureau of Economic Analysis, Department of Commerce. INF is the inflation rate from CRSP. DSP is the default spread calculated as the yield difference between Moody’s Baa rated and Aaa rated corporate bonds at the year-end. The subscripts denote firms or years.
(1) (2) (3) (4) (5) (6) dy/dx t-stat dy/dx t-stat dy/dx t-stat dy/dx t-stat dy/dx t-stat dy/dx t-stat
CASH it-1 0.07 4.3 0.08 4.4 0.08 4.9 0.08 4.7 0.09 5.1 0.07 3.2 DIVID it-1 0.02 3.8 0.02 3.1 0.02 3.7 0.02 3.4 0.02 3.8 0.03 2.9 OIBD it-1 0.05 1.4 0.03 1.0 0.08 2.7 0.06 2.0 0.09 2.6 0.05 1.3 CAPEX it-1 -0.05 -2.0 -0.05 -2.1 -0.06 -2.3 -0.05 -2.0 -0.06 -2.1 -0.13 -3.4 Q it-1 0.04 18.4 0.04 18.0 0.04 18.0 0.04 18.6 0.04 18.2 0.04 15.4 R&D it-1 0.54 13.8 0.52 13.6 0.55 14.4 0.53 13.9 0.54 14.1 0.68 13.4 SALE it-1 -0.03 -18.1 -0.03 -18.1 -0.03 -18.5 -0.03 -18.6 -0.03 -19.0 -0.04 -17.7 AGE it 0.00 1.7 0.00 1.4 0.00 0.8 0.00 1.6 0.00 1.6 0.00 1.2 LDEF it 0.40 8.3 0.35 7.6 0.45 9.5 0.41 8.8 0.45 9.5 0.56 8.7 L it-1 0.58 12.0 0.53 11.4 0.62 13.1 0.59 12.5 0.63 13.1 0.76 11.9 ERET it-1 0.03 11.4 0.03 11.2 0.03 11.3 0.03 10.3 0.03 10.5 0.04 10.6 ERE it+1, t+3 -0.01 -8.6 -0.01 -8.2 -0.01 -7.4 -0.01 -8.4 -0.01 -7.8 -0.01 -5.3 ERP t-1 -0.57 -5.5 RIPO t-1 0.23 14.2 CEFD t-1 -0.44 -12.6 EWR t-1 0.09 8.6 EWR t+1 -0.09 -9.0 SMB t-1 0.14 7.9 SMB t+1 -0.16 -8.8 HML t-1 -0.09 -5.4 HML t+1 0.10 5.8 RSEO t-1 3.39 5.3 TAXR t 0.26 4.3 0.15 2.9 0.11 2.1 0.15 3.0 0.16 3.0 -0.20 -1.9 RGDP t -0.67 -5.3 -0.66 -5.3 -0.38 -3.1 -1.38 -9.7 -0.80 -6.1 0.30 1.4 INF t -1.17 -11.4 -1.60 -17.6 -0.71 -6.6 -1.35 -14.7 -1.37 -14.5 -1.17 -5.4 DSP t-1 4.90 8.0 3.76 7.0 3.84 7.1 2.56 4.6 2.45 4.1 7.67 6.3 Constant -0.50 -13.1 -0.45 -12.2 -0.46 -12.2 -0.42 -11.1 -0.46 -12.0 -0.43 -7.6 N 33,602 34,601 34,601 34,601 34,601 22,388 Pseudo R2 0.126 0.129 0.128 0.128 0.129 0.115

46
Table 10. Multinomial logit regressions Multinomial logit regressions are estimated and marginal effects are reported. The dependent variable equals two if the firm issues equity, one if the firm issues debt, and zero if the firm issues neither debt nor equity. Non-issuers are the base category. �D is the change in debt and �E is the change in equity. All variables are as defined in Table 9.
(1) (2) (3) Debt Equity Debt Equity Debt Equity dy/dx t-stat dy/dx t-stat dy/dx t-stat dy/dx t-stat dy/dx t-stat dy/dx t-stat
CASH it-1 -0.27 -16.0 -0.03 -2.5 -0.27 -16.1 -0.02 -2.0 -0.27 -16.2 -0.02 -1.7 DIVID it-1 -0.03 -6.6 -0.02 -4.5 -0.03 -5.9 -0.02 -5.7 -0.03 -6.2 -0.02 -5.1 OIBD it-1 -0.21 -6.8 -0.02 -1.1 -0.19 -6.1 -0.03 -1.4 -0.21 -6.8 0.01 0.6 CAPEX it-1 0.53 20.8 0.32 19.5 0.53 21.1 0.32 19.8 0.53 21.2 0.32 19.4 Q it-1 0.02 8.3 0.05 36.5 0.02 9.0 0.05 36.8 0.02 9.0 0.05 37.0 R&D it-1 -0.21 -5.0 0.38 16.9 -0.19 -4.6 0.38 17.0 -0.20 -4.9 0.40 17.9 SALE it-1 0.03 16.5 -0.01 -12.9 0.02 16.0 -0.01 -12.6 0.03 16.3 -0.01 -13.1 AGE it 0.00 -8.3 0.00 -13.3 0.00 -8.1 0.00 -13.6 0.00 -7.9 0.00 -13.8 LDEF it -0.50 -10.5 0.20 7.2 -0.44 -9.4 0.19 7.0 -0.49 -10.3 0.26 9.6 L it-1 -0.56 -11.5 0.28 10.3 -0.50 -10.4 0.27 10.1 -0.54 -11.3 0.34 12.6 ERET it-1 0.04 12.0 0.06 33.6 0.04 11.8 0.06 33.2 0.04 11.6 0.06 33.5 ERET it+1, t+3 0.00 0.9 -0.02 -17.8 0.00 0.5 -0.02 -17.2 0.00 0.2 -0.02 -16.6 ERP t-1 -0.25 -3.1 -1.02 -16.5 RIPO t-1 -0.08 -5.4 0.20 20.4 CEFD t-1 0.14 5.0 -0.25 -11.9 TAXR t -0.15 -2.9 0.27 7.4 -0.21 -4.8 0.06 2.0 -0.21 -4.7 0.04 1.2 RGDP t 1.29 13.1 -0.28 -3.6 1.37 14.2 -0.13 -1.7 1.26 13.0 0.10 1.3 INF t 1.69 21.8 -0.18 -2.9 1.71 24.4 -0.74 -13.2 1.43 17.6 -0.16 -2.5 DSP t-1 -6.01 -12.0 0.89 2.4 -6.40 -14.2 -0.82 -2.4 -6.39 -14.2 -0.83 -2.4 Constant 0.15 4.2 -0.34 -15.4 0.15 4.2 -0.27 -12.6 0.16 4.6 -0.28 -12.8 N 82,213 84,450 84,450 Pseudo R2 0.082 0.082 0.080
(4) (5) (6) Debt Equity Debt Equity Debt Equity dy/dx t-stat dy/dx t-stat dy/dx t-stat dy/dx t-stat dy/dx t-stat dy/dx t-stat
CASH it-1 -0.27 -16.2 -0.02 -1.6 -0.27 -16.4 -0.01 -1.4 -0.25 -13.8 -0.04 -3.1 DIVID it-1 -0.03 -5.9 -0.02 -5.2 -0.03 -6.1 -0.02 -5.0 -0.05 -7.6 -0.03 -5.8 OIBD it-1 -0.20 -6.4 0.00 0.1 -0.21 -6.7 0.01 0.4 -0.21 -5.8 -0.06 -2.4 CAPEX it-1 0.53 21.0 0.32 19.8 0.53 21.1 0.32 19.6 0.45 16.0 0.26 11.9 Q it-1 0.02 8.8 0.05 37.5 0.02 9.0 0.05 37.2 0.02 7.5 0.06 33.9 R&D it-1 -0.19 -4.7 0.39 17.4 -0.20 -4.8 0.39 17.4 -0.33 -7.8 0.39 14.2 SALE it-1 0.02 16.2 -0.01 -13.3 0.03 16.3 -0.01 -13.6 0.02 13.9 -0.01 -10.1 AGE it 0.00 -8.2 0.00 -13.2 0.00 -8.0 0.00 -13.2 0.00 -4.8 0.00 -13.7 LDEF it -0.47 -9.8 0.24 9.0 -0.49 -10.2 0.26 9.4 -0.50 -9.4 0.27 8.0 L it-1 -0.52 -10.8 0.33 12.1 -0.54 -11.2 0.34 12.4 -0.54 -10.2 0.35 10.4 ERET it-1 0.04 12.0 0.06 32.3 0.04 11.9 0.06 32.5 0.03 8.2 0.07 28.6 ERET it+1, t+3 0.00 0.6 -0.02 -17.5 0.00 0.0 -0.02 -16.9 0.00 0.7 -0.02 -12.7 EWR t-1 -0.04 -5.4 0.05 8.2 EWR t+1 0.03 4.3 -0.06 -10.0 SMB t-1 -0.09 -6.3 0.07 6.1 SMB t+1 0.10 6.7 -0.09 -8.3 HML t-1 0.06 4.4 -0.08 -7.6 HML t+1 -0.05 -4.0 0.03 3.3 RSEO t-1 -1.71 -3.9 1.47 4.0 TAXR t -0.23 -5.2 0.07 2.3 -0.24 -5.1 0.10 3.0 -0.06 -0.8 0.05 0.8 RGDP t 1.74 15.0 -0.54 -6.0 1.51 14.5 -0.16 -2.0 0.80 5.5 0.48 3.8 INF t 1.66 23.2 -0.53 -9.2 1.64 22.8 -0.56 -9.6 0.95 6.7 -0.65 -5.1 DSP t-1 -5.60 -12.0 -1.76 -5.0 -5.29 -10.9 -1.45 -3.8 -4.43 -5.4 0.66 0.9 Constant 0.14 4.0 -0.26 -11.8 0.16 4.3 -0.29 -13.0 0.13 3.0 -0.30 -9.6 N 84,450 84,450 56,715 Pseudo R2 0.081 0.081 0.078

47
Table 11. Leverage before and after securities issues ∆E0 and ∆D0 are net equity and net debt in year 0 scaled by book assets, respectively. Book leverage is defined as book debt (item 181+10-35-79) divided by book assets (item 6). Market leverage is defined as book debt divided by market assets (item 181+10-35+25*199). (1) ∆E0≥0, ∆D0≤0 (2) ∆E0≥0, ∆D0>0
Book leverage Market leverage Book leverage Market leverage Year N Median N Median N Median N Median -1 31,162 0.510 27,176 0.418 62,188 0.443 55,769 0.318 0 31,325 0.419 29,310 0.345 62,495 0.472 58,650 0.356 1 27,055 0.427 25,638 0.361 56,458 0.471 53,867 0.380 2 24,186 0.436 23,086 0.376 51,435 0.473 49,431 0.394 3 21,816 0.441 20,942 0.390 46,832 0.474 45,185 0.406 4 19,781 0.449 19,032 0.401 42,558 0.475 41,133 0.414 5 17,856 0.452 17,214 0.409 38,624 0.477 37,340 0.421 6 15,990 0.455 15,421 0.416 35,235 0.478 34,068 0.427 7 14,526 0.460 14,019 0.419 32,086 0.479 30,969 0.427 8 13,110 0.462 12,659 0.417 29,286 0.481 28,259 0.429 9 11,799 0.466 11,393 0.416 26,917 0.484 25,937 0.429 10 10,626 0.466 10,262 0.418 24,828 0.488 23,873 0.426 (3) ∆E0<0, ∆D0≥0 (4) ∆E0<0, ∆D0<0
Book leverage Market leverage Book leverage Market leverage Year N Median N Median N Median N Median -1 27,193 0.446 23,711 0.371 16,794 0.497 14,867 0.471 0 27,818 0.504 25,018 0.436 33,447 0.473 24,824 0.353 1 25,092 0.498 23,124 0.426 28,732 0.454 24,672 0.349 2 22,824 0.495 21,347 0.420 25,596 0.460 23,094 0.365 3 20,734 0.493 19,679 0.414 23,015 0.467 21,140 0.374 4 18,885 0.493 18,141 0.414 20,690 0.469 19,406 0.388 5 17,399 0.492 16,843 0.413 18,685 0.472 17,802 0.395 6 16,106 0.490 15,607 0.412 16,817 0.473 16,142 0.397 7 14,950 0.490 14,512 0.420 15,126 0.472 14,611 0.407 8 13,813 0.491 13,407 0.436 13,787 0.473 13,316 0.412 9 12,765 0.492 12,399 0.446 12,434 0.472 12,027 0.418 10 11,783 0.490 11,449 0.454 11,186 0.475 10,855 0.425

48
Table 12. Effects of past securities issues The following regression is estimated each year:
), ,..., , ,..., ,( 1111 −−−−−−−= ktkttktttt LDebtNetDebtNetEquityNetEquityNetsticsCharacterifL Fama-MacBeth results are reported. The dependent variable is either book or market leverage. Book leverage (BL) is defined as book debt (item 181+10-35-79) divided by book assets (item 6). Market leverage (ML) is defined as book debt divided by market assets (item 181+10-35+25*199). Q is the market-to-book ratio of assets. R&D is the research and development expense (item 46). CAPEX is the capital expenditure (128). SALE is the log of net sales (12). OIBD is the operating income before depreciation (13). DIVID equals one if a firm pays dividends, and equals zero otherwise. TANG is the net PPE (8). INTANG is the intangibles (33). INVENT is the inventory (3). NOLCF is the net operating loss carry forward (52), and ITAXC is the investment tax credit (208). R&D, CAPEX, OIBD, TANG, INTANG, INVENT, NOLCF, and ITAXC are scaled by end-of-year assets. Net debt and net equity are scaled by beginning-of-year assets. The subscripts denote years. The R2 is the average from the annual regressions.
Five-year history Ten-year history Book leverage t Market leverage t Book leverage t Market leverage t
Coeff t-stat Coeff t-stat Coeff t-stat Coeff t-stat Q t-1 0.020 5.7 -0.053 -14.4 0.019 4.9 -0.075 -14.1 R&D t-1 -0.148 -4.3 -0.307 -7.5 -0.110 -1.4 -0.261 -4.5 CAPEX t-1 -0.045 -1.4 -0.105 -3.8 -0.111 -2.8 -0.144 -4.8 SALE t-1 0.010 12.9 0.008 7.1 0.013 10.6 0.008 6.2 OIBD t-1 -0.608 -17.5 -0.589 -23.4 -0.633 -14.3 -0.658 -31.3 DIVID t-1 -0.034 -10.2 -0.050 -16.7 -0.071 -10.2 -0.073 -14.0 TANG t-1 0.090 7.3 0.113 10.4 0.138 11.0 0.151 14.3 INTANG t-1 0.112 5.4 0.065 3.2 0.162 6.6 0.064 2.8 INVENT t-1 0.039 5.6 0.094 10.6 0.070 7.4 0.121 9.3 NOLCF t-1 0.262 6.5 0.023 0.9 0.348 12.0 0.124 5.5 ITAXC t-1 -0.394 -0.2 -3.817 -2.0 1.618 0.7 -3.944 -1.7 Net debt t-1 0.207 15.0 0.148 15.0 0.230 14.6 0.150 16.4 Net debt t-2 0.211 22.8 0.159 24.8 0.213 20.0 0.171 14.1 Net debt t-3 0.206 23.0 0.146 23.2 0.191 12.9 0.147 18.0 Net debt t-4 0.193 22.4 0.151 24.0 0.179 17.1 0.137 9.9 Net debt t-5 0.211 21.9 0.173 23.5 0.172 14.8 0.118 13.9 Net debt t-6 0.163 13.2 0.125 15.7 Net debt t-7 0.151 14.7 0.119 15.6 Net debt t-8 0.128 10.0 0.107 10.0 Net debt t-9 0.143 13.2 0.117 14.0 Net debt t-10 0.141 16.1 0.119 18.3 Net equity t-1 -0.253 -11.3 -0.232 -9.2 -0.274 -11.0 -0.246 -8.5 Net equity t-2 -0.254 -12.9 -0.201 -11.0 -0.233 -7.6 -0.235 -7.7 Net equity t-3 -0.247 -15.0 -0.182 -11.7 -0.267 -9.7 -0.214 -8.9 Net equity t-4 -0.239 -13.7 -0.153 -12.2 -0.220 -7.2 -0.219 -10.6 Net equity t-5 -0.199 -11.5 -0.064 -4.4 -0.198 -8.9 -0.186 -8.3 Net equity t-6 -0.224 -11.3 -0.167 -11.3 Net equity t-7 -0.217 -9.4 -0.141 -6.4 Net equity t-8 -0.205 -11.4 -0.124 -7.7 Net equity t-9 -0.185 -12.9 -0.090 -7.2 Net equity t-10 -0.210 -14.8 -0.049 -4.7 BL t-6 0.621 78.9 ML t-6 0.509 47.2 BL t-11 0.454 61.7 ML t-11 0.385 39.4 Constant 0.150 19.1 0.298 19.9 0.209 21.5 0.373 21.3 N 33 33 28 28 R-squared 0.599 0.658 0.540 0.631

Table A1. Target leverage regressions The following equation is estimated:
)sticscharacteri firm( 1-itfLit = . The dependent variable, L, is book leverage, defined as the book value of debt (Compustat item 181+10-35-79) divided by the book value of total assets, or market leverage, defined as the book value of debt divided by the market value of total assets. The market value of assets is defined as the book value of total assets minus the book value of debt plus the market value of equity (181+10-35+25*199). All independent variables are lagged by one year. Q is the market-to-book ratio of assets. R&D is the research and development expense (46). CAPEX is the capital expenditure (128). SALE is the log of net sales (12). OIBD is the operating income before depreciation (13). DIVID equals one if a firm pays dividends, and equals zero otherwise. TANG is the net PPE (8). INTANG is the intangibles (33). INVENT is the inventory (3). NOLCF is the net operating loss carry forward (52), and ITAXC is the investment tax credit (208). R&D, CAPEX, OIBD, TANG, INTANG, INVENT, NOLCF, and ITAXC are scaled by assets. We use industry classifications from Kenneth French to classify all firms into 17 industries, two of which are utilities and financials, which are excluded from our sample. Coefficients for 38 time dummies and the 14 industry dummies are not reported for brevity. In columns (5) and (6), the R2 is the average R2 from the 39 annual regressions. (1) (2) (3) (4) (5) (6) Firm fixed-effects
with time dummies
Firm fixed-effects with time dummies
Industry fixed-effects with
time dummies
Industry fixed-effects with
time dummies
Fama-MacBeth
procedure
Fama-MacBeth
procedure Book leverage Market leverage Book leverage Market leverage Book leverage Market leverage Coeff t-stat Coeff t-stat Coeff t-stat Coeff t-stat Coeff t-stat Coeff t-stat Q 0.01 9.4 -0.03 -56.0 -0.01 -8.5 -0.05 -108.3 0.00 0.9 -0.07 -13.6 R&D -0.14 -6.5 -0.34 -22.1 -0.88 -54.8 -0.84 -73.7 -0.92 -16.6 -1.01 -21.3 CAPEX -0.05 -4.5 -0.11 -13.5 0.02 1.6 -0.16 -16.7 0.10 2.2 -0.07 -2.0 SALE 0.02 17.7 0.03 43.7 0.04 71.7 0.03 71.9 0.03 16.7 0.03 22.2 OIBD -0.49 -66.5 -0.41 -81.3 -0.63 -90.1 -0.55 -109.5 -0.67 -24.2 -0.65 -18.6 DIVID -0.06 -25.2 -0.05 -30.3 -0.11 -55.0 -0.09 -66.1 -0.11 -17.9 -0.09 -15.0 TANG 0.17 21.3 0.19 35.1 0.19 33.0 0.19 47.8 0.11 5.2 0.15 9.5 INTANG 0.18 16.3 0.15 19.2 0.34 36.8 0.17 25.4 0.33 21.1 0.19 8.3 INVENT 0.12 11.7 0.15 20.5 0.19 29.1 0.21 45.8 0.11 10.2 0.17 15.0 NOLCF 0.12 48.1 0.02 9.8 0.13 52.5 0.02 10.2 0.23 10.8 0.00 0.2 ITAXC -4.74 -8.4 -2.28 -5.8 -5.93 -12.9 -3.91 -12.0 -2.73 -4.1 -4.99 -4.3 Constant 0.44 58.1 0.27 52.5 0.35 63.2 0.37 94.6 0.39 26.0 0.45 22.2 R2 0.130 0.349 0.199 0.406 0.251 0.422 N 107,187 106,673 107,187 106,673 39 39

Figure 1A
-15
-10
-5
0
5
10
15
20
25
1963
1965
1967
1969
1971
1973
1975
1977
1979
1981
1983
1985
1987
1989
1991
1993
1995
1997
1999
2001
Year
Per
cent
of a
sset
s
average net debt average net equity average change in retained earnings
Figure 1B
-6
-4
-2
0
2
4
6
8
10
12
1963
1965
1967
1969
1971
1973
1975
1977
1979
1981
1983
1985
1987
1989
1991
1993
1995
1997
1999
2001
Year
Per
cent
of a
sset
s
aggregate net debt aggregate net equity aggregate change in retained earnings
Figure 1. Average and aggregate financing activities from the balance sheet. Net debt is the change in debt and preferred stock (Compustat item 181+10-35-79). Net equity is the change in equity and convertible debt (6-181-10+35+79) minus the change in retained earnings (36). The average percents are the EW annual averages of net financing scaled by beginning-of-year assets of each firm (in percent). The aggregate percents are the annual aggregate amount of net financing of all firms in the sample scaled by the aggregate amount of beginning-of-year assets (in percent). Figure 1A presents the average percents, and Figure 1B presents the aggregate percents.

51
Figure 2A
0
2
4
6
8
10
12
14
1971
1973
1975
1977
1979
1981
1983
1985
1987
1989
1991
1993
1995
1997
1999
2001
Year
Per
cent
of a
sset
s
average net debt average net equity
Figure 2B
-2
-1
0
1
2
3
4
5
1971
1973
1975
1977
1979
1981
1983
1985
1987
1989
1991
1993
1995
1997
1999
2001
Year
Per
cent
of a
sset
s
aggregate net debt aggregate net equity
Figure 2. Average and aggregate financing activities from the statement of cash flows. Net debt is the net debt issuance from the statement of cash flows (Compustat item 111-114-301 for firms with format code 1, 111-114+301 for firms with format codes 2, 3, and 7). Net equity is the net equity issuance from the statement of cash flows (108-115). The average percents are the annual averages of net financing scaled by beginning-of-year assets of each firm (in percent). The aggregate percents are the annual aggregate amount of net financing of all firms in the sample scaled by the aggregate amount of beginning-of-year assets (in percent). Figure 2A presents the average percents, and Figure 2B presents the aggregate percents.

52
0
10
20
30
40
50
60
70
1963
1965
1967
1969
1971
1973
1975
1977
1979
1981
1983
1985
1987
1989
1991
1993
1995
1997
1999
2001
Year
Per
cent
median book leverage median market leverage
Figure 3. Median leverage. Book leverage is defined as the book value of debt (Compustat item 181+10-35-79) divided by the book value of assets. Market leverage is defined as the book value of debt divided by the market value of assets. The market value of assets is defined as the book value of total assets minus the book value of debt plus the market value of equity (181+10-35+25*199).
-4
-2
0
2
4
6
8
10
12
14
16
1963
1965
1967
1969
1971
1973
1975
1977
1979
1981
1983
1985
1987
1989
1991
1993
1995
1997
1999
2001
Year
Ann
ual p
erce
nt r
ate
real GDP grow th Inflation
Figure 4. Inflation and real GDP growth. Inflation is the growth rate of the Consumers Price Index. Real GDP growth is the real growth rate of Gross Domestic Product from year t-1 to t.

53
-6
-4
-2
0
2
4
6
8
10
12
14
1962
1964
1966
1968
1970
1972
1974
1976
1978
1980
1982
1984
1986
1988
1990
1992
1994
1996
1998
2000
Year
Per
cent
default spread equity risk premium
Figure 5. Equity risk premium and default spread. The market equity risk premium is estimated using analyst forecasts at the year-end for the Dow 30 stocks from Value Line for 1968-1976 and from I/B/E/S for 1977-2001. The default spread is the yield difference at the year-end between Moody’s Baa and Aaa rated bonds.
-20
-10
0
10
20
30
40
50
60
70
80
1962
1964
1966
1968
1970
1972
1974
1976
1978
1980
1982
1984
1986
1988
1990
1992
1994
1996
1998
2000
Year
Per
cen
t
average f irst-day return of IPOs average discount on closed-end funds
Figure 6. Average first-day return of IPOs and closed-end fund discount. The annual average of first-day returns of initial public offerings, including unit and penny stock IPOs, can be found at http://bear.cba.ufl.edu/ritter/ipodata.htm. The closed-end fund discount is the value-weighted average of closed-end fund discounts at the year-end from Malcolm Baker and Jeffrey Wurgler, who construct the series by combining several sources (Neal and Wheatley, 1962-1993; CDA/Weisenberger, 1994-1998; and the Wall Street Journal, 1999-2001).

54
0.0
0.1
0.2
0.3
0.4
0.5
0.6
0.7
0.8
0.9
1.0
1963
1965
1967
1969
1971
1973
1975
1977
1979
1981
1983
1985
1987
1989
1991
1993
1995
1997
1999
2001
Year
slop
e co
effic
ient
Figure 7. Pecking order slope coefficients. Coefficients are computed annually by estimating equation (1), and are reported in Table 5.
�D>0 �E>0DEF>0
�D>0 �E<0DEF>0
�D<0 �E<0DEF<0
�D>0 �E<0DEF<0
�D<0 �E>0DEF<0
�D<0 �E>0DEF>0
DEF
�D45 degree line
Figure 8. External financing activities. The horizontal axis is the external financing deficit, and the vertical axis is net debt issuance. �D is net debt issuance, �E is net equity issuance, and DEF is net external financing.

55
Figure 9. Scatter-plots of net debt versus net external financing. The horizontal axis denotes net external financing scaled by beginning-of-year assets, and the vertical axis denotes net debt scaled by beginning-of-year assets. For each selected year, 100 randomly selected observations are plotted. The pecking order slope coefficient in Table 5 is 0.727 for 1969, 0.909 for 1975, 0.768 for 1982, 0.482 for 1983, 0.423 for 1992, and 0.268 for 2000, respectively.
45-degree line 45-degree line
45-degree line
45-degree line 45-degree line
45-degree line