Embed Size (px)
Citation preview
ISSN 2039-2117 (online) ISSN 2039-9340 (print)
Mediterranean Journal of Social Sciences
Vol 10 No 2 March 2019
81
.
Research Article© 2019 Jomtarak et.al..
This is an open access article licensed under the Creative CommonsAttribution-NonCommercial-NoDerivs License
(http://creativecommons.org/licenses/by-nc-nd/3.0/).
Testing Construct Validity of Competency Indicators of Scientific Literacy in Junior Secondary Students
Chayada Jomtarak
Peerawut Suwanjan
Phadungchai Pupat
Faculty of Industrial Education and Technology,
King Mongkut’s Institute of Technology Ladkrabang (KMITL)
Rangsan Jomtarak
Faculty of Science and Technology, Suan Dusit University
Doi: 10.2478/mjss-2019-0025 Abstract
This research aimed to check the construct validity of competency indicators of scientific literacy in junior secondary students. The steps for conducting the research included a sample of 392 persons, derived from stratified random sampling, from a population of 22,855. The instrument used in this research is a measurement tool with a reliability of 0.838. Statistical analysis includes confirmatory factor analysis, mean, standard deviation, and one-way analysis of variance. The study results found that scientific literacy indicators of junior secondary students had construct validity by taking into consideration Chi-square = 20.842, df = 17, p = 0.233 and 𝑋 𝑑𝑓⁄ = 1.226. which was less than 2, while RMSEA = 0.024, RMR = 0.07, which was near to 0, GFI = 0.987, AGFI = 0.972, CFI = 0.979.
Keywords: scientific literacy, competency indicators, construct validity, testing
Introduction 1.
It is the 21st century, an era with tremendous technological advancement. The Basic Education Core Curriculum B.E.2551 (2008) stated that “Science plays an important role in our present and future world communities, as it concerns all of us in our daily lives and livelihoods. Science also involves technologies” (Office of the Basic Education Commission, 2012). Bybee, 2009, indicated that “in order to achieve the goals of scientific and technological literacy for teaching and learning science in a secondary education, students are enabled to understand that science and technology are a part of a society”. Laugksch (2000, p.73) stated that study, research, and importance given to scientific literacy for individuals are more various than educationists, which enable the frame of thought of scientific literacy to have diversified and continual conceptual development. Scientific literacy, based on the concepts of literacy, justice, and happiness, seems to be an easily understood word, and shows a basic quality that is a general human need. However, the use of scientific literacy in various contexts becomes a complicated and difficult matter when explaining it in real practice, especially for instructors, or when trying to provide the same understanding for people at different levels of ability. As a result, disagreement and discussion about scientific literacy
ISSN 2039-2117 (online) ISSN 2039-9340 (print)
Mediterranean Journal of Social Sciences
Vol 10 No 2 March 2019
82
occur widely. Laugksch (2000, p.74) gathered documents and research studies associated with scientific literacy, and made a conclusion about 5 factors affecting how scientific literacy is interpreted as follows: 1) a group conducting a study about scientific literacy, which is called an interest group, 2) conceptual definitions, 3) nature of concept, 4) purpose of scientific literacy support, and 5) ways of measuring. Each factor involves different methods and concepts, but connect to each other. Therefore, they have different impacts on the recognition and interpretation of the word “scientific literacy”. Based on Laugksch’s concept, the 5 factors are explained initially by dividing interest groups that are concerned with scientific literacy into 4 groups. Each group has a concept for definition that can reflect the nature of the determined concept and connect to a guideline for goal setting, including measuring guidelines for each interest group. Each interest group has various and different points of view. In this research, Laugksch’s concept (2000, p.74-82) is used, especially for the interest groups, and connected to other related factors that enable the interpretation or determination of frames of thought for scientific literacy that are different.
From the above mentioned problems, to make use of and develop the competency of individuals at the maximum range is necessary. Consequently, the 10th educational development plan formulated a policy to reform teaching and learning systems by focusing on modifying the process of teaching and learning to be able to support the development of learner capacity with full competency, and to have fundamental of knowledge and capability, good basic skills, and enough strength to earn their own living or study further at a higher level, including providing a guideline for instructors to modify their teaching and learning methods to be student-centered learning, to focus on systematic and critical thinking, to cultivate a love of learning among learners, and to enable them to know how to think critically, how to synthesize, how to seek knowledge, how to solve problems on their own, and how to work as a team. In the meantime, emphasis is placed on instructors to be able to manage teaching and learning methods to have diversity and to connect learning methods in academic contexts with real problems and experiences in real life. Therefore, a learning cycle is a method for teaching and learning management where emphasis is placed on student-centered learning that enables learners to build bodies of knowledge by themselves, obtaining meaningful learning on their own in accordance with the theory of knowledge creativity groups (Lawson, 1975, p.336-343).
The evaluation of the quality of education conducted by the Department of Curriculum and Instruction Development (Office of the National Education, 2008: online) found that students of Matthayom Suksa 2 across the country had low scores on the learning accomplishment test, especially in the science subject and in their capability to solve scientific problems. Meanwhile, errors were found in creative teaching, with teaching and learning methods used that had a tendency to enforce, follow, or imitate rather than learn in accordance with knowledge creativity. Students were not practiced to activate their thinking skills (The Institute for the Promotion of Teaching Science and Technology, 2008, p.2). Therefore, science competency plays an important role, as it should be of more interest to be instilled in or promoted to students. Since science is the most important factor to develop the country in terms of objects and human resources, to meet quality and perfectness in all aspects, instructors should consider developing students’ science competency at the same time as managing teaching and learning activities. This is consistent with Sawatanapaiboon (2003, p.132), who said, when discussing social circumstances, that it was absolutely appropriate to organize scientific teaching and learning activities, stressing on developing students’ science competency, that aimed at enabling youths to depend on their own accordingly, and is also consistent with the research study conducted by Thepart (2009, p.120).
Knowledge and understanding of science and technology is an absolutely essential tool for preparing youths to be able to live their lives and participate in science and technology-based societies, as science relates to everyone (Ministry of Education, 2008). Today, the goal of studying science stresses giving importance to enable learners to have scientific literacy (Klainil, Dechsri, and Pramotenee, 2008). The OECD (the Organization for Economic Co-operation and Development) Program for International Student Assessment (PISA) in 2015 gave the definition of scientific literacy as the ability to engage with science-related issues, and with the ideas of science,
ISSN 2039-2117 (online) ISSN 2039-9340 (print)
Mediterranean Journal of Social Sciences
Vol 10 No 2 March 2019
83
as a reflective citizen. Scientific literacy started in the United States of America based on the policy that people need to have a basic knowledge of scientific principles, leading to an important goal concerning scientific study in the United States after educational reform. Since the increase in scientific and economic competition, it has been determined to be a target of scientific management in the education management in many countries. Scientific literacy is scientific management in educational management that changes in accordance with social requirements. The Basic Education Core Curriculum B.E.2551 (2008) mentioned that “science plays an important role in our present and future world communities as it concerns all of us in our daily lives and livelihoods. Science also involves technologies, instruments, devices and various products at our disposal, which facilitate our life and work. All these benefit from our scientific knowledge which is combined with creativity as well as other disciplines. Science enables us to develop our thinking skills in various aspects; logical, creative, analytical and critical. It also enables us to acquire essential investigative skills for seeking knowledge and allows the ability for systematic problem-solving and for verifiable decision-making based on culture of the new world known as knowledge-based society.
Therefore, all of us need to be provided with scientific knowledge development so as to acquire knowledge and understanding of nature and man-made technologies that can be applied through logical, creative and moral approaches.” Scientific knowledge empowers technology development, and technologies play important roles in speeding up scientific knowledge exploration. Therefore, knowledge for systematic problem-solving is a culture in the new world, which is a knowledge-based society, in determining requirements, accessibility, management, assessment, integration, creativity, and information and communication, including good characteristics of effective learning and for the workplace. The aforementioned literacy that can occur requires basics of knowledge, skills, and attitude. Persons with positive attitude can express how they see value and benefit and how they pay attention to create and perform their tasks successfully.
From the above-mentioned problems, developing students to become scientific specialists is extremely necessary and important. With regard to the development of students to become scientific specialists, educationists have provided a lot of recommendations and development guidelines; for example, the enhancement and development of language skills, in terms of speaking, writing, and reading, with the process of knowledge discovery (Baker et al., 2009, p.261; Webb, 2009, p.328; and Ritchie, Tomas, & Tones, 2011, p.685), in order to obtain indicators for developing science learners to have knowledge, skills and positive attitudes. The researcher is interested in developing competency indicators of scientific literacy for junior secondary students, so as to use them as a framework to develop students who study in the field of science.
Objectives 2. This research, for checking the construct validity of competency indicators of scientific literacy in junior secondary student, aims
1. To check competency indicators of scientific literacy in junior secondary students, and 2. To analyze competency indicators of scientific literacy in junior secondary students.
Design of the Study 3.
3.1 Population and sample Sources of data, population and sample
The population in this research was 22,855 junior secondary students affiliated to Bangkok Education District Office 2, which was divided by school size; extra-large, large, and medium-sized schools (data as of 10 June, 2015).
The sample was 392 junior secondary students affiliated to Bangkok Education District Office 2, derived by stratified random sampling. The Taro Yamane formula was taken into consideration, with a confidence level of 95 percent. Multi-stage random sampling was involved, and included the
ISSN 2039-2117 (online) ISSN 2039-9340 (print)
Mediterranean Journal of Social Sciences
Vol 10 No 2 March 2019
84
following parts; Part 1: Questionnaires about the general information of respondents, comprising check list
questions, and Part 2: A measuring model about scientific literacy for junior secondary students, with 30
question items. 1) Concepts and theories about indicators of scientific literacy components for junior
secondary students were studied and notes taken in document analysis forms; 2) A measuring model was made, following indicators of scientific literacy for junior
secondary students; 3) Content validity was checked item by item by 5 experts. The evaluation results from the
experts were used to calculate an index of item-objective congruence (IOC). It was determined that the index of item-objective congruence equal to or higher than +.05 = acceptable content validity, and it was found that all question items had an index of item-objective congruence greater than +.05.
4) All 30 question items in the measuring model were used to pre-test (try out) with junior secondary students, who were not the sample of 30 persons, to check discrimination power for each item and reliability. It was found that all of the question items had discrimination power that met the criteria, and the reliability level of the measurement form was at 0.838.
Data collection 4.
The data from the questionnaires was collected by the researcher from the students who were the sample; junior secondary students affiliated to Bangkok Education District Office 2.
Data analysis 5.
1) The data from the measuring model was analyzed to confirm indicators of scientific literacy components for junior secondary students, in accordance with the research objectives. Confirmatory factor analysis (CFA) was employed with the following methods.
2) Assumptions of the analysis of indicators of scientific components were analyzed to verify suitability for making a composition to create many variables with the method.
3) A goodness of fit test for the model was conducted; this was a study about the big picture of the model to see if it was in harmony with the empirical data or not. This is a typical statistic widely used to check the goodness of fit for a model (Joreskog & Sorbom, 1993; Diamantopoulos & Siguaw, 2000; Kline, 2005). a. The Kaiser-Meyer-Olkin Measure of Sampling Adequacy (KMO or MSA) test was used
to measure how suited the brought data was for factor analysis. The KMO or MSA values had to be greater than 0.50 to be used for factor analysis.
b. Bartlett’s test of Sphericity was used to measure the degree of the relationship between variables. If statistical significance was found, that meant variables were correlated and could be used for factor analysis.
c. The technique of maximum likelihood (ML) was used to estimate the parameter of the model.
4) Goodness of fit for measuring model and empirical data was considered. The statistics used in the test comprised: a. Chi-Square statistics; commonly used to examine goodness of fit or the validity of the
types of relationship, based on hypotheses and empirical data. b. Goodness of fit index (GFI) was used to measure goodness of fit or validity of the
model, according to theories and empirical data.
ISSN 2039-2117 (online) ISSN 2039-9340 (print)
Mediterranean Journal of Social Sciences
Vol 10 No 2 March 2019
85
c. Adjusted Goodness of Fit Index (AGFI) brought degrees of freedom, a number of variables, and the size of sample to correct the GFI.
d. Root Mean Square Residual Error of Approximation (RMSEA) was used. e. Root Mean Residual (RMR), an index indicating discrepancy from the comparison of
the level of goodness of fit of the model and empirical data, was used. The criteria used to consider the goodness of fit of the model and empirical data is
summarized in Table 3.1 (Kaiyawan, 2013:161). Table 1: Summary of the criteria considering the goodness of fit of the model
Goodness of fit index Acceptable criteria Chi-square p-value greater than 0.05 RMSEA p-value close to 0 is best GFI p-value ranges between 0-1, with 1 the most suitable value AGFI > 0.90
Research results 6.
Symbols in the research
RMSEA Root Mean Square Residual Error of Approximation GFI Goodness of Fit Index AGFI Adjusted Goodness of Fit Index kn knowledge (kn1) the use of scientific knowledge to identify science-related issues (kn2) ability to explain phenomena scientifically (kn3) ability to interpret data and evidence scientifically (kn4) knowledge and principles for effective use of questions that enhance thinking (kn5) the process of seeking scientific knowledge at qualification (at1) retrieval of scientific knowledge (at2) curiosity (at3) interest in and support for the retrieval of scientific knowledge The measuring model of knowledge competency (kn) comprised 5 observed variables that
included the use of scientific knowledge to identify science-related issues (kn1), the ability to explain phenomena scientifically (kn2), the ability to interpret data and evidence scientifically (kn3), knowledge and understanding of the natural world (kn4), and the process of seeking scientific knowledge (kn5). The results of the confirmatory factor analysis are seen in Table 2: Table 2: Mean, standard deviation, and correlation coefficient of observed variables in the measuring model of knowledge competency
Correlation Observed variables kn1 kn2 kn3 kn4 kn5 kn1 1.000 kn2 0.098 1.000 kn3 0.03 0.155 1.000 kn4 0.094 0.067 0.076 1.000 kn5 0.058 0.070 0.191 0.097 1.000 Mean 2.843 3.172 2.766 2.985 3.105 S 0.463 0.416 0.731 0.628 0.386 Kaiser-Meyer-Olkin Measure of Sampling Adequacy = 0.528 Bartlett's Test of Sphericity : Chi-Square = 40.803, df = 10, p = 0.000
From Table 2, it is found that the correlation coefficient in the 5 observed variables of the measuring
ISSN 2039-2117 (online) ISSN 2039-9340 (print)
Mediterranean Journal of Social Sciences
Vol 10 No 2 March 2019
86
model of knowledge competency is related to all 10 pairs of variables. The correlation coefficient ranges between 0.191 and 0.030. Bartlett’s Test of Sphericity indicates Chi-Square value = 40.803, df = 10, p = 0.000. It can be noticed that the correlation matrix is different from the identity matrix, with a statistical significance level of 0.05. This is consistent with the analysis results from the Kaiser-Meyer-Olkin (KMO) test of a value of 0.528, which is close to 1. This shows that the variables are correlated sufficiently and were suitable to use for the confirmatory factor analysis of competency. Table 3: The results of confirmatory competency analysis of the measuring model of knowledge competency
Competency Observed variables
Knowledge competency 𝑏 S.E. T 𝑅 kn kn1 0.390 <--> <--> 0.152 kn2 0.295 0.329 2.045 0.087 kn3 0.439 <--> <--> 0.193 kn4 0.222 0.418 1.831 0.049 kn5 0.311 0.295 2.242 0.097 Chi-square = 4.051, df = 4, p = 0.399, 𝑋 𝑑𝑓⁄ = 1.031, RMSEA = 0.006, RMR = 0.007, GFI = 0.9936, AGFI = 0.985, CFI = 0.998
Remark: 𝑏 means the weight of standard competency, 𝑅 means the coefficient of prediction, and the mark: <--> means a fixed parameter that does not report S.E and t values
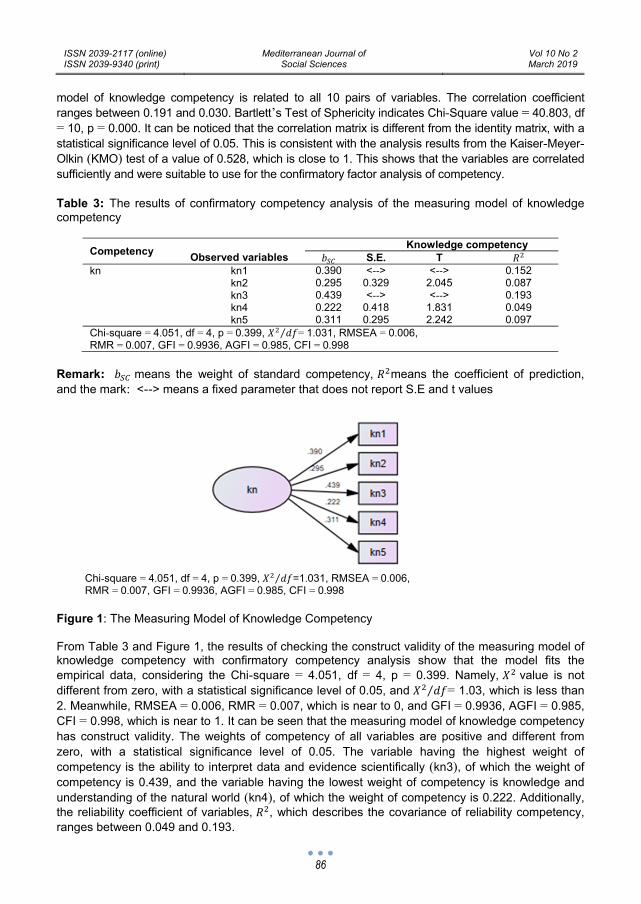
Chi-square = 4.051, df = 4, p = 0.399, 𝑋 𝑑𝑓⁄ =1.031, RMSEA = 0.006, RMR = 0.007, GFI = 0.9936, AGFI = 0.985, CFI = 0.998
Figure 1: The Measuring Model of Knowledge Competency From Table 3 and Figure 1, the results of checking the construct validity of the measuring model of knowledge competency with confirmatory competency analysis show that the model fits the empirical data, considering the Chi-square = 4.051, df = 4, p = 0.399. Namely, 𝑋 value is not different from zero, with a statistical significance level of 0.05, and 𝑋 𝑑𝑓⁄ = 1.03, which is less than 2. Meanwhile, RMSEA = 0.006, RMR = 0.007, which is near to 0, and GFI = 0.9936, AGFI = 0.985, CFI = 0.998, which is near to 1. It can be seen that the measuring model of knowledge competency has construct validity. The weights of competency of all variables are positive and different from zero, with a statistical significance level of 0.05. The variable having the highest weight of competency is the ability to interpret data and evidence scientifically (kn3), of which the weight of competency is 0.439, and the variable having the lowest weight of competency is knowledge and understanding of the natural world (kn4), of which the weight of competency is 0.222. Additionally, the reliability coefficient of variables, 𝑅 , which describes the covariance of reliability competency, ranges between 0.049 and 0.193.
ISSN 2039-2117 (online) ISSN 2039-9340 (print)
Mediterranean Journal of Social Sciences
Vol 10 No 2 March 2019
87
Table 4: Mean, standard deviation, and correlation coefficient of observed variables in the measuring model of qualification competency
Observed variables Correlation at1 at2 at3
at1 1.000 at2 0.309 1.000 at3 0.302 0.466 1.000 Mean 3.193 3.421 3.395 S 0.324 0.332 0.277 Kaiser-Meyer-Olkin Measure of Sampling Adequacy = 0.623 Bartlett's Test of Sphericity : Chi-Square = 148.395, df = 3, p = 0.000
From Table 4, it is found that the correlation coefficient in 3 observed variables of the measuring model of qualification competency is correlated with all 3 pairs of variables. The correlation coefficient ranges between 0.466 and 0.302. Bartlett's Test of Sphericity indicates Chi-Square = 148.395, df = 3, p = 0.000. It can be seen that the correlation matrix is different from the identity matrix, with a statistical significance level of 0.05. This is consistent with the analysis results from the Kaiser-Meyer-Olkin (KMO) test, where the value is 0.623, which is close to 1. This shows that the variables are correlated sufficiently, and were suitable to be used for confirmatory competence analysis. Table 5: The results of confirmatory competency analysis of the measuring model of qualification competency
Competency Observed variables
Qualification competency 𝑏 S.E. t 𝑅 at at1 0.500 <--> <--> 0.250 at2 0.638 <--> <--> 0.407 at3 0.693 0.091 7.085 0.480 Chi-square = 1.883, df = 1, p = 0.170, 𝑋 𝑑𝑓⁄ = 1.883, RMSEA = 0.048, RMR = 0.003, GFI = 0.997, AGFI = 0.981, CFI = 0.994
Remark: 𝑏 means the weight of standard competency, 𝑅 means the coefficient of prediction, and the mark: <--> means a fixed parameter that does not report S.E. and t values, as shown in Figure 2
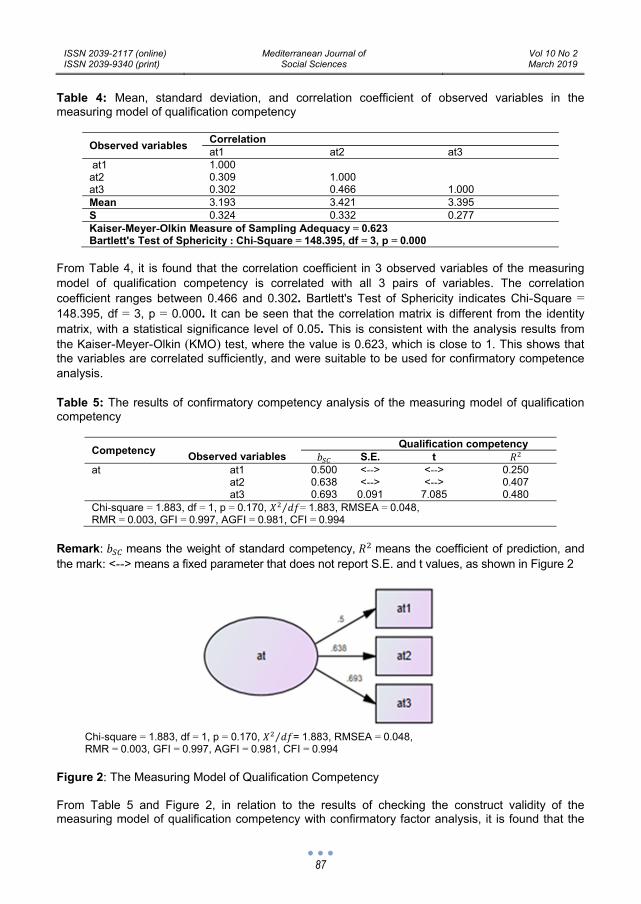
Chi-square = 1.883, df = 1, p = 0.170, 𝑋 𝑑𝑓⁄ = 1.883, RMSEA = 0.048, RMR = 0.003, GFI = 0.997, AGFI = 0.981, CFI = 0.994
Figure 2: The Measuring Model of Qualification Competency From Table 5 and Figure 2, in relation to the results of checking the construct validity of the measuring model of qualification competency with confirmatory factor analysis, it is found that the
ISSN 2039-2117 (online) ISSN 2039-9340 (print)
Mediterranean Journal of Social Sciences
Vol 10 No 2 March 2019
88
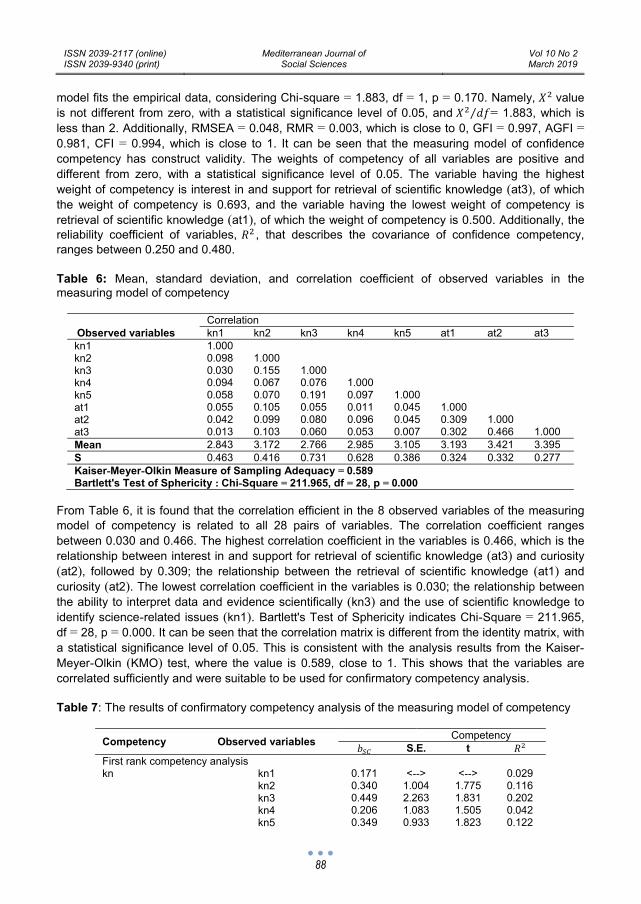
model fits the empirical data, considering Chi-square = 1.883, df = 1, p = 0.170. Namely, 𝑋 value is not different from zero, with a statistical significance level of 0.05, and 𝑋 𝑑𝑓⁄ = 1.883, which is less than 2. Additionally, RMSEA = 0.048, RMR = 0.003, which is close to 0, GFI = 0.997, AGFI = 0.981, CFI = 0.994, which is close to 1. It can be seen that the measuring model of confidence competency has construct validity. The weights of competency of all variables are positive and different from zero, with a statistical significance level of 0.05. The variable having the highest weight of competency is interest in and support for retrieval of scientific knowledge (at3), of which the weight of competency is 0.693, and the variable having the lowest weight of competency is retrieval of scientific knowledge (at1), of which the weight of competency is 0.500. Additionally, the reliability coefficient of variables, 𝑅 , that describes the covariance of confidence competency, ranges between 0.250 and 0.480. Table 6: Mean, standard deviation, and correlation coefficient of observed variables in the measuring model of competency
Correlation Observed variables kn1 kn2 kn3 kn4 kn5 at1 at2 at3 kn1 1.000 kn2 0.098 1.000 kn3 0.030 0.155 1.000 kn4 0.094 0.067 0.076 1.000 kn5 0.058 0.070 0.191 0.097 1.000 at1 0.055 0.105 0.055 0.011 0.045 1.000 at2 0.042 0.099 0.080 0.096 0.045 0.309 1.000 at3 0.013 0.103 0.060 0.053 0.007 0.302 0.466 1.000 Mean 2.843 3.172 2.766 2.985 3.105 3.193 3.421 3.395 S 0.463 0.416 0.731 0.628 0.386 0.324 0.332 0.277 Kaiser-Meyer-Olkin Measure of Sampling Adequacy = 0.589 Bartlett's Test of Sphericity : Chi-Square = 211.965, df = 28, p = 0.000
From Table 6, it is found that the correlation efficient in the 8 observed variables of the measuring model of competency is related to all 28 pairs of variables. The correlation coefficient ranges between 0.030 and 0.466. The highest correlation coefficient in the variables is 0.466, which is the relationship between interest in and support for retrieval of scientific knowledge (at3) and curiosity (at2), followed by 0.309; the relationship between the retrieval of scientific knowledge (at1) and curiosity (at2). The lowest correlation coefficient in the variables is 0.030; the relationship between the ability to interpret data and evidence scientifically (kn3) and the use of scientific knowledge to identify science-related issues (kn1). Bartlett's Test of Sphericity indicates Chi-Square = 211.965, df = 28, p = 0.000. It can be seen that the correlation matrix is different from the identity matrix, with a statistical significance level of 0.05. This is consistent with the analysis results from the Kaiser-Meyer-Olkin (KMO) test, where the value is 0.589, close to 1. This shows that the variables are correlated sufficiently and were suitable to be used for confirmatory competency analysis. Table 7: The results of confirmatory competency analysis of the measuring model of competency
Competency Observed variables Competency 𝑏 S.E. t 𝑅 First rank competency analysis kn kn1 0.171 <--> <--> 0.029 kn2 0.340 1.004 1.775 0.116 kn3 0.449 2.263 1.831 0.202 kn4 0.206 1.083 1.505 0.042 kn5 0.349 0.933 1.823 0.122
ISSN 2039-2117 (online) ISSN 2039-9340 (print)
Mediterranean Journal of Social Sciences
Vol 10 No 2 March 2019
89
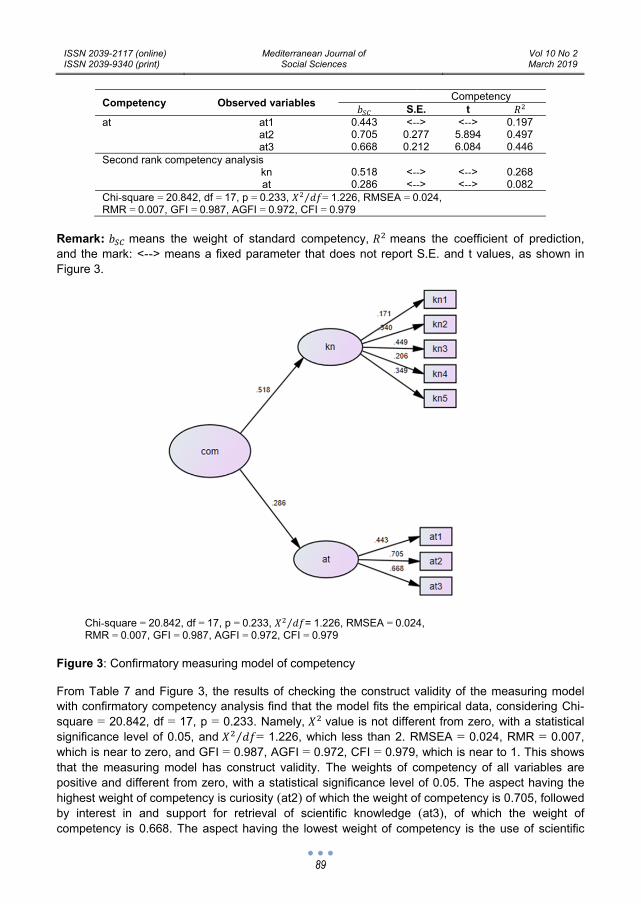
Competency Observed variables Competency 𝑏 S.E. t 𝑅 at at1 0.443 <--> <--> 0.197 at2 0.705 0.277 5.894 0.497 at3 0.668 0.212 6.084 0.446 Second rank competency analysis kn 0.518 <--> <--> 0.268 at 0.286 <--> <--> 0.082 Chi-square = 20.842, df = 17, p = 0.233, 𝑋 𝑑𝑓⁄ = 1.226, RMSEA = 0.024, RMR = 0.007, GFI = 0.987, AGFI = 0.972, CFI = 0.979
Remark: 𝑏 means the weight of standard competency, 𝑅 means the coefficient of prediction, and the mark: <--> means a fixed parameter that does not report S.E. and t values, as shown in Figure 3.
Chi-square = 20.842, df = 17, p = 0.233, 𝑋 𝑑𝑓⁄ = 1.226, RMSEA = 0.024, RMR = 0.007, GFI = 0.987, AGFI = 0.972, CFI = 0.979
Figure 3: Confirmatory measuring model of competency From Table 7 and Figure 3, the results of checking the construct validity of the measuring model with confirmatory competency analysis find that the model fits the empirical data, considering Chi-square = 20.842, df = 17, p = 0.233. Namely, 𝑋 value is not different from zero, with a statistical significance level of 0.05, and 𝑋 𝑑𝑓⁄ = 1.226, which less than 2. RMSEA = 0.024, RMR = 0.007, which is near to zero, and GFI = 0.987, AGFI = 0.972, CFI = 0.979, which is near to 1. This shows that the measuring model has construct validity. The weights of competency of all variables are positive and different from zero, with a statistical significance level of 0.05. The aspect having the highest weight of competency is curiosity (at2) of which the weight of competency is 0.705, followed by interest in and support for retrieval of scientific knowledge (at3), of which the weight of competency is 0.668. The aspect having the lowest weight of competency is the use of scientific
ISSN 2039-2117 (online) ISSN 2039-9340 (print)
Mediterranean Journal of Social Sciences
Vol 10 No 2 March 2019
90
knowledge to identify science-related issues (kn1), of which the weight of competency is 0.171. Additionally, the reliability coefficient of variables, 𝑅 , that describes the covariance of competency, ranges between 0.029 and 0.497.
Discussion 7. This research concerned the development of competency indicators of scientific literacy in junior secondary students, so that the research discussion can be conducted within the desired frame. Therefore, the researcher separates the discussion into aspects in terms of knowledge and qualification, according to the following:
1. Knowledge comprises current situations in the 21st century and knowledge about the world. This is consistent with Hunter (2004, p.101) and Morais and Ogden (2010, p.448) who gave importance to knowledge and understanding and explanation about the causes and impact of incidences, problems, and situations in the current world. This is in harmony with Brustein (2002, as cited in Hunter, 2004, p.11) who described that such knowledge could help raise awareness of changes leading to adjustment in living life appropriately. Curren (2003, as cited in Hunter, 2004, p.11) said that understanding of such knowledge could raise awareness of how a person’s action could have an impact on the world, and how the world also has an influence on a person. All 5 observed variables of the measuring model of knowledge competency are correlated with all 10 pairs of variables. The correlation coefficient ranges between 0.191 and 0.030, and the highest correlation coefficient of variables is 0.191; the relationship between the process of seeking scientific knowledge (kn5) and the ability to interpret data and evidence scientifically (kn3), followed by 0.155; the relationship between the ability to interpret data and evidence scientifically (kn3) and the ability to explain phenomena scientifically (kn2). The lowest correlation coefficient of variables is 0.030; the relationship between the ability to interpret data and evidence scientifically (kn3) and the use of scientific knowledge to identify science-related issues (kn1). The results of checking the construct validity of the measuring model of knowledge competency find that the model fits with the empirical data, considering Chi-square = 4.051, df = 4, p = 0.399. Namely, 𝑋 value is not different from zero, with a statistical significance level of 0.05, and 𝑋 𝑑𝑓⁄ = 1.031, which is lower than 2. Meanwhile, RMSEA = 0.006, RMR = 0.007, which is near to 0, and GFI = .9936, AGFI = 0.985, CFI = 0.998, which is near to 1. This means that the measuring model of knowledge competency has construct validity. With regard to the weights of competency of variables, they are positive and different from zero, with a statistical significance level of 0.05. The variable having the highest weight is the ability to interpret data and evidence scientifically (kn3), of which the weight of competency is 0.439, and the variable having the lowest weight of competency is knowledge and understanding of the natural world (kn4), of which the weight of competency is 0.222.
2. Qualification comprises leading oneself and thirst for knowledge and learning. This is consistent with the Swiss Consulting Group (2002, as cited in Hunter, 2004, p.11), who said that a person with global competencies must lead oneself or a team to meet success in works as planned and know how to develop a strategy. In relation to becoming a global citizen, this is consistent with Reimers (2009, p.3), who said that those with global competencies should know how to accept different opinions, admire and pay respect to a diversity of cultures, be enthusiastic in following news and incidences that are world problems, and see the importance of and solve problems that have impact on regions. Curren (2003, as cited in Hunter, 2004, p.11) said that people with global competencies must show their awareness of how their actions have an impact on the world, and how the world also has an influence on them. The results of the confirmatory competency analysis
ISSN 2039-2117 (online) ISSN 2039-9340 (print)
Mediterranean Journal of Social Sciences
Vol 10 No 2 March 2019
91
find that the correlation coefficient in 3 observed variables of the measuring model of qualification competency is correlated with all 3 pairs of variables. The correlation coefficient ranges between 0.466 and 0.302. The highest correlation coefficient of variables is 0.466; curiosity (at2) and interest in and support for the retrieval of scientific knowledge (at3), followed by 0.309; the relationship between retrieval of scientific knowledge (at1) and curiosity (at2).The lowest correlation coefficient of variables is 0.302; the relationship between interest in and support for the retrieval of scientific knowledge (at3) and the retrieval of scientific knowledge (at1). The results of checking the construct validity of the measuring model of qualification competency with confirmatory competency analysis find that the model fits the empirical data, considering Chi-square = 1.883, df = 1, p = 0.170. Namely, 𝑋 value is not different from zero, with a statistical significance level of 0.05, and 𝑋 𝑑𝑓⁄ = 1.883, which is less than 2, while RMSEA = 0.048, RMR = 0.003, which is near to 0, and GFI 0.997, AGFI = 0.981, CFI = 0.994, which is near to 1. This shows that the measuring model of confidence had construct validity. The weights of competency of all variables are positive and different from zero, with a statistical significance level of 0.05. The variable having the highest weight of competency is interest in and support for the retrieval of scientific knowledge (at3), of which the weight of competency is 0.693, and the variable having the lowest weight of competency is retrieval of scientific knowledge (at1), of which the weight of competency is 0.500. It can be seen that the body of fundamental scientific knowledge can be applied to connect with social issues (NSTA, 1993, p.3; Aikenhead, 2005, p.392).
Recommendation 8.
There should be an increase in the development of competency indicators of skill competency for junior secondary students and in the development of curriculums that enhance scientific literacy competency for junior secondary students in all aspects. References Aikenhead, G.S. (2005). Research into STS Science Education. Education Quimica. 16(3): 384-397. Baker, D.R. et al. (2009). The Communication in Science Inquiry Project (CISIP): A Project to Enhance
Scientific Literacy through the Creation of Science Classroom Discourse Communities. International Journal of Environmental & Science Education. 4(3): 259-274
Bybee, R. W. (2009). PISA 2006: An Assessment of Scientific Literacy. Journal of Research in Science Teaching, 46(8), 865–883.
Hunter, A. (2004). Knowledge Skills Attitudes and Experiences Necessary to Become Globally Competent. Lehigh University.
Joreskog, K.G. & Sorbom, D. (1996). LISREL8 User’s Reference Guide. United States: Scientific Software International.
Laugksch, R.C. (2000). Scientific Literacy: A Conceptual Overview. Science Education, 84, 71-94 Lawson, A.E. (1975). Science Teaching and the Development of Thinking. Belmont: Wadsworth. Morais, D. and Ogden, A. (2010). Initial Development and Validation of the Global Citizenship Scale. Retrieved
August 20, 2015, from www.sagepublication.com. Nation Science Teacher Association [NSTA]. (1993). Science/Technology/Society: A New Effort for Providing
Appropriate Science for All. Washington D.C.: The Nation Science Teacher Association. Reimers, F. (2009). Educating for global competency. Retrieved August 20, 2015, from
www.sagepublication.com OECD. (2009). PISA 2009 Assessing Framework: Key Competencies in Reading Mathematical and science.
Retrieved April 2010 from http://www.oecd.org/document/44/0,3343,en_2649_35845621_44455276 _1_1_1_1,00.html.pdf.
Yamane, T. 1973. Statistics: An Introductory Analysis. Third edition. New York: Harper and Row Publication. Ministry of Education. (2008). Basic Education Core Curriculum B.E.2551 (2008). Bangkok: The Agricultural
Cooperative Federation of Thailand.

ISSN 2039-2117 (online) ISSN 2039-9340 (print)
Mediterranean Journal of Social Sciences
Vol 10 No 2 March 2019
92
Ministry of Education. Basic Education Core Curriculum B.E. 2551 (2008). Bangkok: The Agricultural Cooperative Federation of Thailand Printing Press, 2009.
Ministry of Education. (2009). Indicators and Core Subjects, Science Subject Group in accordance with Basic Education Core Curriculum B.E.2551 (2008). Bangkok: The Agricultural Cooperative Federation of Thailand Printing Press.
PISA Thailand. The Institute for the Promotion of Teaching Science and Technology. (2008). The Sample of International Science Assessment: PISA and TIMSS. Bangkok: Arun Printing Press.
Klainil, S., Dechsri, P., and Pramotenee, A. (2008). Scientific Knowledge and Scientific Literacy for Tomorrow’s World. Bangkok: Seven Printing Group Company Limited.
Office of the National Economic and Social Development Board. The 10th National Economic and Social Development Plan (2007-2011). Retrieved October 2014, from http://www.ldd.go.th.