Embed Size (px)
Citation preview

Test Report Fuelade Catalyst at London Mining -
Marampa
OPR
Doc.no.: - Rev.: A Date: 07.12.12
Page 1/20
Test Report Fuelade Catalyst
at
London Mining
Marampa, Sierra Leone
Document name: Test Report Fuelade Catalyst at London Mining - Marampa
Author: Ole Petter Ruud
Approved by:
File name: C:\Prosjekt\Smartfeeder II 0-serie\Doc\Sierra Leone\Test Report
Fuelade Catalyst at London Mining - Marampa - A.doc

Test Report Fuelade Catalyst at London Mining -
Marampa
OPR
Doc.no.: - Rev.: A Date: 07.12.12
Page 2/20
Document History
Issue # Author Document History / Changes Date
P1 OPR First Issue, based on data collected 28th
November to 4th December 2012.
04.12.2012
A OPR Included tests done at Dec 4 th 2012 as well. 07.12.2012

Test Report Fuelade Catalyst at London Mining -
Marampa
OPR
Doc.no.: - Rev.: A Date: 07.12.12
Page 3/20
Contents
Summary ..................................................................................................................................................4
Definitions and Acronyms ................................................................................................................... 4
Equipment Under Test (EUT) ....................................................................................................................5
Test procedure .........................................................................................................................................7
General description ............................................................................................................................. 7
Test analysis ........................................................................................................................................ 8
Data format ..................................................................................................................................... 8
Methods in use ................................................................................................................................ 8
Converting from data to test results ............................................................................................. 10
Test Report – Baseline: Dec 1st 2012 ..................................................................................................... 11
Data recorded .................................................................................................................................... 11
Data validation .................................................................................................................................. 12
Test Report – 1st day treatment: Dec 2nd 2012 ...................................................................................... 13
Data recorded .................................................................................................................................... 13
Data validation .................................................................................................................................. 14
Test Report – 2nd day treatment: Dec 3rd 2012 .................................................................................... 15
Data recorded .................................................................................................................................... 15
Data validation .................................................................................................................................. 16
Test Report – 3rd day treatment: Dec 4th 2012 ...................................................................................... 17
Data recorded .................................................................................................................................... 17
Data validation .................................................................................................................................. 18
Appendix A: Testo readings of emission at Baseline ............................................................................. 19
At 17.4KW .......................................................................................................................................... 19
At 22.0KW .......................................................................................................................................... 19
Appendix B: Testo readings of emission at 3rd Day of treatment ......................................................... 20
At 17.4KW .......................................................................................................................................... 20
At 20.4KW .......................................................................................................................................... 20

Test Report Fuelade Catalyst at London Mining -
Marampa
OPR
Doc.no.: - Rev.: A Date: 07.12.12
Page 4/20
Summary Fuelade Solutions along with Amelti Development and under the direction of USP&E, are conducting
a fuel efficiency test at London Mining Camp, Marampa, Sierra Leone. The products being used to
provide the results are the Smart Feeder injector, injecting the Fuelade Catalyst. Dates for
demonstration are November 27th – December 5th 2012. The test was conducted on a Perkins 100
KVA Generator Set with a log from the Deep Sea panel of 2900 hours.
A SmartFeeder unit was connected to the fuel system to inject Fuelade catalyst and to record fuel
consumption values. A detailed fuel consumption baseline was created across a spectrum of engine
load conditions. The data was verified by repeating the test points several times. Fuel treated with
Fuelade Solutions Catalyst was then injected into the fuel system at a recommended ratio of 1 to
4000, for the green- in period and to be moved to 1 to 8000 after 160 hours. The test was conducted
over a period of 80 hours utilizing a max load of 30 %. As illustrated in the figures below, fuel
consumption was consistently reduced across all engine load conditions and averaged from -3.2% to
-31.4% in reduction. As it still in a cleaning process at this point variation of saving from day to day
are expected as the engine gets cleaner as the green- in period proceed. A modest estimation based
on other tests performed is that an average about -15% should be possible.
Due to the Gen-Sets load range of 10KW-24KW (5-30%) with inconsistent load range, it was not
possible to test the Fuelade catalyst within its optimum fuel savings range which is between 50-90%
power loads.
Definitions and Acronyms
SFOC Specific Fuel Oil Consumption.
EUT Equipment Under Test.

Test Report Fuelade Catalyst at London Mining -
Marampa
OPR
Doc.no.: - Rev.: A Date: 07.12.12
Page 5/20
Equipment Under Test (EUT)

Test Report Fuelade Catalyst at London Mining -
Marampa
OPR
Doc.no.: - Rev.: A Date: 07.12.12
Page 6/20
#ID Name Description
1 Engine Perkins 2436/1500
2 Genset Perkins 100KVA genset.
3 Load description USP&E Power Plant Maintenance and control room general light,
AC and tools power use (in range 15-25KW).
4 SmartFeeder S/N: 00000060-0003-0001-0001-131900261112
Amelti Development SmartFeeder - is designed to dose and mix
additive into the fuel flow of combustion engines, control dosing
ratios and report runtime data (consumptions, produced energy
[KW], average speeds, time in speed/activity zones, positions etc.)
back into a centralized custom defined monitoring system.
5 Flow meters 2 Oval M-III LSF45L – 10mL/P +/-1% measure flow into and return
from engine from/to SmartFeeder mix tank.
6 Fuel flow temperature
sensors
2 NTC temperature sensors, not calibrated.
6 Lumel N14 Network parameter meter with Modbus interface for reading the
generator performance and load in [KW], [V] and [A].
7 LCT 7440 5A/1000 Low voltage current transformers.
7 Windows PC
w/SmartFeederInspector
Used for logging test data to file for later analytics and manually
supervision of the EUT.
8 Testo Measure emission data directly from the engine exhaust.

Test Report Fuelade Catalyst at London Mining -
Marampa
OPR
Doc.no.: - Rev.: A Date: 07.12.12
Page 7/20
Test procedure
General description 1. Check EUT and all it parts is ready for test before startup inclusive that the fuel specification
is logged.
2. Start Engine and make it run until it gets working temperature around 75°C. While engine
warm-up makes sure that you check that all systems running without any problems and you
have values updating properly as expected (use meters on Dashboard to confirm).
3. When ready; make sure you enable auto log in SmartFeeder Inspector (log data to file every
10th seconds) and click Clear/Discard Log to get a fresh start. Here you can decide between
two approaches for logging data.
a. Save the whole test in one big file.
Click Save when test is complete.
b. Save each test run (10 minutes each) in separate files (recommended).
Re-Click Clear/Discard Log when Load is set and temperatures on In- and Out-fuel
has stabilized (minimum one minute). Click Save before enter new load bank level.
4. Here load are set at two levels that was able to change between without interference with
the daily routines at the power plant. That was done by turning on and off 3 AC regulating
the load between 17.5KW and 23.5KW.
5. Alternate between the two levels, to meet the test standard, 5 times divided into 10 minutes
sessions (after temperatures and load is stabilized) on each change for complete test.

Test Report Fuelade Catalyst at London Mining -
Marampa
OPR
Doc.no.: - Rev.: A Date: 07.12.12
Page 8/20
Test analysis
Data format
Data files logged is text based comma separated files (*.csv) that can be directly imported into a
spreadsheet for reporting purposes. Columns in files:
Timestamp ()
GUID
To Engine [°C]
Return [°C]
Cooling temp [°C]
AccuToEngineFlowPulsCnt
AccuReturnFlowPulsCnt
AccuDeltaFlow [liter]
Fuel Consumption (last min) [l/h]
Fuel Consumption Generator [l/h]
Generator power [KW]
Sample: 2012-12-01 16:02:52;00000060-0003-0001-0001-131900261112;46.2;47.7;0;169115;150981;181.340;14.107323;20287571.650;22.408;
Methods in use
Manually data evaluation:
Check data files consistency, remove periods logged where temperatures/load trends still
changes, obvious data errors (due to log/communication errors) and make a decision if data
series hold valid data – if not data must be resampled under as near same condition as the
original one.
Temperature compensation:
Diesel changes density on temperature changes at a rate defined here as linear rate -
0.07%/°C (about 4% change over the range 10-60°C). To compensate for this effect in
calculations we recalculate fuel usage as is the density of the fuel used under testing 0.84
g/cm3 at 15°C1 ().
1 The actually density of the fuel under test at 15°C can off source be used, but we are here mainly looking
calculating fuel savings so as long the same fuel are used at baseline as with additive the value is not important
– only a offset.

Test Report Fuelade Catalyst at London Mining -
Marampa
OPR
Doc.no.: - Rev.: A Date: 07.12.12
Page 9/20
Compensation factor formula used: ( (0.8505 – 0.0007*t) [g/cm3] ) / ( 0.84 [g/cm3] ),
where 0.8505 is the theoretical density of diesel fuel at 0°C (when rated as 0.84 at 15°C), -
0.0007 is the rate of change of density per °C, t is the fuel temperature and 0.84 fuel density
at 15°C.
Fuel flow measurement:
The flow meters mounted on the to- and from-fuel lines to the engine return pulses at a rate
of 100 pulses per liter of fuel. Those pulses are counted accumulative at the SmartFeeder in
two registers. So we can use the start and stop values of those registers to calculate the net
to fuel usage by the engine over the test period (here 10 minutes). The formula for that will
then be:
Fuel Usage w/o temp. compensation = ( ΔP1 [p] / 100 [p/l] ) - ( ΔP2 [p] / 100 [p/l] ) in [l],
where ΔP1=Pulses in to the engine in the period and ΔP2=Pulses out of the engine in the
period.
To make it more usable the temperature compensation also need to be integrated:
Fuel Usage = ( ΔP1 [p] * (0.8505 – 0.0007*T1avg) [g/cm3] / 100 [p/l] ) / ( 0.84 [g/cm3] )
- ( ΔP2 [p] * (0.8505 – 0.0007*T2avg) [g/cm3] / 100 [p/l] ) / ( 0.84 [g/cm3] ) in [l],
where ΔP1=Pulses from the flow meter going in to the engine in the period, T1avg =the
average temperature of the fuel going in to the engine in the period, ΔP2=Pulses of the flow
meter going out of the engine in the period and , T2avg =the average temperature of the fuel
going out of the engine in the period.

Test Report Fuelade Catalyst at London Mining -
Marampa
OPR
Doc.no.: - Rev.: A Date: 07.12.12
Page 10/20
Converting from data to test results
The resulting measurements we use for document and compare the fuel savings from tested
additives are SFOC (Specific Fuel Oil Consumption) in [g/KWh] or [l/KWh] (sense we normalize data
here to fuel with density of 0.84 g/cm3 at 15°C you can divide by “840” to convert from [g/KWh] to
[l/KWh]).
To calculate SFOC from the collected data files we need the time stamp (to-from) in [h], the
temperature compensated fuel usage for the period [l]. From that we get the average fuel flow for
the period in [l/h]. The load bank gives us the Power in average of the period in [KW]. The formula for
the SFOC is then:
SFOC = Fuel Flow [l/h] * 840 [g/l] / Power [KW] in [g/KWh]

Test Report Fuelade Catalyst at London Mining -
Marampa
OPR
Doc.no.: - Rev.: A Date: 07.12.12
Page 11/20
Test Report – Baseline: Dec 1st 2012 Date: Dec 1
st 2012
Test objects: Log Baseline and test EUT. Also done an emission measurement via Testo – see
Appendix A.
Test Location: London Mining Camp, Marampa, Sierra Leone
( Pos: 8 40’41.20” N 12 30’07.61” V Elevation: 68m )
Performed by: Ole Petter Ruud and Arild Ness, Amelti Development AS
Chad Mercy (Trainee)
Josh Moller (Supervisor), Fuelade Solutions
Approved by:
We had some initial trouble with setting up the EUT because the SmartFeeder provided was setup for
24V system also the fact that the Genset provided was smaller forced it to be a test setup instead of
a permanent installation. A setup with 24V system required a 24V battery with charger to be
installed (with initial trouble caused by a faulty battery and mixing of N levels with Ground signal).
Data recorded
Figure 1 Horizontal axis = Load in [KW], vertical axis = SFOC in [g/KWh]

Test Report Fuelade Catalyst at London Mining -
Marampa
OPR
Doc.no.: - Rev.: A Date: 07.12.12
Page 12/20
Data validation Tabell 1
Generator power
[KW]
SFOC
[g/KWh]
22.35 440.24
16.69 573.12
22.24 443.76
16.79 577.10
22.55 451.89
16.59 594.26
22.53 429.54
22.91 437.60
16.90 575.74
22.52 438.65
16.73 570.35
When collecting data here we had issues regarding getting the load at the exact same [KW] for each
repetition therefore a best fit linearity is calculated to better illustrate the savings at later testes. The
best fit compound quantities: y = -0.2635x3 + 19.113x2 – 467.41x + 4282.5 Note: Just valid around
sampled points of the baseline.
Normally 5 clusters over the hole load range would have been selected instead of only 2 as here, but
we had not that possibility at this time (both because the nature of the load and the test time frame).
Test Report Fuelade Catalyst at London Mining -
Marampa
OPR
Doc.no.: - Rev.: A Date: 07.12.12
Page 13/20
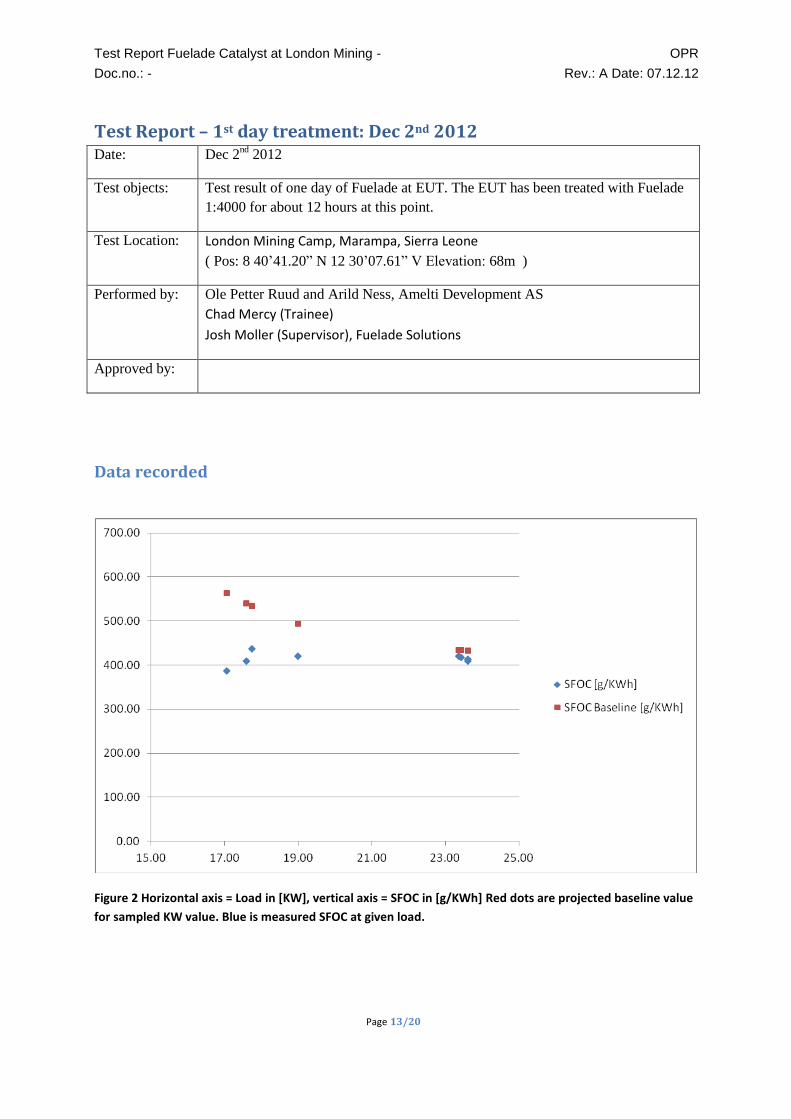
Test Report – 1st day treatment: Dec 2nd 2012 Date: Dec 2
nd 2012
Test objects: Test result of one day of Fuelade at EUT. The EUT has been treated with Fuelade
1:4000 for about 12 hours at this point.
Test Location: London Mining Camp, Marampa, Sierra Leone
( Pos: 8 40’41.20” N 12 30’07.61” V Elevation: 68m )
Performed by: Ole Petter Ruud and Arild Ness, Amelti Development AS
Chad Mercy (Trainee)
Josh Moller (Supervisor), Fuelade Solutions
Approved by:
Data recorded
Figure 2 Horizontal axis = Load in [KW], vertical axis = SFOC in [g/KWh] Red dots are projected baseline value
for sampled KW value. Blue is measured SFOC at given load.

Test Report Fuelade Catalyst at London Mining -
Marampa
OPR
Doc.no.: - Rev.: A Date: 07.12.12
Page 14/20
Data validation Tabell 2
Generator power
[KW]
SFOC
[g/KWh]
SFOC Baseline
[g/KWh]
Savings
%
23.43 417.74 434.22 -3.80 %
23.62 409.38 433.20 -5.50 %
23.61 413.82 433.26 -4.50 %
23.37 420.70 434.60 -3.20 %
17.74 436.60 534.64 -18.30 %
17.59 409.34 540.36 -24.20 %
17.05 386.23 563.17 -31.40 %
18.99 420.28 494.55 -15.00 %
Low [KW] here shows great results and high [KW] more moderate savings. It also smoked significant
more at high levels. While the test was executed we also observed that the savings at low level first
raised at a steady phase and then started to decrease again. This indicate most likely that the
cleaning process was starting. Note also that this Genset has most likely been used at a low steady
load for a long time and suddenly increase the load by a factor of 3 seems to hold down the expected
high savings also here.

Test Report Fuelade Catalyst at London Mining -
Marampa
OPR
Doc.no.: - Rev.: A Date: 07.12.12
Page 15/20
Test Report – 2nd day treatment: Dec 3rd 2012 Date: Dec 3
rd 2012
Test objects: Test result of two days of Fuelade at EUT.
Test Location: London Mining Camp, Marampa, Sierra Leone
( Pos: 8 40’41.20” N 12 30’07.61” V Elevation: 68m )
Performed by: Ole Petter Ruud and Arild Ness, Amelti Development AS
Chad Mercy (Trainee)
Josh Moller (Supervisor), Fuelade Solutions
Approved by:
Data recorded
Figure 3 Horizontal axis = Load in [KW], vertical axis = SFOC in [g/KWh] Red dots are projected baseline value
for sampled KW value. Blue is measured SFOC at given load.

Test Report Fuelade Catalyst at London Mining -
Marampa
OPR
Doc.no.: - Rev.: A Date: 07.12.12
Page 16/20
Data validation Tabell 3
Generator power
[KW]
SFOC
[g/KWh]
SFOC Baseline
[g/KWh]
Savings
%
24.00 386.07 431.15 -10.50 %
17.29 532.84 552.81 -3.60 %
23.62 391.76 433.16 -9.60 %
17.21 510.00 556.03 -8.30 %
23.34 396.57 434.80 -8.80 %
16.93 533.80 568.93 -6.20 %
Now the EUT smoking more than normal on both high and low load (actually significant more now at
low level) – indicate that we still are cleaning the engine and will expect savings to raise in the next
days of treatments with fuelade.

Test Report Fuelade Catalyst at London Mining -
Marampa
OPR
Doc.no.: - Rev.: A Date: 07.12.12
Page 17/20
Test Report – 3rd day treatment: Dec 4th 2012 Date: Dec 4
th 2012
Test objects: Test result of three days of Fuelade at EUT. Also done an emission measurement
via Testo just in front of the test – see Appendix B.
Test Location: London Mining Camp, Marampa, Sierra Leone
( Pos: 8 40’41.20” N 12 30’07.61” V Elevation: 68m )
Performed by: Ole Petter Ruud and Arild Ness, Amelti Development AS
Chad Mercy (Trainee)
Josh Moller (Supervisor), Fuelade Solutions
Approved by:
Data recorded
Figure 4 Horizontal axis = Load in [KW], vertical axis = SFOC in [g/KWh] Red dots are projected baseline value
for sampled KW value. Blue is measured SFOC at given load.

Test Report Fuelade Catalyst at London Mining -
Marampa
OPR
Doc.no.: - Rev.: A Date: 07.12.12
Page 18/20
Data validation Table 4
Generator power
[KW]
SFOC
[g/KWh]
SFOC Baseline
[g/KWh]
Savings
%
17.19 540.79 556.85 -2.9 %
18.69 421.51 502.89 -16.2 %
17.62 388.62 539.05 -27.9 %
22.21 412.99 442.63 -6.7 %
21.52 428.18 449.14 -4.7 %
21.40 435.42 450.50 -3.3 %
Now the EUT smoking more than normal on both high and low load (actually significant more now at
low level) – indicate that we still are cleaning the engine and will expect savings to raise in the next
days of treatments with Fuelade.
Particulate Matter before
Fuelade.
Particulate Matter After
Fuelade . «Yes, The Gen-Set
Is Still Running!» This is an
area where we are seeing a
18.30% fuel savings, see
charts above under day 1.

Test Report Fuelade Catalyst at London Mining -
Marampa
OPR
Doc.no.: - Rev.: A Date: 07.12.12
Page 19/20
Appendix A: Testo readings of emission at Baseline
At 17.4KW
Description Value
% O2 14
ppm CO 2985
ppm NO 100
ppm H2 220
ppm NOx 100
°C TF 343
°C AT 31
At 22.0KW
Description Value
% O2 14
ppm CO 2682
ppm NO 135
ppm H2 177
ppm NOx 135
°C TF 353
°C AT 28

Test Report Fuelade Catalyst at London Mining -
Marampa
OPR
Doc.no.: - Rev.: A Date: 07.12.12
Page 20/20
Appendix B: Testo readings of emission at 3rd Day of treatment
At 17.4KW
Description Value
% O2 14.37
ppm CO 2873
ppm NO 101
ppm H2 295
ppm NOx 101
°C TF 339
°C AT 27
At 20.4KW
Description Value
% O2 13.94
ppm CO 2757
ppm NO 127
ppm H2 250
ppm NOx 127
°C TF 349
°C AT 30