Embed Size (px)
Citation preview

TP 17-02 Revision 0
Page 1 of 38
© 2017 NTES of Sandia, LLC.
IMPORTANT NOTICE: The current official version of this document is available via the Sandia National Laboratories WIPP Online Documents web site. A printed copy of this document may not be the version currently in effect.
Sandia National Laboratories Waste Isolation Pilot Plant
Test Plan TP 17-02
Experimental Investigation of Small-Scale Openings in WIPP Salt
Task 4.4.2.4.1
Revision 0
Effective Date: July 31, 2017
Prepared by: Courtney G. Herrick (8864) Benjamin Reedlunn (1554) Richard P. Jensen (8864)
Sandia National Laboratories Carlsbad, NM 88220

TP 17-02 Revision 0
Page 2 of 38
APPROVALS Author: Original signed by Shelly R. Nielsen for 7-31-17
Courtney Herrick, Org. 8864 Date Author: Original signed by Shelly R. Nielsen for 7-31-17 Benjamin Reedlunn, Org. 1554 Date Author: Original signed by Shelly R. Nielsen for 7-31-17 Richard P. Jensen, Org. 8864 Date Technical Reviewer: Original signed by Dwayne Kicker 7-31-2017
Dwayne Kicker, Org. 8881 Date QA Reviewer: Original signed by Steve Davis 7-31-2017
Steve Davis, Org. 8880 Date Management Reviewer: Original signed by Shelly R. Nielsen for 7-31-17 Christi Leigh, Org. 8882 Date
TP 17-02 Revision 0
Page 3 of 38
TABLE OF CONTENTS
1 ABBREVIATIONS, ACRONYMS, AND INITIALISMS .................................................................4
2 REVISION HISTORY .........................................................................................................................5
3 PURPOSE AND SCOPE .....................................................................................................................5
3.1 Salt Creep ......................................................................................................................................5
3.2 Fracture Around Openings ............................................................................................................7
3.3 Panel Closure ...............................................................................................................................11
3.3.1 Post Roof Failure .................................................................................................................20
3.3.2 Permeability of the Rubble Pipe ..........................................................................................23
3.4 Dilatancy Condition ....................................................................................................................23
4 EXPERIMENTAL PROCESS DESCRIPTION ................................................................................24
4.1 Overall Strategy and Process .......................................................................................................24
4.1.1 Triaxial Load Tests ..............................................................................................................30
4.1.2 Creation of “Prestressed Condition” ....................................................................................30
4.2 Equipment ...................................................................................................................................31
4.2.1 Quasi-Static Triaxial Compression Tests .............................................................................31
4.2.2 Triaxial Compression Constant Stress Creep Tests .............................................................32
4.3 Sample Preparation .....................................................................................................................35
4.4 Sample Control ............................................................................................................................35
4.5 Data Quality Control ...................................................................................................................35
4.5.1 Measuring and Test Equipment ...........................................................................................35
4.5.2 Data Acquisition ..................................................................................................................36
5 TRAINING .........................................................................................................................................36
6 HEALTH AND SAFETY ..................................................................................................................37
7 PERMITTING/LICENSING ..............................................................................................................37
8 REFERENCES ...................................................................................................................................37

TP 17-02 Revision 0
Page 4 of 38
1 ABBREVIATIONS, ACRONYMS, AND INITIALISMS ASTM American Society for Testing and Materials
DAS Data acquisition system
DRZ Disturbed rock zone
IfG Institut für Gebirgsmechanik GmbH (Leipzig, Germany)
LVDT Linear variable displacement transducer (also called linear variable differential transformer)
NIST National Institute of Standards and Technology
NP Nuclear Waste Management Procedure
NWP Nuclear Waste Partnership LLC
SPDV Site and Preliminary Design Validation
UCP Unified Creep Plasticity
UW-M University of Wisconsin
WIPP Waste Isolation Pilot Plant
WRA WIPP Records Archive

TP 17-02 Revision 0
Page 5 of 38
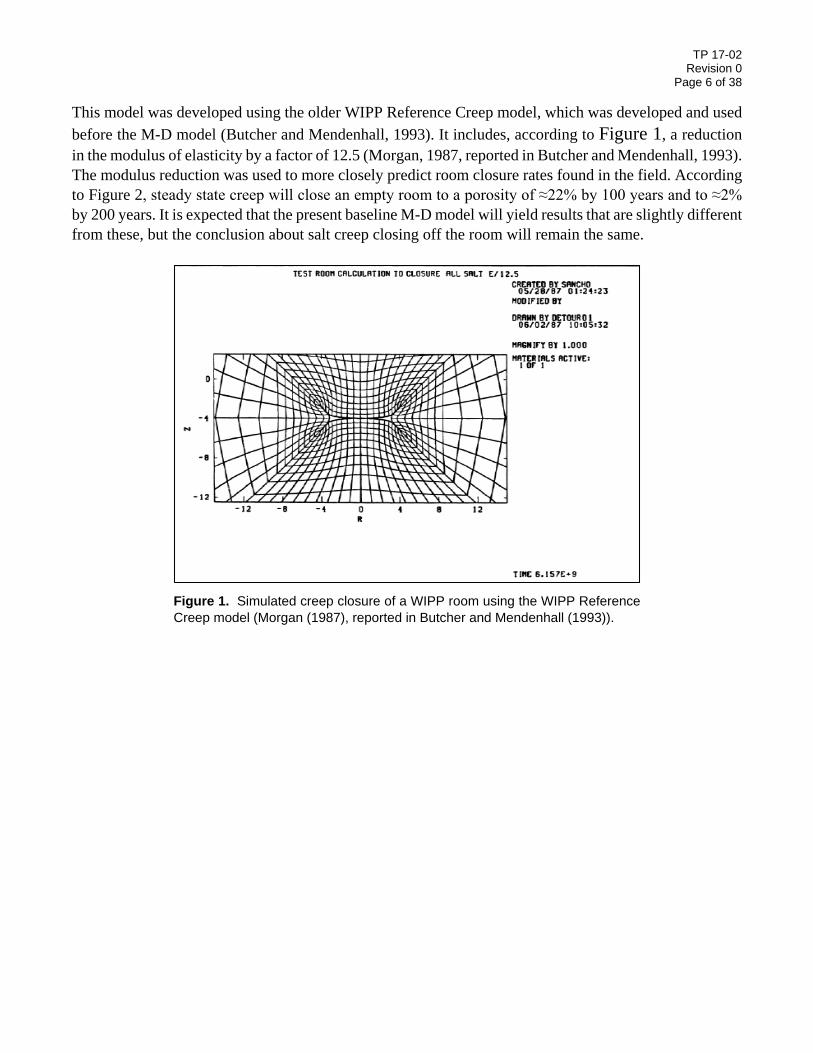
2 REVISION HISTORY This is the initial issuance of this Test Plan. 3 PURPOSE AND SCOPE We currently calibrate our salt constitutive models against experiments with simple, uniform, stress states, and then expect those models to predict the evolution of the underground. Many uncertainties in the underground can make it difficult to conclusively say why a given model does or does not match the underground measurements. For example, a series of experimental tests were recently performed by German colleagues at the Institut für Gebirgsmechanik GmbH Leipzig (IfG). Once parameterized against these experiments, the Munson-Dawson (MD) model under predicted the closure of Room D by a factor of three to three and a half (Reedlunn, 2016). It is important to note that we can accurately simulate room closure using the engineering approach currently used in WIPP PA. Discrepancies occur when the results from new rock salt tests are employed. Reedlunn identified the following list of open issues: lost transient strains (specimen virginity), the MD model’s inability to predict creep at low deviatoric stresses, the effects of impurities such as anhydrite and clay, the ability to characterize and differentiate between clean and argillaceous salt, moisture content, clay seam behavior, and where the outer boundaries of the numerical model are placed. Another effect that could be added to the list is damage (dilatancy) of the rock salt around Room D, as discussed in Section 3.2. Isolating which effects are most important for Room D or any underground test is not trivial. Therefore, it is crucial to validate our salt constitutive models against carefully controlled laboratory tests with non-uniform stress states, as an intermediate step. Once the models can capture laboratory measured behavior, we will be far more prepared to predict underground measurements. High-quality laboratory tests involving non-uniform stress states are quite rare in the published literature. This test plan proposes experiments that replicate non-uniform states relevant to the WIPP: the closure of a shaft and the closure of a disposal room. These experiments will serve to validate a salt constitutive model’s ability to predict the closure of an underground opening, and the extent of damage around an opening. In addition, the experiments will help quantify how much closure is affected by damage. 3.1 Salt Creep Current numerical simulations of legacy room closure simulations indicate that full room closure of an empty room would occur within a time range of at least 40 years and could extend to as long as 200 years (Butcher and Mendenhall, 1993; see also Figure 4.1, Reedlunn, 2016). The models show the salt creeping smoothly until only two small, concave-triangular shaped openings are left. The two concave-triangular regions are also assumed to close off completely in a short period of time after the end of the simulation. Figure 1 shows the simulated creep closure of a WIPP room.
TP 17-02 Revision 0
Page 6 of 38
This model was developed using the older WIPP Reference Creep model, which was developed and used before the M-D model (Butcher and Mendenhall, 1993). It includes, according to Figure 1, a reduction in the modulus of elasticity by a factor of 12.5 (Morgan, 1987, reported in Butcher and Mendenhall, 1993). The modulus reduction was used to more closely predict room closure rates found in the field. According to Figure 2, steady state creep will close an empty room to a porosity of ≈22% by 100 years and to ≈2% by 200 years. It is expected that the present baseline M-D model will yield results that are slightly different from these, but the conclusion about salt creep closing off the room will remain the same.
Figure 1. Simulated creep closure of a WIPP room using the WIPP Reference Creep model (Morgan (1987), reported in Butcher and Mendenhall (1993)).

TP 17-02 Revision 0
Page 7 of 38
Figure 2. Loss of room volume over time according to the simulation shown in Figure 1 (Morgan (1987), reported in Butcher and Mendenhall (1993)).
3.2 Fracture Around Openings Fracturing around openings in rock occurs in all rock types. Here are some examples of fracturing occurring in the vicinity of circular boreholes from rocks tested at the University of Wisconsin (Figure 3-Figure 7) (Haimson, 2007); however, many others can be provided as the phenomenon is not unique to a specific rock type.
Figure 3. Westerly granite.

TP 17-02 Revision 0
Page 8 of 38
Figure 4. Westerly granite.
Figure 5. Lac Du Bonnet granite.
σH

TP 17-02 Revision 0
Page 9 of 38
Figure 6. Indiana limestone.
Figure 7. Tablerock sandstone.
TP 17-02 Revision 0
Page 10 of 38
The most important characteristic to notice is that multiple sets of fractures form behind the surface of the opening. If the fractured rock was removed – usually by gravity causing it to fall off, being pushed off by the slab which formed further into the rock, or by the drilling fluid shearing it off – the dog-eared volume is called a “borehole breakout” (Figure 8). A few other aspects of this fracturing are important to note. First, the fracturing pattern is not stress path dependent, but the fracturing extent (both the circumferential width and depth into the rock) is. Two stress paths were used to cause the fractures to form: one in which the test specimen had a hole already drilled through it and then the far-field stresses were applied and the other was where the test specimen had the far-field stresses applied first and then the borehole was drilled through the sample. We refer to these stress paths as “predrilled” and “prestressed,” respectively. The prestressed condition simulates in situ conditions more realistically; the predrilled condition is easier to perform in a laboratory. Second, the fracturing occurred immediately. In other words, if the stresses around the borehole were above the critical stress state required to fail the rock, fracturing and rock failure occurred resulting in a breakout. This was particularly important in the prestressed tests. The breakout had formed by the time specimens were drilled and the drill was removed. The longest that any specimen was kept under stress was 24 hours. However, over that period of time, the size of the breakout did not appear to change. Third, the test specimens above were subjected to stress that represent various faulting regimes: normal, reverse, and strike-slip and that simulated stress conditions up to 15,000 ft deep.

TP 17-02 Revision 0
Page 11 of 38
Figure 8. Schematic of borehole breakouts and their relationship to the far-field horizontal stresses, where σH,max > σh,min.
Fourth, and somewhat counterintuitive, was that the dog-eared shape of the breakout is stabilizing. As the breakout narrows down to a point, the stresses approach a hydrostatic state in which 𝜎𝜎1 = 𝜎𝜎2 = 𝜎𝜎3 (Zheng et al., 1989). Rock is extremely strong in hydrostatic compression. Therefore, the fracturing stops and the borehole breakout becomes stable. This is particularly important in mines where the stress concentration caused by the opening exceeds the strength of the rock. Spalling of the rock (typically referred to as “rock bursts”) occurs, but quickly stabilizes as the spall zone narrows down to a point. 3.3 Panel Closure One apprehension about the modeling approach discussed in Section 3.1 is centered on the concern that neither model will correctly model the panel drift closure correctly. Modeling efforts generally under predict room closure with time by about a factor of three. In spite of a fairly extensive, multiyear testing program conducted on WIPP core to obtain better parameter values for the various numerical models than were previously attainable due to advancements in testing equipment, the models have only improved minimally (Reedlunn, 2016). It is postulated that, like the examples in the prior section, fracturing of the rock is occurring around all sides of openings in WIPP. The fracturing changes the model required to
borehole breakouts
Sh,min
SH,maxσH,
σh,
TP 17-02 Revision 0
Page 12 of 38
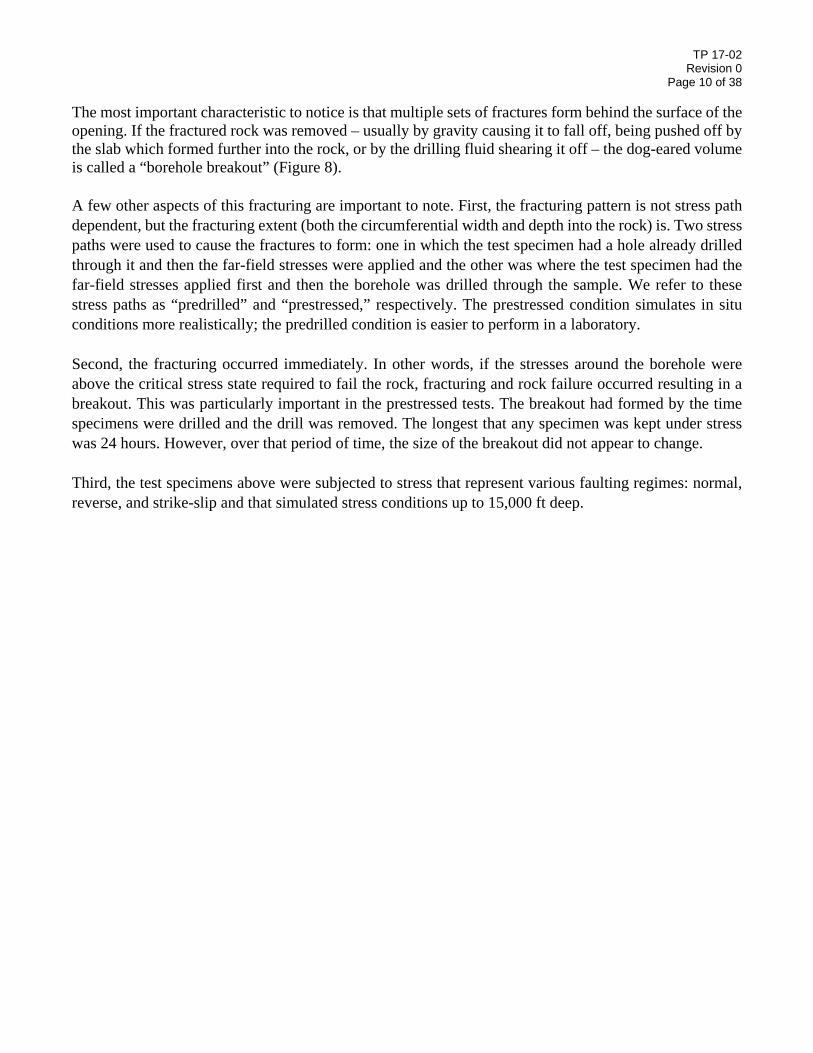
simulate behavior of the underground. The material cannot be treated as a continuum without modification to account for the fracture surfaces. Both of the previously mentioned models predict the behavior of salt through the primary and secondary (steady state) stages of creep (Figure 9). Neither the WIPP Reference Creep nor the M-D model considers tertiary creep. This assumption for room closure seems more appropriate for waste filled rooms where the salt creeps only a short distance before it contacts the MgO sacks on top of waste stacks. Salt creep is also impeded somewhat by the multitude of roof bolts which help prevent the formation of extensile fractures and shear planes. It should be noted, however, that roof bolts need to be replaced on average about every 3 years.
Figure 9. Schematic of typical creep curve under constant stress and temperature conditions.
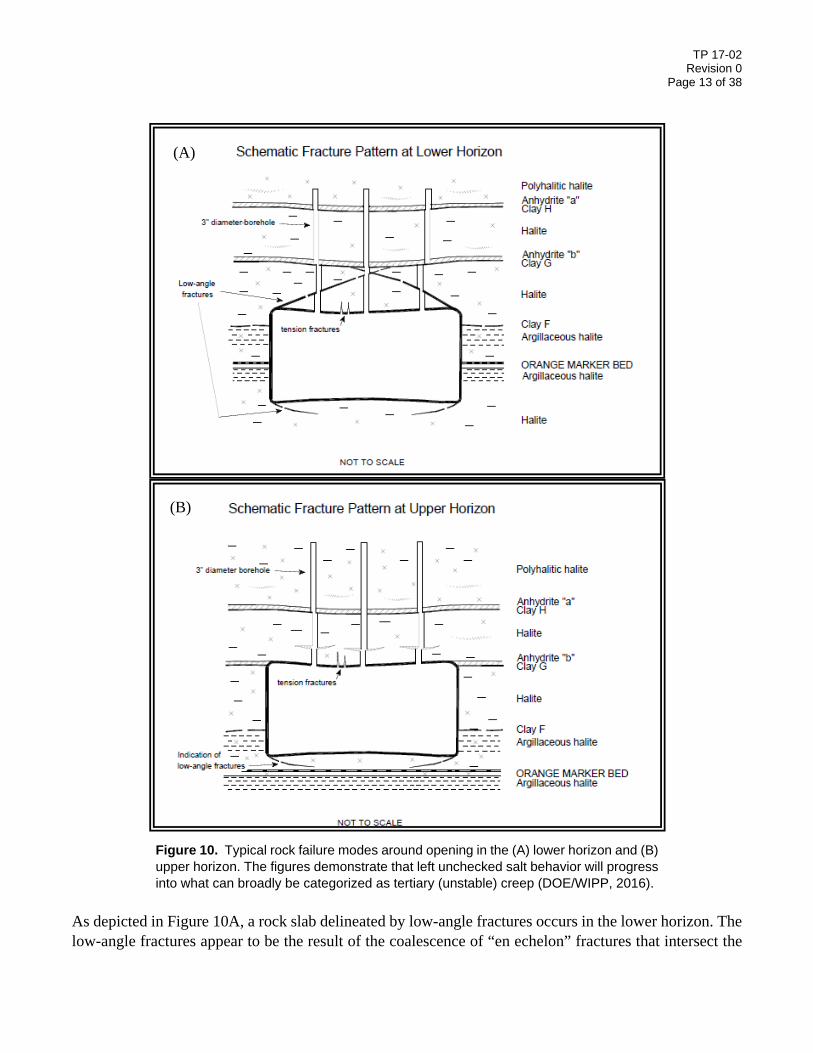
A panel’s drifts are 20 feet wide by 13 feet high for the intake drift and 14 feet by 12 feet for the exhaust drift. Fracturing is occurring around every opening in the underground. It is an integral part of the DRZ. Steady-state creep will transform into what can be broadly referred to as tertiary (unstable) creep if not controlled. Evidence for ubiquitous fracturing includes the formation of thick rock slabs in the back, delineated by low-angle fractures, tension cracks in the slab at locations of extensive curvature, floor heave, spalling of the ribs and corners, separation along anhydrite stringers or clay seams, and multiple extensile and shear fracture sets in the ribs and back. Nuclear Waste Partnership LLC (NWP) distinguishes rock failure modes around rooms between those types that generally occur in the lower horizon from those in the upper horizon (Figure 10). The primary difference between the failure modes of salt in the two horizons is what occurs in the back (roof) of the openings. Evidence of tertiary creep includes the formation of triangular-shaped rock slabs in the back delineated by “en echelon” fractures, tension cracks in the slab at locations of extensive curvature, floor heave, and spalling of the ribs (Figure 10A). Around rooms in the upper horizon, anhydrite stringers cause the salt to delaminate in addition to the usual formation of tensile fractures (Figure 10B).
TP 17-02 Revision 0
Page 13 of 38
Figure 10. Typical rock failure modes around opening in the (A) lower horizon and (B) upper horizon. The figures demonstrate that left unchecked salt behavior will progress into what can broadly be categorized as tertiary (unstable) creep (DOE/WIPP, 2016).
As depicted in Figure 10A, a rock slab delineated by low-angle fractures occurs in the lower horizon. The low-angle fractures appear to be the result of the coalescence of “en echelon” fractures that intersect the
(B)
(A)

TP 17-02 Revision 0
Page 14 of 38
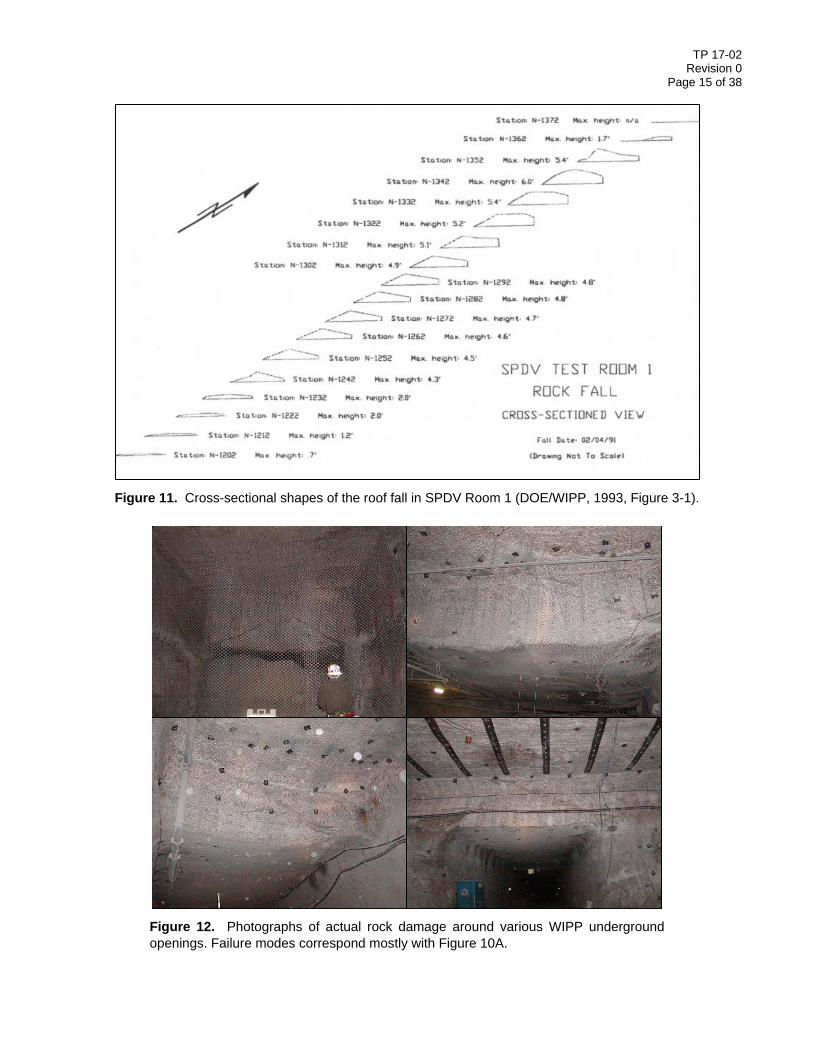
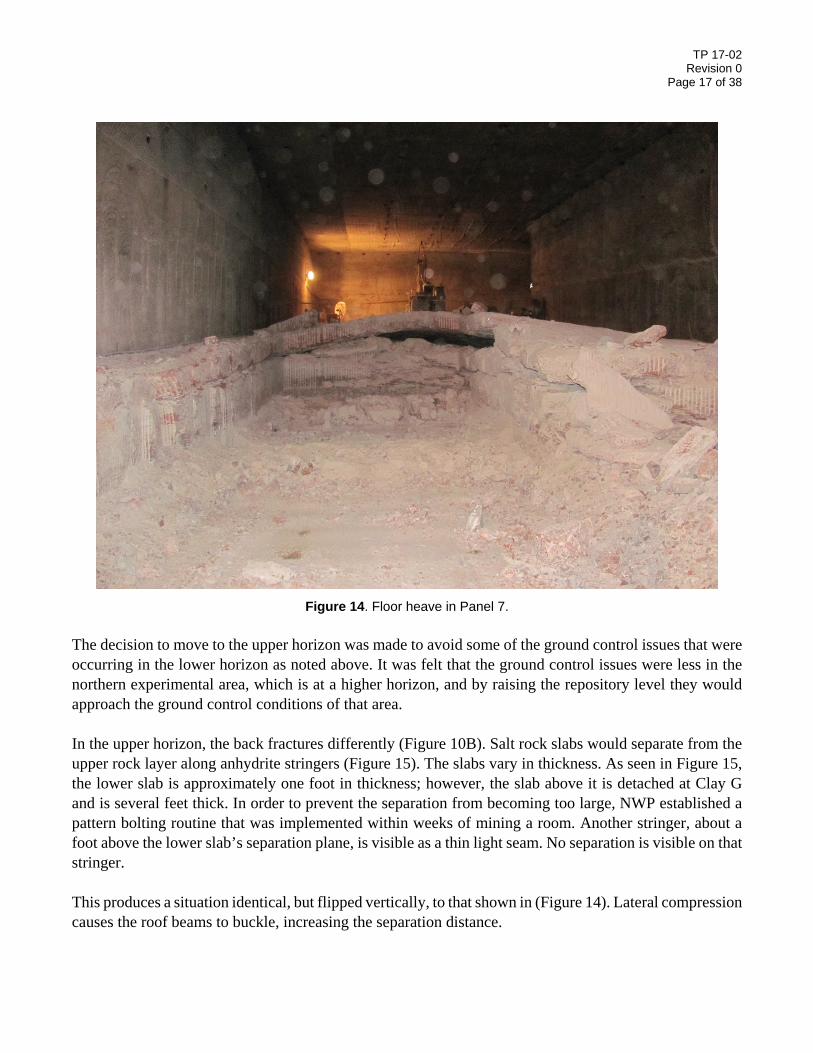
corners of the back and ribs. The low-angle fractures may grow and intersect each other in approximately the center of the opening, forming a triangular rock block and drawn in Figure 10A. This fracturing pattern is very similar to that shown in Figure 7 in sandstone. It is equally possible that the low-angle fractures intersect a clay seam/anhydrite layer. Generally, the clay seam/anhydrite layer separates because the layer is very weak in tension and is not able to resist the pull of gravity on the rock block. If this is the case, the rock block becomes trapezoidal in shape. In both cases it can be assumed that the slabs are completely detached and are held up only by rock bolts, chain-link mesh, and steel slats. Cross-sectional shapes of the roof fall in Site and Preliminary Design Validation (SPDV) Room 1 show both triangular and trapezoidal shaped blocks (Figure 11). Figure 12 shows some photographs in the WIPP underground of salt rock slabs in the back delineated by low-angle fractures. Evident in all slides is separation along the clay seam/anhydrite layer above the opening. It should also be noted that as the rock slab deforms, the lower surface becomes increasingly curved. Eventually the curvature becomes too much for the salt to withstand and tensile fractures form. The most pronounced example of tensile fracturing in highly-curved, detached slabs can be seen in the E-140 drift (Figure 13). In those pictures, the chain-link mesh is stretched tight, the steel support slats have been pulled apart by tensile forces, and there is a visible tensile fracture approximately in the middle of the bow. In the upper picture the salt slabs have rotated downward and form an angle of approximately 45° with the rib on the right side of the picture. Bowing of the slabs also produces shear along the clay seams which is noted in the vertical observation boreholes. Floor heave is common throughout the repository. An extreme example of floor heave occurred in the lower horizon, Panel 7 (Figure 14). In this instance, several slabs of salt approximately equal in thickness buckled as they were compressed from the ribs due to salt creep and lateral deformation due to pillar shortening. Not only did the slabs bow in the middle, but they also rotated upwards towards the center of the opening. Large gaps formed between the slabs. In this picture, the floor is being excavated down to Marker Bed 139. Ground control in the WIPP underground relies on the idea of tertiary creep. All the monitoring points in drifts and rooms are used to ensure that the deformation rate is not increasing, i.e. that the salt is not in a state of tertiary creep. An increasing displacement rate indicates that the salt is becoming unstable and controls need to be instituted quickly to safeguard against catastrophic rock failure.
TP 17-02 Revision 0
Page 15 of 38
Figure 11. Cross-sectional shapes of the roof fall in SPDV Room 1 (DOE/WIPP, 1993, Figure 3-1).
Figure 12. Photographs of actual rock damage around various WIPP underground openings. Failure modes correspond mostly with Figure 10A.

TP 17-02 Revision 0
Page 16 of 38
Figure 13. Pictures of the back along E-140 drift.
TP 17-02 Revision 0
Page 17 of 38
Figure 14. Floor heave in Panel 7.
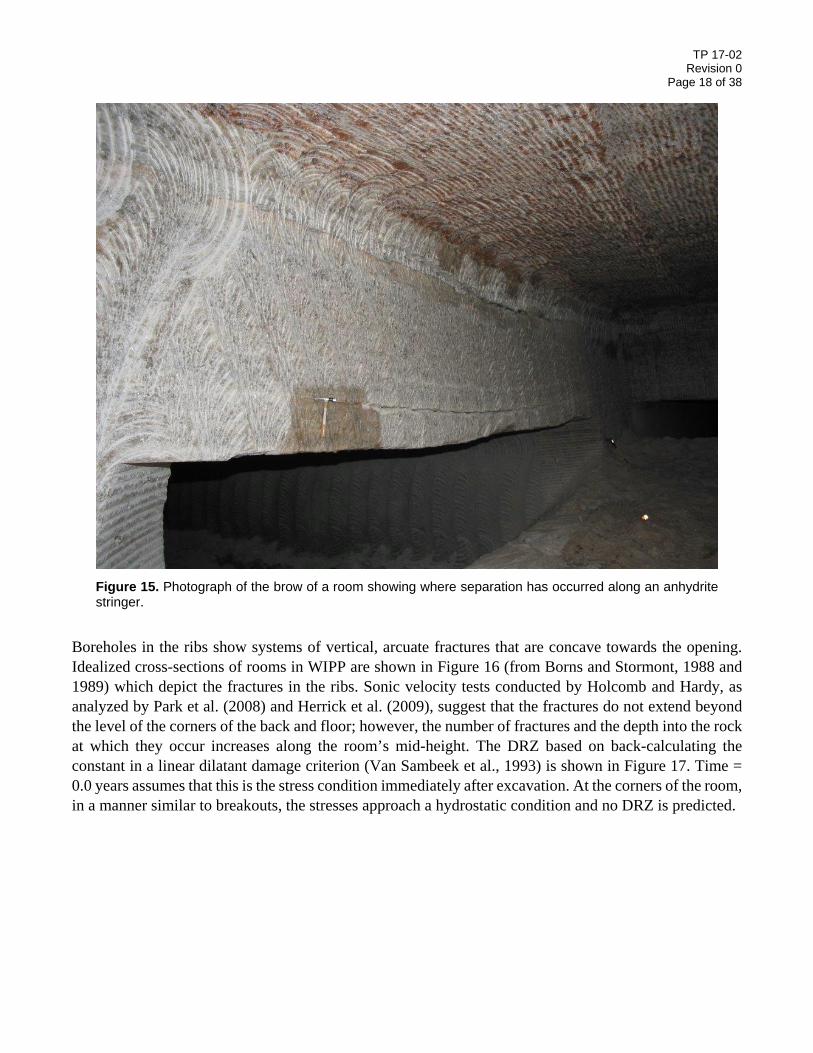
The decision to move to the upper horizon was made to avoid some of the ground control issues that were occurring in the lower horizon as noted above. It was felt that the ground control issues were less in the northern experimental area, which is at a higher horizon, and by raising the repository level they would approach the ground control conditions of that area. In the upper horizon, the back fractures differently (Figure 10B). Salt rock slabs would separate from the upper rock layer along anhydrite stringers (Figure 15). The slabs vary in thickness. As seen in Figure 15, the lower slab is approximately one foot in thickness; however, the slab above it is detached at Clay G and is several feet thick. In order to prevent the separation from becoming too large, NWP established a pattern bolting routine that was implemented within weeks of mining a room. Another stringer, about a foot above the lower slab’s separation plane, is visible as a thin light seam. No separation is visible on that stringer. This produces a situation identical, but flipped vertically, to that shown in (Figure 14). Lateral compression causes the roof beams to buckle, increasing the separation distance.
TP 17-02 Revision 0
Page 18 of 38
Figure 15. Photograph of the brow of a room showing where separation has occurred along an anhydrite stringer.
Boreholes in the ribs show systems of vertical, arcuate fractures that are concave towards the opening. Idealized cross-sections of rooms in WIPP are shown in Figure 16 (from Borns and Stormont, 1988 and 1989) which depict the fractures in the ribs. Sonic velocity tests conducted by Holcomb and Hardy, as analyzed by Park et al. (2008) and Herrick et al. (2009), suggest that the fractures do not extend beyond the level of the corners of the back and floor; however, the number of fractures and the depth into the rock at which they occur increases along the room’s mid-height. The DRZ based on back-calculating the constant in a linear dilatant damage criterion (Van Sambeek et al., 1993) is shown in Figure 17. Time = 0.0 years assumes that this is the stress condition immediately after excavation. At the corners of the room, in a manner similar to breakouts, the stresses approach a hydrostatic condition and no DRZ is predicted.

TP 17-02 Revision 0
Page 19 of 38
Figure 16. Idealized schematics of fracturing patterns around openings in the WIPP underground (Borns and Stormont, 1988 and 1989).
SHEAR ALONGCLAY SEAMS
CLAY SEAMS
BEAM BUCKLING
ROOF BOLTS
ZONES OF FRACTURING AND MICROFRACTURING
BOUNDARY OF THE ACTIVE OPENING
MB139
TP 17-02 Revision 0
Page 20 of 38
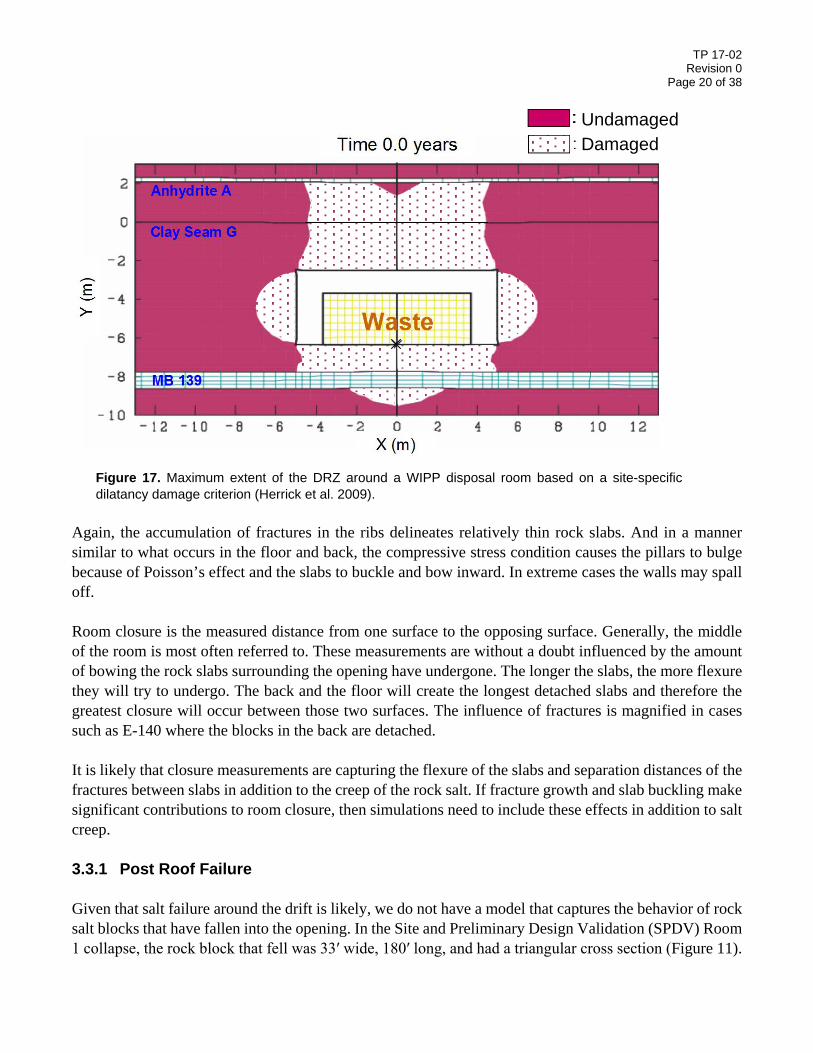
Figure 17. Maximum extent of the DRZ around a WIPP disposal room based on a site-specific dilatancy damage criterion (Herrick et al. 2009).
Again, the accumulation of fractures in the ribs delineates relatively thin rock slabs. And in a manner similar to what occurs in the floor and back, the compressive stress condition causes the pillars to bulge because of Poisson’s effect and the slabs to buckle and bow inward. In extreme cases the walls may spall off. Room closure is the measured distance from one surface to the opposing surface. Generally, the middle of the room is most often referred to. These measurements are without a doubt influenced by the amount of bowing the rock slabs surrounding the opening have undergone. The longer the slabs, the more flexure they will try to undergo. The back and the floor will create the longest detached slabs and therefore the greatest closure will occur between those two surfaces. The influence of fractures is magnified in cases such as E-140 where the blocks in the back are detached. It is likely that closure measurements are capturing the flexure of the slabs and separation distances of the fractures between slabs in addition to the creep of the rock salt. If fracture growth and slab buckling make significant contributions to room closure, then simulations need to include these effects in addition to salt creep. 3.3.1 Post Roof Failure Given that salt failure around the drift is likely, we do not have a model that captures the behavior of rock salt blocks that have fallen into the opening. In the Site and Preliminary Design Validation (SPDV) Room 1 collapse, the rock block that fell was 33′ wide, 180′ long, and had a triangular cross section (Figure 11).
UndamagedDamaged
TP 17-02 Revision 0
Page 21 of 38
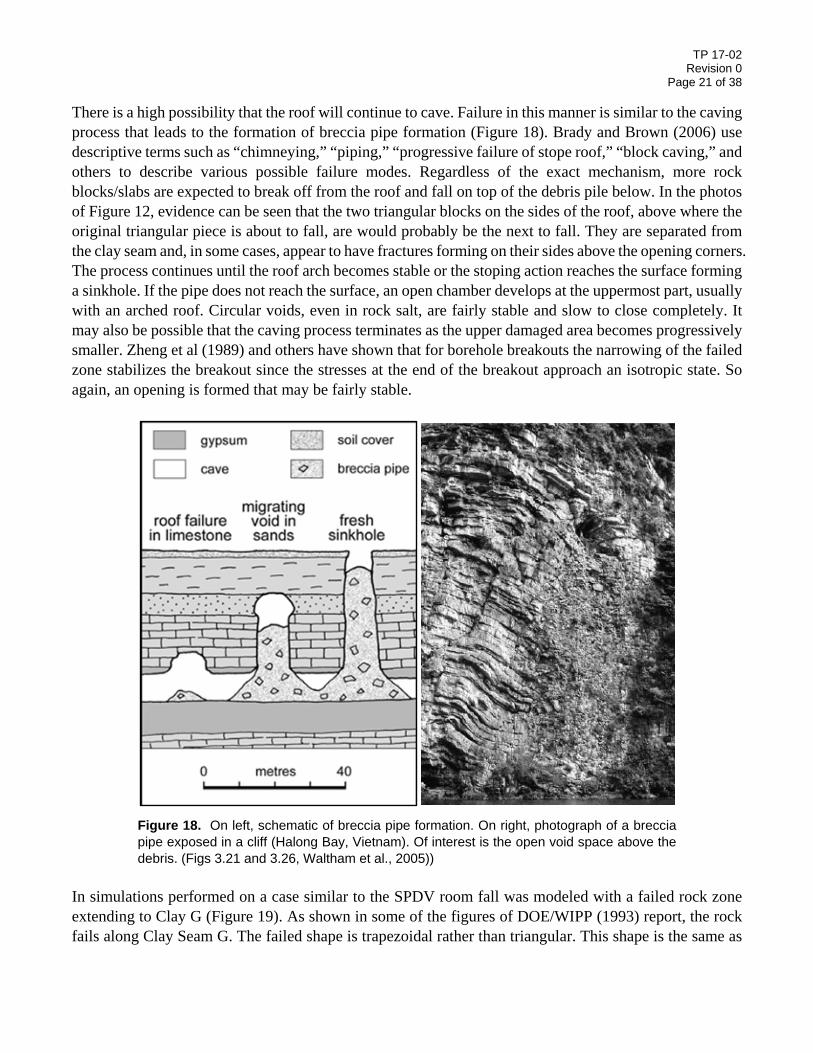
There is a high possibility that the roof will continue to cave. Failure in this manner is similar to the caving process that leads to the formation of breccia pipe formation (Figure 18). Brady and Brown (2006) use descriptive terms such as “chimneying,” “piping,” “progressive failure of stope roof,” “block caving,” and others to describe various possible failure modes. Regardless of the exact mechanism, more rock blocks/slabs are expected to break off from the roof and fall on top of the debris pile below. In the photos of Figure 12, evidence can be seen that the two triangular blocks on the sides of the roof, above where the original triangular piece is about to fall, are would probably be the next to fall. They are separated from the clay seam and, in some cases, appear to have fractures forming on their sides above the opening corners. The process continues until the roof arch becomes stable or the stoping action reaches the surface forming a sinkhole. If the pipe does not reach the surface, an open chamber develops at the uppermost part, usually with an arched roof. Circular voids, even in rock salt, are fairly stable and slow to close completely. It may also be possible that the caving process terminates as the upper damaged area becomes progressively smaller. Zheng et al (1989) and others have shown that for borehole breakouts the narrowing of the failed zone stabilizes the breakout since the stresses at the end of the breakout approach an isotropic state. So again, an opening is formed that may be fairly stable.
Figure 18. On left, schematic of breccia pipe formation. On right, photograph of a breccia pipe exposed in a cliff (Halong Bay, Vietnam). Of interest is the open void space above the debris. (Figs 3.21 and 3.26, Waltham et al., 2005))
In simulations performed on a case similar to the SPDV room fall was modeled with a failed rock zone extending to Clay G (Figure 19). As shown in some of the figures of DOE/WIPP (1993) report, the rock fails along Clay Seam G. The failed shape is trapezoidal rather than triangular. This shape is the same as

TP 17-02 Revision 0
Page 22 of 38
some of the cross-sections in Figure 11, but did not force an unrealistically small fracture angle to model a triangular-shaped slab. In this analysis, no waste or roof fall material is present in the repository room and no gas is generated. Again, the analysis was started under the condition where the rock fall had already occurred even though no salt deformation had taken place. The analysis was conducted for 400 years. The analysis predicts that a disturbed rock zone (DRZ) will occur on top as well as around the sides of the failed rock zone (white areas). As discussed above, this means that further salt failure is possible. Since rock failure is not allowed, the room creeps close. Even with no gas pressure, the room is still open after 400 years. Admittedly, compared to a panel intake drift, a room is 33 feet wide rather than 20 feet, and one foot taller (13 feet versus 12 feet), but the gap after 400 years is not insignificant.
Figure 19. Prediction of the DRZ extent (white areas) around a disposal room for no gas generated by the waste (f = 0.0), no waste, and a roof fall of a trapezoidal block extending up to Clay G (unpublished figure).
Clay G
Anhydrite "a"
MB 139
10 days 7 years 24 years
33 years 50 years 120 years
200 years 400 years

TP 17-02 Revision 0
Page 23 of 38
3.3.2 Permeability of the Rubble Pipe Part two of the caving process is how long does it take for the voids which formed between the rock block debris pile to close? There are no known experimental results for this phenomenon. As previously mentioned, the rock slabs may be quite large. It is unlikely that freshly collapsed material will fit in well with the previously broken-down material below it. Instead, fairly large voids and channels may exist producing highly permeable rubble. A race will ensue where lithostatic stress will cause the salt to either creep or fracture. A set of experiments where large rock salt blocks are compressed within a confined area or a numerical simulation of the same situation have not been found. A crushed salt model may not be applicable. The other permeability which needs to be considered is the open void space above where the rock fall takes place. This may be hard to close because of the inclination to form a stable shape. Again, no analyses of this kind have been located, whether analytical or experimental. 3.4 Dilatancy Condition Dilatancy is the increase in volume caused by the formation of fractures in the rock. The graph in Figure 20 is a dilatancy damage criterion for salt and the curves represent the stress condition leading to the onset of dilatancy for “compression” and “extension.” Extension triaxial tests are a different form of triaxial tests where Pconfining > Paxial, as opposed to the usual triaxial “compression” tests where Paxial > Pconfining. The DRZ forms when the stress condition is equal to or above the dilatancy damage criterion. For salt, there is a difference in the dilation criterion depending on whether the specimen was subject to a triaxial compression and triaxial extension states of stress. The linear criterion (black line Figure 20, Van Sambeek et al., 1993) is used to predict the extent of the DRZ around a room (Figure 17).

TP 17-02 Revision 0
Page 24 of 38
Figure 20. Dilatancy damage criteria for a bedded salt under triaxial compression and triaxial extension states of stress (DeVries et al., 2003).
4 EXPERIMENTAL PROCESS DESCRIPTION 4.1 Overall Strategy and Process The background information elucidated in the previous sections are included to demonstrate that there is some uncertainty as to the exact process that causes a disposal room to close and to describe a mechanism that could account for some of the discrepancy between the numerical models and what is observed in the field. While historically it has been assumed that the salt quietly and steadily deforms to encapsulate the waste and the numerical models have used constitutive models based on this assumption, the evidence in the WIPP repository indicates that that the salt nearest the room also sustains damage that contributes to
Compression
Extension

TP 17-02 Revision 0
Page 25 of 38
the closure of a disposal room. To investigate the process and effects of dilatancy on the closure of a shaft and a disposal room, a series of laboratory scale tests have been formulated. These tests are designed to simulate the effect of creating an opening in the underground. The salt test specimens will be thick walled hollow cylinders and cuboids (see Figure 21). The thick-walled cylinders will mimic a shaft (or circular drift). The stress in this axisymmetric geometry will only vary radially, making the results less complex to interpret and model. The cuboids will each have a square or rectangular hole drilled from one face to the opposing face to mimic a disposal room. This geometry will result in stresses that vary in two dimensions to further challenge the models. Both specimen dimensions will be designed to have enough crystals through their wall thicknesses that one can treat the salt as a homogeneous continuum. The primary focus will be on testing clean, relatively homogeneous, samples of salt. If samples with inhomogeneities can be obtained, however, a few tests may be run to assess the impact of thin anhydrite layers and clay seams. This effect to a greater degree is being investigated in a concurrent test plan. The inner and outer pressures 𝑃𝑃𝑖𝑖 and 𝑃𝑃𝑜𝑜 will be provided using pressurized oil within a protective sleeve. The axial stress 𝑃𝑃𝑧𝑧 will be applied by an axial actuator outfitted with compression platens. In addition to measuring the pressures 𝑃𝑃𝑖𝑖, 𝑃𝑃𝑜𝑜, and 𝑃𝑃𝑧𝑧, several displacements will be monitored. The axial displacement will be measured from the linear variable differential transformers (LVDT) on the axial actuator. A laboratory-sized borehole deformation gage, a modified digital bore micrometer will measure the closure of the cavity, strain gages, and/or maybe a borehole camera will be used to monitor the internal deformation.

TP 17-02 Revision 0
Page 26 of 38
Hollow cylinder Hollow cuboid
Figure 21. Specimen geometries and boundary conditions
To mitigate any damage that may have occurred during sample extraction or preparation, all tests will begin by applying hydrostatic pressure (𝑃𝑃i = 𝑃𝑃o = 𝑃𝑃z) to the specimen. This pressure will cause micro-cracks to heal and slightly deform the specimen. The salt community has not settled on how long the hydrostatic reconsolidation period should last. One approach under consideration is to end the reconsolidation period when the rate of deformation drops to a small enough value to be considered negligible. Specimen variability is a persistent problem in salt mechanics. To minimize such effects, uniform stress creep tests will be performed on the salt prior to introducing a non-uniform stress field. Two options are being considered.
1. Apply triaxial compression (𝑃𝑃i = 𝑃𝑃o, 𝑃𝑃z > 𝑃𝑃o) to the hollow specimens to before applying a non-uniform stress state. The differential stress 𝜎𝜎� = 𝑃𝑃𝑧𝑧 − 𝑃𝑃𝑜𝑜 would need to be large enough to approach steady state creep in a reasonable amount of time, and small enough to avoid significantly hardening the material.
2. Apply triaxial compression to the core removed from the hollow cylinder and/or hollow cuboid. This option would avoid hardening the actual hollow specimen, but, of course, the core may have slightly different behavior than the hollow specimen.
TP 17-02 Revision 0
Page 27 of 38
Both options only permit a limited look at the creep behavior of the specimen, so an analyst would need to assume that only certain material parameters vary from specimen to specimen. Once the creep behavior has been established, the boundary conditions can be changed to approximate the situation around a shaft or drift. The axial displacement will most likely be held fixed, creating a plane strain boundary condition, but the axial stress 𝑃𝑃𝑧𝑧 may also be held fixed in some experiments. The inner pressure will be less than the outer pressure (𝑃𝑃𝑖𝑖 < 𝑃𝑃𝑜𝑜), but their specific values will be chosen based on the scheme outlined below. Some amount of friction between the specimen and the compression platens will be unavoidable. Several strategies to mitigate this issue are being considered. Some tests could run with a dry interface between the specimen and the platens, and some tests could be run with a lubricated interface. If the difference is small then, friction can be neglected. If it is not negligible, one could attempt to characterize the frictional behavior. If that proves difficult, one could also increase the length 𝐿𝐿 of the specimen, such that the central section (where the measurement are being made) is unaffected by the friction at the platens. The values of 𝑃𝑃𝑖𝑖 and 𝑃𝑃𝑜𝑜 will be chosen to create one of three environments:
1. All the salt remains below the dilatancy boundary. 2. The salt closest to the hollow core exceeds the dilatancy boundary, while the remainder of the salt
remains below the dilatancy boundary. 3. All the salt exceeds the dilatancy boundary.
The first set of tests are designed to validate that salt constitutive models can capture viscoplastic phenomena in a non-uniform stress state. The second set of tests, in conjunction with the first set, will validate whether the models can capture combined viscoplasticity and damage. Investigations will be made into whether it is possible to exceed the dilatancy boundary by varying 𝐼𝐼1, yet maintaining roughly the same equivalent (differential) stress fields. If so, then the first and second set of tests will be directly comparable. The third set of tests may or may not be run, depending on the results from the first two sets of tests. After the tests, select specimens will be cross-sectioned. Cross-sectioning relieves residual stresses, so strain gages will be attached to the exterior of some specimens. These strain gage measurements can be compared against model predictions for the residual strain. In addition, attempts will be made to determine how far the damage extends from the hollow cavity. One technique under consideration is to use penetrating dye and microscopy to visualize the cracks. Other post-test analysis techniques that will be attempted include ct-scan and neutron techniques. The specific objectives of this Test Plan are:
• Perform triaxial loading tests on salt samples under hydrostatic exterior stress with no interior pressure. The samples would be cuboid shape with a square hole drilled into the specimen (see

TP 17-02 Revision 0
Page 28 of 38
Figure 22) or thick-walled cylinders. The alignment of the hole is perpendicular to the orientation of the maximum principal stress (assumed to be the vertical stress).
• The tests are to be performed on samples with the following variations: o Clean salt or salt with clay/anhydrite seam (Figure 22). Our primary focus will be clean salt. o Samples have holes with one of two cross sections, a 12:12 aspect ratio (square) and a 20:12
aspect ratio (rectangular) with the long axis perpendicular to the principal stress (Tables 1 and 2). The purpose is to assess the effects of a longer unsupported length.
• The tests are to be performed under both “predrilled” and “prestressed” conditions (Tables 1 and 2). o Predrilled is when the opening is drilled into the specimen prior to loading. The results of the
predrilled specimens will be used as a guide to establish the conditions for the prestressed specimen experiments. Not being a realistic loading condition, as few predrilled tests will be performed as possible.
o Prestressed is to be modeled by predrilling the hole prior to loading. Then simultaneous with loading, the hole is pressurized at the same rate and to the same magnitude as the level of lithostatic pressure as the repository location. The pressure in the hole is then released, mimicking the mining of the salt in the repository.
• The tests are to be performed under quasistatic and creep conditions. The difference is which loading system we use, which depends on the length of time the sample is expected to be under load. Quasistatic tests will be performed using one of several MTS load frames with test lasting 1-2 days, whereas the creep tests will be performed using systems in our creep lab. Creep tests may last for months.
Figure 22. Idealized cuboid specimen geometries. The tests are for trying to answer some important questions:
• Do the fractures form immediately as they do in granite, basalt, limestone, sandstone, talc, and other rocks as per the tests performed at the University of Wisconsin?
• Does the salt’s plasticity inhibit the formation of the fractures?
TP 17-02 Revision 0
Page 29 of 38
• To what degree do fracture initiation and growth have on the deformation of the borehole walls? To assess this effect, borehole closure will have to be measured both with damage and without damage. The real motivation is to validate how we model room closure by comparing against well controlled experiments.
• Are the fractures which form in the laboratory experiments similar to the types of fractures which form in the WIPP underground?
• Can fracture formation be predicted by existing models or can the experimental results be used to more appropriately parameterize existing models or develop a new one?
Based on observations in the field, it appears that the fractures form immediately around WIPP openings based on the quick pattern bolting required by NWP. The importance is, as mentioned above, whether a continuum model is applicable or we have to move to a discrete, discontinuous, or fracture mechanics model. This set of tests also complement the German core tests. The strength tests performed by the Germans were traditional triaxial tests, not extension. The salt block tests look at the behavior of the rock around openings up to and after dilatancy depending on the type of test and can be used to investigate dilatancy damage criteria and post damage behavior. The salt block tests could also be used to validate the German tests in that appropriately parameterized model(s) should predict the laboratory behavior reasonably well. It should be noted that the parameters investigated by the present tests are not the same as those being investigated by the German researchers. The creep tests are to investigate the conjecture mentioned by Borns and Stormont (1988, 1989) that the number of fractures increased with time. This is a logical inference since detachment of a slab creates a free surface which may allow for more slabs to form. However, the backpressure applied by a still attached slab may slow the fracture forming process down to some degree, especially compared to the brittle rocks that were tested at the University of Wisconsin. It has not yet been determined how fracture growth evolution will be monitored and/or measured.

TP 17-02 Revision 0
Page 30 of 38
Table 1. Test Matrix for pre-drilled samples.
Cross-Sectional Shape of Opening
Type of salt Square (aspect ratio = 12:12)
Rectangular (aspect ratio = 20:12)
Clean Salt Block X X Salt Block with clay/anhydrite seams
X X
Table 2. Test Matrix for “prestressed” samples. Cross-Sectional Shape of Opening
Type of salt Square (aspect ratio = 12:12)
Rectangular (aspect ratio = 20:12)
Clean Salt Block X X Salt Block with clay/anhydrite seams
X X
4.1.1 Triaxial Load Tests Triaxial load tests will be conducted in accordance to ASTM D7012-14. 4.1.2 Creation of “Prestressed Condition” A prestressed condition will be produced using a specimen loaded under a hydrostatic, triaxial, or true triaxial (polyaxial) stress condition with the borehole being pressurized to the level of the applied external mean stress. Several methods will be attempted to pressurize the internal borehole including lining the borehole with an impermeable sleeve, applying an impermeable coating in the borehole, or pressurizing borehole with brine or non-penetrating liquid. Once the applied loading reaches the pre-selected stress level, the pressure in the borehole will be depressurized. This simulates excavating an opening in a rock under stress like in the WIPP underground. An alternative, which is dependent on the success of the previous experiments, is to contract with the University of Wisconsin – Madison to use their true triaxial cell and drilling system. The present system can accept a 6″×6″×9″ (15.2 cm × 15.2 cm × 22.9 cm) specimen. The stresses in each of the three principal directions can reach 15,000 psi (103 MPa). The drill is designed to drill completely through the sample, if desired, while the sample is under stress. Both air and liquid drilling can be performed.
TP 17-02 Revision 0
Page 31 of 38
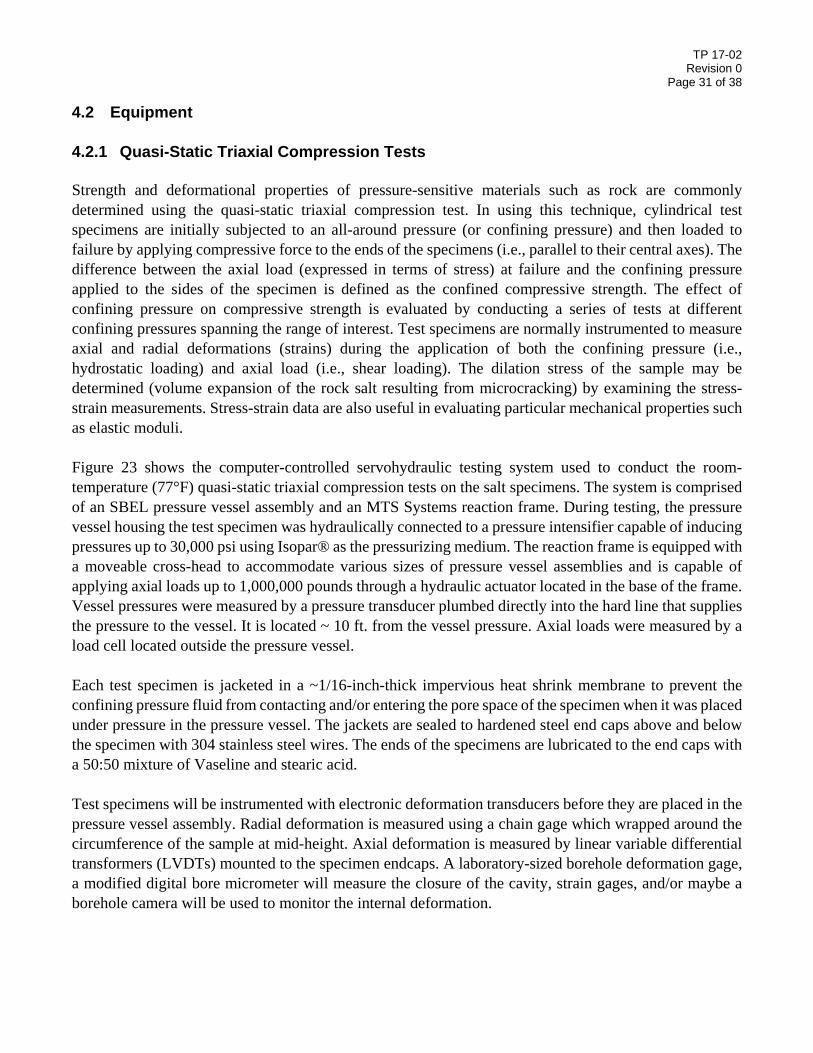
4.2 Equipment 4.2.1 Quasi-Static Triaxial Compression Tests Strength and deformational properties of pressure-sensitive materials such as rock are commonly determined using the quasi-static triaxial compression test. In using this technique, cylindrical test specimens are initially subjected to an all-around pressure (or confining pressure) and then loaded to failure by applying compressive force to the ends of the specimens (i.e., parallel to their central axes). The difference between the axial load (expressed in terms of stress) at failure and the confining pressure applied to the sides of the specimen is defined as the confined compressive strength. The effect of confining pressure on compressive strength is evaluated by conducting a series of tests at different confining pressures spanning the range of interest. Test specimens are normally instrumented to measure axial and radial deformations (strains) during the application of both the confining pressure (i.e., hydrostatic loading) and axial load (i.e., shear loading). The dilation stress of the sample may be determined (volume expansion of the rock salt resulting from microcracking) by examining the stress-strain measurements. Stress-strain data are also useful in evaluating particular mechanical properties such as elastic moduli. Figure 23 shows the computer-controlled servohydraulic testing system used to conduct the room-temperature (77°F) quasi-static triaxial compression tests on the salt specimens. The system is comprised of an SBEL pressure vessel assembly and an MTS Systems reaction frame. During testing, the pressure vessel housing the test specimen was hydraulically connected to a pressure intensifier capable of inducing pressures up to 30,000 psi using Isopar® as the pressurizing medium. The reaction frame is equipped with a moveable cross-head to accommodate various sizes of pressure vessel assemblies and is capable of applying axial loads up to 1,000,000 pounds through a hydraulic actuator located in the base of the frame. Vessel pressures were measured by a pressure transducer plumbed directly into the hard line that supplies the pressure to the vessel. It is located ~ 10 ft. from the vessel pressure. Axial loads were measured by a load cell located outside the pressure vessel. Each test specimen is jacketed in a ~1/16-inch-thick impervious heat shrink membrane to prevent the confining pressure fluid from contacting and/or entering the pore space of the specimen when it was placed under pressure in the pressure vessel. The jackets are sealed to hardened steel end caps above and below the specimen with 304 stainless steel wires. The ends of the specimens are lubricated to the end caps with a 50:50 mixture of Vaseline and stearic acid. Test specimens will be instrumented with electronic deformation transducers before they are placed in the pressure vessel assembly. Radial deformation is measured using a chain gage which wrapped around the circumference of the sample at mid-height. Axial deformation is measured by linear variable differential transformers (LVDTs) mounted to the specimen endcaps. A laboratory-sized borehole deformation gage, a modified digital bore micrometer will measure the closure of the cavity, strain gages, and/or maybe a borehole camera will be used to monitor the internal deformation.
TP 17-02 Revision 0
Page 32 of 38
Figure 23. Testing system used to conduct quasi-static triaxial compression tests.
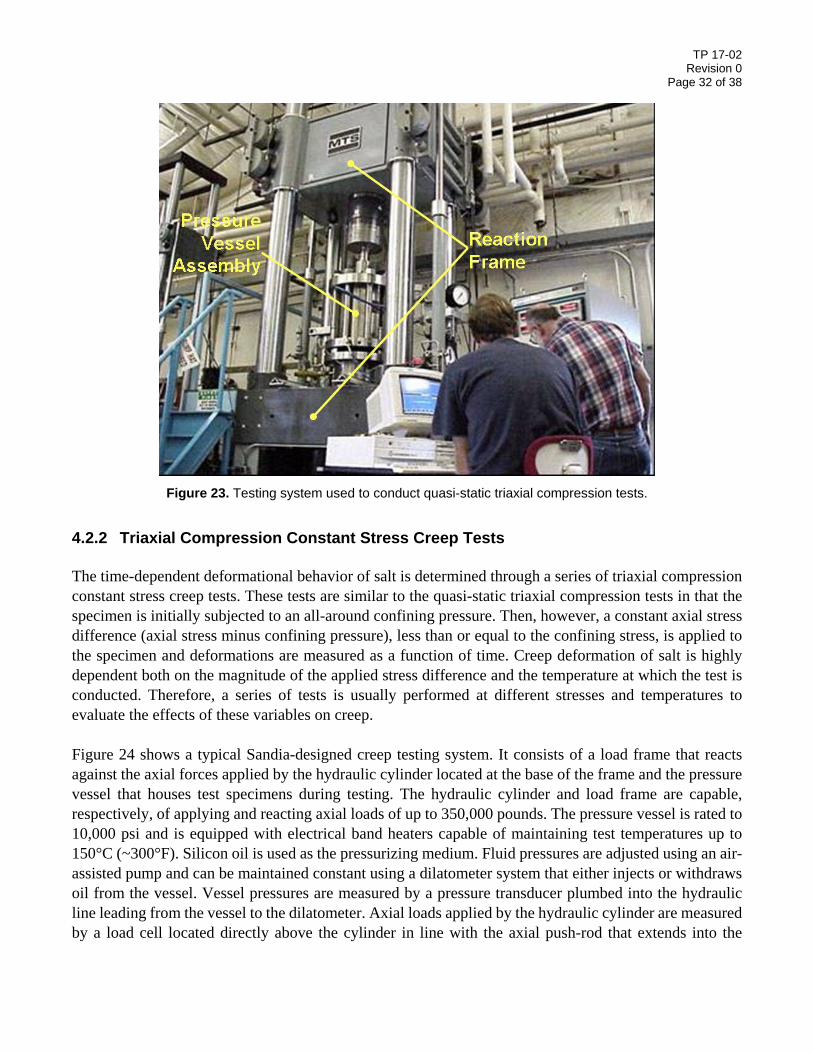
4.2.2 Triaxial Compression Constant Stress Creep Tests The time-dependent deformational behavior of salt is determined through a series of triaxial compression constant stress creep tests. These tests are similar to the quasi-static triaxial compression tests in that the specimen is initially subjected to an all-around confining pressure. Then, however, a constant axial stress difference (axial stress minus confining pressure), less than or equal to the confining stress, is applied to the specimen and deformations are measured as a function of time. Creep deformation of salt is highly dependent both on the magnitude of the applied stress difference and the temperature at which the test is conducted. Therefore, a series of tests is usually performed at different stresses and temperatures to evaluate the effects of these variables on creep. Figure 24 shows a typical Sandia-designed creep testing system. It consists of a load frame that reacts against the axial forces applied by the hydraulic cylinder located at the base of the frame and the pressure vessel that houses test specimens during testing. The hydraulic cylinder and load frame are capable, respectively, of applying and reacting axial loads of up to 350,000 pounds. The pressure vessel is rated to 10,000 psi and is equipped with electrical band heaters capable of maintaining test temperatures up to 150°C (~300°F). Silicon oil is used as the pressurizing medium. Fluid pressures are adjusted using an air-assisted pump and can be maintained constant using a dilatometer system that either injects or withdraws oil from the vessel. Vessel pressures are measured by a pressure transducer plumbed into the hydraulic line leading from the vessel to the dilatometer. Axial loads applied by the hydraulic cylinder are measured by a load cell located directly above the cylinder in line with the axial push-rod that extends into the

TP 17-02 Revision 0
Page 33 of 38
pressure vessel and applies axial load to the ends of the specimen. Test temperature is recorded by two thermocouples, one located near the top of the pressure vessel and other near the vessel midheight. As with the quasi-static triaxial compression tests, each specimen is placed between two metal endcaps and jacketed to protect it from the pressurizing fluid. For the creep tests, the specimens are jacketed with flexible Viton tubing (rather than shrink tubing) that is secured to the endcaps with 304 stainless lock wire (Vaseline/stearic acid is again used as the end lubricant). The specimen assembly is placed inside the pressure vessel, which is then filled with silicon oil. The pressure in the vessel is increased to the target level (possibly 4,000 psi for the creep tests in this study) and allowed to stabilize. The vessel is then heated to the target temperature, room temperature for these tests, by activating the band heaters located on the outside of the pressure vessel. The temperature is allowed to stabilize for approximately 24 hours. After this stabilization period was completed, the target stress difference is applied by rapidly increasing the axial load on the specimen using the hydraulic cylinder. When the target load is reached, control of the test is turned over to an Azonics controller that maintained the axial stress constant throughout the duration of the test and also served as the data acquisition system. Because salt specimens undergo rather large radial expansion during testing, the axial force applied to the ends of the specimen is occasionally adjusted (increased) to account for the change in specimen cross-sectional area, thereby ensuring constant stress (rather than constant force) conditions were maintained. The creep tests are terminated when the strain rate reaches a constant steady-state value or is changing very slowly with time.

TP 17-02 Revision 0
Page 34 of 38
Figure 24. Sandia-designed creep testing system
Creep deformations are measured by electronic transducers mounted outside the pressure vessel in contrast to the on-the-specimen method used in the quasi-static triaxial compression tests. Axial deformation is measured by two LVDTs that tracked the displacement of the axial push-rod relative to the bottom of the pressure vessel. This displacement is a direct measure of the axial displacement of the specimen because non-specimen deformations are negligible given the imposed constant stress condition. The LVDTs are mounted 180º apart on the push-rod. The calibrated ranges of the LVDTs are either 0.05 or 0.1 inches and 1 inch allowing accurate measurements of both small and relatively large strains. During the tests, the 0.05 or 0.1-inch-range LVDTs are reset periodically when the range is exceeded. Radial deformations are measured indirectly by measuring the volume of oil that is either injected into or removed from the vessel by the dilatometer system with an appropriate correction for the volume displaced by the push-rod as it moves into or out of the pressure vessel. This technique, developed by Wawersik (1979), is accurate to
TP 17-02 Revision 0
Page 35 of 38
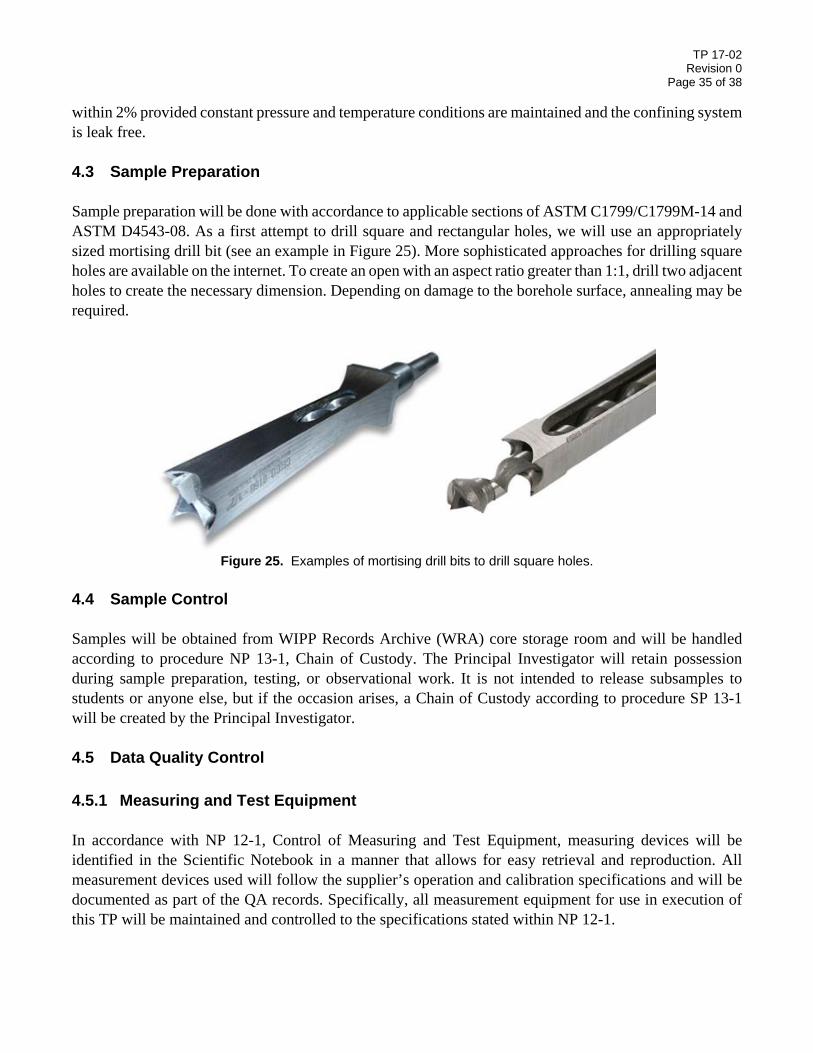
within 2% provided constant pressure and temperature conditions are maintained and the confining system is leak free. 4.3 Sample Preparation Sample preparation will be done with accordance to applicable sections of ASTM C1799/C1799M-14 and ASTM D4543-08. As a first attempt to drill square and rectangular holes, we will use an appropriately sized mortising drill bit (see an example in Figure 25). More sophisticated approaches for drilling square holes are available on the internet. To create an open with an aspect ratio greater than 1:1, drill two adjacent holes to create the necessary dimension. Depending on damage to the borehole surface, annealing may be required.
Figure 25. Examples of mortising drill bits to drill square holes.
4.4 Sample Control Samples will be obtained from WIPP Records Archive (WRA) core storage room and will be handled according to procedure NP 13-1, Chain of Custody. The Principal Investigator will retain possession during sample preparation, testing, or observational work. It is not intended to release subsamples to students or anyone else, but if the occasion arises, a Chain of Custody according to procedure SP 13-1 will be created by the Principal Investigator. 4.5 Data Quality Control 4.5.1 Measuring and Test Equipment In accordance with NP 12-1, Control of Measuring and Test Equipment, measuring devices will be identified in the Scientific Notebook in a manner that allows for easy retrieval and reproduction. All measurement devices used will follow the supplier’s operation and calibration specifications and will be documented as part of the QA records. Specifically, all measurement equipment for use in execution of this TP will be maintained and controlled to the specifications stated within NP 12-1.
TP 17-02 Revision 0
Page 36 of 38
4.5.2 Data Acquisition Data collection will be recorded in the Scientific Notebook and by the data acquisition system (DAS) associated with the various testing machines. Both manually and electronically-collected data will be acquired during the tests. The following types of data may be recorded:
• electronically-collected displacement (LVDT), load (load cells and pressure transducers) and thermocouple data from the DAS or data logger.
• electronically-collected deformations from the DAS or data logger. • manually-collected load, displacement, pressure data when necessary or for backup purposes.
Qualitative observations of anticipated fracture location and characteristic should be recorded in the Scientific Notebook. Accompanying photographs will be accumulated in a Scientific Notebook Supplement. Procedure NP 20-2 Scientific Notebooks will be followed. Much of the scientific inquiry here is observational in nature. 4.5.2.1 Scientific Notebooks A scientific notebook(s) will be used in accordance with NP 20-2 to document all SNL activities and decisions during the testing phase. Specific information that may be entered in the scientific notebook(s) consists of:
• Objectives and description of work being performed. • Documented activities related to development and operation of tests. • Listing of equipment used during test, including make, model, and controlling operating system. • Information related to calibration of instruments. • Information, observations, and discussions related to decisions involving modifications of test
activities. 5 TRAINING All personnel who will perform quality-affecting activities under this TP must have training in the SNL QA program (Form NP 2-1-1), must view the current QA refresher training, and must have read SNL NP 12-1, NP 13-1, NP 20-2, and SP 13-1. They must also read the procedures outlined in this TP, the Primary Hazard Screening (PHS), and all applicable NPs and SPs, but no additional training in those procedures is required. No other special training requirements are anticipated in addition to the safety briefings described in Section 6. Existing procedures implemented in the laboratory cannot be expected to anticipate every possible event affecting the tests. Therefore, the PI is expected to implement appropriate measures during the conduct of the tests. These technical decisions will be documented in the scientific notebook.

TP 17-02 Revision 0
Page 37 of 38
6 HEALTH AND SAFETY Research described in this Test Plan will be undertaken in Building 849 Sandia Geomechanics Laboratory. Sample sawing and drilling will occur within the Geomechanics Laboratory at Sandia Building 849 and are governed by SNL NEPA ID: NM16-0004; Bldg 849 Geomechanics Laboratory Materials Characterization Testing and PHS #: SNL07A00110-010, entitled: Bldg 849 Geomechanics Laboratory. Laboratory operations describe the non-radiological hazards associated with these activities and procedures to deal with those hazards, including training requirements for personnel active in the laboratory. 7 PERMITTING/LICENSING There is no special license or permit requirement for the activities described in this Test Plan. 8 REFERENCES ASTM C1799/C1799M-14, 2014, Standard Guide to Dimension Stone Test Specimen Sampling and Preparation1, American Society for Testing and Materials, ASTM International, West Conshohocken, PA. ASTM D4543-08. (2008). Standard Practices for Preparing Rock Core as Cylindrical Test Specimens and Verifying Conformance to Dimensional and Shape Tolerances. American Society for Testing and Materials, ASTM International, West Conshohocken, PA. ASTM D7012-14. (2014). Standard Test Methods for Compressive Strength and Elastic Moduli of Intact Rock Core Specimens under Varying States of Stress and Temperatures. American Society for Testing and Materials, ASTM International, West Conshohocken, PA. Borns, D.J. and J.C. Stormont. (1988). An Interim Report on Excavation Effect Studies at the Waste Isolation Pilot Plant: The Delineation of the Disturbed Rock Zone. SAND87-1375. Sandia National Laboratories, Albuquerque, NM. Borns, D.J. and J.C. Stormont. (1989). Delineation of the Disturbed Rock Zone Surrounding Excavations in Salt. SAND88-2230C. Sandia National Laboratories, Albuquerque, NM. Presented at the 30th U.S. Symposium on Rock Mechanics, 19-22 June 1989, Morgantown, WV, Paper ARMA-89-0353. Brady, B.H.G. and E.T. Brown. 2006. Rock Mechanics for Underground Mining, 3rd ed., reprint with corrections. Springer; Dordrecht, The Netherlands Butcher, B.M. and F.T. Mendenhall. (1993). A Summary of the Models Used for the Mechanical Response of Disposal Rooms in the Waste Isolation Pilot Plant with Regard to Compliance with 40 CFR 191, Subpart B. SAND92-0427. Sandia National Laboratories, Albuquerque, NM.

TP 17-02 Revision 0
Page 38 of 38
DeVries, K.L., K.D. Mellegard, and G.D. Callahan. (2003). Laboratory Testing in Support of a Bedded Salt Failure Criterion. Solution Mining Research Institute Fall 2003 Meeting, Chester, United Kingdom, October 5–8, pp. 90–113 DOE/WIPP. 1993. The Current Bases for Roof Fall Prediction at WIPP and a Preliminary Prediction for SPDV Room 2. DOE/WIPP 93-033. U.S. Department of Energy. DOE/WIPP. (2016). Geotechnical Analysis Report for July 2014 – June 2014. DOE/WIPP-16-3559, Volume 1. U.S. Department of Energy, Oakridge, TN. Haimson, B. (2007). Micromechanisms of borehole instability leading to breakouts in rocks. International Journal of Rock Mechanics & Mining Sciences, 44 (2007) 157–173. Herrick, C.G., B.Y. Park, M.Y. Lee, and D.J. Holcomb. (2009). Estimating the Extent of the Disturbed Rock Zone around a WIPP Disposal Room. Paper ARMA 09-82, 43rd US Rock Mechanics Symposium, June 28th – July 1, 2009, Asheville, NC. Morgan, H.S. (1987). Estimate of the Time Needed for TRU Storage Rooms to Close. Memo to D.E. Munson dated June 2, 1987. Available in Appendix A, pp. A-67 to A-90 of Butcher and Mendenhall (1993). Park, B.Y., C.G. Herrick, and D.J. Holcomb. (2008). Prediction of the Extent of the Disturbed Rock Zone around a WIPP Disposal Room, USA. Paper 8057, WM2008 Conference, February 24-28, 2008, Phoenix, AZ. Reedlunn, B. (2016). Reinvestigation into Closure Predictions of Room D at the Waste Isolation Pilot Plant. SAND2016-9961. Sandia National Laboratories, Albuquerque, NM. Van Sambeek, L., J. Ratigan, and F.D. Hansen. (1993). Dilatancy of Rock Salt in Laboratory Tests. Proc. 34th U.S. Symposium on Rock Mechanics, B.C. Haimson (ed.), University of Wisconsin-Madison, Madison, WI, June 27-30, 1993. pp. 245-248. International Journal of Rock Mechanics and Mining Sciences & Geomechanics Abstracts, Pergamon Press, 30 (7) 735–738. Waltham, T., F. Bell, and M. Culshaw. (2005). Sinkholes and Subsidence – Karst and Cavernous Rocks in Engineering and Construction. Praxis Publishing, Chichester, UK. Wawersik, W.R. (1979). Indirect Deformation (Strain) Measurements and Calibrations in Sandia Triaxial Apparatus for Rock Testing to 250°C. SAND79-0114. Sandia National Laboratories, Albuquerque, NM. Zheng, Z., J. Kemeny, and N.G.W. Cook. (1989). Analysis of borehole breakouts. J. Geophys. Res., 94: 7171-7182.

TP 17-02 Revision 0
Disclaimer of Liability
This work of authorship was prepared as an account of work sponsored by an agency of the United States Government. Accordingly, the United States Government retains a nonexclusive, royalty-free license to publish or reproduce the published form of this contribution, or allow others to do so for United States Government purposes. Neither the National Technology and Engineering Solutions of Sandia, LLC., the United States Government, nor any agency thereof, nor any of their employees makes any warranty, express or implied, or assumes any legal liability or responsibility for the accuracy, completeness, or usefulness of any information, apparatus, product, or process disclosed, or represents that its use would not infringe privately-owned rights. Reference herein to any specific commercial product, process, or service by trade name, trademark, manufacturer, or otherwise does not necessarily constitute or imply its endorsement, recommendation, or favoring by the National Technology and Engineering Solutions of Sandia, LLC., the United States Government, or any agency thereof. The views and opinions expressed herein do not necessarily state or reflect those of the National Technology and Engineering Solutions of Sandia, LLC., the United States Government or any agency thereof. Sandia National Laboratories is a multimission laboratory managed and operated by National Technology and Engineering Solutions of Sandia, LLC., a wholly owned subsidiary of Honeywell International, Inc., for the U.S. Department of Energy’s National Nuclear Security Administration under contract DE-NA-0003525. Parties are allowed to download copies at no cost for internal use within your organization only provided that any copies made are true and accurate. Copies must include a statement acknowledging Sandia Corporation's authorship of the subject matter.


![PremiumCoat Finish Coat - Product Data - BuildSite · 2019. 7. 5. · [ASTM E96] Salt Spray No effects [ASTM B117] Algae Resistance Orating [ASTM G29] Drying Time (Touch dry) 1–4](https://img.dokumen.tips/doc/110x75/60c6f13ca2e50d42f956fd8e/premiumcoat-finish-coat-product-data-buildsite-2019-7-5-astm-e96-salt.jpg)


