Embed Size (px)
Citation preview

“Test of capital market integration using Fama-French three-factor model:empirical evidence from India”
AUTHORS
Neeraj Sehrawat https://orcid.org/0000-0003-3411-2310
Amit Kumar https://orcid.org/0000-0002-8113-9316
Narander Kumar Nigam https://orcid.org/0000-0003-0686-4478
Kirtivardhan Singh https://orcid.org/0000-0001-6319-7136
Khushi Goyal https://orcid.org/0000-0003-1376-7502
ARTICLE INFO
Neeraj Sehrawat, Amit Kumar, Narander Kumar Nigam, Kirtivardhan Singh and
Khushi Goyal (2020). Test of capital market integration using Fama-French three-
factor model: empirical evidence from India. Investment Management and
Financial Innovations, 17(2), 113-127. doi:10.21511/imfi.17(2).2020.10
DOI http://dx.doi.org/10.21511/imfi.17(2).2020.10
RELEASED ON Friday, 22 May 2020
RECEIVED ON Monday, 16 March 2020
ACCEPTED ON Tuesday, 28 April 2020
LICENSE
This work is licensed under a Creative Commons Attribution 4.0 International
License
JOURNAL "Investment Management and Financial Innovations"
ISSN PRINT 1810-4967
ISSN ONLINE 1812-9358
PUBLISHER LLC “Consulting Publishing Company “Business Perspectives”
FOUNDER LLC “Consulting Publishing Company “Business Perspectives”
NUMBER OF REFERENCES
49
NUMBER OF FIGURES
0
NUMBER OF TABLES
8
© The author(s) 2021. This publication is an open access article.
businessperspectives.org

113
Investment Management and Financial Innovations, Volume 17, Issue 2, 2020
http://dx.doi.org/10.21511/imfi.17(2).2020.10
Abstract
Integration or segmentation of markets determines whether substantial advantages in risk reduction can be attained through portfolio diversification in foreign securities. In an integrated market, investors face risk from country-specific factors and factors, which are common to all countries, but price only the later, as country-specific risk is diversifiable. The aim of this study is two-fold, firstly, investigating the superiority of the Fama-French three-factor model over Capital Asset Pricing Model (CAPM) and later using the superior model to test for integration of Indian and US equity mar-kets (a proxy for global markets). Based on a sample of Bombay Stock Exchange 500 non-financial companies for the period 2003–2019, the data suggest the superiority of Fama-French three-factor model over CAPM. Using the Non-Linear Seemingly Unrelated Regression technique, the first half of the sample period (2003–2010) shows evidence of market segmentation; however, the second sub-period (2011–2019) shows weak signs of market integration, which is supported by the Johansen test of cointegra-tion, suggesting that Indian market is gradually getting integrated with global markets.
Neeraj Sehrawat (India), Amit Kumar (India), Narander Kumar Nigam (India), Kirtivardhan Singh (India), Khushi Goyal (India)
Test of capital market
integration using
Fama-French three-factor
model: empirical evidence
from India
Received on: 16th of March, 2020Accepted on: 28th of April, 2020Published on: 22nd of May, 2020
INTRODUCTION
All sound investment and portfolio management decisions are guided by expected cash flows to secure maximum expected possible returns for a given amount of risk. The stock market returns in such a scenario are priced for the various systematic risk factors. CAPM showed that an efficient combination of various risky assets would demonstrate a linear relationship between risks and return (Sharpe, 1964). Followed by this, CAPM was independently developed by Lintner (1965) and Mossin (1966). While it can be argued that testing of CAPM is not empirically possible because of the absence of a good proxy for market portfolio (Roll, 1977), there is enough existing research to support that there are more factors than market volatility to explain the returns (Miller, 1999). Fama and French (1992) discovered the violation of a linear cross-sectional relationship between mean excess returns and exposures to the market factor (main prediction of the CAPM) for the US stock market. Then, a new asset pricing model, with two additional explanatory variables, size and book equity to market equity ratio, was developed (Fama & French, 1993). Chui and Wei (1998) did empirical testing on China, Taiwan, Malaysia, Korea, and Singapore equity mar-kets and concluded a strong relationship between the expected stock returns and these three factors. Although there have been a plethora of empirical studies focused on CAPM and Fama-French three-factor
© Neeraj Sehrawat, Amit Kumar, Narander Kumar Nigam, Kirtivardhan Singh, Khushi Goyal, 2020
Neeraj Sehrawat, Neeraj Sehrawat, M.B.A., Assistant Professor, Shaheed Sukhdev College of Business Studies, University of Delhi, New Delhi, India. (Corresponding author)
Amit Kumar, M.Com., Assistant Professor, Shaheed Sukhdev College of Business Studies, University of Delhi, New Delhi, India.
Narander Kumar Nigam, Ph.D., Assistant Professor, Shaheed Sukhdev College of Business Studies, University of Delhi, New Delhi, India.
Kirtivardhan Singh, B.B.A. (FIA), Student, Shaheed Sukhdev College of Business Studies, University of Delhi, New Delhi, India.
Khushi Goyal, BMS, Student, Shaheed Sukhdev College of Business Studies, University of Delhi, New Delhi, India.
This is an Open Access article, distributed under the terms of the Creative Commons Attribution 4.0 International license, which permits unrestricted re-use, distribution, and reproduction in any medium, provided the original work is properly cited.
www.businessperspectives.org
LLC “СPС “Business Perspectives” Hryhorii Skovoroda lane, 10, Sumy, 40022, Ukraine
BUSINESS PERSPECTIVES
JEL Classification G12, G15
Keywords stock market, international portfolio, diversification, asset pricing
Conflict of interest statement:
Author(s) reported no conflict of interest

114
Investment Management and Financial Innovations, Volume 17, Issue 2, 2020
http://dx.doi.org/10.21511/imfi.17(2).2020.10
model, only a few research studies have been conducted for Indian markets, notably Connor and Sehgal (2001), Sehgal and Tripathi (2006), and Taneja (2010). All of these findings suggest that Fama-French three-factor model explains excess returns better than CAPM. They concluded that to explain excess returns, the market factor is most important, and there are no conclusive remarks on which amongst the size and value factor explains excess return better. However, all three factors combined have a better adjusted Coefficient of determination (R2) than the market factor alone.
However, there has been a considerable change since these studies were done. There are recent findings that suggest that the explanation of excess returns by Fama-French multifactor model has dwindled over time on Istanbul Stock Exchange (Eraslan, 2013). This raises an obvious question, is Fama-French still pervasive in the Indian context? This study tries to fill this gap by, first, empirically testing and com-paring CAPM with Fama-French model. The study concludes that for all the six portfolios constructed, Fama-French explains excess returns better than CAPM, and it is still pervasive in the Indian context. This research also tried to find an answer to the question, which factor, size, or value is the second most important factor in explaining excess returns.
The Indian economy since the 1991 reforms has seen a high level of growth and economic prosperity. These reforms then coupled by many other financial sector reforms during 1998–2004 and the enact-ment of Financial Sector Legislative Reforms Commission (FSLRC) in 2011 were moves in the right di-rection, the importance of which will be felt for many years to come (Rajan, 2014). Subsequently, India has jumped 79 positions in the past five years in Ease of Doing Business ranking, coupled with political stability, the concept of universal and big banks, reduced taxes, and implementation of one nation one tax policy. All this contributed to the image of India as an attractive global destination for investment.
In this context, it was important to check whether the Indian stock market is segmented to global cap-ital market or is it already integrated with global peers. The majority of such research testing market integration has been focused on developed markets like Canada and Australia. The study of market in-tegration has widely applied CAPM, notable among these are Solnik (1974) for European stocks, Stehle (1976), Jorion and Schwartz (1986), and Mittoo (1992) in the Canadian market.
The use of Fama-French three-factor model to study market integration is limited. In developing markets, Brooks, Iorio, Faff, and Wang (2009) examined market integration in the Chinese market for the period 1995–2006, extending the work of Jorion and Schwartz (1986) to Fama-French three-factor model, and suggested that the Chinese stock market is segmented from the stock market of the United States and the government’s restriction on capital movement is preventing integration of Chinese market with global peers. In the Indian context, it has not come to the knowledge of authors, any study that uses Fama-French three-factor model for testing the market integration. Through this work, attempts are made to fill this gap in the literature by empirically testing market integra-tion using Fama-French three-factor model.
1. LITERATURE REVIEW
1.1. Asset pricing models – CAPM and
Fama-French three-factor model
“An investor does not pay more for an asset than what is its worth”. This led to the development of Capital Asset Pricing Model (CAPM) by Sharpe (1964) who showed that efficient combination of risky assets would demonstrate a linear relation-
ship between risk and return, Lintner (1965) who focused on creating an optimum mix of risk-free and risky assets, and Black (1972) who provid-ed a zero-beta version of CAPM. This was the first big breakthrough in the development of an asset pricing model. Pratt (1967) analyzed the US common stocks between 1926 and 1960 and showed that actual returns are different from CAPM predictions. Jensen et al. (1972) analyzed the companies listed on NYSE exchange between

115
Investment Management and Financial Innovations, Volume 17, Issue 2, 2020
http://dx.doi.org/10.21511/imfi.17(2).2020.10
1926 and 1966 using time series and concluded that in the post-war period, the typical form of asset pricing model1 fails to explain the accurate security returns, and expected returns on high beta assets are lower than what is suggested by CAPM, and the vice versa is true for low beta stocks. Banz (1981) postulated that smaller firms on average had more risk-adjusted returns than larger firms on NYSE for the period 1936–1975 and that CAPM beta alone could not explain the higher returns.
Another contradiction to the proposed CAPM came from Bhandari (1988) who documented that expected stock returns are positively correlated with the level of debt to equity of common stocks. Fama and French (1992) researched for the ad-dition of independent variables in the CAPM to improve upon its explanatory power, expanding CAPM, thus, developing an asset pricing model. They concluded that a significant portion of the cross-sectional dispersion in the mean returns could be explained by exposures to two factors other than the excess market returns, a “size” fac-tor, and a “value” factor based on the BE/ME ratio.
There are many plausible explanations relat-ing to why stocks with high BE/ME ratio (value stocks) outperform the growth stocks. Fama and French (1992, 1996) argued that this is because value strategies are fundamentally riskier and, hence, include a premium for such risk. However, Lakonishok, Shleifer, and Vishny (1994) argued that these higher returns are because investors can identify mispriced stocks and not because they are fundamentally riskier. Arshanapalli, Coggin, and Doukas (1998) used large inter-national equity-based and showed that during 1975–1995, value stocks on average outperformed growth stocks in most countries, and these effects were not just limited to the USA. Gaunt (2004) studied the Australian market and concluded that three-factor model provides several explana-tory power over CAPM and that “value” factor is more important than “size” factor. Nartea, Ward, and Djajadikerta (2009) also found similar re-sults over New Zealand stocks.
1 ( ) ( )i m iE R E R β= where ( ) ( ) ( ) )1 1i t t t t fE R E P P E D P R− − = − + − is expected excess return on i-th asset.
2 Fama-Macbeth regression is a two-step OLS regression method. It involves estimating risk premiums and betas for factors that can contribute to asset prices using time series data.
1.2. Applicability of Fama-French
model in India
In the Indian context, Connor and Sehgal (2001) constructed six equally weighted portfolios on common stocks between 1989 and 1998 and in-ferred that cross-sectional mean returns are ex-plained by three factors and not just market be-ta alone. The results were consistent with Fama-French three-factor model. Mohanty (2002) used Fama-Macbeth regression2 to verify whether the cross-sectional variations in stock returns could be explained by size, value, price earning ratio, and leverage. He found a negative correlation be-tween “size” factor and returns and between “val-ue” factor and returns. Sehgal and Tripathi (2006) also found Fama-French to be a superior model to CAPM in explaining stock returns. Taneja (2010) found high correlations between the size and val-ue factors in the Indian market and concluded that any of the two factors could be used to im-prove the model.
Thus, based on these past studies, this study hy-pothesizes that:
H1: Fama-French three-factor model is supe-rior to the Capital Asset Pricing Model in explaining cross-sectional variations in the mean returns from the stocks.
1.3. Test of market integration using
asset pricing models
For the test of capital market integration, the first empirical testing was of Solnik (1974) who, in a series of papers, argued that an inves-tor should diversify internationally to reduce risk. His findings include that international diversification leads to greater risk reduction than domestic diversification in the US. He used Fama-Macbeth regression using Merton’s International Asset Pricing Model (IAPM) and could not reject integration in seven European countries. Stehle (1977) did research on the US stocks and could not reject both integration and segmentation.

116
Investment Management and Financial Innovations, Volume 17, Issue 2, 2020
http://dx.doi.org/10.21511/imfi.17(2).2020.10
Wheatley (1988) developed a consumption-based asset pricing model and predicted an asset pricing line using monthly data in the US between January 1960–1985 and could not accept that market inte-gration holds. Jorion and Schwartz (1986) exam-ined the Canadian market integration with North American Market between 1963 and 1982 using both domestic and international versions of CAPM to re-ject the hypothesis of integration, i.e., no evidence of a mean-variance efficient global market portfolio. Errunza, Losq, and Padmanabhan (1992) used Non-Linear Seemingly Unrelated Regression (NSUR) to deduce that for emerging markets, the markets are neither fully integrated nor fully segmented.
Mittoo (1992) used CAPM and APT on the Canadian stocks to conclude segmentation for the period 1977–1981 and integration for the period 1982–1986. Brooks et al. (2009) suggested that the Chinese stock market is segmented from the US market, and the government’s restriction on capital flows is prevent-ing the integration of the Chinese market with global peers.
In the Indian context, market integration was stud-ied using price correlation by Mukherjee and Mishra (2007), whose study rejected market integration for the period 1990–2005 using pooled regression tech-nique. Gupta and Guidi (2012) studied the integra-tion of the Indian market and the Asian stock mar-kets and suggested the presence of a short-run rela-tionship between these markets, but the absence of a long-run relationship.
Therefore, the following hypotheses have been developed:
H2a: Indian capital markets are integrated with global markets.
H2b: Indian capital markets are segmented from global markets.
2. METHODOLOGY
2.1. Data
Adjusted monthly closing prices, market capitali-zation, price to book ratio, index closing prices of
3 For the missing observations, where data points were missing for a day with available preceding and succeeding values, the arithmetic mean of the 2 was used as a replacement. Then, the gaps in our time series data were filled using the Stata’s time-series operators.
the S&P BSE 500 Index and the stocks comprising this Index were obtained for 16 years starting from September 2003 to September 2019, from CMIE PROWESS IQ. The book equity to market equity ra-tio was obtained for the end of fiscal year along with market capitalization at the end of September for the sample companies. S&P BSE 500 Index is a free-float broad-based index, which covers 93% of total market capitalization of companies listed on Bombay Stock Exchange. These 500 listed companies in the Indian stock market comprise all major twenty industries of the economy. Only non-financial firms were in-corporated in this analysis, reducing the number of firms from 500 to 398. The exclusion of financial firms can be attributed to differences in financial statements for financial firms. Further, the number of sample firms varied from 222 in 2003 to 362 in 2019 (Table A1) due to non-availability of data for all relevant companies throughout the entire sample period. For analysis, the monthly prices data were converted into percentage monthly return series, which had been calculated, taking into account on-ly the component involving capital gain because of low dividend yields for Indian companies. The risk-free rate of return was derived from T-91 Bill implicit yields, determined by auctions, which were obtained from the Reserve Bank of India Database.
For the test of integration, additional data of the United States, which included market returns, risk-free rate, and their “size” and “value” factors for the period October 2003 – September 2019 were sourced from the Kenneth R French data library.
For Johansen cointegration test, daily stock price indices for S&P BSE 500 and S&P 500 (US) were obtained for 8 years starting from October 2011 to September 20193. The US INR exchange rates were used to convert the price indices for the Indian market obtained in local currency into US dollars.
2.2. Construction of the “size”
and “value” sorted portfolios
In this study, two additional factors, one based on size and the other based on value, were used along with excess returns to the market portfolio. For the “size” factor, at the end of September of year t,

117
Investment Management and Financial Innovations, Volume 17, Issue 2, 2020
http://dx.doi.org/10.21511/imfi.17(2).2020.10
the relevant stocks were sorted based on size (mar-ket capitalization) to determine the BSE median point for market capitalization, based on which the sample stocks were divided into 2 categories: Small (bottom 50 percent) denoted by ‘S’ and Big (top 50 percent) denoted by ‘B’ for a period start-ing from October of year t to September of year t+1. At the same time, for the “value” factor, stocks were categorized into 3 groups: Low (bottom 30 percent) denoted by ‘L’, Medium (30 percent to 70 percent) denoted by ‘M’ and High (top 30 percent) denoted by ‘H’, based on book equity to market equity (BE/ME) ratio at the end of March of year t, using the third and seventh decile breakpoints of the BE/ME ratio4. Using a combination of “size” and “value” factors, sample companies were di-vided into six different portfolios: S/L, S/M, S/H, B/L, B/M, and B/H S/L were formed with the in-tersection of small-cap stocks (low market cap.), but with high BE/ME ratio. All other portfolios were formed similarly. Equally weighted month-ly returns were calculated for each portfolio from October of year t to September of year t+1. These annual portfolios were formed at the end of September to account for the time lag between the time of financial closing and annual reports and board decision publications. Firms, which had been listed for less than two years, were excluded from the analysis. Finally, all these six portfolios were used to calculate the explanatory variables in the study, namely SMB (small minus big) and HML (high minus low).
2.3. Factor calculations
The market factor denoted as the risk premium was computed as an excess of monthly market re-turns (represented by S&P BSE 500 Index monthly returns) over risk-free monthly rate of return. SMB (small minus big), used as a proxy for size effect was obtained for each month of sample period us-ing the difference between the equally-weighted average return of three portfolios comprising the small stocks over the equally-weighted average return of the three portfolios comprising the big stocks. This factor was devoid of BE/ME effects. Similarly, the HML (high minus low), used as a value proxy was calculated as the excess of equal-ly-weighted average returns of two high BE/ME
4 Based on procedure listed on Kenneth R French data library.
stock portfolios over the equally weighted mean returns of stocks with low book to market equity ratio for each month. This component of the mod-el was calculated to be free of size effect.
2.4. Fama-French model estimation
for the Indian stock market
Monthly excess mean returns for all the six portfo-lios were estimated. Finally, the excess returns on the portfolios were regressed using Fama-French three-factor time series regression estimation as follows:
( ),
it ft i mt ft
i t i t it
R R R R
SMB HML e
α β
σ τ
− = + − +
+ + + (1)
[ ]1, 2 6 and 1, 2 192 ,i t= =
where it ftR R− is the excess return on portfolio i
for month ,t mt ftR R− is the excess market return
for month ,t tSMB is the size premium in month ,t tHML is the value premium for month ,t α
is the excess mean return unexplained by three factors, and ,iβ iσ and iτ are sensitivities of the portfolio returns to “market” factor, “size” factor, and “value” factor, respectively, on portfolio .i
Obtaining statistically significant results for val-ues of the slope coefficients of three above factors would demonstrate that the respective factors ex-plain cross-sectional variations in the portfolio returns. By adding and eliminating one of the ex-planatory variables at a time, the test variants of this model were obtained, and the obtained values of the adjusted R2 were compared with each other. Ordinary least squares method of estimation was used for the analysis of this study.
2.5. Test of market integration using
the Fama-French model
Following the test procedure used by Brooks et al. (2009) in the Chinese market to test integration vs segmentation and Beaulieu, Gagnon, and Khalaf (2009) to test integration in North American mar-kets, the previously formed six portfolios were used as test assets.
118
Investment Management and Financial Innovations, Volume 17, Issue 2, 2020
http://dx.doi.org/10.21511/imfi.17(2).2020.10
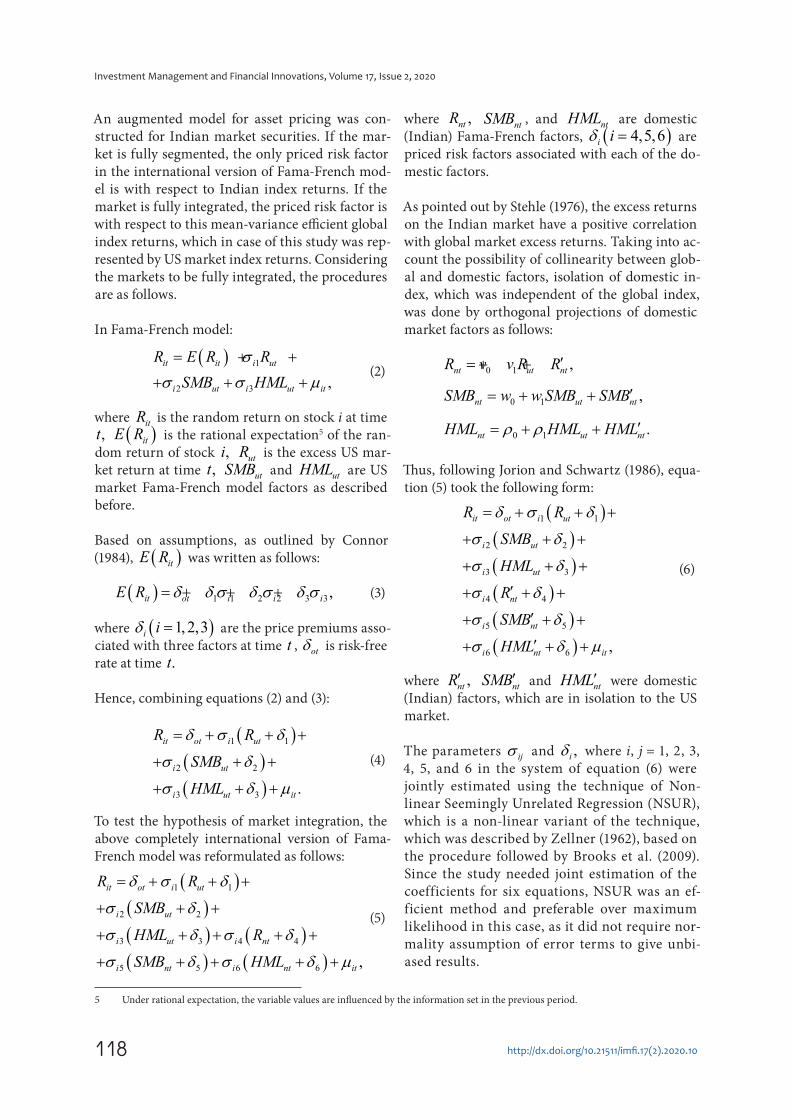
An augmented model for asset pricing was con-structed for Indian market securities. If the mar-ket is fully segmented, the only priced risk factor in the international version of Fama-French mod-el is with respect to Indian index returns. If the market is fully integrated, the priced risk factor is with respect to this mean-variance efficient global index returns, which in case of this study was rep-resented by US market index returns. Considering the markets to be fully integrated, the procedures are as follows.
In Fama-French model:
( ) 1
2 3,
it it i ut
i ut i ut it
R E R R
SMB HML
σσ σ µ= + +
+ + + (2)
where itR is the random return on stock i at time ,t ( )itE R is the rational expectation5 of the ran-
dom return of stock ,i utR is the excess US mar-ket return at time ,t utSMB and utHML are US market Fama-French model factors as described before.
Based on assumptions, as outlined by Connor (1984), ( )itE R was written as follows:
( ) 1 1 2 2 3 3,it ot i i iE R δ δ σ δ σ δ σ= + + + (3)
where ( )1,2,3i iδ = are the price premiums asso-ciated with three factors at time t , otδ is risk-free rate at time .t
Hence, combining equations (2) and (3):
( )( )( )
1 1
2 2
3 3.
it ot i ut
i ut
i ut it
R R
SMB
HML
δ σ δ
σ δ
σ δ µ
= + + +
+ + +
+ + +
(4)
To test the hypothesis of market integration, the above completely international version of Fama-French model was reformulated as follows:
( )( )( ) ( )( ) ( )
1 1
2 2
3 3 4 4
5 5 6 6,
it ot i ut
i ut
i ut i nt
i nt i nt it
R R
SMB
HML R
SMB HML
δ σ δ
σ δ
σ δ σ δ
σ δ σ δ µ
= + + +
+ + +
+ + + + +
+ + + + +
(5)
5 Under rational expectation, the variable values are influenced by the information set in the previous period.
where ,ntR ntSMB , and ntHML are domestic
(Indian) Fama-French factors, ( )4,5,6i iδ = are priced risk factors associated with each of the do-mestic factors.
As pointed out by Stehle (1976), the excess returns on the Indian market have a positive correlation with global market excess returns. Taking into ac-count the possibility of collinearity between glob-al and domestic factors, isolation of domestic in-dex, which was independent of the global index, was done by orthogonal projections of domestic market factors as follows:
0 1,nt ut ntR v v R R′= + +
0 1,nt ut ntSMB w w SMB SMB′= + +
0 1.nt ut ntHML HML HMLρ ρ ′= + +
Thus, following Jorion and Schwartz (1986), equa-tion (5) took the following form:
( )( )( )( )( )( )
1 1
2 2
3 3
4 4
5 5
6 6,
it ot i ut
i ut
i ut
i nt
i nt
i nt it
R R
SMB
HML
R
SMB
HML
δ σ δ
σ δ
σ δ
σ δ
σ δ
σ δ µ
= + + +
+ + +
+ + +
′+ + +
′+ + +
′+ + +
(6)
where ,ntR′ ntSMB′ and ntHML′ were domestic (Indian) factors, which are in isolation to the US market.
The parameters ijσ and ,iδ where i, j = 1, 2, 3,
4, 5, and 6 in the system of equation (6) were jointly estimated using the technique of Non-linear Seemingly Unrelated Regression (NSUR), which is a non-linear variant of the technique, which was described by Zellner (1962), based on the procedure followed by Brooks et al. (2009). Since the study needed joint estimation of the coefficients for six equations, NSUR was an ef-ficient method and preferable over maximum likelihood in this case, as it did not require nor-mality assumption of error terms to give unbi-ased results.

119
Investment Management and Financial Innovations, Volume 17, Issue 2, 2020
http://dx.doi.org/10.21511/imfi.17(2).2020.10
2.6. Johansen cointegration test
Johansen cointegration test was also conduct-ed to further support this argument. To proceed with the cointegration test, it was necessary to en-sure that both the time series variables were inte-grated at order one. To do so, the study used the Augmented Dickey-Fuller Unit Root Test on both the time series, the lag length for which was select-ed based on Schwarz Information Criterion. After establishing the series to be I(1), the common lag length for estimation of the Johansen cointegra-tion test was selected based on Akaike Information Criteria, Hannan and Quinn Information Criteria, Swartz-Bayes Criteria, the Final Prediction Error Criteria, all of which suggested it to be 4 days by es-timation of an unrestricted VAR model first. After ascertainment of lag length, the test was conduct-ed, based on a linear deterministic trend (restrict-ing the cointegrating equations to be stationary around constant means) on the stock price indices transformed in their natural logarithmic forms.
3. RESULTS
For the test of the applicability of Fama-French three-factor model in India, the ordinary least squares method was used with the six portfolios as response variables and MKT, SMB, and HML as three explanatory variables. Since the data were time series in nature, the stationarity of data was tested. Other tests like test for multicollinearity, autocorrelation, tests for heteroscedasticity were done to ensure the robustness of results.
3.1. Descriptive statistics
Table A2 represents the descriptive statistics for variables used in the analysis. As evident from the mean results, there existed an inverse relationship between the size of stocks and average returns as the mean returns for the portfolios were increas-ing as the size was decreasing, keeping the value constant. The small stocks supported the results that there exists a strong positive relationship be-tween the average returns and the value of stocks. However, the big stocks failed to establish any such definite relationship as for big stocks, the mean re-
6 P-values of 0.077 and 0.120, respectively.
turn of high-value stock was not maximum. The standard deviations for the excess returns of value stocks were higher in the case of both the small and big stocks, thus, re-establishing the intuitive fact that the value stocks are more volatile than their counterparts.
3.2. Correlation analysis
Table A3 shows the correlation between the ex-planatory variables. As evident from the results, all the explanatory variables were weakly correlat-ed. Hence, having these independent variables in the model did not lead to the origination of the problem of multicollinearity.
3.3. Test of Fama-French model
in India
Firstly, coefficients of CAPM were estimated by taking only the market factor as an independ-ent variable, the results for which are reported in Table 1. These results showed that market factor is by far the most important factor in explaining stock returns. Table 2 includes the results of es-timating Fama-French three-factor model and its variants. On adding “value” factor or “size” factor to this market factor, the adjusted R2 increased and, hence, the two-factor model explained asset returns better than a single factor. It was an in-teresting observation that in general, small stocks had a better adjusted R2 than big stocks on add-ing “size” factor as compared to “value” factor in explanatory variables. This suggested that the size effect is stronger in small stocks. This effect, though present in big stocks, was often overruled by adding “value” factor as stocks, which were bigger in size, showed better adjusted R2 values by adding HML (value) rather than SMB factor (size). The results for the CAPM had a better adjusted R2 value than the variant of Fama-French model hav-ing the combination of the SMB and HML factor as the explanatory variable. This proved that the market factor is the most important in explain-ing excess returns. By adding all three factors to-gether, it appeared that values for adjusted R2 were more than CAPM in all cases, and all factors were statistically significant, except SMB factor in case of B/M & B/H6. These results proved that Fama-

120
Investment Management and Financial Innovations, Volume 17, Issue 2, 2020
http://dx.doi.org/10.21511/imfi.17(2).2020.10
Table 1. Test results for the capital asset pricing model in the Indian stock market
Source: Calculated by the authors based on the data available on Prowess IQ database.
Ordinary least squares estimationDependent
variableα β Adj. R2 F statistic P-value
(F-statistic)
S/L–Rf
0.00950.9800**
0.6350 333.91 0.000(0.0536)
S/M–Rf 0.0120
1.0337**0.7063 460.37 0.000
(0.0481)
S/H–Rf 0.0184
1.2493**0.7317 521.87 0.000
(0.0546)
B/L–Rf 0.0044
0.9015**0.8973 1669.41 0.000
(0.0220)
B/M–Rf 0.0024
1.0200**0.9237 2314.54 0.000
(0.0212)
B/H–Rf 0.0008
1.2607**0.8190 865.21 0.000
(0.0428)
Note: This table presents the results obtained on estimation of CAPM. The values for the coefficients are mentioned along with their standard errors in the parentheses. Significance at 0.1% level is denoted by **. These results have been estimated based on the equation: ( ) .it ft i mt ft itR R R R eα β− = + − +
Table 2. Test results for Fama-French three-factor model in the Indian stock market
Source: Calculated by the authors based on the data available on Prowess IQ database.
Ordinary least squares estimationExplanatory
variables
Dependent
variableα β σ τ Adj. R2
F-statistic Prob (F-stat)
(Rmt
–Rft), SMBt
S/L–Rf
–.00160.8968** 0.9591**
– 0.7842 348.00 0.000(0.0418) (0.0834)
S/M–Rf
0.00130.9539** 0.9184**
– 0.8427 512.73 0.000(0.0357) (0.0713)
S/H–Rf
0.00371.1398** 1.2619**
– 0.9149 1027.73 0.000(0.0312) (0.0623)
B/L–Rf
0.00250.8879** 0.1572**
– 0.9035 894.90 0.000(0.0217) (0.0432)
B/M–Rf
0.00151.0128** 0.0832
– 0.9249 1176.39 0.000(0.0213) (0.0425)
B/H–Rf
–.00091.2473** 0.1540
– 0.8211 439.19 0.000(0.0432) (0.0862)
(Rmt
–Rft), HMLt
S/L–Rf
0.00971.0213**
––0.1596
0.6385 169.67 0.000(0.0592) (0.0989)
S/M–Rf
0.01160.9469**
–0.3353**
0.7267 254.95 0.000(0.0515) (0.0860)
S/H–Rf
0.01761.0610**
–0.7284**
0.8037 392.01 0.000(0.0518) (0.0866)
B/L–Rf
0.00460.9689**
––.2608**
0.9189 1082.66 0.000(0.0217) (0.0363)
B/M–Rf
0.00230.9902**
–0.1154*
0.9268 1210.58 0.000(0.0230) (0.0384)
B/H–Rf
–.00011.0470**
–0.8264**
0.9219 1127.51 0.000(0.0312) (0.0521)

121
Investment Management and Financial Innovations, Volume 17, Issue 2, 2020
http://dx.doi.org/10.21511/imfi.17(2).2020.10
French three-factor model is more pervasive in the Indian context than CAPM and, hence, this model was used in the further study of market integra-tion for the Indian stock market.
3.4. Test of capital market
integration in India
3.4.1. Test of market integration using
Fama-French three-factor model
The estimated premia z values and their stand-ard errors obtained from NSUR method on equa-tion (6) are mentioned in Table 3. In the test of market integration, the study used excess returns for the same six size and value sorted portfoli-os as dependent variables. Independent varia-
bles were US “market”, “size” and “value” factors along with corresponding orthogonalized do-mestic factors. For complete integration, at least one of the US risk premium ( )1 2 3
, ,δ δ δ should be statistically different from zero, and none of the domestic risk premiums must be different from zero ( )4 5 6
, , .δ δ δ In the complete period of 16 years, none of the US factor, as well as the domestic factor, was statistically significant. For integration, one of the US factors should have been significantly priced, whereas none of the domestic factors should have been statistically priced. To gain more insights into these results, the complete sample period was broken into two subparts of 8 years each, i.e., from October 2003 to September 2011 and from October 2011 to September 2019.
Table 2 (cont.). Test results for Fama-French three-factor model in the Indian stock market
Explanatory variables
Dependent
variableα β σ τ Adj. R2
F-statistic Prob (F-stat)
SMBt, HML
t
S/L–Rf
0.0012 –1.1955** 0. 4377*
0.3061 43.14 0.000(0.1489) (0.1248)
S/M–Rf
0.0039 –1.0994** 0.8903**
0.4382 75.48 0.000(0.1340) (0.1123)
S/H–Rf
0.0065 –1.4346** 1.3266**
0.6103 150.54 0.000(0.1326) (0.1111)
B/L–Rf
0.0054 –0.3982* 0.3918**
0.1100 12.80 0.000(0.1307) (0.1095)
B/M–Rf
0.0044 –0.3004 0.7948**
0.2310 29.68 0.000(0.1355) (0.1135)
B/H–Rf
0.0019 –0.3276 1.5436**
0.4708 85.95 0.000(0.1474) (0.1236)
(Rmt
–Rft), SMBt, HML
t
S/L–Rf
–.00160.9533** 0.9768** –0.2244*
0.7929 244.73 0.000(0.0451) (0.0820) (0.0751)
S/M–Rf
0.00120.8845** 0.8966** 0.2757**
0.8567 381.74 0.000(0.0376) (0.0682) (0.0624)
S/H–Rf
0.00360.9767** 1.2106** 0.6481**
0.9726 2258.52 0.000(0.0195) (0.0354) (0.0324)
B/L–Rf
0.00260.9565** 0.1788** –.2726**
0.9272 811.43 0.000(0.0207) (0.0376) (0.0345)
B/M–Rf
0.00150.9850** 0.0745 0.1105*
0.9277 817.35 0.000(0.0230) (0.0418) (0.0383)
B/H–Rf
–.00111.0408** 0.0889 0.8205**
0.9224 758.24 0.000(0.0313) (0.0569) (0.0520)
Note: This table reports the coefficients of Fama-French three-factor model. The standard errors for these estimates are mentioned in the parentheses. Significance at 1% and 0.1% levels are denoted by * and **, respectively. The test variants for the model were estimated by eliminating the explanatory variables in the equation:
( ) .it ft i mt ft i t i t itR R R R SMB HML eα β σ τ− = + − + + +

122
Investment Management and Financial Innovations, Volume 17, Issue 2, 2020
http://dx.doi.org/10.21511/imfi.17(2).2020.10
For the sub-period, October 2003 – September 2011, none of the US factors was statistically signif-icant, whereas the domestic orthogonalized fac-tor ntSMB′ was significant at 5% level. Hence, the integration hypothesis in which at least one US factor is statistically significant, whereas none of the domestic factors is statistically significant, was rejected in favor of market segmentation.
In the sub-period October 2011 – September 2019, again, none of the US factors was statistically sig-nificant, and none of the domestic factors was statistically significant at 5% level of significance. However, ntSMB′ was statistically significant at 10% level, but not at 5% level, suggesting that there is a movement from market segmentation towards market integration in the second sub-period.
3.4.2. Johansen cointegration test
Since the results for the second sub-period were suggestive of weak integration of the Indian and global markets (indicated by US markets), Johansen cointegration test was employed to fur-ther verify these results. The results of the station-arity test in Table A4 suggest that the indicative stock price indices in their natural logarithmic
level are non-stationary series. On the other hand, the two series were stationary in their first differ-ence form, which suggested that the series for the representative indices in the study were integrated at first order.
As shown in the output in Table 4, when the number of cointegrating equations was hypoth-esized to be 0, the study strongly rejected the null hypothesis of no cointegration because the trace statistic at r = 0, 37.4922 exceeded its crit-ical value of 15.41. On the other hand, the trace statistic at r = 1 of 2.5485 was less than the criti-cal value of 3.76; hence, it failed to reject the null hypothesis of at most one integrating equation. Thus, the number of cointegrating equations in the bivariate model of the natural logarithm transformed the Indian and US stock price in-dices estimated to be 1. Hence, in the second sub-period, statistical evidence was found for the cointegration among the two markets.
Thus, the results obtained from Johansen coin-tegration test further supported the results of the augmented Fama-French three-factor model, which suggested a weak integration of the global and Indian stock markets in the second sub-period.
Table 3. Tests of market integration in India (2003–2019)
Source: Calculated by the authors based on the data available on Prowess IQ and Kenneth R French Data Library.
Period δ1
δ2
δ3
δ4
δ5
δ6
October 2003 – September 20190.1700 0.0700 –0.0600 –0.0900 0.7300 0.1000
(0.1084) (0.1404) (0.1670) (0.1041) (0.0207) (0.0311)
October 2003 – September 2011–0.1700 0.0300 –0.4800 0.3900 3.3300* 0.9300
(0.0524) (0.0207) (0.0597) (0.0629) (0.0037) (0.0075)
October 2011 – September 2019–0.3500 –0.3700 –0.6500 0.7200 1.7100 0.6500
(0.0427) (0.0200) (0.0392) (0.0186) (0.0063) (0.0086)
Note: This table contains estimated z values for the risk premia along with the associated standard errors, which are mentioned in the parentheses, δ
1, δ2, δ3: the US risk premia, δ
4, δ
5, δ
6: domestic risk premia. Significance at 5% level is represented by *.
Table 4. Johansen cointegration test resultsSource: Calculated by authors based on the stock price indices for the two countries.
Maximum rank Eigenvalue Trace statistic 5% crit. value LL
None - 37.4922 15.41 15261.487
1 0.01191 2.5485* 3.76 15278.959
2 0.00087 – – 15280.233
Note: This table reports the results obtained from Johansen cointegration test, performed in the second sub-period. The trace statistic has been computed using the eigenvalue in the line below it. * indicates that Johansen multiple-trace test procedure has been used to select the corresponding value of LL: Likelihood.
123
Investment Management and Financial Innovations, Volume 17, Issue 2, 2020
http://dx.doi.org/10.21511/imfi.17(2).2020.10
4. DISCUSSION
Integration is when investors earn the same risk-adjusted expected return on similar financial instruments in different national markets. Risk, which is non-diversifiable in international capital market, demands higher returns, whereas inter-nationally diversifiable risk, not capable of being diversified domestically, does not involve positive premiums (Stehle, 1976). The present study, when compared to the existing literature, yields sim-ilar results as obtained by Mittoo (1992) for the Canadian stock market for the period 1977–1986. This can be a result of reducing or eliminating
many regulatory restrictions in early 1974 such as removal of capital flow restrictions by the United States. However, the findings of this study contra-dict the analysis of Brooks, Iorio, Faff, and Wang (2009), which suggested a complete segmentation of the Chinese and US markets, with no statisti-cal evidence of movement towards the integration between two markets. This hampering in the in-tegration of the markets can be attributed to the control over the capital flows exercised by the Chinese government. The Indian government, on the other hand, is progressively relaxing its capital flow restrictions, though still making attempts to discourage the capital flow instability.
CONCLUSION
The results of this study are consistent with previous empirical studies, which have advocated a su-periority of three-factor model over CAPM. After establishing this superiority, this study showed that using Fama-French three-factor model, it cannot be still inferred that markets are integrated for the entire sample period. This suggests that there still exist barriers to entry and exit, capital outf low restrictions, and some undeveloped markets evidence. The past two decades have seen a remarkable improvement in the financial sector of the country; however, the scope of these reforms and approaches may have to be revisited in the current time period (Bhattacharya & Patel, 2003). In the later sub-period, it could be inferred that there is movement from market segmentation to market integration; however, this movement is slow, and it would take yet another decade or two to support integration on a statistical basis. Indian capital market has increased in both depth and breadth in the last decade. Political stability, various government measures to increase transpar-ency, efficiency by reducing bottlenecks have started to show the results. The implementation of Goods and Services Tax one nation and one tax policy is a serious step to move towards market economy. Merging several banks to make stronger and larger banks are all efforts to make the Indian market ready for integration with global markets.
AUTHOR CONTRIBUTIONS
Conceptualization: Neeraj Sehrawat, Kirtivardhan Singh, Khushi Goyal.Data curation: Khushi Goyal.Formal analysis: Amit Kumar, Kirtivardhan Singh.Investigation: Neeraj Sehrawat, Amit Kumar, Narander Kumar Nigam, Kirtivardhan Singh, Khushi Goyal.Methodology: Neeraj Sehrawat, Amit Kumar, Narander Kumar Nigam, Kirtivardhan Singh, Khushi Goyal.Project administration: Neeraj Sehrawat, Amit Kumar.Supervision: Neeraj Sehrawat, Amit Kumar.Validation: Neeraj Sehrawat, Amit Kumar, Narander Kumar Nigam.Writing – original draft: Neeraj Sehrawat, Kirtivardhan Singh.Writing – review & editing: Amit Kumar, Kirtivardhan Singh, Khushi Goyal.

124
Investment Management and Financial Innovations, Volume 17, Issue 2, 2020
http://dx.doi.org/10.21511/imfi.17(2).2020.10
REFERENCES
1. Adler, M., & Dumas, B. (1983). International portfolio choice and corporation finance. The Journal of Finance, 38(3), 925-984. Retrieved from https://www0.gsb.columbia.edu/mygsb/faculty/research/pubfiles/1713/Adler%20and%20Dumas,%201983.pdf
2. Arshanapalli, B. G., Coggin, T. D., & Doukas, J. (1998). Multifactor Asset Pricing Analysis of International Value Investment Strategies. The Journal of Portfolio Management, 24(4), 10-23. Retrieved from https://jpm.pm-research.com/content/24/4/10
3. Banz, R. W. (1981, March). The relationship between return and market value of common stocks. Journal of Financial Economics, 9(1), 3-18.
4. Bauman, W. S., Conover, C. M., & Miller, R. E. (1999). Investors overreaction in International Stock Markets. Journal of Portfolio Management, 102-111. Retrieved from https://jpm.pm-research.com/content/25/4/102
5. Beaulieu, M. C., Gagnon, M. H., & Khalaf, L. (2009). A cross-section analysis of financial market integration in North America using a four factor model. International Journal of Managerial Finance, 5(3), 248-267. Retrieved from https://www.researchgate.net/publication/227350021_A_cross-section_analysis_of_financial_market_integration_in_North_America_using_a_four_fac-tor_model
6. Bhandari, L. C. (1988, June). Debt/Equity Ratio and Expected Common Stock Returns: Empirical Evidence. The Journal of Finance, 43, 507-528. Retrieved from https://www.jstor.org/stable/2328473?seq=1
7. Bhattacharya, S., & Patel, U. R. (2003, November 15-16). Reform strategies in the indian financial sector. International Monetary Fund and National Council of Applied Economic Research. Retrieved from https://link.springer.com/chap-ter/10.1057/9780230505759_4
8. Black, F. (1972). Capital Market Equilibrium with Restricted Borrowing. The Journal of Business, 45(3), 444-455. Retrieved from http://www.stat.ucla.edu/~nchristo/statistics_c183_c283/fischer_black_trace_out.pdf
9. Blyn, G. (1973). Price Series Correlation as measure of market inytegration. Indian Journal of Agricultural Economics, 28(2), 56-59. Retrieved from https://agecon-search.umn.edu/record/270828
10. Brooks, R., Iorio, A. D., Faff, R., & Wang, Y. (2009, September). Testing the Integration of the US and Chinese Stock Markets in a Fama-French Framework. Journal of Economic Integration, 24(3), 435-454. Retrieved from https://ideas.repec.org/a/ris/integr/0481.html
11. Choi, J. J., & Rajan, M. (1997). A Joint Test of Market Segmentation and Exchange Risk Factor in International Capital Market. Journal of International Business Studies, 28(1), 29-49. Retrieved from https://www.researchgate.net/publication/5222767_A_Joint_Test_of_Market_Segmentation_and_Exchange_Risk_Factor_in_International_Capital_Market
12. Connor, G. (1984). A unified Beta Pricing Theory. Journal of Economic Theory, 34(1), 13-31. https://doi.org/10.1016/0022-0531(84)90159-5
13. Connor, G., & Sehgal, S. (2001). Tests of the Fama and French Model in India. London School of Economics and Political Science, Discussion Paper, 379, 1-23. Retrieved December 29, 2019, from https://pdfs.semanticscholar.org/5c41/54712de4b15b81b7628fe00b9f6aa2d6f50d.pdf
14. Dijk, M. A. (2011). Is Size Dead? A Review of the Size Effect in Equity Returns. Journal of Banking and Finance, 35(12), 3263-3274. https://doi.org/10.1016/j.jbank-fin.2011.05.009
15. Drew, M. E., Naughton, T., & Veeraraghavan, M. (2003). Firm Size, Book-to-Market Equity and
Security Returns: Evidence from
the Shanghai Stock Exchange.
Australian Journal of Management,
28(2), 119-139. Retrieved from
https://www.researchgate.net/
publication/45229148_Firm_Size_
Book-to-Market_Equity_and_Se-
curity_Returns_Evidence_from_
the_Shanghai_Stock_Exchange
16. Emiris, M. (2002). Measuring
capital market integration. BIS
Papers, 12(11, 12). Retrieved from
http://www.bis.org/publ/bppdf/
bispap12k.pdf
17. Eraslan, V. (2013). Fama and
French Three Factor Model:
Evidence from Istanbul Stock
Exchange. Business and Economics
Research Journal, 4(2), 11-22.
Retrieved from https://ideas.repec.
org/a/ris/buecrj/0116.html
18. Errunza, V., Losq, E., &
Padmanabhan, P. (1992). Tests of
integration, mild segmentation
and segmentation hypothesis.
Journal of Banking and Finance,
16(5), 949-972. https://doi.
org/10.1016/0378-4266(92)90034-
W
19. Fama , E., & French, K. R. (1992,
June). The Cross-Section of
Expected Stock Returns. The
Journal of Finance, 47, 427-465.
https://doi.org/10.2307/2329112
20. Fama, E. F., & French, K. R.
(1993). Common risk factors
in the returns on stocks and
bonds. Journal of Financial
Economics, 33(1), 3-56. https://
doi.org/10.1016/0304-
405X(93)90023-5
21. Fama, E., & French, K. (1998).
Value versus Growth: The
International Evidence. The
Journal of Finance, 53(6),
1975-1999. https://doi.
org/10.1111/0022-1082.00080
22. Gaunt, C. (2004). Size and
book to market effects and the
Fama French three factor asset
pricing model: evidence from the
Australian stockmarket. Journal of
Accounting and Finance, 44(1), 27-
44. https://doi.org/10.1111/j.1467-
629x.2004.00100.x

125
Investment Management and Financial Innovations, Volume 17, Issue 2, 2020
http://dx.doi.org/10.21511/imfi.17(2).2020.10
23. Gupta, R., & Guidi, F. (2012). Cointegration relationship and time varying co-movements among Indian and Asian developed stock markets. International Review of Financial Analysis, 21, 10-22. https://doi.org/10.1016/j.irfa.2011.09.001
24. Jensen, M. C., Black, F., & Scholes, M. S. (1972). The Capital Asset Pricing Model: Some Empirical Tests. Praeger Publishing Company. Retrieved from https://ssrn.com/abstract=90
25. Jorion, P., & Schwartz, E. (1986, July). Integration vs. Segmentation in the Canadian Stock Market. The Journal of Finance, 41(3), 603-614. https://doi.org/10.2307/2328489
26. Lakonishok, J., Chan, L. K., & Hamao, Y. (1991). Fundamentals and Stock Returns in Japan. The Journal of Finance, 46(5), 1739-1764. https://doi.org/10.1111/j.1540-6261.1991.tb04642.x
27. Lakonishok, J., Shleifer, A., & Vishny, R. W. (1994). Contrarian Investment, Extrapolation, and Risk. The Journal of Finance, 49(5), 1541-1578. Retrieved from https://www.nber.org/papers/w4360
28. Lintner, J. (1965, Feb). The Valuation of Risk Assets and the Selection of Risky Investments in Stock Portfolios and Capital Budgets. The Journal of Finance, 47(1), 13-37. https://doi.org/10.2307/1924119
29. Menon, R. N., Subha, M. V., & Sagaran, S. (2009). Cointegration of Indian stock markets with other leading stock markets. Studies in Economics and Finance, 26(2), 87-94. https://doi.org/10.1108/10867370910963028
30. Miller, M. H. (1999). The History of Finance. The Journal of Portfolio Management, 25(4), 95-101. https://doi.org/10.3905/jpm.1999.319752
31. Mittoo, U. R. (1992). Additional Evidence on Integration in the Canadian Stock Market. The Journal of Finance, 47, 2035-2054. https://doi.org/10.1111/j.1540-6261.1992.tb04696.x
32. Mohan, R., & Ray, P. (2017). Indian Financial Sector : Structure, Trends and Turns (IMF Working Paper). Retrieved from https://ssrn.com/abstract=2924370
33. Mohanty, P. (2002). Evidence of Size Effect on Stock Returns in India. Vikalpa, 27(3), 27-37. https://doi.org/10.1177/0256090920020304
34. Mukherjee, K., & Mishra, R. (2007). International Stock Market Integration and Its Economic Determinants: A Study of Indian and World Equity Markets. Vikalpa-IIM A, 32(4), 29-44. https://doi.org/10.1177/0256090920070403
35. Nartea, G. V., Ward, B. D., & Djajadikerta, H. (2009). Size, BM, and momentum effects and the robustness of the Fama‐French three‐factor model: Evidence from New Zealand. International Journal of Managerial Finance, 5(2), 179-200. https://doi.org/10.1108/17439130910947895
36. Pratt, P. S. (1967). Relationship between Variability of Past Returns and Levels of Future Returns for Common Stocks 1926–1960. Business Valuation Review, 27(2), 70-78. https://doi.org/10.5791/0882-2875-27.2.70
37. Rajan, R. (2014). Financial Sector Legislative Reforms Committee Report (FSLRC): What to do and when? Mumbai: RBI Monthly Bulletin. Retrieved from https://www.rbi.org.in/SCRIPTS/BS_SpeechesView.aspx?Id=900
38. Rao, C. N. (1998). Capital Asset Pricing Model and Indian Stocks. The ICFAI Journal ofApplied Finance, 4(1), 65-84.
39. Roll, R. (1977). A critique of the asset pricing theory’s tests Part I: On past and potential testability of the theory. Journal of Financial Economics, 4(2), 129-176. https://doi.org/10.1016/0304-405X(77)90009-5
40. Sehgal, S., & Balakrishnan, A. (2013). Robustness of Fama-French Three Factor Model: Further Evidence for Indian Stock Market. Vision: The Journal of Business Perspective, 17(2), 119-127. https://doi.org/10.1177/0972262912483526
41. Sehgal, S., & Tripathi, V. (2006,
March). Sources of Size Effect:
Evidence from Indian Stock
Market. The Icfai Journal of
Applied Finance, 12(3), 18-28.
Retrieved from https://ssrn.com/
abstract=1134665
42. Sharpe, W. F. (1964). Capital
asset prices: a theory of market
equilibrium under conditions
of risk. The Journal of Finance,
19(3), 425-442. https://doi.
org/10.2307/2977928
43. Solnik, B. H. (1974). The
International Pricing of Risk:
An Empirical Investigation
of the World Capital Market
Structure. The Journal of Finance,
29(2), 365-378. https://doi.
org/10.2307/2978808
44. Solnik, B. H. (1974, July-August).
Why Not Diversify Internationally
Rather than Domestically?
Financial Analysts Journal, 30(4),
48-52+54. Retrieved December 29,
2019, from https://www.jstor.org/
stable/4529718
45. Stehle, R. (1976). An Empirical
Test of the Alternative Hypotheses
of National and International
Pricing of Risky Assets. The
Journal of Finance, 32(2), 493-502.
https://doi.org/10.2307/2326782
46. Taneja, Y. P. (2010). Revisiting
Fama French Three-Factor Model
in Indian Stock Market. Business
Analyst, 14(4), 267-274. https://doi.
org/10.1177/097226291001400403
47. Vaidyanathan, R. (1995). Capital
Asset Pricing Model: The Indian
Context. The ICFAI Journal of
Applied Finance, 1(2), 134-154.
48. Wheatley, S. (1988). Some
tests of international equity
integration. Journal of Financial
Economics, 21(2), 177-212.
https://doi.org/10.1016/0304-
405X(88)90060-8
49. Zellner, A. (1962). An Efficient
Method of Estimating Seemingly
Unrelated Regressions and Tests
for Aggregation Bias. Journal of
the American Statistical Association,
57(298), 348-368. https://doi.
org/10.2307/2281644

126
Investment Management and Financial Innovations, Volume 17, Issue 2, 2020
http://dx.doi.org/10.21511/imfi.17(2).2020.10
APPENDIX A
Table A1. Number of firms in each portfolio for each sample year
Source: Developed by the authors based on their analysis.
Year S/L S/M S/H B/L B/M B/H Total2003–2004 15 39 57 52 50 9 222
2004–2005 11 43 61 58 50 8 231
2005–2006 22 49 50 50 51 21 243
2006–2007 16 56 56 61 47 21 257
2007–2008 18 61 61 66 51 23 280
2008–2009 20 54 73 69 63 16 295
2009–2010 22 51 75 66 69 14 297
2010–2011 22 60 70 70 62 21 297
2011–2012 17 65 75 78 60 20 315
2012–2013 23 58 75 71 67 19 313
2013–2014 22 60 79 75 68 18 322
2014–2015 25 66 72 73 65 26 327
2015–2016 27 74 63 72 57 35 328
2016–2017 32 76 64 72 61 40 345
2017–2018 35 80 66 74 64 43 362
2018–2019 42 71 68 67 73 41 362
Mean 23.06 60.19 66.56 67.13 59.88 23.44 299.75
Note: This table depicts the number of companies used in construction of six portfolios: S/L, S/M, S/H, B/L, B/M, and B/H in each year of the sample period. This number varies across each year due to non-availability of the data.
Table A2. Descriptive statistics
Source: Calculated by the authors based on the data available on Prowess IQ database.
Portfolio Mean Median Maximum Minimum Std. deviation Skewness Kurtosis
S/L–Rf
0.01736 0.01205 0.50788 –0.25928 0.08445 0.89125 9.231132
S/M–Rf 0.02028 0.01777 0.42955 –0.30406 0.08452 0.27779 6.414571
S/H–Rf 0.02841 0.03385 0.46045 –0.28303 0.10038 0.27571 4.676709
B/L–Rf 0.01161 0.01483 0.35493 –0.27431 0.06545 0.09123 8.283627
B/M–Rf 0.01062 0.01064 0.36474 –0.30683 0.07299 0.02435 7.042566
B/H–Rf 0.01087 0.0070 0.47555 –0.31736 0.09579 0.46055 6.222202
MKT 0.00797 0.01016 0.33044 –0.27737 0.06879 –0.12257 6.666364
SMB 0.01236 0.01001 0.12533 –0.10399 0.03452 0.14673 3.806634
HML 0.00313 0.00348 0.17953 –0.09696 0.04118 0.78150 4.532985
Note: This table presents the summary statistics for the variables used in the estimation of Fama-French model in this study. S/L–R
f, S/M–R
f, S/H–R
f, B/L–R
f, B/M–R
f , and B/H–R
f: the excess returns for the portfolios S/L, S/M, S/H, B/L, B/M, and B/H,
respectively, over the risk free return, MKT: market risk premium, SMB: size premium, HML: value premium.

127
Investment Management and Financial Innovations, Volume 17, Issue 2, 2020
http://dx.doi.org/10.21511/imfi.17(2).2020.10
Table A3. Measure of correlation between the factor portfolios
Source: Calculated by the authors based on the data available on Prowess IQ database.
Variable MKT SMB HML
MKT 1.0000 – –
SMB 0.1729 1.0000 –
HML 0.4319 0.1391 1.0000
Note: This table depicts the correlation between the explanatory variables used in the estimation of Fama-French three-factor model.
Table A4. Augmented Dickey-Fuller unit root test
Source: Calculated by authors based on the stock price indices for two countries.
Country ADF statisticIn level form (with intercept) First difference (with intercept)
USA–1.9899 –46.1251
(0.2915) (0.0001)*
India–1.6045 –26.1615
(0.4800) (0.0000)*
Note: This table reports the results for ADF unit root test performed on the stock price indices series for the US and Indian stock markets in their natural logarithmic forms. Mac Kinnon’s (1996) one-sided p-values are mentioned in the parantheses below the statistics. * indicates significance at 0.01% level.