Embed Size (px)
Citation preview

Terry M. Button, Ph.D.
Principals of Magnetic Resonance Image Formation

General Signal Localization
• Region of interest is excited with fL.
• Magnetic field is modified in a planned way using gradients.
• Emitted frequency is now dependent on location.
• Signal vs. time is collected, FT provides signal vs. f which is also signal vs. location!

2D FT
• Initial approach will be descriptive and non-mathematical.
• The second approach will be semi-mathematical.

Overview of 2D FT
• Slice selection
• Phase encoding
• Frequency encoding

Slice selection
• Apply a gradient along z• Excite with RF which covers (Bo- ) to (Bo+ )
Bo+
Bo+
Z
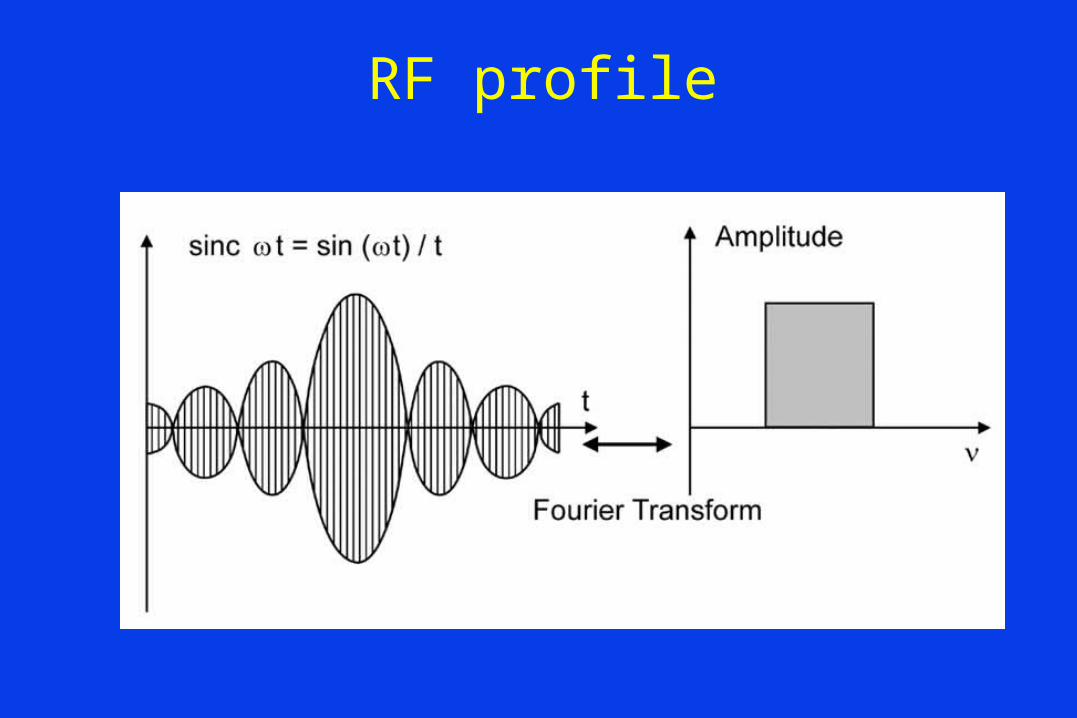
RF profile
I

Slice Thickness is Determined by Bandwidth and Gradient Strength
x
B
fl = (Bo - )
fh = (Bo + )
x2t
T
Slice Selection
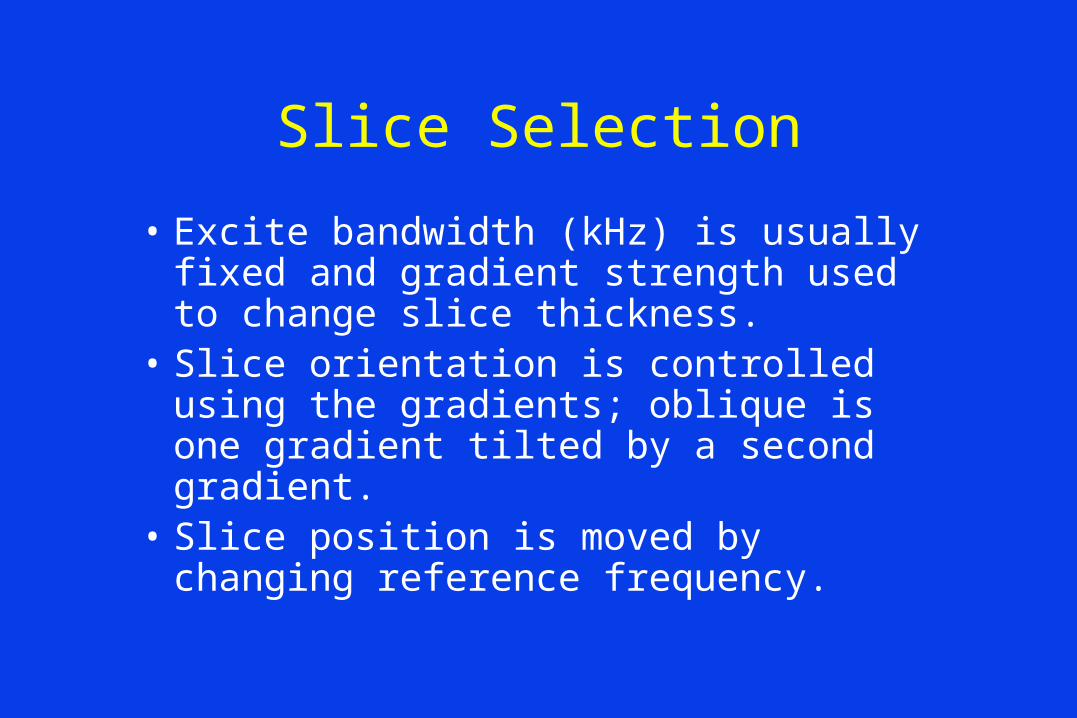
• Excite bandwidth (kHz) is usually fixed and gradient strength used to change slice thickness.
• Slice orientation is controlled using the gradients; oblique is one gradient tilted by a second gradient.
• Slice position is moved by changing reference frequency.
Frequency Encode
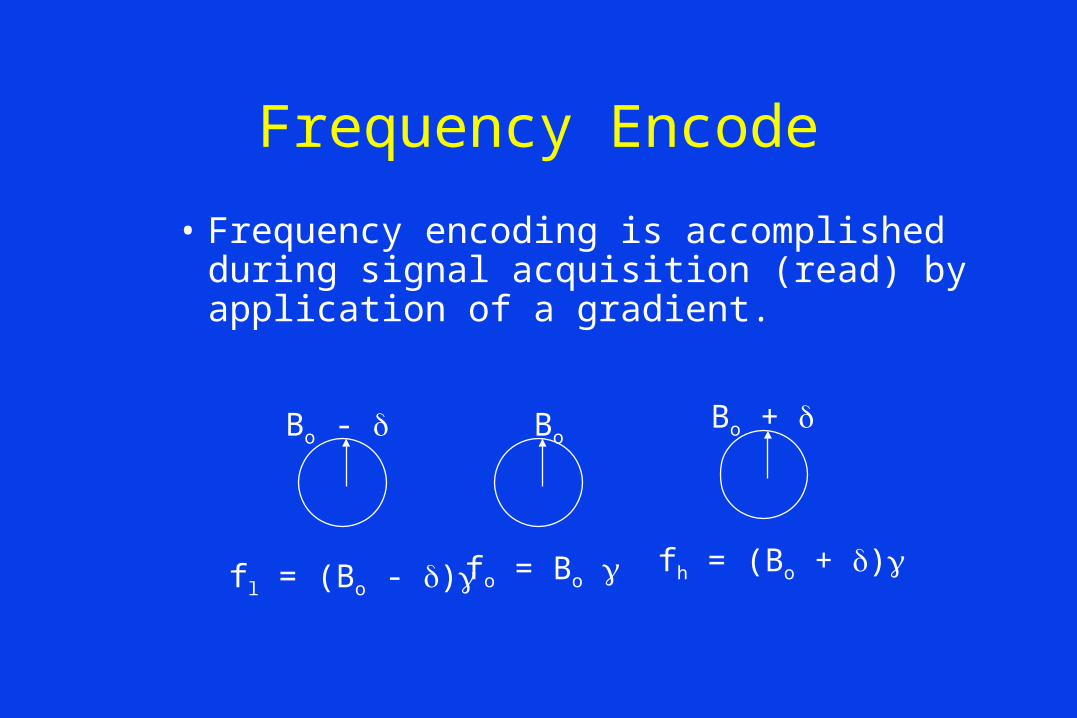
• Frequency encoding is accomplished during signal acquisition (read) by application of a gradient.
Bo - BoBo +
fl = (Bo - ) fo = Bo fh = (Bo + )

Frequency Encoding Gradient Provides a Simple Projection
Bo
S
t
I
f
FFT

Sample Collection
• Signal is sampled N times (128, 256, 512, 1024)
• Sample collection time is t (1-100 sec)– SNR t
• Total collection time T = N t– T< TE
• Bandwidth = 1/ t t = 50 sec, BW = 20 kHz
S
t
FOV
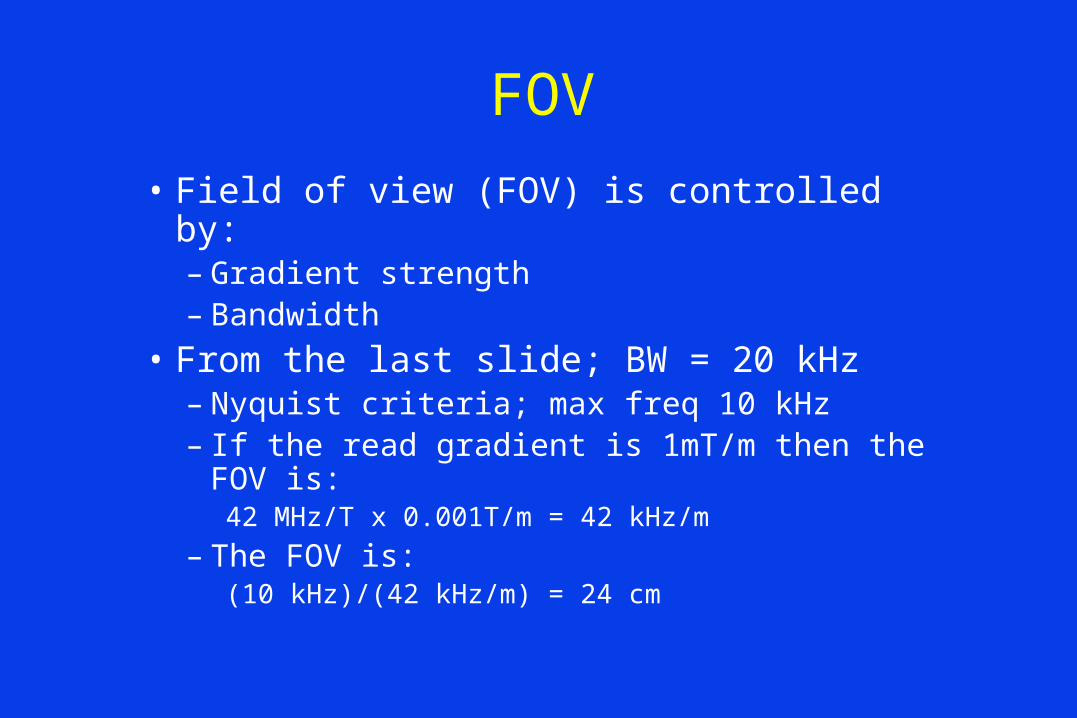
• Field of view (FOV) is controlled by:– Gradient strength– Bandwidth
• From the last slide; BW = 20 kHz– Nyquist criteria; max freq 10 kHz– If the read gradient is 1mT/m then the FOV is:
42 MHz/T x 0.001T/m = 42 kHz/m
– The FOV is:(10 kHz)/(42 kHz/m) = 24 cm

Phase Encode
• Phase encoding is accomplished by applying a gradient for a time .
Bo - Bo Bo +
t = 0
t =
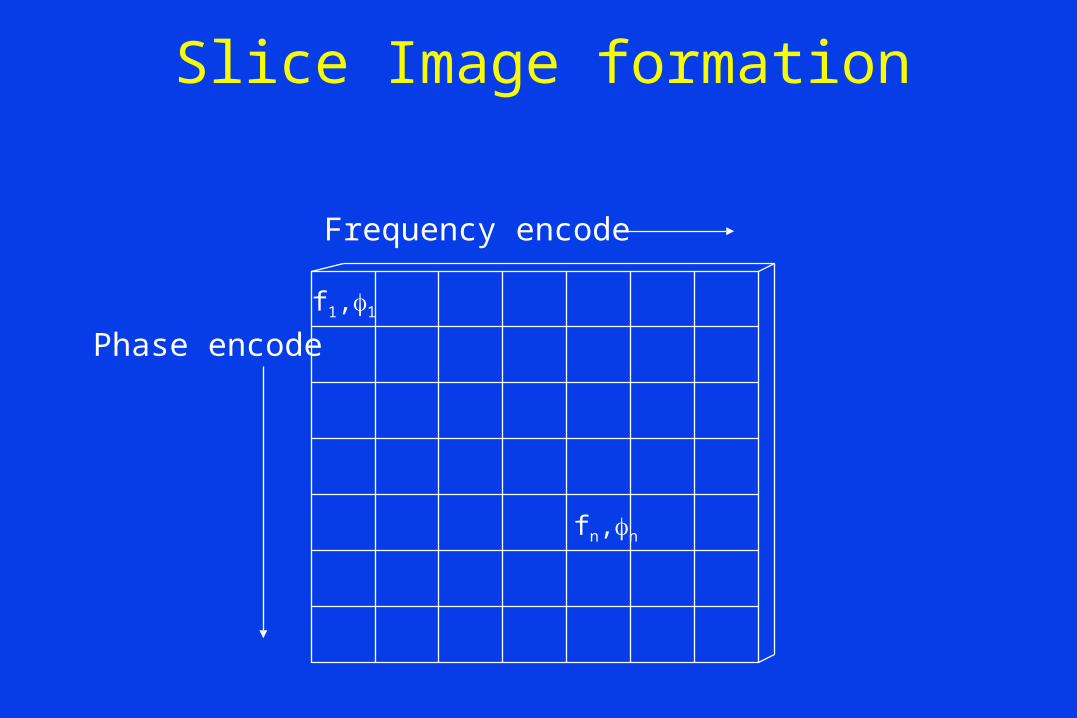
Slice Image formation
Frequency encode
Phase encode
fn,n
f1,1
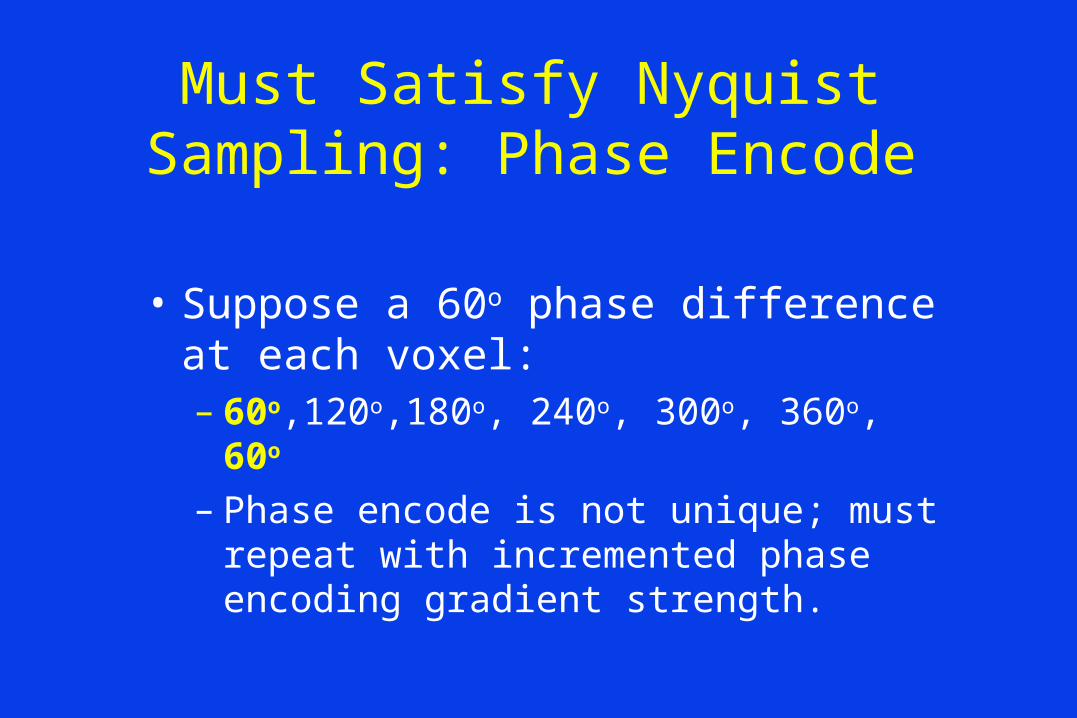
Must Satisfy Nyquist Sampling: Phase Encode
• Suppose a 60o phase difference at each voxel:– 60o,120o,180o, 240o, 300o, 360o, 60o
– Phase encode is not unique; must repeat with incremented phase encoding gradient strength.
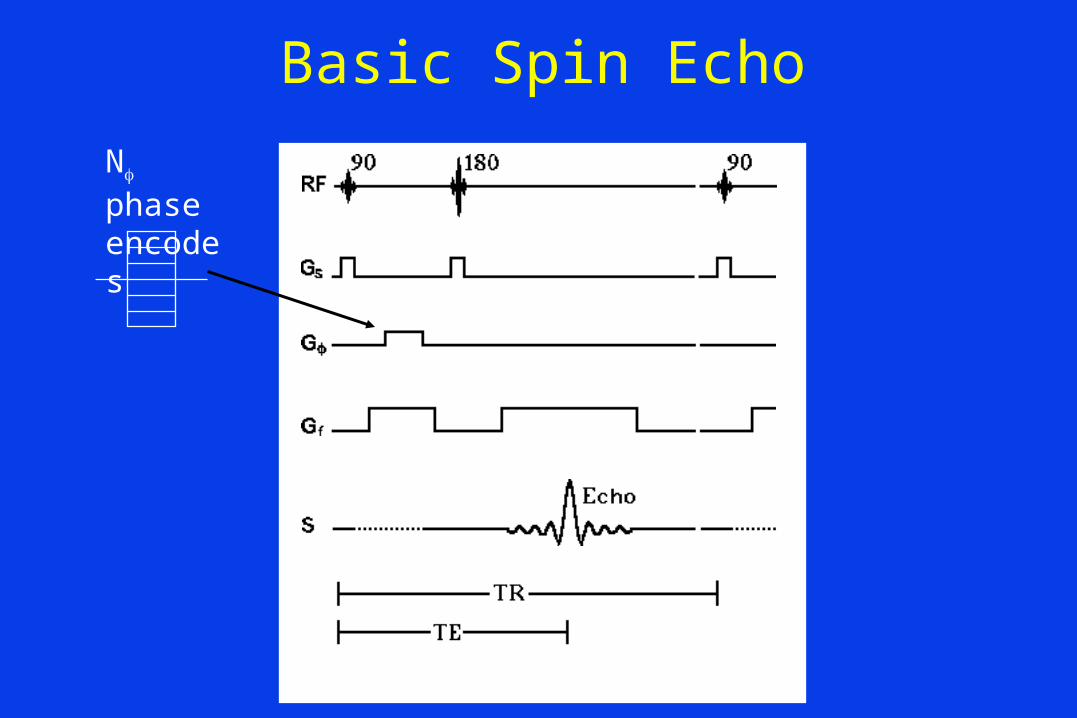
Basic Spin Echo
N phase encodes

Image Acquisition Time
• Suppose TE = 20 msec, TR = 500 msec, N = 256 and only one average is required.
• T = TR x N x Avg
• T = 0.5 sec x 256 x 1 = 128 sec = 2 min 8 sec
• This is the time to make one slice!!
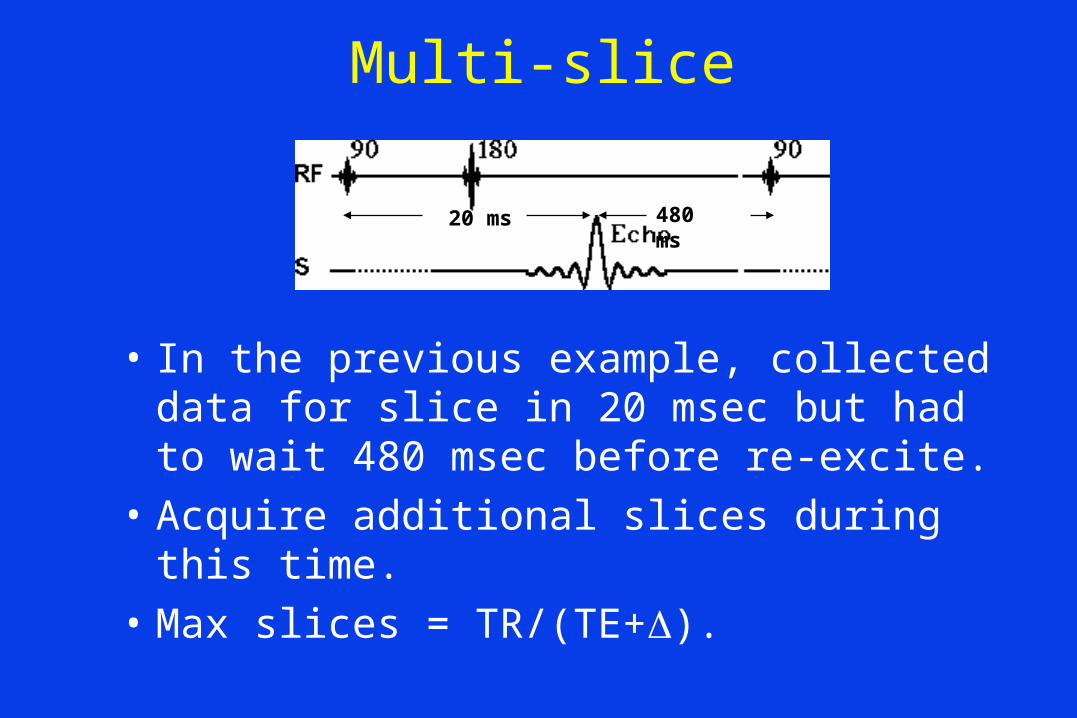
Multi-slice
• In the previous example, collected data for slice in 20 msec but had to wait 480 msec before re-excite.
• Acquire additional slices during this time.
• Max slices = TR/(TE+).
480 ms20 ms
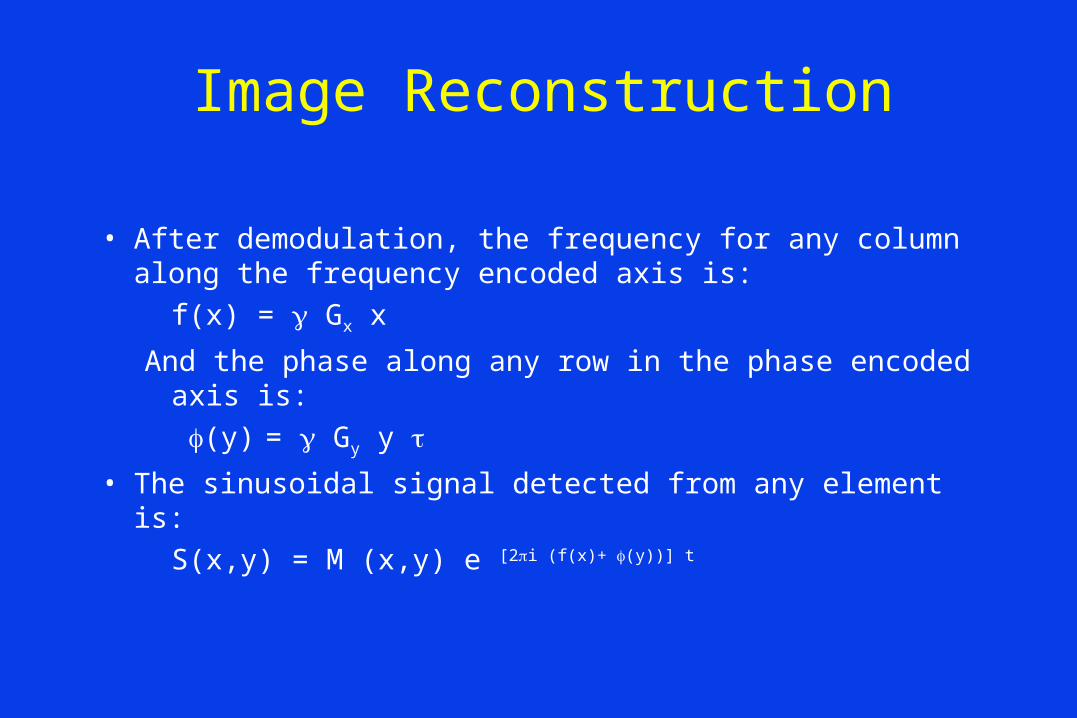
Image Reconstruction
• After demodulation, the frequency for any column along the frequency encoded axis is:
f(x) = Gx x
And the phase along any row in the phase encoded axis is:
(y) = Gy y
• The sinusoidal signal detected from any element is:
S(x,y) = M (x,y) e [2i (f(x)+ (y))] t
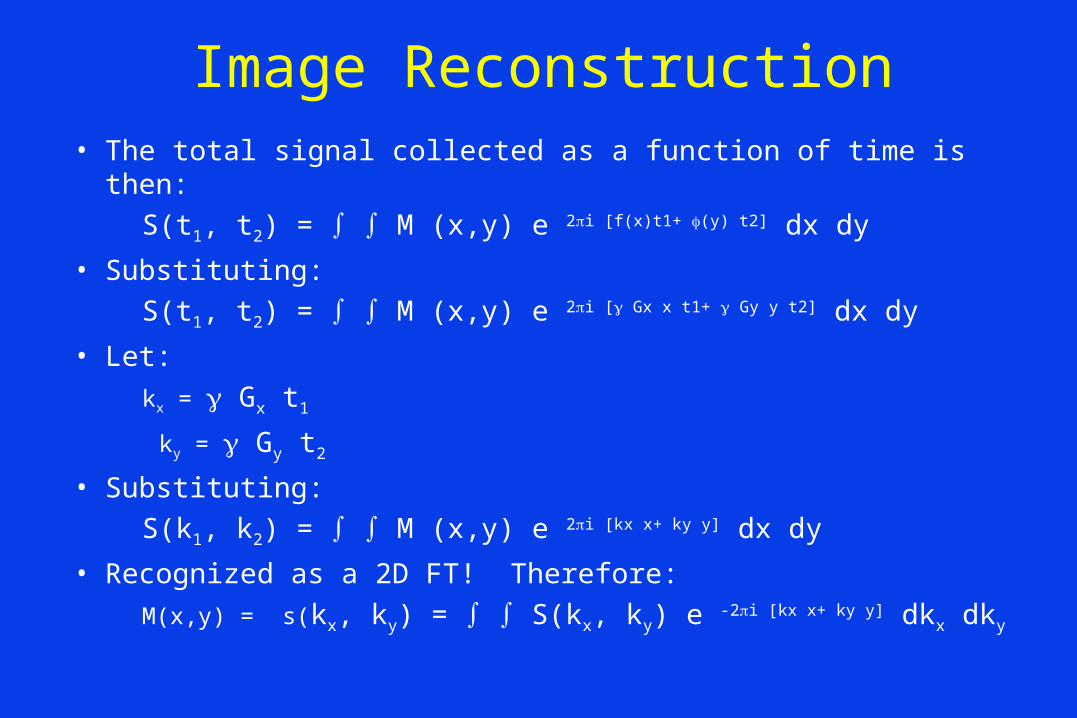
Image Reconstruction• The total signal collected as a function of time is then:
S(t1, t2) = M (x,y) e 2i [f(x)t1+ (y) t2] dx dy
• Substituting:
S(t1, t2) = M (x,y) e 2i [ Gx x t1+ Gy y t2] dx dy
• Let:
kx = Gx t1
ky = Gy t2
• Substituting:
S(k1, k2) = M (x,y) e 2i [kx x+ ky y] dx dy
• Recognized as a 2D FT! Therefore:
M(x,y) = s(kx, ky) = S(kx, ky) e -2i [kx x+ ky y] dkx dky
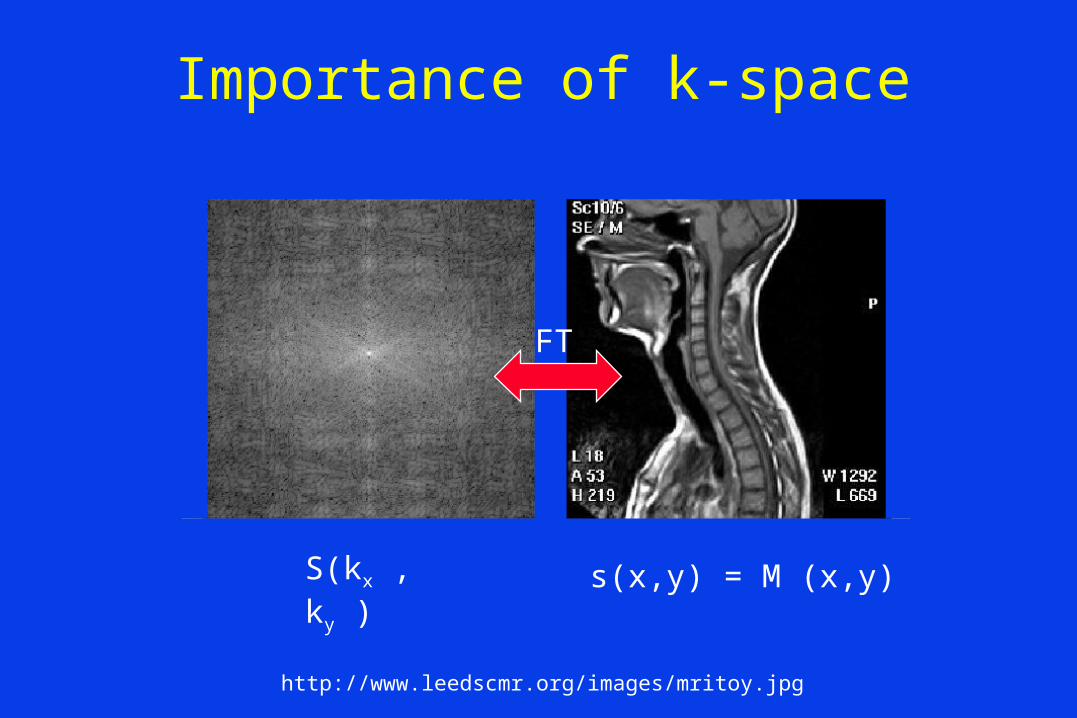
Importance of k-space
FT
http://www.leedscmr.org/images/mritoy.jpg
S(kx ,ky ) s(x,y) = M (x,y)
FT

Filling k-space
Frequency encode
Phase encode
N phase encodes

k-space Contribution to Image Properties
Center of k-spacecontrols contrast
Periphery of k-spacecontrols resolution

http://www.radinfonet.com/cme/mistretta/traveler1.htm#part1
k-space Contribution to Image Properties
Center - contrast
Periphery - resolution
k-space Applications
• Conjugate symmetry– Acquire only half of k-space and employ symmetry.
– Cuts acquisition time in half.
– Reduces SNR by 40%.
• Centric ordering– Acquire center of k-space as contrast arrives to ensure
maximum contrast enhancement.

Spin Echo Contrast
• SE image contrast can be weighted to provide T1, T2 and dependence
• Weighting is adjusted by modifying TE and TR.
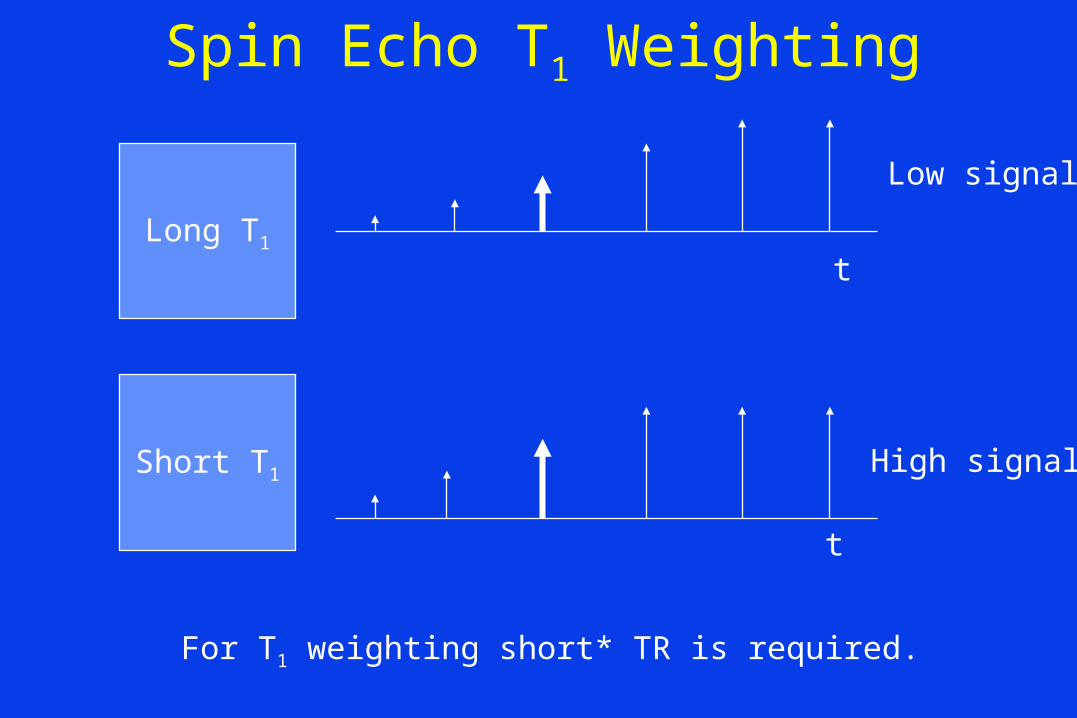
Spin Echo T1 Weighting
Long T1
Short T1
t
t
For T1 weighting short* TR is required.
Low signal
High signal

T1 Contrast
TR
Mz short T1
long T1

Spin Echo T2 Weighting
Long T1
Short T1
For T2 weighting long* TE is required.
High signal
Low signal

T2 Contrast
TE
Mz
short T2
long T2
Spin Echo Contrast
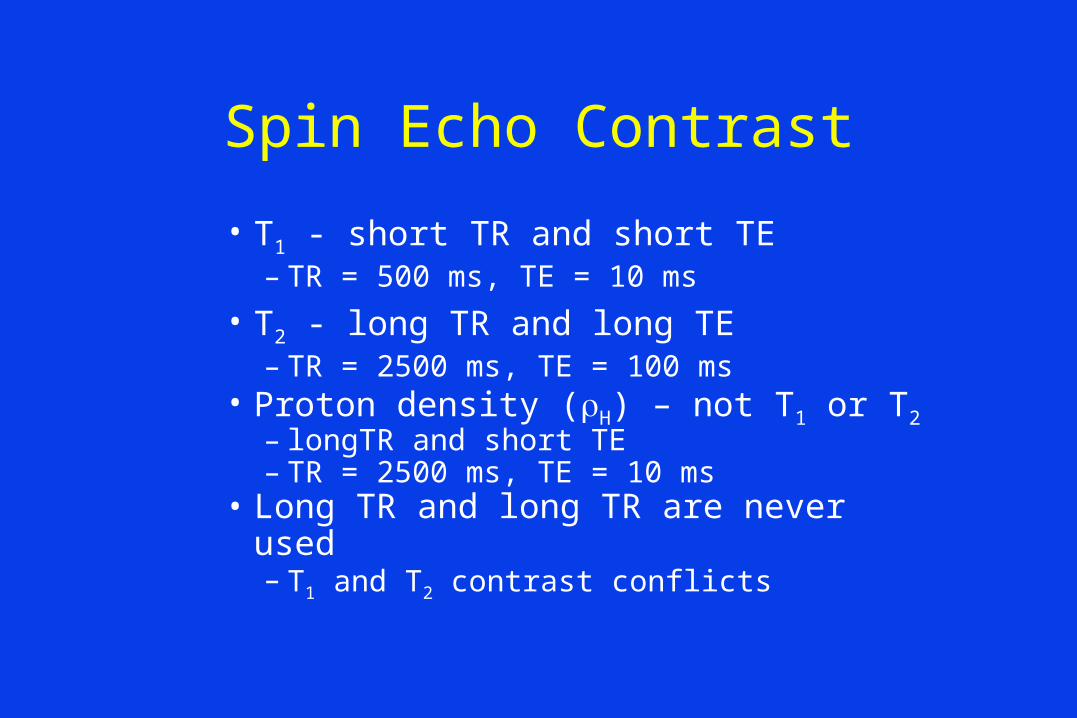
• T1 - short TR and short TE – TR = 500 ms, TE = 10 ms
• T2 - long TR and long TE– TR = 2500 ms, TE = 100 ms
• Proton density (H) – not T1 or T2– longTR and short TE– TR = 2500 ms, TE = 10 ms
• Long TR and long TR are never used– T1 and T2 contrast conflicts

Proton

T1

T2

T1
Proton
T2

Introduction to Contrast Agents

Magnetic Properties of Materials
Weakly repel:water and tissue
Weakly attract:Gd T1 and T2 Reducing agents
Interact strongly:Fe susceptibilityagents (T2*).

Contrast Agents
• Contrast agents can function by altering:– T1 – Paramagnetic agents– T2 – Paramagnetic and Susceptibility agents– T2* – Susceptibility agents– proton density – hormones and diuretics

Paramagnetic
• Molecular tumbling results in reduced T1 and T2.– Shorten T2 => reduced signal– Shorten T1 => increased signal
• Gd chelate– Used as an enhancing agent (T1 weighted
sequence).

Gd Enhanced Brain Malignancy

Superparamagnetic
• Susceptibility agents– Cause local field inhomogeneity and very short
T2*.
– Used to remove signal on T2 or T2* weighted images.

Negative Contrast From Iron Oxide

Factors controlling SNR
• Basic factors– Field strength– Coil tune and match– Magnet shim
• Setup factors:– Coil selection (Filling factor)– Sequence selection (longer TR/shorten TE)
• Sequence variables:– Voxel volume– Averages– Bandwidth– Gap