Embed Size (px)
Citation preview

100

101
VOUCHERING SPECIMENS
VOU
CH
ER
ING
SP
EC
IME
NS
CH
AP
TE
R 1
2Misidentification of specimens is a potential source of error in any fauna survey.
It is difficult for environmental consultants to have knowledge of the identifying characteristics of all the species that they might encounter in a particular survey, and are therefore able to identify all individuals accurately in the field.
For some taxa keys are not available (e.g. small mammals in Western Australia) or are inadequate, or local variations in morphology are such that there may be doubt about the identity of a particular specimen or species (e.g. Ramphotyphlops spp.).
Or, a particular species displays substantial variability in its diagnostic characteristics that it is worth clarifying whether the taxa collected represents one or more, or a new species.
In these circumstances specimens are permanently retained, often by museums, as a reference so that their identity can be determined at a later date. These are referred to as voucher specimens.
The Western Australian Museum requests the following information is provided with all specimens that are vouchered:
• Date collected;• Name of collector and contact details;• Location of collection-site (preferably a GPS
coordinate in degrees, minutes and seconds using the WGS84 or GDA94 datum and the name of closest town);
• Habitat details;• Method of collection (e.g. by hand, aluminium
box trap, etc); and• How it died.
The Western Australian Museum provides detailed information for environmental consultants or government staff on how to preserve specimens of tissue samples, how to label specimens, specimen tags and forms for submitting specimens on its web sites. The Western Australian Museum now charges environmental consultants to have specimens identified.
102

103
SURVEYING TAXONOMIC GROUPS
Different taxonomic groups often require special consideration when planning fauna surveys. We provide a brief discussion of some of the relevant issues for some of these groups below.
13.1 AMPHIBIANS
Suggested appropriate practice
• The focus of an amphibian survey should be on providing a species list for each habitat type and an indication of the geographic distribution and relative abundance of any conservation significant species.
• Minimising the spread of chytrid fungus among individuals is important, and washing and disinfecting equipment and hands after handling frogs is desirable.
• Well timed aural surveys are useful for linking frog species with habitat types.
• For terrestrial species, it is suggested that three nights of spotlighting are undertaken in each of the major suitable habitats.
• Should sampling of arid adapted species be deemed necessary, then spotlighting should be undertaken immediately after a heavy rainfall event in summer. If this is not possible, then netting ponds can provide a reasonably complete species list.
Comment
• For habitats likely to contain terrestrial non-burrowing species, then they can be sampled as part of the sampling for small reptiles and mammals in pit and funnel traps.
• Sampling predominantly arboreal or stream species should be done by spotlighting at night.
SU
RVE
YIN
G T
AXO
NO
MIC
GR
OU
PS
CH
AP
TE
R 1
3

104
Sampling amphibians can be problematic, particularly in arid areas. Parris et al. (1999) suggested that the amount of survey effort required to detect amphibians in a range of habitat types remained largely unaddressed in the literature. Amphibians are often poorly surveyed in generic fauna surveys to support an EcIA and are largely ignored in the assessment process (Thompson, 2006), often because of the extra effort that is required to identify their presence and few are listed as conservation significant.
Amphibian fauna are diverse, and include fauna that are large and obvious, or small and cryptic, aquatic, terrestrial and mostly active, terrestrial and mostly inactive aestivating in a burrow, or arboreal, sedentary and nomadic, and explosive and prolonged breeders. A single search strategy is obviously ineffective in detecting all species in all habitats. The following strategies have been successfully employed:
• Spotlighting and nocturnal searches;• Aural surveys;• Pit and funnel traps;• Tadpole netting and traps;• Automatic tape recorders;• Calls, including playback; and• Searching and digging up burrows.
Aural surveys are a particularly useful strategy for linking frog species with habitat types, as long as these surveys are undertaken when conditions are suitable. This often requires that the local environmental conditions are predictable and surveys can be planned and there are adequate data on the environmental ambient conditions and time when particular species will call.
Individual species call identification is a necessary prerequisite for successful aural surveys.
Spotlighting and nocturnal searches are effective strategies for detecting terrestrial and semi-aquatic frogs, particularly if males are calling (NSW National Parks and Wildlife Service, 2001). Parris et al. (1995) reported that nocturnal stream searching was the most sensitive sampling technique compared with pit traps along drift fences and automatic tape recordings in the forests of south-east Queensland for detecting most species.
Spotlighting and nocturnal searches are an effective strategy for detecting the presence of arid adapted species immediately after heavy rain as these species aestivate during the dry period and come to the surface to feed and breed after rain.
It is difficult to estimate relative abundance of arid adapted species over a wide area as these frogs move and cluster around temporary water bodies to breed and then often disperse to forage over a wide area before again burrowing into the ground. Because of their relative abundance and movement patterns, arid adapted burrowing frogs are also relatively easy to detect by driving tracks and roads at night after heavy rain. However, this can come at a cost if vehicles become bogged.
The NSW National Parks Service (2001) suggested call surveys can be undertaken by:
• Audio strip transects – listening and recording calls along a transect;
• Point call surveys – listening and recording calls from a series of specific locations; and
• Call playback – imitating frog calls in an attempt to get other males to call.
Pit traps are effective for trapping nocturnally active, ground-dwelling frogs that inhabit swamps and other damp vegetated areas and when present, frogs can often be the most abundant taxonomic group caught (Read, 1999).
Figure 13.1.Netting tadpoles

105
However, Parris et al. (1999) reported that pit traps performed poorly in the forest of south-east Queensland, and suggested pit traps were best at capturing small ground or burrowing frogs that were unable to climb out of pit traps. Frogs are also caught in funnel traps. Although not as effective as pit traps, funnel traps catch most arboreal species that can climb out of pit traps, however, frogs dehydrate faster in funnel traps than pit traps with some soil in the bottom.
A barrier drift fence with pit traps located around a temporary pond can be a useful method for estimating relative abundance for some arid adapted species that move to temporary water bodies to breed immediately after heavy rain (e.g. Cyclorana platycephala, Neobatrachus sutor), provided that the fence is in place immediately before heavy rain and after a long dry period.
Netting tadpoles (Figure 13.1) is a relatively easy method for detecting the presence of species whose tadpoles are confined to free water bodies. Not all frog species lay their eggs in free standing water (NSW National Parks and Wildlife Service, 2001). Tadpoles are relatively easily caught with a hand or seine net.
For explosive breeders in arid areas, frogs are often only present around temporary water bodies for a couple of nights and then move off to forage. For these species, catching tadpoles is a useful detection strategy. Heavily discoloured water can often make it difficult to detect the presence of tadpoles in water bodies, indicating that most need to be netted to record all species present.
Anstis (2002) provided keys for many of the tadpoles in eastern parts of Australia; however, no such text is available for species endemic to Western Australia. Newly hatched tadpoles can be difficult to identify (Department of Environment and Climate Change, 2009), so if a positive identification is essential, tadpoles may have to be held in captivity until they are large enough to be identified.
The NSW Department of Environment and Climate Change (2009) suggested that light traps or bait traps can be effective for catching tadpoles and they have an added benefit in that they can be left unattended overnight. This same department recommended one trap for water bodies less than 50m2 and two traps for larger water bodies. When two traps were used, one should be placed in shallow water and the other in the deep water.
Male advertisement calls are an excellent method for identifying the presence of species in a habitat type. However, as only males call, and calling is often restricted to particular seasons or time of the day and ambient temperature, knowledge of when a species calls is important to successfully use this technique (Department of Environment and Climate Change, 2009). Advertisement calls are seldom useful in estimating relative abundance, particularly for arid adapted species.
The Frogs Australia web-site and Tyler et al. (1994) are particularly useful in providing species descriptions, information on advertisement calls, geographic distribution, breeding periods and preferred habitat.
Automatic, pre-timed or call initiated recording of male calls are also useful techniques to determine the presence of species (Parris et al., 1995, Parris, 2002), but these data are generally not very useful in estimating abundance.
The primary limitation with recording calls to detect a species presence is that non-calling species are not detected, and Parris et al. (1995) suggested that effectiveness of these methods is reduced by wind and rain.
For species that are fossorial and mesic (e.g. Heleioporus eyrei) and for many of the arid adapted burrowing species (e.g. Neobatrachus aquilonius), finding burrows and digging up the occupants is a useful technique for detecting species (Figures 13.2-4), although this method requires knowledge of the surface signs of burrows to detect the presence of individuals buried in the ground (Thompson et al., 2005). This method is not suitable for assessing relative abundance, as the surface signs are affected by wind, rain and other contributors to surface soil erosion and some holes contain multiple individuals (Thompson et al., 2005).
Figure 13.2Surface sign of Neobatrachus
aquilonius burrow
Figure 13.3Surface sign
of Notadennichollsi burrow

106
Some terrestrial frogs leave a characteristic track and as a consequence are easily detected (Figure 13.5). For Arenophryne rotunda, their tracks and the associated burrows can be used to compare relative abundance among survey sites because they are very obvious early in the morning on sand dunes.
Overall, for detecting the presence of amphibian species in the forests of south-east Queensland, the most cost effective method is nocturnal stream searches including listening for calls (Parris, 1999). For arid adapted species and to a lesser extent all terrestrial species, listening and spotlighting are the most successful techniques, but success is predicated on being present after rain when the right ambient conditions prevail. Frogs are particularly susceptible to dehydration and will die long before reptiles in pit and funnel traps that are exposed to solar radiation and air movement.
They can also be caught in large numbers in wet-pit traps designed to catch invertebrates, and if these traps use ethylene glycol or formalin, then any frog that is caught will almost certainly die (Thompson and Thompson, 2008e).
13.1.1 Handling frogs
Amphibian chytrid fungus (Batrachochytrium dendrobatidis) has been linked with the decline in frog numbers in multiple locations in Australia. This fungus invades the skin of amphibians, including tadpoles, causing death. The NSW National Parks and Wildlife Service provide guidance on best practice hygiene in handling frogs (www.environment.nsw.gov.au/resources/nature/hyprfrog.pdf). Cleaning and disinfecting equipment, clothing and limiting the movement and contact among frogs are the key elements of the hygiene strategy.
13.4 13.5
Figure 13.4Surface sign ofa Arenophryne rotunda burrow
Figure 13.5Tracks ofArenophryne rotunda on sand dunes

107
13.2 REPTILES
Reptiles have a huge size range, and some can be bold and others wary and cryptic in their behaviour. They occupy a wide variety of habitats (e.g. fossorial, aquatic and arboreal), and some are strictly diurnal while others are nocturnal, and some will shift their foraging times based on local environmental conditions. Some are abundant and ubiquitous in a particular habitat whereas others are rare. As a consequence, rarely will one trapping or detection strategy be adequate to detect all species present or to estimate relative abundance.
13.2.1 Turtles
Suggested appropriate practice
• The focus of a turtle survey should be on providing a species list for each habitat type and an indication of the geographic distribution and relative abundance of any conservation significant species.
• It is suggested that Kuchling’s cathedral trap is used to sample turtles.
• It is suggested that 10 traps be used per habitat type and they should be set for a period of three nights.
• For species that are likely to burrow in the ground and aestivate, surveys should be undertaken immediately after the period of heaviest rainfall.
Comment
• Snorkelling is an effective method for identifying the presence of turtles in a particular waterway if the water is clear and reasonably shallow.
Freshwater turtles are found in a range of habitats including flowing water, billabongs, lakes, ephemeral ponds, swamps and man-made dams and water channels (Georges and Wombey, 1993, Legler and Georges, 1993).
Some species will aestivate (e.g. Pseudemydura umbrina, Chelodina steindachneri, C. rugosa) or migrate overland (e.g. C. steindachneri) when creeks or ponds dry up, while others spend the majority of their life in water and only come on to land to lay their eggs.
Western Australian freshwater turtles can be divided into two groups based on their geographical distribution: central and southern (Chelodina oblonga, C. steindachneri, Pseudemydura umbrina) and tropical (C. burrungandjii, C. rugosa, Elseya dentata, Emydura victoriae, E. australis) (Georges, 2008). Temperate zone species mostly nest in spring, with hatchlings emerging in early summer (Legler and Georges, 1993). These species generally lay their eggs in sand adjacent to the waterways they inhabit. Tropical species are more flexible when they lay their eggs and they generally select nest sites beyond those areas that will be flooded in the wet season (Legler and Georges, 1993). However, Chelodina rugosa lays its eggs in the water or saturated soil and egg development is arrested while immersed in water and commences when eggs become exposed to air (Kennett, 1992, Kennett et al., 1993).
Diet and foraging behaviour affect the propensity for a species to be trapped. Emydura spp. is typically opportunistic and omnivorous, whereas the long-necked chelids are mostly sit-and-wait, ambush, carnivorous predators (Legler and Georges, 1993). Different baits will attract different species. Kennett (1992) suggested that raw heart or liver proved to be the cheapest and most effective bait. Some meat based baits have a high propensity to decay and pollute the waterway so they need to be used with caution in small water bodies.
Turtles can be trapped (Iverson, 1979, de Lathouder, 2007), caught with a net or grasp by hand (Chaney and Smith, 1950, Ream and Ream, 1966). Traps are generally classed as either underwater or basking traps. Underwater traps include hoop traps (Legler, 1960, Iverson, 1979, Kennett, 1992), trammel nets (Vogt, 1980), fyke nets and cathedral traps (Kuchling, 2003). All traps have a section that remains above the water and most use a bait to attract turtles. Basking traps provide a basking opportunity, and when the turtle endeavours to get on to or off the basking platform it is caught in a net suspended in the water (Browne and Hecnar, 2005, Gamble, 2006).
Aquatic freshwater turtles are generally surveyed in Australia using baited hoop traps that have a section of the traps elevated above the water level, often using internal floats or with seine nets dragged across waterways. Kennett (1992) provided a modification to the normal hoop net that improved capture rates and reduced the time spent checking traps. This is a two

108
water to ensure that part of the trap was above the water level. De Lathouder (2007) compared the success of fyke nets and cathedral traps for catching turtles in the Brisbane urban area and reported cathedral traps were significantly more productive when using a bait of mullet and bread. De Lathouder (2007) suggested cathedral traps were most useful when placed in deep water with the entrance resting on the substrate and were best for catching species that preferred deep water and searched for food along the substrate.
Fyke traps were also useful in catching turtles, and particularly so when the wings could be spread across the entire width of a channel (de Lathouder, 2007). It therefore seems apparent that the depth and width of the waterway being sampled are important considerations, and as Ream and Ream (1966) suggested, it is preferable to use a combination of traps, unless it is known that one particular type is most suitable for a targeted species.
De Lathouder (2007) indicated a decline in trapping success with time suggesting that caught individuals learnt from their experience of being caught and tended to subsequently avoid traps. Kuchling’s (2003) cathedral trap is collapsible, has two elongated entrances and can be adapted for any depth of water (Figures 13.6-7). However, the vertical cylindrical netting had a propensity to become twisted when it caught numerous individuals; therefore in this circumstance it needed to be cleared more frequently (e.g. every 12 hrs).
Entry slits to this trap can be adjusted to reduce the possibility of species known to escape traps (e.g. Chelodina spp.) from getting out. Kuchling (2003) used his cathedral traps joined to drift fences in the water to catch the critically endangered Pseudemydura umbrina, as they were being taken by foxes from terrestrial pit traps set along drift fences.
Burgin et al. (1999) reported that eight Fyke nets in a 0.1ha dam set for three days prior to the dam being drained resulted in 35% of the turtles being caught on the first day, 40% by the end of the second day and 73% by the third day. Hatchlings were not caught, but 78% of the males and 81% of the females were caught over the three days.
Traps set to catch turtles can also catch water rats (Hydromys chrysogaster).Water rats are capable of chewing their way out of non-wire netting cages.Where turtle numbers are high, traps should be cleared at least twice daily to avoid overcrowding. In clear water, it is often possible to see and catch turtles by hand while swimming in relatively shallow water.
Where there are only a few species of turtles in a particular area or the turtles are easily identified, it is often unnecessary to actually catch individuals to determine their presence in the waterway. In northern Australia many of the waterways are inhabited by crocodiles, so care is necessary in this area when snorkelling in search of turtles.
chambered trap with an entry section to reach the bait and a holding section that can accommodate a number of animals.
Browne and Hecnar (2005) and Gamble (2006) reported basking traps to be more efficient than hoop traps in catching the North American Northern Map Turtles (Graptemys geographica) and Painted Turtles (Chrysemys picta). Behler (1996) described these turtles as being fond of basking, so it may be that basking traps are useful for those species that bask regularly, but not for other species.
Ream and Ream (1966) reported that hoop traps caught predominantly males and few juveniles, basking traps caught mostly females, and hand captures caught mostly juveniles. Kuchling (2003) suggested that hoop traps were not overly effective in catching highly aquatic turtles that preferred deep water, as most could only be set in relatively shallow
Figure 13.6. Kuchling’s cathedral turtle trap (Photoby G. Kuchling)
Figure 13.7. Float for Kuchling's cathedral turtle trap (Photoby G. Kuchling)
109
13.2.2 Lizards
Suggested appropriate practice
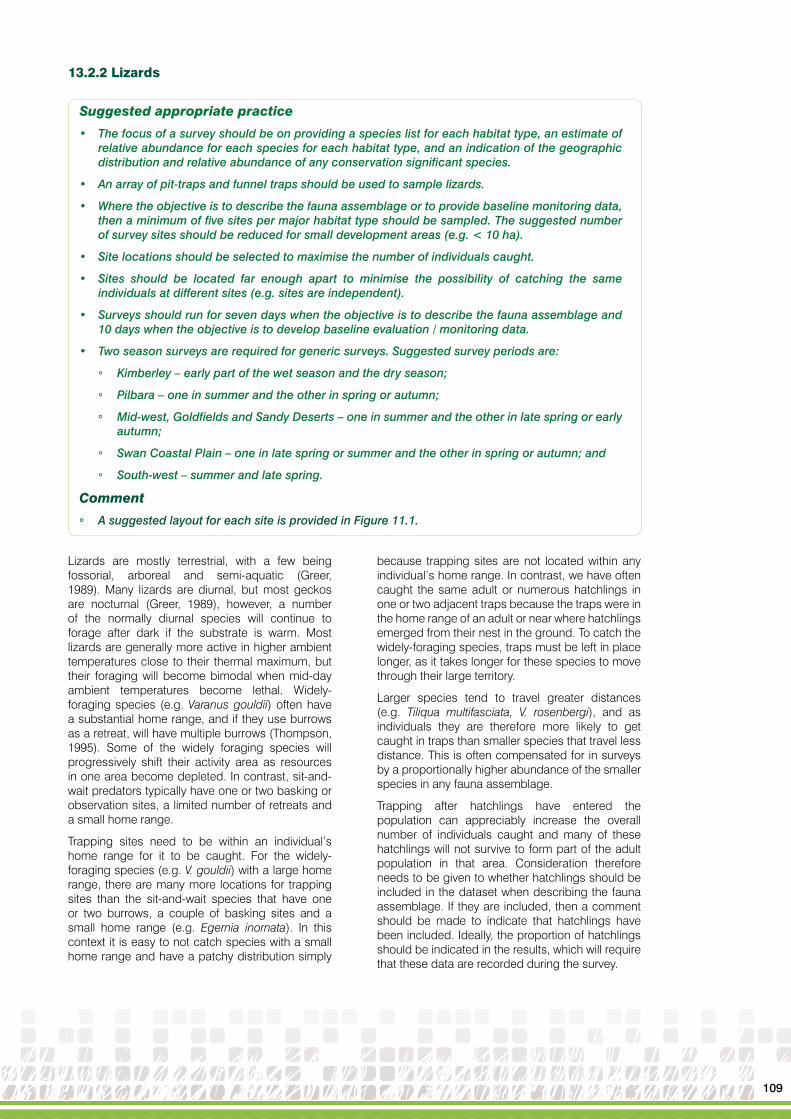
• The focus of a survey should be on providing a species list for each habitat type, an estimate of relative abundance for each species for each habitat type, and an indication of the geographic distribution and relative abundance of any conservation significant species.
• An array of pit-traps and funnel traps should be used to sample lizards.
• Where the objective is to describe the fauna assemblage or to provide baseline monitoring data, then a minimum of five sites per major habitat type should be sampled. The suggested number of survey sites should be reduced for small development areas (e.g. < 10 ha).
• Site locations should be selected to maximise the number of individuals caught.
• Sites should be located far enough apart to minimise the possibility of catching the same individuals at different sites (e.g. sites are independent).
• Surveys should run for seven days when the objective is to describe the fauna assemblage and 10 days when the objective is to develop baseline evaluation / monitoring data.
• Two season surveys are required for generic surveys. Suggested survey periods are:
° Kimberley – early part of the wet season and the dry season;
° Pilbara – one in summer and the other in spring or autumn;
° Mid-west, Goldfields and Sandy Deserts – one in summer and the other in late spring or early autumn;
° Swan Coastal Plain – one in late spring or summer and the other in spring or autumn; and
° South-west – summer and late spring.
Comment
° A suggested layout for each site is provided in Figure 11.1.
Lizards are mostly terrestrial, with a few being fossorial, arboreal and semi-aquatic (Greer, 1989). Many lizards are diurnal, but most geckos are nocturnal (Greer, 1989), however, a number of the normally diurnal species will continue to forage after dark if the substrate is warm. Most lizards are generally more active in higher ambient temperatures close to their thermal maximum, but their foraging will become bimodal when mid-day ambient temperatures become lethal. Widely-foraging species (e.g. Varanus gouldii) often have a substantial home range, and if they use burrows as a retreat, will have multiple burrows (Thompson, 1995). Some of the widely foraging species will progressively shift their activity area as resources in one area become depleted. In contrast, sit-and-wait predators typically have one or two basking or observation sites, a limited number of retreats and a small home range.
Trapping sites need to be within an individual’s home range for it to be caught. For the widely-foraging species (e.g. V. gouldii) with a large home range, there are many more locations for trapping sites than the sit-and-wait species that have one or two burrows, a couple of basking sites and a small home range (e.g. Egernia inornata). In this context it is easy to not catch species with a small home range and have a patchy distribution simply
because trapping sites are not located within any individual’s home range. In contrast, we have often caught the same adult or numerous hatchlings in one or two adjacent traps because the traps were in the home range of an adult or near where hatchlings emerged from their nest in the ground. To catch the widely-foraging species, traps must be left in place longer, as it takes longer for these species to move through their large territory.
Larger species tend to travel greater distances (e.g. Tiliqua multifasciata, V. rosenbergi), and as individuals they are therefore more likely to get caught in traps than smaller species that travel less distance. This is often compensated for in surveys by a proportionally higher abundance of the smaller species in any fauna assemblage.
Trapping after hatchlings have entered the population can appreciably increase the overall number of individuals caught and many of these hatchlings will not survive to form part of the adult population in that area. Consideration therefore needs to be given to whether hatchlings should be included in the dataset when describing the fauna assemblage. If they are included, then a comment should be made to indicate that hatchlings have been included. Ideally, the proportion of hatchlings should be indicated in the results, which will require that these data are recorded during the survey.

110
Many lizards have particular micro-habitat requirements (e.g. Strophurus elderi) and unless the trapping sites are in or at least in close proximity to their micro-habitats these species will go undetected. For example, the semi-aquatic Varanus mertensi spends most of its time either adjacent to or in waterways, and unless these habitats are incorporated in the survey they will go undetected.
Species that are mostly arboreal, particularly individuals from the smaller species that predominantly inhabit one or a few trees, can be particularly difficult to catch in terrestrial traps and as a consequence are often underrepresented in fauna surveys.
As a result, species with specialist or narrow habitat requirements are often inaccurately represented in generic surveys.
Most small and medium-sized terrestrial lizards are generally easily caught in pit and funnel traps. Buckets are more effective than pipes (Thompson et al., 2005b, Thompson and Thompson, 2007b), but some of the larger lizards, such as goannas and the larger dragon lizards, will jump out of 20L buckets. In addition, many of these large lizards will also run over or will move around a pipe pit trap.
Funnel traps are effective for trapping medium-sized goannas and most dragon lizards, but large goannas are generally too big to fit into funnel traps. Medium-sized goannas, such as Varanus tristis, V. gouldii and V. rosenbergi can find their way out of funnel traps, so although they are better than pit traps in catching these reptiles not all animals that enter a trap are there when they are inspected.
Adult Varanus panoptes, V. giganteus and other large lizards are rarely trapped; however, even though they are normally in relatively low densities, they are often visible during the day and can be detected by observant field staff.
A noose on a pole or fibreglass fishing rod is a useful technique for catching large goannas if this is necessary (Thompson, 1992).
There are a number of species that are particularly difficult to catch or detect because of their cryptic behaviour and habitat choice. For example, Varanus pilbarensis and V. glauerti which retreat and forage on rocky outcrops, are generally very wary and seldom venture away from their rock outcrop or escarpment. As it is difficult to trap on rocky outcrops and escarpments, and these lizards quickly move out of sight to avoid detection, their presence often goes undetected.

111
Snakes are nocturnal and diurnal, terrestrial, aquatic and arboreal. Some species are widely distributed and quite plastic in their habitat requirements, while others have very specific habitat requirements.
Ramphotyphlops spp. are widely distributed in Australia, and occur in a variety of habitats (Greer, 1997). Most are nocturnally active above ground and retreat to burrows, under logs and rocks, in termite mounds and in leaf litter during the day. Most eat larvae and pupae of ants (Greer, 1997), so it is likely that they will spend time foraging in ant nests. Blind snakes are caught in pit and funnel traps, but their abundance is probably underrepresented in generic fauna surveys due to their diet, foraging behaviour and they seem to spend most of their time underground. They are infrequently encountered during searches of an area, most probably because of their choice of retreats (e.g. ant nests, crevices, holes in the ground, under rocks and logs).
Pythons are mostly nocturnal, slow moving, have established home ranges and are found in a variety of habitats (Greer, 1997). Most are terrestrial, but a few spend a proportion of their time in trees (e.g. Morelia spilota imbricata; Pearson, 2002) and a few are semi-aquatic (e.g. Liasis mackloti) or are found in close proximity to water courses or waterholes
(e.g. Liasis olivaceus). Foraging behaviour for many pythons involve active searching or waiting in ambush for prey. Diet varies among species but includes reptiles, mammals and birds, and they are capable of devouring prodigious meals with the consequence they can remain inactive and ‘stationary’ for extended periods and are therefore difficult to detect. Nocturnal activity patterns of pythons appear to be influenced by a complex range of non-biotic factors. For example, Brown and Shine (2002) in their 349 night survey of the Adelaide River floodplain in the Northern Territory showed that there was a strong seasonal activity pattern for Liasis mackloti and encounter rates were affected by moonlight, but there was a high level of synchronous variation with other taxa that was not explained by seasonal and weather patterns.
Small pythons are caught in pit traps, but funnel traps are much more productive for medium and larger individuals. Spotlighting is a useful technique in detecting the presence of a species, but because of their relatively low abundance and variable movement and activity patterns, this technique cannot be used to assess relative abundance.
13.2.3 Snakes
Suggested appropriate practice
• The focus of a survey should be on providing a species list for each habitat type, an estimate of relative abundance for each major habitat type, and an indication of the geographic distribution and relative abundance of any conservation significant species.
• An array of pit-traps and funnel traps should be used to sample snakes.
• Where the objective is to describe the fauna assemblage or to provide baseline monitoring data, then a minimum of five sites per major habitat type should be sampled. The suggested number of survey sites should be reduced for small development areas (e.g. < 10 ha).
• Site locations should be selected to maximise the number of individuals caught.
• Sites should be located far enough apart to minimise the possibility of catching the same individuals at different sites (e.g. sites are independent).
• Surveys should run for seven days when the objective is to describe the fauna assemblage and 10 days when the objective is to develop baseline monitoring data.
• Two season surveys are required for generic surveys. Suggested survey periods are:
° Kimberley – early part of the wet season and the dry season;
° Pilbara – one in summer and the other in spring or autumn;
° Mid-west, Goldfields and Sandy Deserts – one in summer and the other in late spring or early autumn;
° Swan Coastal Plain – one in late spring or summer and the other in spring or autumn; and
° South-west – summer and late spring.
Comment
° A suggested layout for each site is provided in Figure 11.1.

112
Western Australian colubrids are in two groups; terrestrial / arboreal and aquatic.
Boiga irregularis is mostly nocturnal and encountered in caves and trees, whereas and Dendrelaphis punctulata is diurnal, arboreal, semi-aquatic and terrestrial (Cogger, 1992, Greer, 1997). Tropidonophis mairii is active during the day and night and is a semi-aquatic freshwater species that is mostly found around lagoons, creeks and swamps (Cogger, 1992). These species are caught in funnel traps, but B. irregularis and T. mairii are probably underrepresented in generic surveys because of their preferred habitat.
The vertical elliptic eye of Australian mangrove snakes indicates that they are predominantly nocturnal, and as the name suggests they are semi-aquatic, but they are mostly detected on mud flats and exposed in areas as the tide recedes (Greer, 1997). Because of their preferred habitat these species are difficult to survey. Spotlighting on mud flats is a possible option.
Elapids range in size from small to large, are terrestrial, arboreal and semi-fossorial, and a few species enter freshwater (Greer, 1997). Greer (1997) suggested that most of the semi-fossorial species belong to Brachyurophis, Neelaps, Vermicella and Simoselaps genera, and the arboreal species to Hoplocephala and Tropidechis genera. A few elapid species are often found around wet and swampy areas (e.g. Notechis scutatus). Some species are relatively sedentary, moving infrequently in search of food (e.g. Acanthophis spp.) while others are wide-ranging, active foragers (e.g. Pseudechis australis). This difference in foraging behaviour affects their propensity to be trapped.
Small elapids are readily caught in pit and funnel traps, and the medium and larger individuals are caught in funnel traps. We have seen large snakes get out of funnel traps, so not all snakes
that enter funnel traps are still there when they are inspected. The less mobile more sedentary species, such as Acanthophis spp., are only infrequently caught in traps, and are probably significantly underrepresented in fauna surveys.
Ambient temperature has a significant influence on activity patterns for elapids and pythons in most parts of Western Australia (authors’ unpubl. data). Most elapids are predominantly diurnal and active in late spring, summer and early autumn in central and southern Western Australia, with emergent times later in the year at higher latitudes, but we have seen Pseudechis australis actively foraging in mid-winter and active at night many hours after sunset in summer in the Pilbara. In the wet-dry tropics, elapid activity appears to increase at the beginning of the wet season and is lowest during the dry season (Greer, 1983). Movement patterns of some pythons (e.g. L. mackloti, L. olivaceus) are affected by breeding behaviour, with males searching large areas for females during the breeding period. Trapping outside the hottest period can result in a significant under representation of snakes in the trapping program in the Pilbara and the Goldfields (Thompson et al., in press) and probably elsewhere in central and southern Western Australia. For example, we caught significantly more elapids and pythons in March than in an identical survey in November in the Pilbara when the March survey period was about 3oC hotter.
There is an obvious danger associated with catching and releasing venomous snakes from traps, particularly funnel traps. The new version of funnel trap with the zipper that goes almost the full length provides field staff greater flexibility and thus safety in removing snakes from these traps. We typically carefully open the zipper, turn the trap on its side and let the snake find its own way to freedom to minimise the chance of being bitten.

113
Western Australia has two species of crocodile; Crocodylus porosus (saltwater crocodile) and C. johnstoni (freshwater crocodile). The diet of hatchling saltwater crocodiles includes small crabs found on the mud banks and in mangroves and other crustaceans on the water’s edge (Webb and Manolis, 1989). As they get larger their diet includes birds, reptiles and mammals and occasionally fish. Freshwater crocodiles eat mostly turtles and fish (Webb and Manolis, 1989) but they also eat amphibians and other reptiles. Both species lay their eggs in a nest on land along rivers and creeks, with C. porosus breeding between October and May and C. johnstoni between July and September (Webb and Manolis, 1989).
Two methods are used to survey crocodiles; aerial counts and spotlighting (Webb and Manolis, 1989). Webb and Manolis (1989) suggested the standard survey procedure was spotlighting at night but helicopter surveys were cheaper, faster and more efficient if done on a large scale.
Observed numbers seem to vary seasonally, and not all individuals are seen during a given spotlighting survey (authors’ unpubl. data). Factors that influence the survey results include the wariness of different individuals, terrain on the banks, size of the river or creek being surveyed.
Some crocodiles will dive when they hear a boat and are not detected, those hidden in the mangroves or bank vegetation may not be detected, and it is difficult to detect individuals from a distance in narrow winding creeks (Webb and Manolis, 1989). Surveys are also undertaken of nests, and again this is often done using helicopters because of the terrain and vegetation in which the nests are located.
As for all surveys, there are both temporal and spatial variations in the abundance of crocodiles at any particular location, and as all individuals are seldom detected in a single survey, multiple surveys are required to accurately estimate the population.
13.2.4 Crocodiles
Suggested appropriate practice
• The focus of crocodile surveys should be to identify a species presence and its geographic distribution within the proposed development area.
• Nocturnal searches to detect eye shine should be used either along the banks in a vehicle or in the main water body in a boat depending on site conditions.

114
13.3 NON-VOLANT MAMMALS
Suggested appropriate practice
• The focus of mammalian surveys should be on providing a species list for each habitat type, an estimate of relative abundance for small and medium sized mammals for each major habitat type, and an indication of the geographic distribution and relative abundance of any conservation significant species.
• An array of pit-traps and aluminium box traps should be used to sample small mammals.
• Where the objective is to describe the fauna assemblage or to provide baseline monitoring data, then a minimum of five sites per major habitat type should be sampled. The suggested number of survey sites should be reduced for small development areas (e.g. < 10 ha).
• Site locations should be selected to maximise the number of individuals caught.
• Sites should be located far enough apart to minimise the possibility of catching the same individuals at different sites (e.g. sites are independent).
• Surveys should run for seven days to describe the fauna assemblage and 10 days when the objective is to develop baseline monitoring data.
• Two surveys should be undertaken, with at least one in the warmer months in southern Western Australia and in the wet and the dry seasons in the wet-dry tropics.
• Where there is a possibility of catching native medium-sized mammals (e.g. Dasyurus geoffroii, Isoodon obesulus), then wire cage traps should be used in adequate numbers to maximise the chance of recording them (~500 trap-nights per habitat type). Where possible, trapping should be undertaken outside the period when females are nursing young.
• Large mammal observations should be recorded during spotlighting, when clearing traps, during avian searches and opportunistically.
• Species-specific searches will be required to identify the presence and relative abundance of conservation significant medium and large mammals that are unlikely to be trapped (e.g. Petrogale lateralis, Pseudocheirus occidentalis) and species-specific trapping / search programs will be required if arboreal conservation significant species are likely to be in the area (e.g. Phascogale calura, P. tapoatafa).
• Two season surveys are required for generic surveys. Suggested survey periods are:
° Kimberley – early part of the wet season and in the dry season;
° Pilbara – one in the warmer months;
° Mid-west, Goldfields and Sandy Deserts – one in the warmer months;
° Swan Coastal Plain – one in the warmer months; and
° South-west – one in the warmer months.

115
Mammals can be divided into three groups when devising fauna survey protocols based on the trap type and size. Small mammals such as Sminthopsis spp., Antechinus spp., Cercartetus spp., Mus musculus, Pseudomys spp., Rattus spp., Dasycercus spp. and Notomys spp. are effectively caught in pit traps (Bennett et al., 1989, Thompson et al., 2005b, Thompson and Thompson, 2007b) or small aluminium box traps (Mawbey, 1989, Tasker and Dickman, 2002, Cunningham et al., 2005) or variations on this theme (Sealander and James, 1958). The larger of these species (e.g. Rattus spp. Dasycercus spp. and Notomys spp.) will often jump out of pit traps, particularly those with a wide mouth such as 20L buckets. Aluminium box traps can be used in both a terrestrial and arboreal environment (Meggs et al., 1991, Winning and King, 2008).
Medium size mammals (e.g. Isoodon spp., Trichosurus spp. and Dasyurus spp.) are mostly caught in the wire cage traps. Large mammals (e.g. Canis lupus, Petrogale spp. and Macropus spp.) are rarely trapped in EcIA surveys and observational techniques are used to determine their presence and abundance (Rudran et al., 1996). Spotlighting, sand pads, infrared night photography and scat collections are all useful in determining the presence of these larger mammals (Southwell, 1989, Catling et al., 1997), but most of these techniques are inadequate for determining abundance, except for scats which have been widely used as the basis for estimates of relative abundance (Southwell, 1989, Woolnough, 2005).
However, as estimates of abundance or population size for these larger mammals are rarely required to support an EcIA, these observational techniques are generally adequate. Mark-recapture studies for these large mammals are rarely used to estimate density because they are generally too labour intensive and costly (Arnold and Maller, 1987).
For the small mammals, traps are mostly baited with a mixture of sardines (or bacon), rolled oats and peanut butter. Bait is made into balls about 20-30mm in diameter (varies with the size of the trap) and placed in the back of the trap. Traps should be provided with adequate shade.
For large mammals, three methods of sampling the population are used: point counts, area counts and transect counts (Southwell, 1989). Rudran et al. (1996) suggested counts based on forcing animals to leave the area can also be useful for some large mammals, but this is a protocol that is not generally used for surveys to support EcIA. Point counts have been infrequently used as a survey tool, but have been used to monitor area utilisation (Southwell, 1989). They can be based on observation or the use of a mechanical counting device (Naarding 1979). Area counts are considered relatively inefficient because the sampling effort is concentrated into a small area, and many of the species are gregarious and there is a high level of spatial variability and travel time among sites is often high. Transects (e.g. strip and line searches) are more popular in surveys of large mammals (Southwell, 1989, Rudran et al., 1996, Laws and Goldizen, 2003).

116
Transect searches can be undertaken by foot, in vehicles or from aircraft. An aerial survey for macropods, camels, horses and donkeys is a well established technique. Southwell (1989) suggested the following issues should be considered in the design of macropod surveys and these guidelines probably apply to surveys for all large mammals:
• Randomly allocated transects;• Aerial surveys are most often undertaken in an
east-west direction early in the morning or late in the afternoon to maximise visibility relative to the position of the sun;
• Sampling should be stratified based on habitat type; and
• Factors affecting animal detectability (e.g. vegetation, typography, weather).
Road and track surveys are almost always non-random, but can be cost effective (Southwell, 1989). In addition, there is also the potential bias associated with different resources being available on the road side verge (e.g. higher density of grass due to road run-off) that may compound any other biases associated with a non-random transect.
Southgate et al. (2005) used random plots for detecting tracks, fixed transects using all terrain vehicles (ATVs) for detecting tracks and aerial (i.e. helicopter) surveys searching for tracks and diggings to estimate Bilby (Macrotis lagotis) abundance in large areas of the Tanami Desert.
Of these approaches, aerial transects were deemed optimal for sampling most substrate types, and the fixed transect approach the least useful.
Rudran et al. (1996) suggested that when using transects to sample large mammal populations, observer training and experience, and speed of movement along transects were important pre-requisites for obtaining reliable estimates. In addition, employing strategies that reduced the possibilities of animals fleeing before being detected and reducing observer fatigue were important. If random transects were used, particularly over rough terrain, then consideration must be given to how distances and angles to animals could be accurately determined, if this information was to be used in calculating measures of density. Where animals grouped in mobs or herds, or formed clusters, then counting strategies should be predetermined and standardised (Rudran et al., 1996).
Kinnear et al. (1988) provided details of a risk-free soft trap design (i.e. Bromilow trap) that is useful for trapping most macropods excluding kangaroos.
Surveying for species that do not take the ‘universal bait’ or have a specialised diet (e.g. Myrmecobius fasciatus, Tachyglossus aculeatus) can be problematic. In these circumstances, a less optimal approach will be required. For example, Vieira et al. (2007) used 17 driving censuses totalling 500km to survey for the presence of the reintroduced numbat in the Scotia Sanctuary, NSW.
117
13.4 BATS
Suggested appropriate practice
• The focus of bat surveys should be;
° on identifying species in each of the major habitat types, and
° on identifying colonies and roosts.
• Because microbats use different foraging strategies in different aspects of the habitats, multiple sites or locations for bat traps or bat detectors should be used in each habitat type.
• Anabat recorders should be left operational all night in a variety of appropriate locations (e.g. over still water, flyways, near potential roosts sites) in each of the major fauna habitats for the equivalent of four nights per habitat type (e.g. two ultrasonic recorders by two nights).
• Anabat recorders should be elevated and placed at 45o and facing down tracks or away from dense vegetation.
• All Anabat recordings should be analysed by a person with appropriate training and experience.
• When traps or nets are used, the locations should be altered each night to avoid the learned avoidance response.
• Captured lactating female bats should be released as soon as possible and not held during the day.
• All possible locations for maternity sites and large colonies of bats should be investigated. These can often be detected by large numbers of bats leaving sites (e.g. caves, rock over-hangs, mine shafts) on or after dusk, or searching mine shafts and caves.
• Species lists should be provided per habitat type, and specific habitats or locations known to support large numbers of bats should be reported.
• Two season surveys are required. In central and southern Western Australia, one survey should be undertaken in the warmer months. For the wet-dry tropics one survey should be undertaken near the beginning of the wet season and the other in the dry season.
• If using any capture technique, then the handler should be vaccinated against rabies to protect against Lyssa virus.
Comments
• De Oliveira’s (1998) book is recommended reading for anyone using an ultrasonic detector to record echolocation calls.
Australian bats retreat to a variety of diurnal habitats, including caves, rock overhangs, mine shafts, trees and tree hollows and man-made structures. Almost all are nocturnal or crepuscular, some are large (e.g. Megachiroptera) but most are small (e.g. Microchiroptera). Microbats have a wingspan of about 30cm, are insectivorous and navigate using echolocation, whereas megabats have a diet of fruit, blossom and nectar (Churchill, 2008). The Ghost Bat (Macroderma gigas) is the only species considered to be strictly carnivorous (Richards et al., 2008).
McKenzie et al. (2002) demonstrated a link between anatomical parameters, flight performance, foraging niches and echolocation parameters in desert bat fauna suggesting that species could be categorised based on foraging strategy and preferred microhabitat use.
De Oliveira (1998) used this same approach to categorise flight behaviour and microhabitat use for microbats in forest ecosystems. These data indicate that microbats use different foraging strategies in different aspects of the habitat, and single site or single location bat traps or bat detectors are unlikely to detect all species in a habitat.
De Oliveira (1998) and Churchill (2008) said that hand held nets, mist nets (Figure 13.8), harp traps (Figure 13.9), trip lines, ultrasonic detectors (Figure 13.10) and searching potential roosts sites were the techniques commonly used to detect and record bats. Hand nets were useful in confined spaces (e.g. caves, mine shafts, buildings); and Churchill (2008) suggested some bats could be encouraged to swoop a pebble thrown in the air and could be netted in the process. Care needs to be exercised

118
with this approach to minimise the possibility of hitting the bat with the rim of the net (Jones et al., 1996).
Mist nets are made of either monofilament terylene or braided nylon. Churchill (2008) suggested, the monofilament terylene was softer, stronger and more durable. A larger mesh size and heavier denier nets should be used for catching megabats. Mist nets are normally suspended between two poles, and often multiple nets are jointed. As bats can be difficult to remove from a mist net, appropriate care is necessary. Bats are normally held in a calico bag before they are identified and measured. Mist nets should be constantly monitored (i.e. every 2-3 minutes) and regularly cleared and checked for holes.
Harp traps contain a frame that commonly supports two banks of vertical fine fishing line. Bats fly into the fishing line and slide down the lines into a bag at the base. Harp traps are often set and left overnight and bats are retrieved in the morning, although it is recommended that bats be removed a couple of times during the night (Churchill, 2008).
Trip lines are fishing lines that are stretched in a criss-crossed fashion across a water body 5-10cm above the water. These taut lines catch bats as they come in to drink. Bats hit a trip line and fall into the water and can be retrieved by hand in the water or when they get to a bank.
If using trip lines and a bat is injured, it may be necessary that it is rescued by entering the water. It is often useful to have two people each with a light when catching bats that have dropped into the water, as bats will most often swim away from a bright light.
People using mist nets to catch bats should be shown how to remove bats from nets and ideally they should seek the appropriate authorisation with the Australian Bird and Bat Banding Scheme web site.
Bats caught in mist nets and harp traps should not be released in daylight except for lactating females which should be released as soon as possible. They should be kept in separate cloth bags suspended in the dark, and in a quiet warm place, and released the next night. If a bat has gone into torpor then it should be gently warmed before being released. Care should be taken if catching flying foxes and microbats to avoid being bitten so as to not be exposed to a range of zoonotic diseases, including bat Lyssa and Hendra viruses. Fruit bats are known to be a natural host of Hendra virus, indicating that they carry the disease but are unaffected by it. Hendra virus transmitted to humans and horses can be lethal. Thus far people infected with Hendra virus appear to have contracted the disease from ill horses.
Figure 13.8.Mist net forcatching bats(Photo by J. Garden)

119
Mist nets and harp traps should not be used in areas where a large number of bats might be caught (e.g. entrance to a roost). Harp traps should be cleared soon after dawn before the sun begins to warm the bag. Ideally, harp traps should also be cleared a couple hours after dusk. Mist nets must be attended at all times and captured bats removed immediately.
Ultrasonic bat detectors are used to pick up echolocation calls (Hayes, 2000). Bat detectors are particularly useful as they are non-invasive, can be left over night and data are stored by various techniques for subsequent analysis. Bat detectors can be stationary or carried by hand or in vehicles (de Oliveira, 1998). Churchill (2008) suggested that if bat detectors were used in conjunction with ultraviolet lights to attract insects, bats would stay in the vicinity of the detector longer increasing the potential to obtain a better quality call sequence. Churchill (2008) indicated that not all microbats could be accurately identified by their call, as many species modified their call in different habitat types, or varied among localities.
There are significant differences in the detection capability of different bat detectors (Fenton, 2000, Churchill, 2008). Fenton (2000), for example, reported the Anabat II with ZCAIM detected significantly fewer bat echolocation calls than a
Pettersson time-expansion detecting system. He reported no consistent or predictable difference between the two systems for the lowest frequency of the calls, but there was a significant correlation for the highest frequency calls. Larson and Hayes (2000) reported Anabat II recorders showed different levels of sensitivity that affected the size of the detection field. Calibration using an ultrasound signal source can be used to minimise this variability in sensitivity among detectors.
The specific location, height, size and direction of mist nets and harp traps will significantly affect both the number of animals and number of species caught (Jones et al., 1996). Mist nets and detectors are almost always located near still water, potential roosts or in flyways, when detecting species is the focus (Jones et al, 1996). Obviously, if determining density is important, then randomising detection locations is an important consideration, but this is seldom the focus of bat surveys to support EcIAs.
Patriquin et al. (2003) reported vegetation structure in forests influenced the ability of Anabat II detectors to detect 25kHz sound, with thinned forests providing a higher level of detection than normal forests, but there was no difference in clear cut forests. However, for 40kHz sound, habitat structure made little difference. These data suggest that some species are equally detectable in different
Figure 13.9.Harp trap for
catching bats(Photo by
S. Campbell)

120
forest habitats while others may not be.
Johnson et al. (2002) compared the number of calls and bat species detected using a ‘passive’ strategy, where the recorder was left stationary at 45o to the land surface and an ‘active’ strategy, where the recorder was moved in a sweeping motion, and when activity was detected, in the direction of the bat to capture as much of the call sequence as possible. Significantly more calls and species were recorded using the active method. Milne et al. (2004) compared the effectiveness of placing Anabat detectors pointed along and across flyways, using a cassette and a computer to record the data and active hand-held verses static recordings in the wet-dry tropics of the Northern Territory. They found no difference in the placement of the detectors, but significantly more calls were recorded from the digital recorder and in hand-held compared with static locations. Law et al. (1998) also found no differences in the number of calls recorded between detectors facing parallel and perpendicular to roads, but detection quality was better when facing along the road. Weller and Zabel (2002) reported that Anabat II detectors placed on stands 1.2m above the ground and those facing the fewest trees detected more bats than those on the ground and those facing treed areas. Anabat detectors with an elevation of 45o were more productive than those at 30o (Weller and Zabel, 2002).
Bat activity shows considerable temporal variation from dusk until dawn and for many areas this activity
is bimodal with peaks immediately after dusk and before dawn (Hayes, 2000).
Milne et al. (2004) indicated that it took at least 3 hours to record 80% of the species present, which is less than Duffy et al. (2000) reported for their survey in three regions in Victoria (4-7hrs). Hourigan et al. (2008) recorded approximately 80% of the species present based on a two all-night survey after sampling at four sites in each habitat type. Richards (2001) and Law et al. (1998) were strong advocates for using Anabat detectors all night to ensure that all species were detected.
Seasonal variation can also be high (Hayes, 2000), indicating that multiple surveys are required to adequately describe the bat assemblage in an area. De Oliveira (1998) suggested microbats might reduce their activity levels during nights that have bright moonlight, during moderate to heavy rain and during strong winds, but are more likely to be active on warmer nights and when there has been an atmospheric pressure change on the previous day.
Like most trapping and detection strategies for other mammals, each of the protocols used to survey bats has a bias (Hourigan et al., 2008). Kuenzi and Morrison (1998) found no difference in the number of species recorded in mist nets and using Pettersson ultrasonic detectors in a Californian survey, but neither system recorded all of the bats present, suggesting both systems
Figure 13.10. Anabat II

121
have benefits and biases. In contrast, Murray et al. (1999) reported that the Anabat II recorded significantly more species than mist netting in their surveys in Missouri. O’Farrell and Gannon (1999) reported a similar finding with the acoustic system being superior to both mist nets and harp traps, but neither method detected all species. Duffy et al. (2000) compared the effectiveness of ultrasonic detectors and harp traps in three regions in south-eastern Victoria and concluded that detectors were more successful when there were fewer species and harp traps were better in relatively dense vegetation with discrete flyways, however, neither protocol recorded all species and the authors suggested the two techniques complement each other.
Hourigan et al. (2008) compared the effectiveness of Anabat II detectors with harp traps for surveying bats in bushland, parkland and residential areas in urban Brisbane and concluded that the Anabat II was significantly better for all species. They concluded that even though it took a considerable amount of time to identify bat calls recorded with ultrasonic detectors, this was still a more cost effective system.
Only species of bat that fly comparatively low are trapped in mist nets or harp traps unless these nets are set very high; as a consequence detectors were better at recording species that fly in the upper canopy and echolocate loudly (Duffy et al., 2000).
The ultrasonic detector is clearly the least intrusive and stressful on the bats and least time-expensive system (Murray et al., 1999). De Oliveira (1998)
provided an excellent text on using Anabat detectors that is strongly recommended to those not familiar with their use.
Duffy et al. (2000) made an interesting observation on bat surveys undertaken to support EcIAs: ‘While qualitative parameters are widely used by experienced observers in the identification of bat calls, their use presents problems of subjectivity in call identification, and leaves potential for inaccuracy. In Australia there is currently an increasing use of Anabat detector in studies such as environmental impact assessments. These studies are sometimes conducted by observers with little bat experience, over short time periods, and with few reference calls on which to base their identifications.’
Hourigan et al. (2008) reported that of the 3,628 call sequences that they recorded in the Brisbane urban area, 45% were of poor quality and unsuitable for identification while a further 8% could not be identified to species level. Species identification based on echolocation call sequences are dependent on having adequate reference calls, and calls can vary geospatially. Therefore, reference calls for the local area were particularly useful. Hayes (2000) also drew his readers’ attention to the problems associated with the misidentification of calls, and suggested calls from closely related species ‘remains challenging and may not be possible’, particularly as calls are modified based on behaviour (e.g. foraging vs. commuting) and habitat. This would suggest that unless environmental consultants are experienced and familiar with identifying acoustic data from bat echolocation, then the task should be left to those
122
with the necessary training and experience. A local reference collection of calls is important for accurate identification of echolocation call data.
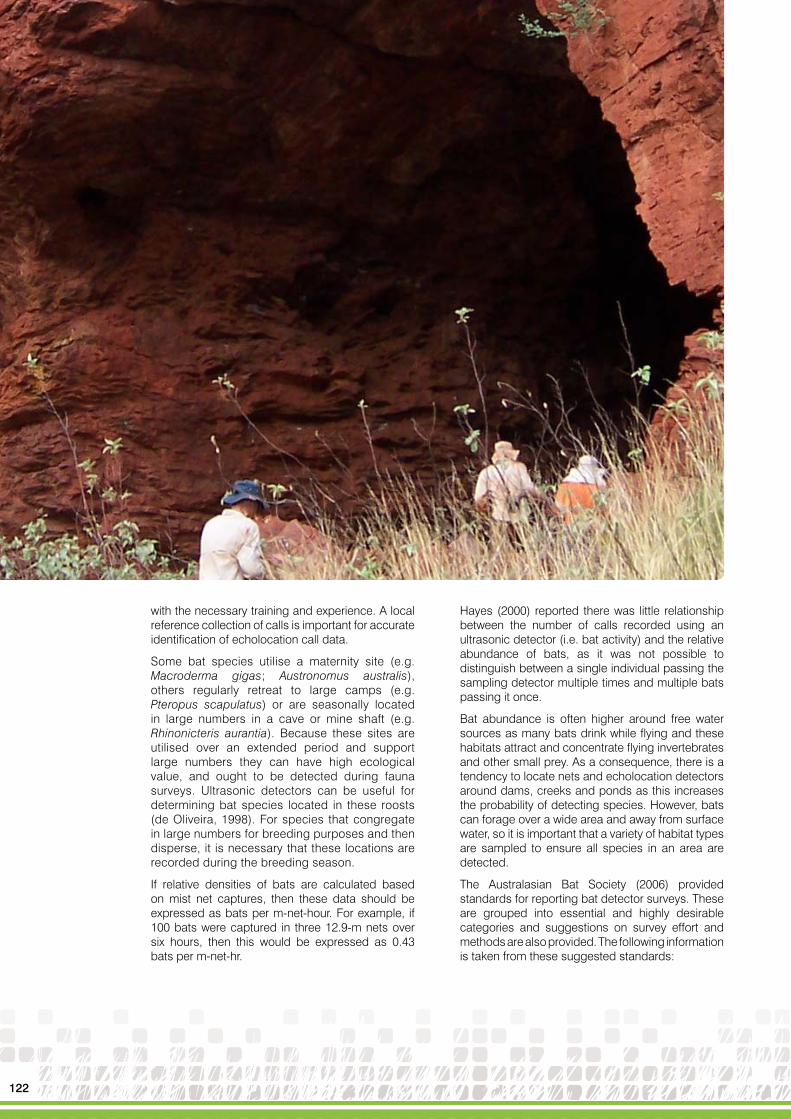
Some bat species utilise a maternity site (e.g. Macroderma gigas; Austronomus australis), others regularly retreat to large camps (e.g. Pteropus scapulatus) or are seasonally located in large numbers in a cave or mine shaft (e.g. Rhinonicteris aurantia). Because these sites are utilised over an extended period and support large numbers they can have high ecological value, and ought to be detected during fauna surveys. Ultrasonic detectors can be useful for determining bat species located in these roosts (de Oliveira, 1998). For species that congregate in large numbers for breeding purposes and then disperse, it is necessary that these locations are recorded during the breeding season.
If relative densities of bats are calculated based on mist net captures, then these data should be expressed as bats per m-net-hour. For example, if 100 bats were captured in three 12.9-m nets over six hours, then this would be expressed as 0.43 bats per m-net-hr.
Hayes (2000) reported there was little relationship between the number of calls recorded using an ultrasonic detector (i.e. bat activity) and the relative abundance of bats, as it was not possible to distinguish between a single individual passing the sampling detector multiple times and multiple bats passing it once.
Bat abundance is often higher around free water sources as many bats drink while flying and these habitats attract and concentrate flying invertebrates and other small prey. As a consequence, there is a tendency to locate nets and echolocation detectors around dams, creeks and ponds as this increases the probability of detecting species. However, bats can forage over a wide area and away from surface water, so it is important that a variety of habitat types are sampled to ensure all species in an area are detected.
The Australasian Bat Society (2006) provided standards for reporting bat detector surveys. These are grouped into essential and highly desirable categories and suggestions on survey effort and methods are also provided. The following information is taken from these suggested standards:

123
Essential
The following must be included in the final report:
• A description of the reference library used in the identification process.
• Details of the number of detector hours undertaken during the survey.
• A sample ‘time versus frequency’ graph of each species identified during the survey. These graphs must be of bats recorded and identified during the survey.
• For species with similar call characteristics, a written description of the characteristics used to distinguish these species must be included in the methods.
Highly desirable
Inclusion of the following is strongly recommended:
• An indication of the proportion of calls identified, i.e. the total number of call processed and the percentage of these that were identified.
• All the call files from a survey are deposited ultimately with the client or agency.
Suggestions
• Since echolocation call analysis can rarely identify all species within a given area, it is important to determine which species could occur in the area prior to any survey, and whether all species (or a target species) are able to be distinguished solely from echolocation calls.
• For most inventory surveys, capture techniques (i.e. using harp traps, mist nets or other methods where bats can be captured and identified) should be employed in conjunction with detector sampling.
• Consultants or biologists who have relatively little experience with bat surveys, but who are engaged to conduct them, should contact a bat specialist to discuss the appropriate methods and level of survey effort.
• Typical inventory survey effort should involve detector deployment for at least three complete nights in each major habitat type in the survey area.
• Surveys should be conducted during the warmer months of the year and in good weather conditions.
• Where possible, reference calls should be recorded from bats released during the survey.

124
13.5 BIRDS
Suggested appropriate practice
• The focus of bird surveys should be on developing a species inventory and relative abundance in each of the major habitat types.
• For non-wetland and non-shoreline birds, two alternative methods are suggested, but only one method should be used when comparing avian assemblages among habitat types. Therefore, it is desirable that the same methodology is used for an entire survey. The two methods are:
° Twenty minute active search of 2ha in densely vegetated areas or 3ha in more open vegetated areas, or
° Twenty minute search of a 500m transect in densely vegetated areas or a 750m transect in more open vegetated areas. Transect searches should be limited to a maximum width of 75m either side of the centre line, and less in dense vegetation.
• All birds detected should be categorised as: foraging in the area, flying through but not foraging in the area, and flying over the area. A judgement will need to be made about raptors, as to whether they are flying over the area or foraging in the area.
• The perpendicular horizontal distance each bird is detected from the transect line should be recorded.
• A species list for categories: foraging in the area, flying through but not foraging in the area, and flying over the area should be prepared for each major habitat type.
• Overall density estimates should be prepared using DISTANCE software for each habitat type for each seasonal survey based on transect data. Where this is not possible (e.g. area searches), then the number of birds detected per hr per habitat type should be reported.
• For wetland and shore birds, 20 minute line transects around the boundary of the wetland or along the shoreline should be used. Relative abundance should be reported as birds per kilometre of shore line.
° Wetland and shoreline birds should be categorised as: in the water (swimming), wading, or on the land.
° The survey area will most often only be on one side of the observer and the width of the area surveyed (e.g. land, wading and water) should be defined;
• A minimum of five transects and area searches should be conducted for each major habitat type in each survey, preferably using different areas or transects within each habitat type.
• Surveys should commence prior to sunrise and last for up to three hours and the starting times and days for each survey should be rotated to ensure the greatest potential differences are covered for each habitat type.
• Surveys should be repeated in at least two seasons, one of which would enable northern hemisphere migratory species to be detected and one should be immediately after the period of heaviest rainfall in arid areas.

125
Birds can be large, vocal and colourful and therefore easy to detect. Others can be secretive, cryptic, migratory, nomadic, fast movers, affected by the presence of an observer, or found in flocks and therefore potentially difficult to detect or count (Pyke and Recher, 1984, Thompson, 2002). Shields (1979), Ratkowsky and Ratkowsky (1979), Dawson (1981a) and Kavanagh and Recher (1983) suggested a lack of precision in bird counts was also attributable to differences among birds in their behaviour, call frequency and sound attenuation, time of the day, season, weather and differences in the detection ability among observers. In contrast, Craig and Roberts (2001) reported sampling bias to estimate bird density in 1ha plots in the Jarrah forest of Western Australia were not influenced by time of day, weather and vegetation density. Craig and Roberts (2001) acknowledged that their findings were different to many others reported in the literature.
Avian fauna show considerable seasonal and year-to-year variability (Recher, 1984). Single surveys are almost always inadequate to represent the avian fauna assemblage at any site. Seasonal variations may relate to the abundance of invertebrates, the presence of nectar-rich flowers and migratory patterns (Recher, 1984).
The most obvious requirement for comparing avian assemblages is to standardise the method among survey sites. This is most commonly done based on time. As a general rule, the longer the time taken for a survey the higher the species count, but as with trapping surveys there are diminishing returns with extra survey effort (Ratkowsky and Ratkowsky, 1979). Bibby (2005) suggested an hour is commonly used as a practical unit. Pyke and Recher (1984) suggested that for interval point counts the time spent at each location should be 5-10 minutes, observer locations should be spread evenly along a transect, and both calls and sightings should be recorded.
Ratkowsky and Ratkowsky (1979) suggested multiples of 10-minute walking counts was the optimal protocol, but acknowledged local biotic and non-biotic factors (e.g. steep terrain, windy conditions) could require that time be increased. An alternative methodology is to use 20 minutes for a 2ha area search (an area with a radius of about 80m), which is the standard used for the Australian Bird Atlas project (Bibby, 2005). Bibby (2005) suggested 20 minutes was a reasonable time to search 2ha walking at a slow pace and covering about 500m.
Loyn (1986) suggested a 20 minute search of 3ha with all birds being seen or heard included in the count was a practical approach for surveying forest birds. Shields (1979) suggested walking along transects at 1km / hr in the breeding season in deciduous forests and at 2km / hr in more open areas. Where multiple surveys of the same habitat are undertaken then the starting times should be rotated equitably among sites and surveys in high winds and during rain should be avoided (Shields, 1979).
Relative abundance in the avian assemblage can be reported as the number of individuals recorded per unit time, and adequacy of the survey can be determined by the time between encountering a new species, which should get progressively longer as the survey proceeds. Bibby (2005) suggested that there are more analytical possibilities for survey data collected at a finer resolution of time or space and these data can always be aggregated to a coarser resolution. Bibby (2005) argued that all surveys should be repeated to address issues of spatial and temporal variability.
Multiple methods have been used to survey birds (Recher, 1984, Recher, 1988, Gibbons and Gregory, 2006, Bibby et al., 2007), and all are susceptible to a particular bias and no one method was suitable for all species and all locations.

126
These methods can be divided into two categories; methods that use counts of bird detections as an index of relative abundance (i.e. index counts), and methods based on empirical modelling (Rosenstock et al., 2002). Four methods should typically be used for index counts to survey birds to support EcIAs:
• Area counts; • Timed counts; • Line transects; and • Interval point or transects counts.
Mist netting is seldom used by environmental consultants to record species richness or relative abundance for EcIA purposes. Karr (1981) suggested the advantage of mist netting is that it reduced variability in data when compared with procedures which depended on extensive experience with sight and sound identifications, however, the area covered and the need to frequently inspect and clear nets means that they are generally unsuitable for site scale avian surveys. Shields and Recher (1984) suggested that mist netting was not particularly useful as a census procedure as it was both time consuming and required a high number of people.
Bull (1981) suggested numerous indirect methods for measuring bird abundance, including: auditory signals, feeding and dusting sites, tracks, roosts, faecal pellets and nest counts. However, none of these methods are routinely used in avian surveys to support EcIA and few have the potential to be useful in this context.
Recher (1984) reviewed the various survey techniques and reported that transects often failed to detect inconspicuous species, and mapping was best for sampling territorial species.
Whereas, colonial species and those with large territories or home ranges were best sampled by transects, and point counts often gave higher estimates of species densities than transects (Recher, 1984). Shields and Recher (1984) compared four methods for censusing forest birds and concluded that a strip transect procedure provided repeatable estimates of relative abundance. Ratkowsky and Ratkowsky (1979) reported walking transects in the forests of Tasmania recorded more species than remaining stationary for the same time spent observing.
Craig (2004) compared area searches, line transects and point counts in the jarrah forest of south-western Australia and reported that all three methods detected a similar number of species but area searches provided higher estimates of overall density. However, the area search method took 30 minutes compared with 16 minutes for line transects and 10 minutes for point counts. So his reported differences could have been due to the observation time and not the technique. Craig (2004) speculated that area searches had a higher propensity for detecting cryptic species and flushing birds from the vegetation and this accounted for the higher values.
Rosenstock et al. (2002), based on their review of various bird survey techniques, suggested that estimates of relative abundance based on index counts would not normally be expected to provide reliable information or be a valid basis for inference. They also suggested that all point sampling data should be accompanied by measures of precision. Rosenstock et al. (2002) argued a strong case for using distance sampling as the technique for estimating bird density.

127
Field survey procedures for distance sampling can be based on point or transect counts, with the observer recording all observations within a defined area or corridor and the distance each observation is from the point or transect. Three underlying assumptions for this approach are that all birds are detected, birds are detected before they have moved in response to the presence of the observer, and distances are measured accurately (Buckland et al., 2008).
Repulsion of birds by the observer could result in bias during point counts (Recher, 1984), but Pyke and Recher (1985) found no observer effects in open forests using variable distance point counts. In contrast, Pyke (1983) reported birds being repulsed in a point count when an observer was sitting on a 2.5m ladder to count birds. Arnold (1984) reported that equal numbers of noisy and mobile species were seen by stationary and mobile observers, even when stationary observers took half the time of mobile observers, however, mobile observers detected significantly more of the quieter and less mobile species in a wandoo woodland. Buckland (2006) reported line transects were more efficient than point sampling for songbirds, and his ‘snapshot’ method was the most efficient of the alternative point-sampling methods. The snapshot approach records all birds within a moment in time, in his case 3 minutes after the arrival at a location, with all data being analysed in DISTANCE software.
Bird surveys are prone to error or bias associated with observer skills, census method, effort and speed of the survey, habitat, bird activity and density, seasons, time of day and ambient weather conditions (Dawson, 1981a, Recher, 1984, Bibby et al., 2007). These factors are briefly discussed below.
13.5.1 Observers
Knowledge and the necessary skill in identifying birds is an obvious pre-requisite for a bird observation survey (Robbins and Stallcup, 1981, Bibby, 2005). This not only requires the observer to accurately identify individuals when they are seen perched on a tree, but able to identify individuals based on calls and flight characteristics. Dawson et al. (1995) and Rosenstock et al. (2002) reported variation among observers in detecting birds. Knowing where to look for cryptic species and how to count large numbers of birds in a flock enhanced the accuracy of the survey. Shields (1979), Faanes and Bystrak (1981) and Rosenstock et al. (2002) suggested that bird detectability was influenced by intrinsic factors such as observer training, age, experience, motivation, hearing acuity, eyesight, physical health and fatigue and extrinsic factors such as census speed, habitat structure and weather.
Kavanagh and Recher (1983) in examining differences among observers in transect searches indicated that some people are ‘active searchers’ who will deviate from the transect to locate birds while others were ‘passive searchers’ who rarely deviated from the transect. In their study there was also variability in the interpretation of the search guidelines (e.g. active searchers considered each transect a strip that had to be thoroughly searched, whereas passive searchers regarded each transect as a line from which birds within the strip width were recorded). Where there was a possibility of double counting some observers were more conservative than others. Birds that flew over or through a transect but did not forage within it were not supposed to be counted, but there was variation in the interpretation of what constituted ‘foraging’ along a transect.

128
Different search patterns also contributed to variability among observers (Kavanagh and Recher, 1983) with some covering more ground at a higher speed and therefore potentially flushing more of the cryptic species and intersecting groups that were clumped in their distribution.
Robbins and Stallcup (1981) and Kavanagh and Recher (1983) suggested that misidentification of species by observers was a major source of error in bird censuses. This included misidentification of calls for species that were not normally associated with the habitats being surveyed, and this was compounded by differences in motivation, fatigue and personality (e.g. tendency to over or under estimate flock numbers, or to exclude birds on the edge of transects). Observer difficulty in estimating or determining the boundary of transects also contributed to variability in the number of birds recorded (Pyke and Recher, 1985). Kavanagh and Recher (1983) made the following recommendations to improve comparisons among bird surveys undertaken along transects by different observers:
• Observers need similar ability (i.e. training and experience) in detecting birds;
• Detailed guidelines should be provided and search patterns should be standardised;
• Speed of movement along the transect should be standardised and regulated;
• Observers need training in estimating bird numbers in flocks or groups; and
• If multiple observers are used, then they should be rotated among survey sites.
Pyke and Recher (1985) suggested that within open forests, transects might be limited to 60m and ignoring calls for unseen birds when estimating density.
Hutto and Mosconi (1981) reported that a second observer on line transects significantly increased the number of individuals detected, significantly increased the detection of rare birds and increased the detection at a distance from the observer. Considering the problems with detectability and detectability of birds at a distance from the observer, these authors provided a strong case for using two observers on line transects where the quality of the data was important.
13.5.2 Density and flocks
Kavanagh and Recher (1983) suggested that differences in counting birds in flocks reduced the precision associated with bird surveys. Often aggregations of birds fly through or over a survey site. Stationary flocks (e.g. feeding, nesting) can generally be counted as long as they are not disturbed. Obviously, in breeding aggregations it can be difficult to access some places which can make counting difficult (e.g. cliff faces, swamps, dense trees). Wardell-Johnson (1984) reported that for bird surveys in the karri forest, density estimates were most variable for species living in the upper storey and those that moved in flocks. For moving flocks, there is often a time limit on how many individuals can be counted. In these circumstances a proportion of the flock is counted and then an estimate is made of what proportion of the total flock that represents. This is often complicated as individuals are not uniformly distributed within the flock. Gregory et al. (2005) suggested taking photographs of flocks and counting the number at a later date. Seldom is this a feasible option for environmental consultants undertaking fauna assessments due to time, equipment constraints and costs.
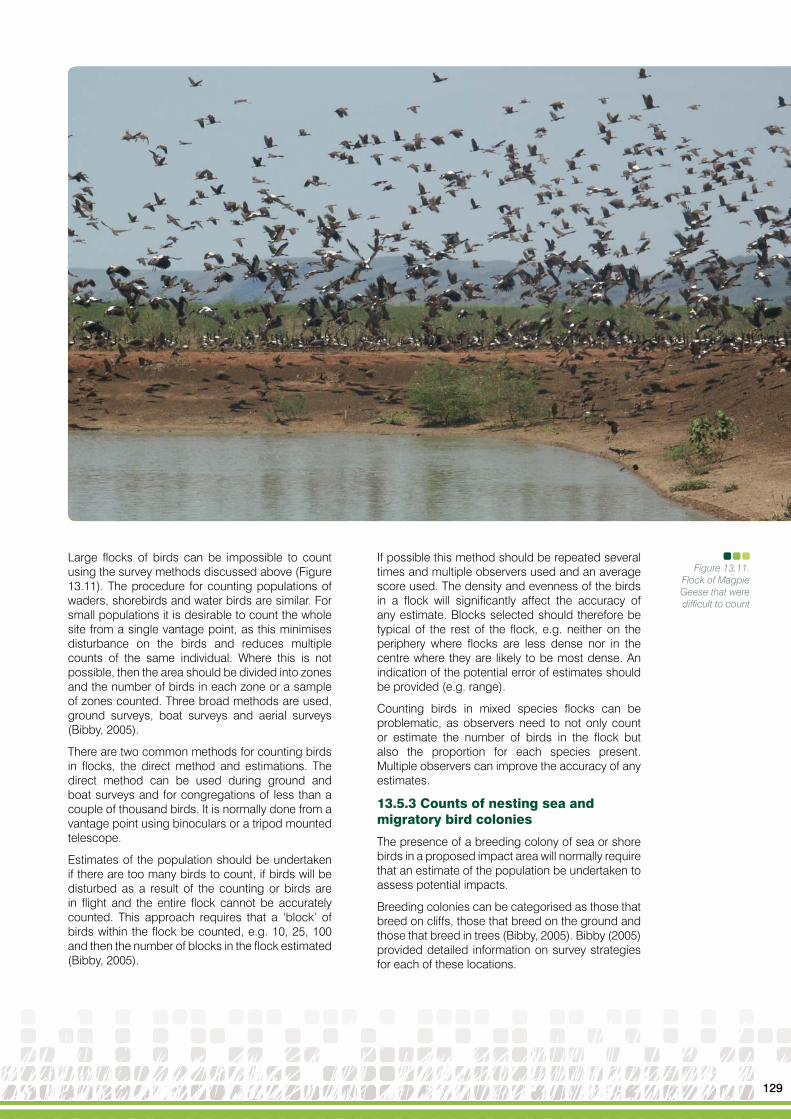
129
Large flocks of birds can be impossible to count using the survey methods discussed above (Figure 13.11). The procedure for counting populations of waders, shorebirds and water birds are similar. For small populations it is desirable to count the whole site from a single vantage point, as this minimises disturbance on the birds and reduces multiple counts of the same individual. Where this is not possible, then the area should be divided into zones and the number of birds in each zone or a sample of zones counted. Three broad methods are used, ground surveys, boat surveys and aerial surveys (Bibby, 2005).
There are two common methods for counting birds in flocks, the direct method and estimations. The direct method can be used during ground and boat surveys and for congregations of less than a couple of thousand birds. It is normally done from a vantage point using binoculars or a tripod mounted telescope.
Estimates of the population should be undertaken if there are too many birds to count, if birds will be disturbed as a result of the counting or birds are in flight and the entire flock cannot be accurately counted. This approach requires that a ‘block’ of birds within the flock be counted, e.g. 10, 25, 100 and then the number of blocks in the flock estimated (Bibby, 2005).
If possible this method should be repeated several times and multiple observers used and an average score used. The density and evenness of the birds in a flock will significantly affect the accuracy of any estimate. Blocks selected should therefore be typical of the rest of the flock, e.g. neither on the periphery where flocks are less dense nor in the centre where they are likely to be most dense. An indication of the potential error of estimates should be provided (e.g. range).
Counting birds in mixed species flocks can be problematic, as observers need to not only count or estimate the number of birds in the flock but also the proportion for each species present. Multiple observers can improve the accuracy of any estimates.
13.5.3 Counts of nesting sea and migratory bird colonies
The presence of a breeding colony of sea or shore birds in a proposed impact area will normally require that an estimate of the population be undertaken to assess potential impacts.
Breeding colonies can be categorised as those that breed on cliffs, those that breed on the ground and those that breed in trees (Bibby, 2005). Bibby (2005) provided detailed information on survey strategies for each of these locations.
Figure 13.11.Flock of MagpieGeese that weredifficult to count

130
13.5.4 Effort and speed
Because there is a direct relationship between the number of individuals seen and the area surveyed, time taken or length of transects, survey results are most often directly related to the effort deployed. There is no particular formula for determining appropriate effort as it is a trade-off with the quality of the results. Suggestions have been made on the appropriate effort that should be deployed by various authors (Ratkowsky and Ratkowsky, 1979, Pyke and Recher, 1984, Loyn, 1986, Bibby, 2005).
Petit et al. (1995) suggested that in a variety of deciduous forests in Arkansas, point counts of between four and six minutes recorded 80% of the species likely to be recorded had the survey lasted for a longer period. Savard and Hooper (1995) surveying grassland birds in British Columbia using point counts, reported that four and eight minute point counts detected 68% and 85% of the number of counts during 12 minute surveys, and the most efficient sampling duration was four minutes presuming travel time between observations was under 15 minutes. Density estimates were significantly lower for four minute counts than for 12 minute counts.
Buskirk and McDonald (1995), based on an extensive survey of birds in a deciduous forest in Indiana, suggested 10 minute point counts were the most economical for monitoring purposes, and a point of diminishing return was reached before five 10 minute samples at each site. They
suggested that three or fewer repeats were appropriate for monitoring purposes, and that few additional new individuals were recorded during point counts after 100 minutes of observation. Using data from 10 minute point counts to census birds on the Mississippi alluvial valley, Smith et al. (1995) suggested that about 50 point counts per habitat type were necessary to assess biologically meaningful differences in avian assemblages among habitat types. They suggested there should be multiple survey sites within each habitat type and five sampling points within each site.
The consensus of a workshop on point count bird surveys was that five minute counts were the most cost effective, if travel time between sites was less than 15 minutes, and 10 minutes if travel time was greater than 15 minutes and it was better to increase the number of sampling stations than to repeat a smaller number of stations (Ralph et al., 1995).
13.5.5 Timing and vocalisation
Some avian species have defined activity patterns; others vary from day-to-day and on a seasonal basis (Dawson, 1981a, Skirvin, 1981, Recher, 1984, Wardell-Johnson, 1984, Bibby, 2005). Knowledge of these patterns is important to adequately identify the presence and relative abundance of an avian assemblage. For example, seed-eaters may be relatively scarce in an arid landscape and therefore difficult to detect, but as most seed eaters require access to free water each day, and this often occurs around sunset, observing birds at water holes

131
around sunset can provide a useful indication of seed eaters present in an area.
An obvious constraint in any avian survey is the observer’s ability to identify species based on calls, and this can be made more difficult as many birds have a repertoire of different songs. Some birds only vocalise around sunrise, others all day, others as a threat display or as an alarm call. Calls might be more prevalent during the breeding season, or chicks calling for their parents may be seasonal. Keast (1984), in a study on birds in open forest and woodlands of the Hunter Valley, NSW, indicated that birds call most frequently in the early morning and birds were also more visual then since it is prime feeding time, and concluded by suggesting surveys should be confined to 2.5-3hrs after sunrise, and that for a stationary observer, count periods of 10–15 minutes were optimum.
Skirvin (1981) and Pyke (1983) also reported the detection of birds decreased after sunrise in the pine forests of Oregon and heath land in New South Wales respectively. A similar result was reported for the North American Breeding Bird Survey (Robbins, 1981b). To address potential variations within and between days, and on a seasonal basis, it is apparent some standardisation of the survey technique is necessary.
13.5.6 Habitat type
Birds can be particularly cryptic, and as a general rule are more detectable in open than in scrubby habitats (Bibby and Buckland, 1987), and in open woodlands (Keast, 1984) compared with closed rainforests. Issues of access and different vegetation densities in the different layers of the vegetation (e.g. canopy vs. understorey) can also provide a potential bias (Oelke, 1981, Bibby et al., 2007). For example, Wardell-Johnson (1984) suggested that for karri forests the two main layers (i.e. understorey and mid and upper storey) provided different environments for birds and supported different communities. He went on to suggest that survey techniques for these two layers might best be done on different occasions using different techniques, and that forest tracks may provide suitable sites to survey overstorey species but could lead to over estimates of density for understorey species.
Wetlands pose a series of problems when counting birds. These include limited accessibility, poor visibility, safety issues (e.g. mud, snakes, drowning) and dense vegetation (Jaensch, 1984). Jaensch (1984) suggested that no one approach to survey wetland birds suited all circumstances, but he recommended that observers should strive to cover as much of a wetland as possible, investigate all habitat types and observers should work in pairs.
For estuaries, counts should be undertaken at high tide, in dense reed-swamps use calls or flushing birds from cover, and for wooded lakes use a circular weave pattern around the water’s edge. As an alternative, if there is a high vantage point,
then using binoculars or a telescope mounted on a tripod can be an effective method to count birds.
Bird Studies Canada (http://www.bsc-eoc.org/volunteer/bccws/index.jsp?targetpg=protocol) recommended that surveys of shore birds and waders should be undertaken between two hours before and after high tide as this concentrates the birds into a smaller area closer to the observer.
Jaensch (1984) made the following suggestions for detecting particular groups of wetland birds:
• Small grebes and diving species – count three times to account for submerged individuals;
• Bitterns – listen for calls at dawn and dusk;• Freckled ducks – these birds are secretive
and reluctant to leave cover, so a thorough investigation is required;
• Ducks in flight – anticipate the flight path to ensure you are well positioned to count the flock; and
• Crakes and rails – use call play-back to attract birds into the open where they can be counted (Marion et al., 1981).
13.5.7 Playback of pre-recorded calls
Ornithologists sometimes record and play the calls of particular birds to stimulate a response from individuals that are difficult to detect (Johnson et al., 1981, Marion et al., 1981, Bibby, 2005, Gregory et al., 2005). This technique would only be used in surveys to support EcIAs if there was a specific need to identify a species of conservation significance that was known to respond to a conspecifics call (e.g. Tyto noveahollandiae)
Care is needed with this approach to keep the impact on birds to a minimum, as birds will often respond to a threat to their territory to the exclusion of other activities. Gregory et al. (2005) suggested that it is difficult to use this technique to estimate relative abundance or population size in a habitat.
13.5.8 Spatial boundaries
Prior to an avian fauna survey a decision is required on which birds to count (i.e. those foraging within the habitat, those passing through the habitat and those passing over the habitat). For example, should a Wedge-tailed Eagle that is seen flying high in the distance be recorded? Some species will be seen flying though a habitat type but are clearly moving from one area outside the survey site to another area outside the survey site. Lateral and height boundaries for each avian survey in each habitat type should be specified in the survey methodology. Ralph et al. (1995) recommended that birds flying over a survey site should be recorded separately from those detected in the vegetation, as they were less likely to be associated with that habitat type. They suggested there are exceptions such as raptors, swallows and swifts.

132
13.5.9 Migratory birds
Some species of birds found in Western Australia are only here for part of the year, and may migrate many thousands of kilometres to avoid the cold associated with wintering in the northern hemisphere (Bamford et al., 2008). Many of these species are marine, estuarine or shore birds, but not all of them. Minton and Lane (1984) reported that 30 of the 70 species of waders in Australia were regular migrants and another 24 came either in small numbers or were vagrants. Many of these birds breed in the northern hemisphere and migrate to Australia to forage (Bamford et al., 2008). Waders are typically found around the coast line of Australia, but they also utilise inland salt and freshwater lakes. Areas that support high densities of waders correlate with coast lines where wave energy is low (e.g. intertidal sand and mud flats – Broome to Port Hedland; Peel Inlet and Rottnest Island Lakes).
Bamford et al. (2008) suggested it was best to consider the annual cycle of migratory birds in the east Asian – Australian flyway in the following four periods:
• Breeding (May – August)• Southward migration (August to November)• Non-breeding (December to February)• Northward migration (March – May).
There are variations on this pattern for each species, with a few species, e.g. Australian Pratincole and the Double-banded Plover, not fitting the pattern (Bamford et al., 2008).
Surveying ‘out-of-season’ will fail to detect species that may well be present at other times in the year.
The size of migratory species populations will vary seasonally and annually. The population will normally be largest at the end of the breeding season due to the recruitment of juveniles and a concentration of birds in a breeding area and smallest just prior to the breeding season (Bamford et al., 2008).
Bamford et al. (2008) indicated that there are multiple internationally important sites for migratory birds in Australia, and in particular in Western Australia. Details and the location of these sites are listed in Bamford et al. (2008). This list also indicates whether the site is used on the northward or southward migration and whether it is a breeding site.
The Australian government has an obligation to protect and conserve numerous migratory birds under the China-Australia Migratory Bird Agreement (CAMBA) and the Japan-Australia Migratory Bird Agreement (JAMBA). Details of these agreements and the species covered can be found on the Commonwealth government department responsible for the environment web site. It is important in the limitations section of the report to indicate whether migratory birds were unlikely to have been detected because of the survey timing.
Bamford et al. (2008) indicated that the southward and northward migratory paths and stopover locations were not always the same, so surveys to detect migratory birds need to be timed to maximise the probability of locating and counting the largest number of migratory birds.
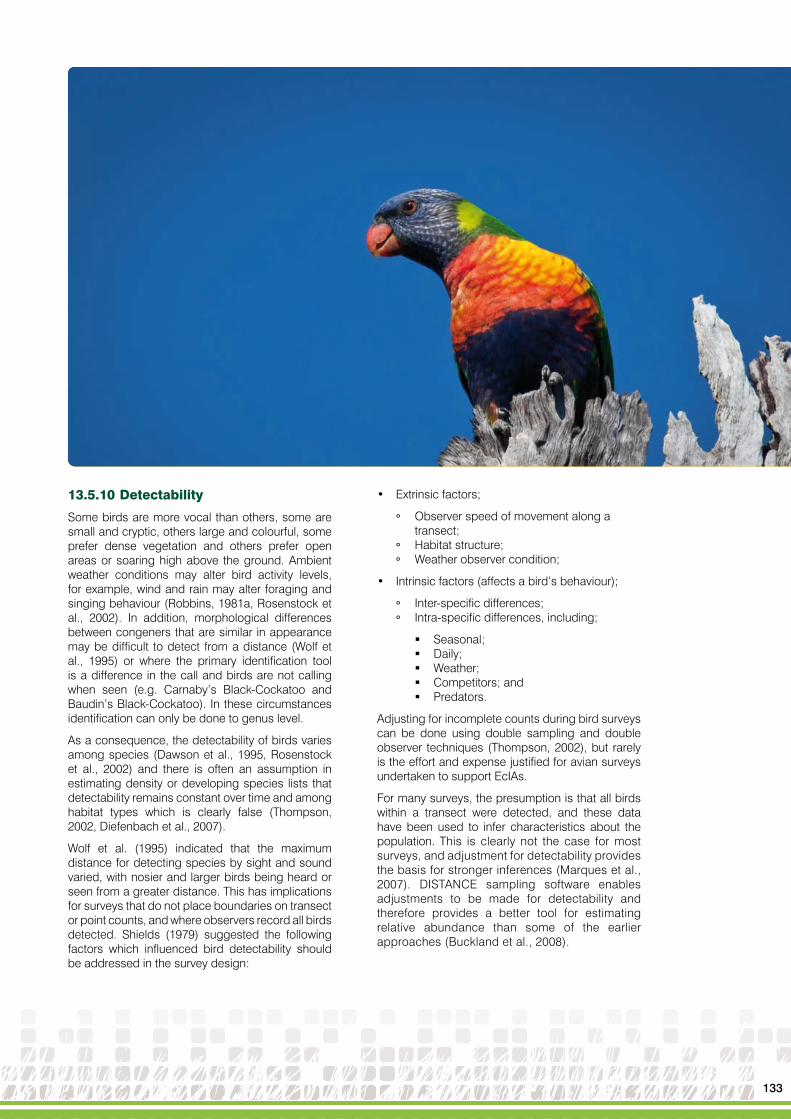
133
13.5.10 Detectability
Some birds are more vocal than others, some are small and cryptic, others large and colourful, some prefer dense vegetation and others prefer open areas or soaring high above the ground. Ambient weather conditions may alter bird activity levels, for example, wind and rain may alter foraging and singing behaviour (Robbins, 1981a, Rosenstock et al., 2002). In addition, morphological differences between congeners that are similar in appearance may be difficult to detect from a distance (Wolf et al., 1995) or where the primary identification tool is a difference in the call and birds are not calling when seen (e.g. Carnaby’s Black-Cockatoo and Baudin’s Black-Cockatoo). In these circumstances identification can only be done to genus level.
As a consequence, the detectability of birds varies among species (Dawson et al., 1995, Rosenstock et al., 2002) and there is often an assumption in estimating density or developing species lists that detectability remains constant over time and among habitat types which is clearly false (Thompson, 2002, Diefenbach et al., 2007).
Wolf et al. (1995) indicated that the maximum distance for detecting species by sight and sound varied, with nosier and larger birds being heard or seen from a greater distance. This has implications for surveys that do not place boundaries on transect or point counts, and where observers record all birds detected. Shields (1979) suggested the following factors which influenced bird detectability should be addressed in the survey design:
• Extrinsic factors;
° Observer speed of movement along a transect;
° Habitat structure;° Weather observer condition;
• Intrinsic factors (affects a bird’s behaviour);
° Inter-specific differences;° Intra-specific differences, including;
Seasonal; Daily; Weather; Competitors; and Predators.
Adjusting for incomplete counts during bird surveys can be done using double sampling and double observer techniques (Thompson, 2002), but rarely is the effort and expense justified for avian surveys undertaken to support EcIAs.
For many surveys, the presumption is that all birds within a transect were detected, and these data have been used to infer characteristics about the population. This is clearly not the case for most surveys, and adjustment for detectability provides the basis for stronger inferences (Marques et al., 2007). DISTANCE sampling software enables adjustments to be made for detectability and therefore provides a better tool for estimating relative abundance than some of the earlier approaches (Buckland et al., 2008).
134

135
MARKING ANIMALS
If it is important to know which animals have been caught, then it is necessary that recaptured animals can be identified. Knowledge of ‘recaptures’ is necessary for some methods of estimating abundance and density, and it is also useful when determining home ranges based on a trapping program, longevity, anatomical and body condition changes with time (e.g. body mass) or if an analysis requires the exclusion of previously caught individuals.
For surveys to support EcIAs, there is seldom any need to permanently mark fauna. However, some environmental consultants may wish to determine whether the same individuals are being repeatedly caught during a survey, as this may inflate estimates of relative abundance. In this circumstance, a mark that lasts for the period of the survey is adequate. Permanent marking of fauna may be required in monitoring populations.
There are three issues to be considered when determining how animals should be marked:
• The period of recognition (e.g. short term or permanent);
• Whether you wish to know it is a recapture or to identify the individual; and
• The extent to which it may affect the individual’s behaviour and survival.
Marking animals can be stressful (Powell and Proulx, 2003, Beausoleil et al., 2004, Langkilde and
Shine, 2006). The Australian Code of Practice for the Care and Use of Animals for Scientific Purposes (National Health and Medical Research Council, 2004) indicated that the method chosen to identify individual animals must cause the least distress and interference with the normal functioning of the animal.
Beausoleil et al. (2004) and Ferner (2007) suggested that the ideal identification mark should:
• Allow the animal to be as free of pain or stress as possible, should not cause death, interfere with behaviour, or affect the future probability of being caught or seen;
• Identify the animal as an individual indefinitely;• Be easy to apply in the laboratory and the field;• Be easily and unambiguously read;• Be reliable for the duration of the study;• Be cost effective and use materials that are
easily obtained; and• Be adaptable on different sized animals.
Handling effects when marking animals are largely ignored and rarely explicitly addressed. Baker and Johanos (2002) suggested there are three reasons for this: handled animals do not appear to be harmed and any effects are presumed to be negligible, the logistics and costs inhibit studies which control for handling effects, and the effects are difficult to quantify.
MA
RK
ING
AN
IMA
LS
CH
AP
TE
R 1
4

136
14.1 BIRDS
Suggested appropriate practice
• Bird banders should be registered with ABBBS and obtain an appropriate authorisation.
• Use appropriate leg bands according to the ABBBS guidelines.
For birds, identification almost always is a leg band, however, Guay and Mulder (2008) used neck collars on black swans (Cygnus atratus) with no obvious ill effects. Bands are either metal or coloured plastic. Metal bands are mostly used so that if a bird is subsequently caught, then the person that placed the band on the bird can be contacted. These bands are mostly made of aluminium or an aluminium alloy and for larger birds, it can be stainless steel. These bands contain a unique number and contact details of the organisation or person that put the band on the bird.
Coloured (plastic) bands are used to enable individual birds to be identified without it being caught. Multiple different coloured bands are often used. Leg flags are also used. These are a coloured band with an attachment that makes it more visible from a distance. Birds Australia provided a brochure on bird banding on its web site.
14.1.1 Australian Bird and Bat Banding Scheme
Under the auspice of the Australian government there is an Australian Bird and Bat Banding Scheme (ABBBS). This system authorises people to band birds, and there are different levels of authority. There are guidelines available for first time applicants. As with all other activities involved in ‘taking’ fauna, people intending to band birds are required to have an appropriate licence issued by DEC.
Banders are responsible for fitting the correct size band. Recommended band sizes for birds and Guidelines for Banders are contained on the Commonwealth government department responsible for the environment web site. This brochure also indicates those species for which a band is currently not available (e.g. emu, ostrich) or birds that should not be banded because they will crush the band and potentially injure themselves (e.g. Gang-gang Cockatoo).
14.2 AMPHIBIANS
Suggested appropriate practice
• A case needs to be made that marking amphibians is necessary, and where it is, then all the alternative techniques should be considered and assessed.
• When marking amphibians is necessary, toe clipping is an acceptable approach.
Various techniques have been used to mark amphibians, including photographs (Doody, 1995), fluorescent tags (Nishikaw and Service, 1988, Schlaepfer, 1998, Gower et al., 2006), visible implant alphanumeric tags (VIA) (Heard et al., 2008), visible implant elastomers (VIE) (Nauwelaerts et al., 2000), passive integrated transponders (PIT) (Brown, 1997, Ireland et al., 2003, Pyke, 2005), body pattern recognition (Gamble et al., 2008), knee tags (Elmberg, 1989), heat, freeze and chemical branding (Ehmann, 2000, Beausoleil et al., 2004), tattooing (Beausoleil et al., 2004) and toe clipping (Beausoleil et al., 2004, Phillott et al., 2007, 2008).
Tadpoles have had their tail fin clipped, and stains and dyes applied to the skin and subcutaneously
injected (Ferner, 2007). Ferner (2007) concluded that the subcutaneous injection of an organic dye or organic solvent mixture into the tail fin was the most permanent.
There has been considerable discussion and comment on the various techniques for marking amphibians, and some of this relates to the ethics and pain associated with the removal of toes. May (2004) drew our attention to the ‘casual barbarity’ of toe clipping and goes on to cite other publications that indicate adverse effects including inflammation and infection of feet and limbs, and a lower rate of return in mark-recapture studies. In contrast, Funk et al. (2005) in responding to the views of May (2004) suggested there were many occasions where the use of alternative techniques for marking
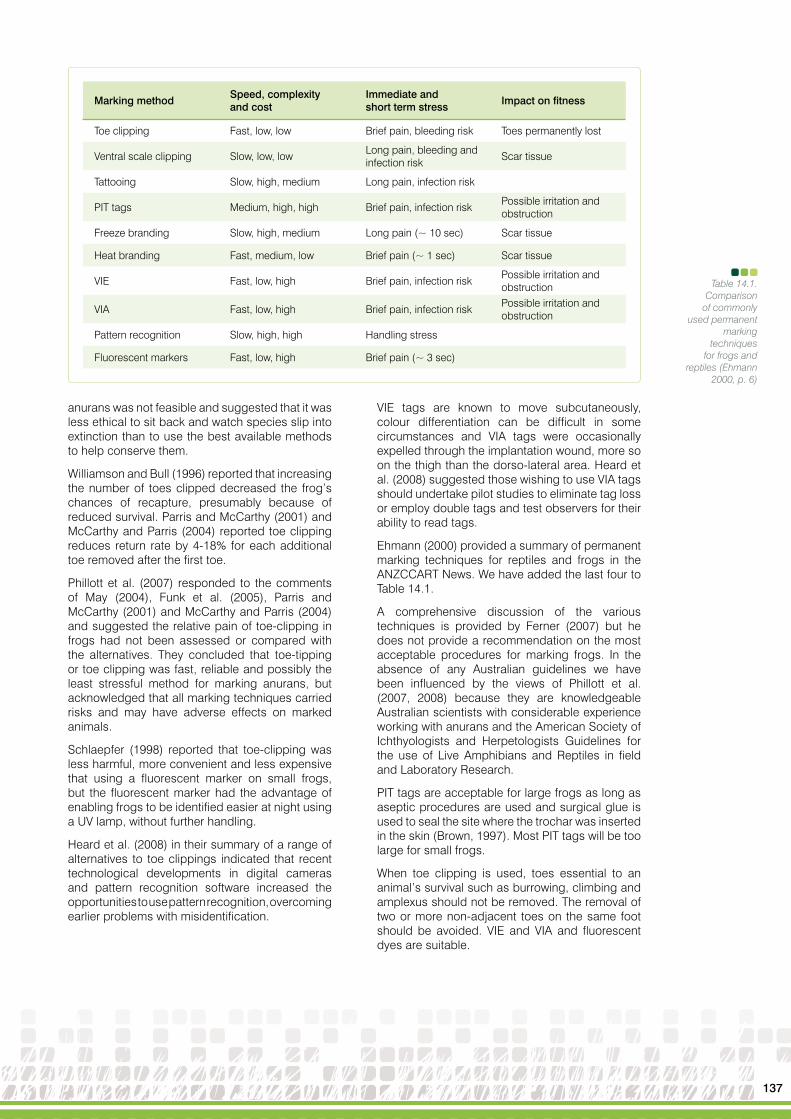
137
Table 14.1. Comparison
of commonly used permanent
marking techniques
for frogs and reptiles (Ehmann
2000, p. 6)
anurans was not feasible and suggested that it was less ethical to sit back and watch species slip into extinction than to use the best available methods to help conserve them.
Williamson and Bull (1996) reported that increasing the number of toes clipped decreased the frog’s chances of recapture, presumably because of reduced survival. Parris and McCarthy (2001) and McCarthy and Parris (2004) reported toe clipping reduces return rate by 4-18% for each additional toe removed after the first toe.
Phillott et al. (2007) responded to the comments of May (2004), Funk et al. (2005), Parris and McCarthy (2001) and McCarthy and Parris (2004) and suggested the relative pain of toe-clipping in frogs had not been assessed or compared with the alternatives. They concluded that toe-tipping or toe clipping was fast, reliable and possibly the least stressful method for marking anurans, but acknowledged that all marking techniques carried risks and may have adverse effects on marked animals.
Schlaepfer (1998) reported that toe-clipping was less harmful, more convenient and less expensive that using a fluorescent marker on small frogs, but the fluorescent marker had the advantage of enabling frogs to be identified easier at night using a UV lamp, without further handling.
Heard et al. (2008) in their summary of a range of alternatives to toe clippings indicated that recent technological developments in digital cameras and pattern recognition software increased the opportunities to use pattern recognition, overcoming earlier problems with misidentification.
VIE tags are known to move subcutaneously, colour differentiation can be difficult in some circumstances and VIA tags were occasionally expelled through the implantation wound, more so on the thigh than the dorso-lateral area. Heard et al. (2008) suggested those wishing to use VIA tags should undertake pilot studies to eliminate tag loss or employ double tags and test observers for their ability to read tags.
Ehmann (2000) provided a summary of permanent marking techniques for reptiles and frogs in the ANZCCART News. We have added the last four to Table 14.1.
A comprehensive discussion of the various techniques is provided by Ferner (2007) but he does not provide a recommendation on the most acceptable procedures for marking frogs. In the absence of any Australian guidelines we have been influenced by the views of Phillott et al. (2007, 2008) because they are knowledgeable Australian scientists with considerable experience working with anurans and the American Society of Ichthyologists and Herpetologists Guidelines for the use of Live Amphibians and Reptiles in field and Laboratory Research.
PIT tags are acceptable for large frogs as long as aseptic procedures are used and surgical glue is used to seal the site where the trochar was inserted in the skin (Brown, 1997). Most PIT tags will be too large for small frogs.
When toe clipping is used, toes essential to an animal’s survival such as burrowing, climbing and amplexus should not be removed. The removal of two or more non-adjacent toes on the same foot should be avoided. VIE and VIA and fluorescent dyes are suitable.
Marking methodSpeed, complexity and cost
Immediate and short term stress
Impact on fitness
Toe clipping Fast, low, low Brief pain, bleeding risk Toes permanently lost
Ventral scale clipping Slow, low, lowLong pain, bleeding and infection risk
Scar tissue
Tattooing Slow, high, medium Long pain, infection risk
PIT tags Medium, high, high Brief pain, infection riskPossible irritation and obstruction
Freeze branding Slow, high, medium Long pain (~ 10 sec) Scar tissue
Heat branding Fast, medium, low Brief pain (~ 1 sec) Scar tissue
VIE Fast, low, high Brief pain, infection riskPossible irritation and obstruction
VIA Fast, low, high Brief pain, infection riskPossible irritation and obstruction
Pattern recognition Slow, high, high Handling stress
Fluorescent markers Fast, low, high Brief pain (~ 3 sec)

138
14.3 REPTILES
Suggested appropriate practice
• A case needs to be made that marking reptiles is necessary, and where it is, then all alternative techniques should be considered and assessed.
• A decision should be made prior to the survey on whether the mark should be temporary or permanent.
• Aseptic procedures should be used where there is a wound.
• For short term marking of lizards and snakes, paint or dye is appropriate.
• Toe clipping is acceptable for long term marking of lizards.
• Snakes can be marked by scale clipping on the ventral surface for long term identification.
• Turtles can be marked by cutting notches into the edge of the carapace for long term identification.
• Crocodiles can be marked by removing part of tail scutes for long term identification.
• PIT tags can be used on medium and large reptiles for long term identification.
Numerous methods have been used to temporally and permanently mark lizards, snakes and turtles (Spellerberg and Prestt, 1978, Swingland, 1978, Blomberg and Shine, 2006), including paint, stick on dots (Beausoleil et al., 2004, Johnson, 2005), reflective bands (Roberts, 1998), radioisotopes (Thompson, 1993), toe and scale clipping, sewing on beads (Johnson, 2005), tattooing (Beausoleil et al., 2004), heat and freeze branding (Beausoleil et al., 2004), microbranding (Ehmann, 2000), cutting notches in the edge of the carapace of turtles (Ferner, 2007), removing tail scutes for crocodiles and inserting PIT tags (Beausoleil et al., 2004). Ferner (2007) reported that toe and scaling clipping, branding, painting, sewing on beads, PIT tags and VIE injected under the skin had all been used to successfully mark lizards.
The Australian Society of Herpetologists (ASH) issued a position statement on toe clipping lizards that indicated a careful evaluation of the alternative approaches was necessary for each application, including assessing the short and long-term pain and stress inflicted and handling stress. It suggested toe clipping can have multiple functions: permanent marking, providing data for DNA analysis and bone for skeletochronology.
The ASH statement suggested that photographic identification may be suitable for larger species with distinctive marking, heat or cold branding may be suitable to cauterise the tissue to prevent regeneration but probably not on very small lizards and tattooing where the mark will remain distinguishable. PIT tags can be useful but they can migrate, break or be ejected before the wound has healed. Paint and non-toxic (dyes) marks can be used as temporary identification.
ASH suggested if toe clipping was to be used, then the number of digits removed should be minimised, toes that have particular functions related to the animal’s survival should be avoided and clipping should be done with sharp, sterile scissors or a razor blade and the clip should be at the interphalangeal joint.
Snakes have been marked by scale clipping, branding and painting, PIT tags and pattern recognition (Ferner, 2007). Ferner (2007) reported that scale clipping with scissors or toenail clippers was the most commonly used method for marking snakes. In most cases about half of one of the subcaudal scales is removed leaving a permanent scar, whereas removing the entire scale will often result in regeneration and a loss of the mark. ASH (2007) suggested that scale clipping was a good permanent marking system for snakes.
PIT tags have also been used successfully to mark snakes. Keck (1994) reported no ill effects of using PIT in neonatal snakes, although they can be expensive. Winne et al. (2006) reported disposable medical cautery units were an efficient means of marking snakes, as these units were small, inexpensive, field portable and capable of making a quick and precise mark. They branded 1-3 ventral scales anterior of the cloaca in a predetermined pattern.
Notching the shell of turtles seems to be the most commonly used marking technique, although various tags have also been attached to the carapace, PIT tags have been inserted in the abdomen, and branding and painting have also been used (Ferner, 2007).
Cutting sections from one or an entire tail scute (i.e. the rigid scales on the dorsal surface of the tail)

139
was the most commonly used technique to mark crocodiles (Ferner, 2007).
Micro-chips are now routinely inserted into larger reptiles (e.g. goannas, pythons) to provide permanent identification.
We use a dark coloured permanent marker pen to mark the abdomen or dorsal surface of the tail of reptiles as a method of recording whether an individual was caught earlier in the survey (e.g. previous 7-10 days). The mark remains on rough scaled reptiles but often comes off those with a smooth surface after a couple of days.
The American Society of Ichthyologists and Herpetologists (2004) provided the following general advice in regard to various marking techniques:
• PIT tags:° Injection of the tag is relatively simple;° Aseptic procedures should be used; and° Surgical glue can be used to cover the
wound.• Toe clipping:
° Do not remove toes essential to the animals
survival (e.g. burrow, climbing, amplexus, nest excavation);
° Avoid removing two toes per foot; and° Aseptic procedures should be used.
• Scale clipping / branding:° Use surgical scissors or rapid cauterisation;° Aseptic procedures should be used; and° Use of local anaesthetic with branding or
electro-cauterisation is complicated.• Tattoos and dye markers:
° Paints should not be used to mark amphibians;
° Paints with non-toxic pigment, bases and solvents should be used; and
° VIE or inert fluorescent powder techniques that injected subcutaneously for amphibians are an alternative to toe clipping.
• Branding and tagging:° Tags that risk entanglement in undergrowth
or aquatic cover enhance risk; and° Brightly coloured tags may compromise an
animal’s camouflage.• Shell marking:
° Cutting notches or small holes in the margins of scutes on the carapace of turtles is useful.
14.4 MAMMALS
Suggested appropriate practice
• A case needs to be made that marking mammals is necessary, and where it is, then all alternative techniques should be considered and assessed.
• When marking mammals is necessary, trimming hair, the use of a dark pen to mark the tail or dyes are appropriate short term techniques.
• PIT tags are appropriate as long term markers.
Rudran (1996) and Beausoleil et al. (2004) indicated that there are multiple methods for marking mammals, including cold and heat branding, tattooing, radioisotopes, fluorescent powders, toe clipping and ear punching.
Rudran (1996) suggested that freeze branding can cause serious injuries if applied for too long and may not be permanent if applied for too short a period. Freeze and hot branding are used for domestic and farmed stock, but has generally not been used for wild mammals because of ethical concerns and the effort associated with the procedure.
Tattooing is used for domestic animals (e.g. dogs), but is generally only useful in areas without hair or fur. Tags are widely used for domestic, wild and laboratory animals.
Toe clipping and ear punching have been widely used for small mammals (Powell and Proulx, 2003); however, ear tags can be pulled out during grooming or caught in vegetation, etc, and are not generally
recommended. There is also the opportunity to secure tissue for subsequent genetic analysis during the process of inserting ear tags.
Micro-chips are now routinely inserted into domestic dogs and cats as well as wild mammals to provide permanent identification. In most circumstances for small wild mammals, the chip is inserted between the shoulder blades.
We use a dark coloured permanent marker pen to mark the tail of small mammals as a method of recording whether an individual was caught earlier in the survey (e.g. previous 7-10 days) and we use micro-chips for permanent marking where long term monitoring is the objective. Beausoleil et al. (2004) suggested removing hair or fur was a quick, easy and highly visible technique for short term identification. Powell and Proulx (2003) suggested dyes are useful for mammals with a light coloured pelage.