Embed Size (px)
Citation preview
Terrence MullensSan Jose State UniversityDepartment of Meteorology

Weather: Can be described as the CURRENT state of the atmosphere at a given location. Changes occur by the minute. Examples: Current Temperature, wind
speed, etc. Climate: Can be described as the state
of the atmosphere over a given time. Examples: Average Temperature, Annual
Rainfall, etc.Meteorology studies Weather, Climatology studies Climate

State Variable: Simply a variable describing the state of
the atmosphere. Examples: Temperature, Humidity, Wind
Speed, Rain-rate/Total Rainfall Used in both Meteorology and Climatology▪ Meteorology: Current Temperature, Current
Humidity▪ Climatology: Average Temperature, Average
Humidity
A good definition of extreme weather: Weather that involves an exceptionally
high/low state variable. (Such as a heat wave, or downpour)
A weather event that is an extreme of the climatological history.
In more laymen’s terms: Extreme Weather events are rare weather events that cause damage or involve some kind of major inclimate state.
These events are short term…

May involve long periods of extreme weather events or periods of above occurrence of extreme weather events (like Tornado outbreaks or Hurricane Seasons)
Longer-term events that involve a major departure from the average state variable. Droughts: Long Periods of very little rainfall Deluges: The opposite Heat Waves: Long Periods of hot weather.
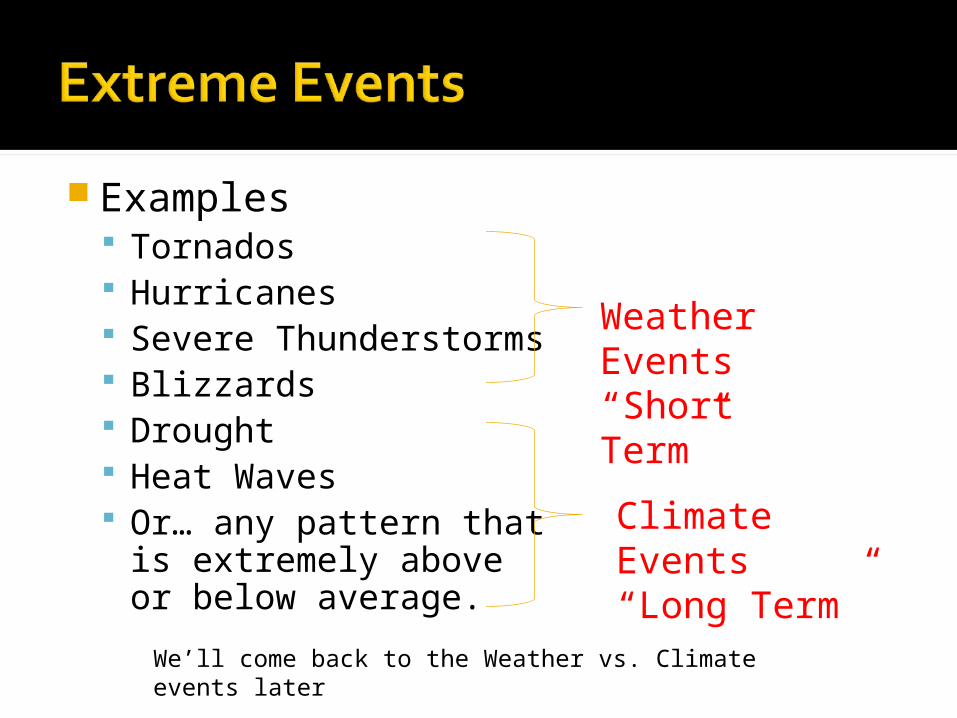
Examples Tornados Hurricanes Severe Thunderstorms Blizzards Drought Heat Waves Or… any pattern that is
extremely above or below average.
Weather Events“Short Term”
Climate Events“Long Term”
We’ll come back to the Weather vs. Climate events later

Typically, long periods of below-average occurrences of extreme weather wouldn’t be considered “extreme” because they do not involve higher levels of damage/destruction or harm.
These are considered a relief!

Our Earth has an uneven distribution of heat and moisture both vertically and horizontally.
A Fundamental Principle: When things are unbalanced, they will attempt to achieve balance. Therefore, heat and moisture are constantly moving around in our atmosphere in a feeble attempt to reach an equilibrium.
Much more complicated than this…


Take Home Message: WEATHER IS CAUSED BY UNEVEN HEATING OF THE EARTH We will return to this when asking “How
does climate change affect extreme weather?”
This distribution of heating/energy feeds extreme weather.


Form as warm, moist air rises and then cools and condenses, creating Cumulus clouds.
Not extreme in themselves
Happen all the time (though not here in San Jose… otherwise we wouldn’t make such a big deal about them)
Provide much of the summer rainfall in the US

• As the air condenses, it gives off “Latent Heat,” causing air to continue to rise.
• The cumulus cloud becomes a “Cumulus Congestus” cloud: A towering Cumulus
• As the cloud grows, the top begins to freeze and spread out. Cloud droplets grow larger. Eventually, the cloud becomes a Cumulonimbus cloud… Where thunderstorms come from

Eventually, the weight of the droplets becomes too large to be supported by the updrafts, and rain begins to fall.
Additionally, cooler air from the upper troposphere begins to “entrain” the cloud, creating a downdraft of rain and a “Gust Front”
Eventually, the cool air cuts off the warm, moist updraft, choking out the storm


These ARE extreme weather! Caused when there is more
fuel, combined with some kind of vertical wind shear (changes in wind speed with height), which promotes updrafts!
Keeps precipitation downwind of the storm. This allows for the updrafts, which are the fuel to the storm, to survive, strengthening the storm.
These storms produce hail, high winds, substantial lightning, and TORNADOS!!!!
Also produce some really awesome clouds (Wall Clouds, Mammatus, etc)

Caused by an uneven distribution of charged particles.
Typically + at the top and – at the bottom of the cloud.
+ Charges at the surface complete the current.


The Updrafts of a severe thunderstorm are so strong, that rain droplets are pushed up into the top of the cloud, freeze and fall to the ground… only to be picked back up by the updraft, and frozen again, adding another layer.
Eventually, the hail gets too heavy, and falls to the ground.

Golf Ball sized hail! Imagine getting hit by that!
But…

SOFTBALL SIZED HAIL!!!!!!!!
Golf ball size will hurt… Softball size can destroy!!!!!


Strong, rotating column of wind around a low-pressure area that reaches the ground. If the column does not reach the
ground, it is called a Funnel Cloud Diameters can range from
300-2000 ft Wind speeds can exceed
200 mph! Typically last only a few
minutes, and travel several miles… but not always.
Highest frequency is in the United States
Typically occur in the United States in Mid-late Spring (April – June), but can occur any time

Created by Dr. Theodore Fujita in the late 1960’s, and was updated in 2007 as the Enhanced Fujita Scale.
Rates tornadoes based off of damage caused.
The Scale goes from EF0, to EF5
The original scale went from F0 to F6
Typically, the stronger tornados are less frequent.


Tornado Alley:Texas, Colorado, Oklahoma, Kansas, Nebraska and South Dakota


Typically, tornado occurrences are not isolated, but instead are a part of a tornado outbreak.
A tornado outbreak is when multiple tornados occur over a given region, usually due to a storm system.
Most of the death and destruction due to tornados occurs during a tornado outbreak.

One of the deadliest tornado outbreaks in history, and was the largest outbreak in history.
336 confirmed tornados (11 EF4’s and 4 EF5’s)
346 confirmed deaths.
Alabama was particularly hit hard.

Dallas metropolitan area.
21 confirmed tornados (3 EF2’s and 1 EF3).
No confirmed deaths.
Proof that major cities are not “Tornado Proof.”

April 14-16, 2011: From the Midwest to the Carolina coast.
February 5-6, 2008 (Super Tuesday): Arkansas, Tennessee, Kentucky and Alabama
May 3, 1999: Oklahoma, Kansas April 3-4, 1974: Practically the entire
eastern US; Called the “Super Outbreak” March 18, 1925: Missouri, Illinois,
Indiana. Deadliest US Outbreak in history.

The largest-scale single extreme weather event.
Typically occur from June to November in the Atlantic.
Called “Hurricane Season”
Form in the tropical regions, where there is a lot of HEAT.
Typically move from South/East to North/West
Fueled by warm ocean temperatures and ideal atmospheric conditions
Low upper level wind shear, and moist air

Tropical Depression: A weak “warm cored” center of low pressure with maximum wind speeds below 39 mph All Hurricanes start out as tropical depressions
Tropical Storm: A stronger center of low pressure with maximum winds of 39-73 mph
Hurricane: A very strong tropical low pressure center with maximum wind speeds above 74 mph!


Cooler waters kill Hurricanes!!!!


The most damaging Hurricane in United States History!
Struck the eastern portion of Louisiana on August 29, 2005
Maximum Strength: 175 mph winds (Cat 5)
Strength at Landfall: 125 mph winds (Cat 3)
Total Damage: $108 BILLION
Total Deaths: ~1700

Hurricane Ivan (Cat 3 at landfall) $18.1 billion damage, 123 deaths
Hurricane Charley (Cat 4 at landfall) $18.6 billion damage, 35 deaths
Hurricane Andrew (Cat 5 at landfall) $40.7 billion damage, 65 deaths
Hurricane Hugo (Cat 4 at landfall) $14.1 billion damage, 61 deaths
Total for these four storms… $91.5 billon damage, 283 deaths… MUCH LESS
THAN KATRINA… WHY??? Katrina wasn’t an exceptionally strong storm at
landfall… but it hit the worst possible place… New Orleans!

Climate events are long term (in weeks or months) compared to single weather events.
Examples: Droughts, Heat Waves, Hurricane/Tornado seasons.
Since no one weather event defines the climate, climate events are inspected for evidence of climate change.
Examples: The occurrence/severity of heat waves, the number of storms in a hurricane season, etc.

These events are a much greater sign of climate change because they are large scale events in which “chance” can be ruled out.
I.e. One bad hurricane or tornado outbreak or any extreme weather event is not good evidence for climate change, but a bad hurricane season, or a bad tornado year can be… especially if it seems that they are becoming more common…
2003 European heat wave One of the deadliest heat waves in
European history. Many regions were as much as 18
degrees F above average!!! Affected Western and Central Europe. Over 40,000 Europeans died!!!! Similar event in Russia, 2010

2005 Atlantic Hurricane Season The Largest number of Named Storms in
recorded History: 27 Named Storms (and One unnamed!)▪ Average Season is 10-12 named storms!!!
Noteable Storms: Hurricanes Emily (Cat 5), Katrina (Cat 5), Rita (Cat 5), and Wilma (Cat 5)… That’s FOUR Category 5 storms in One Year!!!!!
WE RAN OUT OF NAMES!!!!!!! ▪ Used Greek Letters for the remaining storms… and
went pretty well into that list (Tropical Storm Zeta)


El Nino: A warmer than average body of warm water in the eastern equatorial Pacific
La Nina: the opposite…


Explain two reasons for the major increase in reported number of natural disasters…
(Hint, compare frequency of Earthquakes to other disasters…)

The text I blocked out from the last slide…

Recall the graph we saw in the first week of class… Remember the sharp increase in temperatures over the past century…
Now think about the graph we just saw…
Coincidence: I think not!

What causes weather: IMBALANCE… The sun heats the Earth
UNEVENLY… That’s why the temperature in Fargo, ND is different from the Temperature in Long Beach, CA.
A major scientific principle… Balance is always being attempted… So the energy from the sun is distributed around the earth… this happens through weather systems such as fronts, low pressure systems, and Hurricanes… which is why hurricanes typically travel from the equator towards the poles…

Greenhouse gasses trap in more heat, so there is more energy being distributed. Sort of like pouring fuel into a fire… The
increase in heat means an increase in fuel… which means two things:▪ More Storms/events▪ Stronger Storms/events

Storms are in theory getting stronger… and extreme events are getting more frequent and more severe. Events like the 2004/2005 Hurricane
Seasons, the 2003 European Heat Wave, and the 2010 Tornado Outbreaks are becoming more frequent…
Because this has only been happening over the past few decades, rushing to conclusions is unwise… but things are looking pretty grim.


Many Movies/Documentaries have been created to either address or sensationalize the issue of Climate Change…
Some of these I highly recommend: Six Degrees can Change the World… a look at
how our Earth would change if the earth’s average temperature warmed up by Six degrees.
An Inconvenient Truth… We’ve already talked about this one in class…
Many Others

Sensationalized Films The Day After Tomorrow: A shutdown of the
“Thermohaline Conveyor” would cause Hurricane-like blizzards over New York and Tornado Outbreaks in Los Angeles… While massive climate shifts could occur if the Thermohaline Conveyor shut down… this is a little dramatic… to say the least
Category 6: Day of Destruction. Probably the worst weather movie in history: In this movie, Hurricanes are forming from Arctic low pressure systems over the Great Lakes…
The Thermohaline Conveyor… A complex current that relies heavily on
the of salinity water. Carries heat up to the North Atlantic


What’s happening in the North Atlantic right now?
As polar ice continues to melt, it dumps fresh water into the ocean, which could eventually slow down or even stop the current’s flow.
This might have caused the “Little Ice Age”
A shutdown would cause Abrupt Cooling

http://www.youtube.com/watch?v=02NRKzemXYE

The Shutdown of the Thermohaline Conveyor would cause abrupt cooling, especially in Europe.
This change could occur in as little as ten years after the shutdown (not a few days like The Day After Tomorrow)
Suddenly, many northern countries would almost become uninhabitable. Major political implications Wars

Compare an extreme weather event to an extreme climate event. Give one example of each.
Other than Climate Change, why might the frequency of reported natural disasters be increasing?
Did you understand today’s lecture. Was it too much material? Too little? Suggestions?

Watch the Movie “Six Degrees Could Change the World” and: List one impact for each degree-level
increase… (e.g. What would happen in the world +1 degree? +2 degrees? etc…)
Even though six degrees doesn’t seem like much. Why would such a change bring about disaster?
Can’t get the movie? Check out: http://www.youtube.com/watch?v=TKo4TSq40l0. It’s also available on Netflix.