Embed Size (px)
Citation preview

TERMPOL 3.6 – SPECIAL UNDERKEEL CLEARANCE SURVEY
Trans Mountain Expansion Project
Prepared for:
Prepared by:
777 W. Broadway, Suite 301 Vancouver, BC, V5Z 4J7 November 26, 2013

TERMPOL 3.6 – SPECIAL UNDERKEEL CLEARANCE SURVEY
TRANS MOUNTAIN EXPANSION PROJECT
November 26, 2013
M&N Project No. 7773
Prepared by: Reviewed by:
MOFFATT & NICHOL MOFFATT & NICHOL
James Traber, EIT. Ron Byres, P.Eng.
Staff Engineer Senior Project Manager
Revision Purpose of Issue Date Author Reviewed Approved
0 For TRC Review November 26, 2013 JT RB

Trans Mountain Expansion Project November 26, 2013
Termpol 3.6: Special Underkeel Clearance Survey i
TABLE OF CONTENTS 1. OBJECTIVES .................................................................................................................................................... 1
1.1 CONTEXT ............................................................................................................................................................. 1
2. FACTORS AFFECTING REQUIRED WATER DEPTH .............................................................................................. 2
2.1 TIDES ................................................................................................................................................................... 3 2.2 SEDIMENTATION AND DREDGING ....................................................................................................................... 4 2.3 VESSEL DRAUGHT ................................................................................................................................................ 4
2.3.1 Dynamic Ship Motions ................................................................................................................................. 4 2.3.2 Vessel Squat ................................................................................................................................................ 5
2.4 VESSEL SAG AND HOG ......................................................................................................................................... 7 2.5 VESSEL TRIM ........................................................................................................................................................ 8 2.6 SUMMARY OF CUMULATIVE DRAUGHT EFFECTS DUE TO SHIP MOTIONS .......................................................... 8 2.7 PORT METRO VANCOUVER REGULATIONS .......................................................................................................... 9 2.8 CHART DATUM AND HYDROGRAPHIC SURVEYS ................................................................................................ 10 2.9 SEA BOTTOM CHARACTERIZATION ................................................................................................................... 11 2.10 MANOEUVRABILITY IN SHALLOW WATER ....................................................................................................... 12 2.11 OPERATIONAL / PILOTING PLAN ...................................................................................................................... 12
3. REFERENCES .................................................................................................................................................. 14
APPENDIX A: ROUTE MAPS AND WATER DEPTHS .............................................................................................. 15

Trans Mountain Expansion Project November 26, 2013
Termpol 3.6: Special Underkeel Clearance Survey ii
LIST OF FIGURES Figure 2‐1: Components of Waterway Depth ................................................................................................................ 2 Figure 2‐3: Predicted tide (m CD) at Burrard Inlet Coal Harbour for January 2012 ....................................................... 3 Figure 2‐4: Vessel motions (degrees of freedom) ......................................................................................................... 5 Figure 2‐5: Under Keel Clearance at narrowest point of MRA transit (Pacific Pilotage Authority) ............................. 10 Figure A‐1: Westridge Terminal, Depth in metres to CD (Chart 3494) ........................................................................ 16 Figure A‐2: Vancouver Harbour East, Depth in metres to CD (Chart 3494) ................................................................. 17 Figure A‐3: Vancouver Harbour West, Depth in metres to CD (Chart 3493) ............................................................... 18 Figure A‐4: Burrard Inlet, Depth in metres to CD (Chart 3463) ................................................................................... 19 Figure A‐5: Strait of Georgia, Depth in Fathoms to CD (Chart 3001) ........................................................................... 20 Figure A‐6: San Juan Islands, Depth in Fathoms to CD (Chart 3001) ........................................................................... 21 Figure A‐7: Victoria Area, Depth in Fathoms to CD (Chart 3001) ................................................................................ 22 Figure A‐8: Juan de Fuca Strait, Depth in Fathoms to CD (Chart 3001) ....................................................................... 23
LIST OF TABLES Table 2‐1: Characteristic water levels and datums in Burrard Inlet .............................................................................. 4 Table 2‐2: Predicted squat values in metres, as a function of water depth and vessel speed ...................................... 6 Table 2‐3: Minimum water depth for various vessel draughts ...................................................................................... 9 Table 2‐4: Minimum water depth available at Chart Datum ....................................................................................... 11

Trans Mountain Expansion Project November 26, 2013
Termpol 3.6: Special Underkeel Clearance Survey 1
1. OBJECTIVES
In accordance with the Termpol Review Process (TRP) Guidelines, TP743E 2001, the objective of this study is “to consider all relevant factors which may affect underkeel clearance and to ensure that adequate water depths are available for safe transit of the design vessel.”
1.1 CONTEXT
The largest vessels associated with the TMEP project are 120,000 DWT Aframax‐class tankers having approximate characteristics as follows:
• Length overall 250 m
• Beam 44 m
• Maximum draught 15.5 m
• TMEP maximum draught 13.0 m
The 13.0m maximum draught anticipated for the TMEP vessels is less than the typical fully‐laden draught for Aframax‐class tankers; this is due to draught restrictions in the Second Narrows Movement Restricted Area (MRA).
Restrictions on tanker movements to and from the Westridge Marine Terminal are stated in the PMV’s Harbour Operations Manual Second Narrows MRA Regulations. The maximum immersed depth (i.e., draught) for vessels transiting the Second Narrows is limited by PMV’s MRA rules to 13.5 m. In practice the allowable draught is currently limited to 13.0 m by the PPA as part of a phased implementation of the MRA rules following their revision in 2010 (Pacific Pilotage Authority, 2010). It is reasonable to expect that the phased implementation will be complete by the time the Project comes into service and the 13.5 m limit will be in effect.
Existing vessel traffic through the established shipping lanes in the Juan de Fuca Strait, Strait of Georgia, and Burrard Inlet includes vessels larger and of deeper draught than 13.5m. For example, Capesize dry bulk carriers visiting Westshore Terminals have draughts of up to 21 m, while Neptune Bulk Terminals in Burrard Inlet can accommodate vessels over 17m in draught. The limiting depth in First Narrows is 15.2m at low tide. Since the available water depths along the route are already well proven for vessels larger than the TMEP traffic, a special underkeel clearance survey is not necessary for the majority of the sailing route. Therefore, this survey includes only a brief description of the water depths for most of the established route, and focuses primarily on the portion of the route from Second Narrows to the Westridge project site.

Trans Mountain Expansion Project November 26, 2013
Termpol 3.6: Special Underkeel Clearance Survey 2
2. FACTORS AFFECTING REQUIRED WATER DEPTH
The Termpol guidelines state that “nominally, the design ship’s minimum underkeel clearance should be fifteen (15) percent of its maximum permissible draught or meet the requirements established and published by the appropriate government authority for a specific waterway.” Underkeel clearance is the distance between the deepest part of the vessel and the seabed. A vessel underway can be trimmed either by the head or the stern, and the deepest part is taken as the nominal draught. The actual draught can vary from the nominal draught due to such effects as vessel squat or wave action. Similarly, the seabed elevation in a channel dredged to a specific nominal depth can vary somewhat due to dredging tolerances and survey accuracy. The underkeel clearance allowance is intended to provide the necessary depth of water for safe navigation and reasonable ease of manoeuvring, while maintaining an allowance to account of the effects of squat and survey tolerances. Components of waterway depth are shown in Figure 2‐1.
Figure 2‐1: Components of Waterway Depth1
1 From (Fisheries and Oceans Canada ‐ Canadian Coast Guard, June, 1999)
Trans Mountain Expansion Project November 26, 2013
Termpol 3.6: Special Underkeel Clearance Survey 3
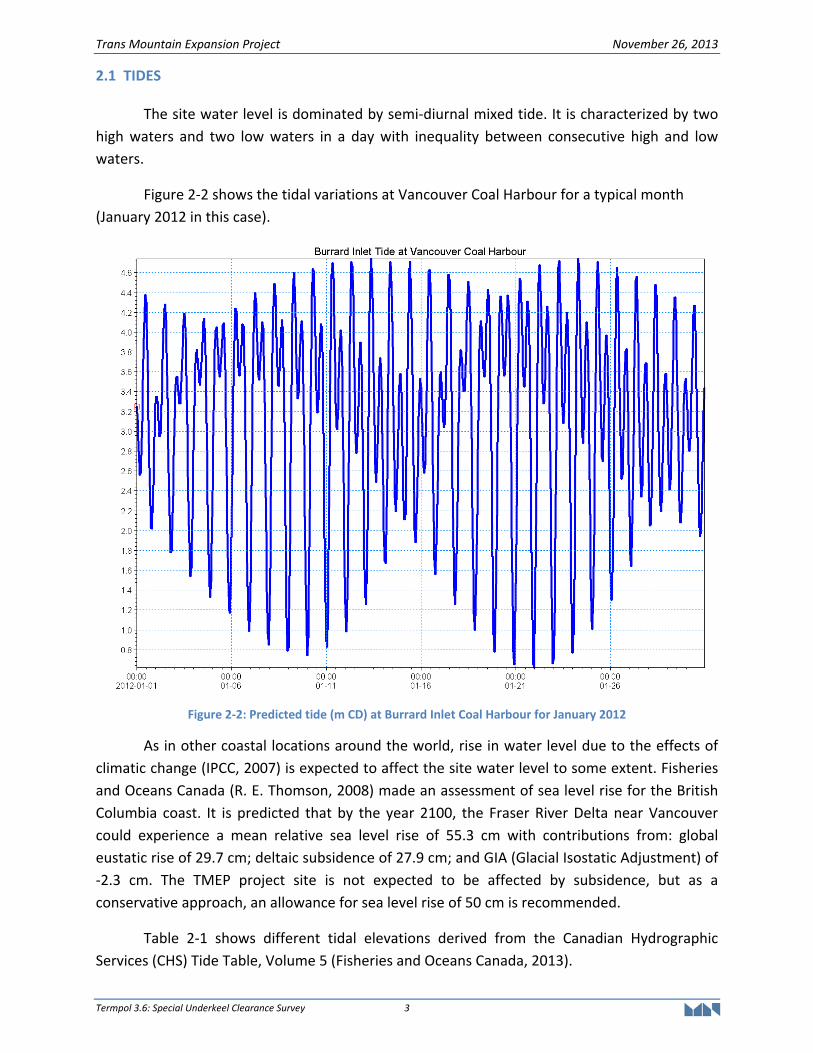
2.1 TIDES
The site water level is dominated by semi‐diurnal mixed tide. It is characterized by two high waters and two low waters in a day with inequality between consecutive high and low waters.
Figure 2‐2 shows the tidal variations at Vancouver Coal Harbour for a typical month (January 2012 in this case).
Figure 2‐2: Predicted tide (m CD) at Burrard Inlet Coal Harbour for January 2012
As in other coastal locations around the world, rise in water level due to the effects of climatic change (IPCC, 2007) is expected to affect the site water level to some extent. Fisheries and Oceans Canada (R. E. Thomson, 2008) made an assessment of sea level rise for the British Columbia coast. It is predicted that by the year 2100, the Fraser River Delta near Vancouver could experience a mean relative sea level rise of 55.3 cm with contributions from: global eustatic rise of 29.7 cm; deltaic subsidence of 27.9 cm; and GIA (Glacial Isostatic Adjustment) of ‐2.3 cm. The TMEP project site is not expected to be affected by subsidence, but as a conservative approach, an allowance for sea level rise of 50 cm is recommended.
Table 2‐1 shows different tidal elevations derived from the Canadian Hydrographic Services (CHS) Tide Table, Volume 5 (Fisheries and Oceans Canada, 2013).

Trans Mountain Expansion Project November 26, 2013
Termpol 3.6: Special Underkeel Clearance Survey 4
Table 2‐1: Characteristic water levels and datums in Burrard Inlet
Parameter Vancouver Tide Table
Vancouver Ch #3494
Port Moody Tide Table
Deep Cove Tide Table
Deep Cove Ch #3494
EHHW (m CD) 5.60 NA NA NA NA
HHWLT (m CD) 5.00 5.0 5.12 5.15 5.1
HHWMT (m CD) 4.40 4.4 4.46 4.46 4.4 MWL (m CD) 3.10 3.1 3.08 3.14 3.1 Chart Datum (CD) 0.00 0.0 0.00 0.00 1.0
LLWMT (m CD) 1.10 1.1 1.07 1.13 1.1 LLWLT (m CD) ‐0.10 0.0 ‐0.10 0.05 0.2
ELLW (m CD) ‐0.30 NA NA NA NA
EHHW: Extreme highest high water HHWLT: Higher High Water Large Tide HHWMT: Higher High Water Mean Tide MWL: Mean Water Level CD: the plane of Lowest Normal Tides to which charts and water levels are referred LLWMT: Lower Low Water Mean Tide LLWLT: Lower Low Water Large Tide ELLW: Extreme Lowest Low Water For the Vancouver Harbour area, Geodetic Datum is 3.1 m above CD (see BC Ministry of Env., 1995)
The difference of 0.6 m between EHHW and HHWLT (Table 2‐1) is an indication of storm surge/seiche experienced in Vancouver Harbour.
2.2 SEDIMENTATION AND DREDGING
Apart from the Seymour River near Second Narrows, there are few large sources of sediment inflow into the inner portions of Burrard Inlet. Historically, sedimentation has not been a significant issue at the Westridge terminal site, and this is not expected to change with the TMEP development.
2.3 VESSEL DRAUGHT
2.3.1 Dynamic Ship Motions
Ships travelling in waves at sea may experience motion along or about all three principle axes, resulting in up to six degrees freedom as shown in Figure 2‐3. Three of the degrees of freedom (surge, sway, and heave) are translational motions along the respective axes, while three (roll, pitch, and yaw) are rotational motions about the axes. Motions that create a vertical movement of the ship (i.e. heave, roll, and pitch) affect the net draught of the vessel, reducing the net underkeel clearance available. In open ocean where wave heights and periods can be large, the resulting vessel motions can be substantial. However within the relatively sheltered waters of the Juan de Fuca Strait and Strait of Georgia, wave‐induced motions are not significant relative to the available water depth. Within Burrard Inlet where the water depths are shallower, the wave heights and periods are even smaller, and too small to appreciably affect the vessel draught.

Trans Mountain Expansion Project November 26, 2013
Termpol 3.6: Special Underkeel Clearance Survey 5
Figure 2‐3: Vessel motions (degrees of freedom)
2.3.2 Vessel Squat
Squat is defined as the increase in draught, or reduction in underkeel clearance, between a vessel at rest and when underway caused by the flow of water past the moving ship. The relative velocity between the ship and the surrounding water produces a pressure change along the ship that in turn results in a downward vertical force and moment on the ship.
Squat is typically different along the length of the ship, with the maximum values at the bow.
Several formulations exist for predicting squat, and the formula presented by (Eryuzlu, 1994) is chosen here since it is applicable to channels and is also exclusively used by the CCG (Fisheries and Oceans Canada, 2001).
Their formula for bow squat, SbE2, is defined as:
b
2.9722.2892
bE2 KTh
gTVs
Th0.298S
−
⎟⎠⎞
⎜⎝⎛
⎟⎟⎠
⎞⎜⎜⎝
⎛=
Where,
h is the channel depth, in m;
T is the ship draught, in m;
Vs is the ship speed, in m/s;
g is the acceleration due to gravity, 9.81 m/s2;

Trans Mountain Expansion Project November 26, 2013
Termpol 3.6: Special Underkeel Clearance Survey 6
Kb =
⎪⎪⎩
⎪⎪⎨
⎧
≥
<
9.61BW1.0
9.61BW
W/B3.1
B is the beam of the vessel, in m;
W is the effective width of the channel, in m,
= [7.7 + 45(1‐CWP)2]∙B; (W = 363m) and,
CWP is the water plane coefficient,
= Cb/(0.471+0.551*Cb) (Bertram, 1998); (Cwp = 0.89 for Cb = 0.82)
For an Aframax vessel with a beam of 44 m, the predicted squat values for a range of water depths and ship speeds are presented in Table 2‐2. For a conservative operational evaluation, the estimated bow squat for a ship speed of 12 knots and a minimum water depth of 35 m is 0.41 m.
Table 2‐2: Predicted squat values in metres, as a function of water depth and vessel speed
Predicted Vessel Squat (m) Water Depth
(m) Speed (Knots)
4 5 6 7 8 9 10 11 12 13 14 15 16 30 0.04 0.06 0.10 0.14 0.19 0.25 0.32 0.39 0.48 0.58 0.68 0.80 0.93
31 0.04 0.06 0.09 0.14 0.18 0.24 0.31 0.38 0.46 0.56 0.66 0.77 0.90
32 0.04 0.06 0.09 0.13 0.18 0.23 0.30 0.37 0.45 0.54 0.64 0.75 0.87
33 0.04 0.06 0.09 0.13 0.17 0.23 0.29 0.36 0.44 0.52 0.62 0.73 0.84
34 0.03 0.06 0.09 0.12 0.17 0.22 0.28 0.35 0.42 0.51 0.60 0.71 0.82
35 0.03 0.06 0.08 0.12 0.16 0.21 0.27 0.34 0.41 0.50 0.59 0.69 0.80
36 0.03 0.05 0.08 0.12 0.16 0.21 0.26 0.33 0.40 0.48 0.57 0.67 0.78
37 0.03 0.05 0.08 0.11 0.15 0.20 0.26 0.32 0.39 0.47 0.56 0.65 0.76
38 0.03 0.05 0.08 0.11 0.15 0.20 0.25 0.31 0.38 0.46 0.54 0.63 0.74
39 0.03 0.05 0.08 0.11 0.15 0.19 0.24 0.30 0.37 0.45 0.53 0.62 0.72
40 0.03 0.05 0.07 0.11 0.14 0.19 0.24 0.30 0.36 0.44 0.52 0.60 0.70
41 0.03 0.05 0.07 0.10 0.14 0.18 0.23 0.29 0.35 0.42 0.50 0.59 0.68
42 0.03 0.05 0.07 0.10 0.14 0.18 0.23 0.28 0.35 0.41 0.49 0.58 0.67
43 0.03 0.05 0.07 0.10 0.13 0.17 0.22 0.28 0.34 0.41 0.48 0.56 0.65
44 0.03 0.04 0.07 0.10 0.13 0.17 0.22 0.27 0.33 0.40 0.47 0.55 0.64
45 0.03 0.04 0.07 0.09 0.13 0.17 0.21 0.26 0.32 0.39 0.46 0.54 0.62
46 0.03 0.04 0.06 0.09 0.13 0.16 0.21 0.26 0.32 0.38 0.45 0.53 0.61
47 0.03 0.04 0.06 0.09 0.12 0.16 0.20 0.25 0.31 0.37 0.44 0.52 0.60
48 0.02 0.04 0.06 0.09 0.12 0.16 0.20 0.25 0.30 0.36 0.43 0.51 0.59
49 0.02 0.04 0.06 0.09 0.12 0.15 0.20 0.24 0.30 0.36 0.42 0.50 0.57
50 0.02 0.04 0.06 0.08 0.12 0.15 0.19 0.24 0.29 0.35 0.42 0.49 0.56

Trans Mountain Expansion Project November 26, 2013
Termpol 3.6: Special Underkeel Clearance Survey 7
2.4 VESSEL SAG AND HOG
Structurally, the ship acts like a horizontal girder, and like all girders the ship will deflect (bend) under the influence of loads. Since the weight and the buoyancy of the ship are not equally distributed along the length of the ship, there are net distributed loads acting on the hull girder. These loads, in addition to those induced by waves, result in bending moments along the length of the ship and a corresponding deflection in the vertical direction. As a result, the available underkeel clearance will be reduced. The IACS Joint Tanker Project Rules (IACS, January 2006) define several parameters for determining a vessel’s sagging and hogging deflections based on the design loads (sagging refers to the curved profile of a girder with the concave side facing upward; hogging is the inverse with concave side facing downward). The estimated deflections are based on load and strength parameters used to design the ship.
The still water bending moment, in units of kN‐m, is given by:
( )0.7CBL0.05185CM b2
wvmidseaminsw +−=−−−
Where,
Cwv = 10.75 – [(300 – L)/100]3/2 for 150 < L ≤ 300;
Cwv = 10.40 for L = 250m
Cb, the block coefficient, is a measure of the how closely the hull approximates a rectangular block (for the design Aframax vessel, taken to be 0.82); and,
L and B are the length and breadth, respectively of the design vessel.
The wave bending moment, in units of kN‐m, is given by:
( )0.7CBLC0.11ffM b2
wvvwvprobsagwv +−= −−
Where,
fprob is a probability factor taken as 1.0 to correspond with a 10E‐8 probability level;
fwv‐v is a distribution factor for the wave bending moment along the hull of the vessel. At mid‐ships, where the maximum total moment occurs, fwv‐v is equal to 1.0.
The minimum required hull girder inertia based on the design bending moments, in units of m4, is given by:
( ) 8b
3wvinv 100.7CBL2.7CI −
− +=m
Where Cb is as defined above.
The resulting sag deflection is calculated as follows:

Trans Mountain Expansion Project November 26, 2013
Termpol 3.6: Special Underkeel Clearance Survey 8
minv
2tot
10EILM
Δ−
=
Where,
Mtot = Msw‐min‐sea‐mid + Mwv‐sag;
E is the elastic modulus of steel taken as 200,000,000 kN/m2.
The corresponding decrease in underkeel clearance due to sagging is estimated to be one‐half of the calculated deflection, or 0.37 m for the design vessel under design load. Under calm conditions, there would not be a contribution due to wave loading, decreasing the calculated deflection to 0.12 m.
For an Aframax tanker loading at Westridge Terminal to less than design load, the ship’s cargo officer is able to distribute the cargo in a manner that minimizes the actual deflection. From a practical standpoint, the effect of sag on a partially loaded Aframax tanker can therefore be considered negligible.
2.5 VESSEL TRIM
A partially loaded Aframax tanker in a departure condition will be the governing case for underkeel clearance. A tanker in a full load departure condition is typically loaded at even keel with no trim, or slightly trimmed by the bow.
For the purpose of the underkeel clearance survey, a trim of 0.5 m by the bow or stern can be assumed when no ship‐specific data is available. This small adjustment in the draught at the bow or stern will not limit the navigability of the vessel within the proposed deep water routes.
Present operating rules for the Second Narrows MRA call for vessels over 12.5m in draught to be trimmed 15 cm by the stern when transiting the Second Narrows (Port Metro Vancouver, 2010).
2.6 SUMMARY OF CUMULATIVE DRAUGHT EFFECTS DUE TO SHIP MOTIONS
The required underkeel clearance for safe transit of the design vessel should be based on the actual loaded draught of the design vessel plus the cumulative increases due to the effects discussed above.
The available water depths through the Juan de Fuca Strait and Strait of Georgia are well in excess of that required for laden Aframax tankers, proven through past experience as well as the fact that vessels of even deeper draught routinely travel these waters.
The maximum draught of the design vessel at reduced load for the confined channel area (i.e. within Burrard Inlet) is calculated as follows:
Maximum loaded draught = 13.5 m
Maximum estimated dynamic ship motions = Negligible

Trans Mountain Expansion Project November 26, 2013
Termpol 3.6: Special Underkeel Clearance Survey 9
Maximum estimated squat = 0.15 m
Maximum estimated sag (static only) = Negligible
Maximum estimated trim = 0.15 m
Total Dynamic Draught = 13.80 m → say 14 m
Minimum underkeel clearance recommendations from the TERMPOL Guidelines include 15% of the vessel’s draught when manoeuvring, which is intended to account for the dynamic effects above. Therefore the minimum water depth for the channels and approaches is simply 15% more than the nominal static draught. The minimum water depths for various vessel draughts is therefore as shown in Table 2‐3. The project maximum design draught is 13.5m, so the required water depth for 15% UKC is 15.5m. For 10% UKC, the minimum water depth is 14.9m.
Table 2‐3: Minimum water depth for various vessel draughts
Vessel draught
(m)
Minimum water depth for 15% UKC
(m)
Underkeel clearance
At 15% UKC (m)
Minimum water depth for 10% UKC
(m)
Underkeel clearance
At 10% UKC (m)
12.0 13.8 1.8 13.2 1.2
12.5 14.4 1.9 13.8 1.3
13.0 15.0 2.0 14.3 1.3
13.5 15.5 2.0 14.9 1.4
14.0 16.1 2.1 15.4 1.4
14.5 16.7 2.2 16.0 1.5
15.0 17.3 2.3 16.5 1.5
2.7 PORT METRO VANCOUVER REGULATIONS
Port Metro Vancouver Movement Restricted Area (MRA) Regulations take precedence within the port. The MRA has established special UKC rules for tankers and other large vessels transiting the Second Narrows. These rules establish Navigation Channel Clearances and Transit Speed limitations for Second Narrows as described below:
a. The minimum channel width required for transiting the MRA is 2.85 times the vessel beam.
b. A minimum 10% UKC clearance calculated using the static draught, i.e. the draught of the vessel when it is not moving through the water,
c. Tankers loaded to 12.5 m or greater shall be trimmed 15 cm by the stern.
d. Speed through water no greater than 6 knots, except when safety of navigation requires otherwise.

Trans Mountain Expansion Project November 26, 2013
Termpol 3.6: Special Underkeel Clearance Survey 10
Figure 2‐4: Under Keel Clearance at narrowest point of MRA transit (Pacific Pilotage Authority)
2.8 CHART DATUM AND HYDROGRAPHIC SURVEYS
The most recent published hydrographic charts for Burrard Inlet were issued by the Canadian Hydrographic Service (CHS). Periodic corrections are made though the weekly and annual Notices to Mariners published by the Canadian Coast Guard. Excerpts from the charts along the route are provided in Appendix A.
In addition to the published charts, the CHS has obtained recent multi‐beam survey data for Burrard Inlet, the results of which have not yet been published. There are also some privately commissioned hydrographic surveys in the vicinity of specific terminals, including a survey of the Westridge berth area completed in 2005.
Water depths and contours shown on the charts are shown relative to Chart Datum (CD), which is defined as the plane of Lowest Normal Tides (LNT). LNT is taken as the lowest predicted astronomical tide of the year, averaged over the 19‐year tidal cycle. On roughly half of the years in the 19 year cycle there will be at least one low tide that is lower than chart datum (i.e. a “negative tide”), when the actual water depths are slightly less than the published depth. For the Vancouver Harbour area, Chart Datum is 3.1 m above Geodetic Datum (see BC Ministry of Environment, 1995).
For the majority of the sailing route routes the minimum water depths are well in excess of that required to provide 15% UKC for the design vessel. In a few local areas, notably First and Second Narrows, as well as the vicinity of the Westridge terminal, available water depths become the limiting constraint on vessel draughts.

Trans Mountain Expansion Project November 26, 2013
Termpol 3.6: Special Underkeel Clearance Survey 11
Table 2‐4: Minimum water depth available at Chart Datum
Route Segment Least water depth in channel (m)
1 15.5
2 15.0
3 30.0
4 115.0
5 31.0
6 80.0
7 70.0
In the immediate vicinity of the proposed terminal, water depths range from more than 20m in the middle of the channel to zero at the shoreline. The berth layout will be based on providing a minimum water depth of 10% UKC for a vessel draught of 13.5m, or 14.9m. Including a survey tolerance and sedimentation allowance, a target depth of 15.0m is proposed for the berth face (measured at the compressed fender face line, including an allowance for a vessel making contact at an angle of up to 6 degrees relative to the berthing line) A diagram of the proposed site configuration with the most recent hydrographic survey contours is shown in Appendix A.
2.9 SEA BOTTOM CHARACTERIZATION
For most of the navigation route the water depths are deep enough and the channel wide enough that vessel contact with the seabed is impossible or (at most) a remote possibility. If a vessel were to lose propulsion or steering and not be under the control of escort tugs, it could potentially drift out of the shipping channel into adjacent areas where the water is shallower and touch bottom. The sea bottom along and adjacent to the vessel route varies from soft muds, sands and gravels to exposed bedrock, depending on the location. For example, Sturgeon Bank and Roberts Bank are part of the Fraser River delta and are comprised largely of alluvial sands and silts. On the other hand, some of the Gulf Islands in the vicinity of Boundary Pass have rocky headlands. Even rocky shorelines however tend to have at least some overlying overburden soils at depth where the scouring influence of waves, tides and currents is diminished.
Vessel grounding on a sea bottom with exposed rock reefs or pinnacles is obviously at a higher risk of incurring hull damage compared to a bottom comprised of soft mud or sand. Apart from intermittent notations on the hydrographic charts indicating the nature of the seabed (eg, rock, mud, etc.) in specific locations, we are not aware of any comprehensive public sources of data that provide for a systematic description of the seabed along the entire vessel route. A provincial GIS database exists which characterizes the nature of the intertidal shoreline, but a deep draught vessel that grounds on the bottom would do so in water depths well below the lowest tide level outside of the shoreline mapping database.
The nature of the seabed and the relative risk of encountering rock vs. softer materials is incorporated into the Risk Assessment in Termpol Study 3.15.

Trans Mountain Expansion Project November 26, 2013
Termpol 3.6: Special Underkeel Clearance Survey 12
2.10 MANOEUVRABILITY IN SHALLOW WATER
As vessels enter into shallower water with less underkeel clearance, they become more difficult to manoeuvre due to the effects of increased current drag forces, vessel squat, etc. While the exact berth layouts the TMEP project have not yet been finalized, the proposed berth configurations provide water depths at least as great as the existing berth, and in most cases greater. The effects of shallower water on manoeuvrability are therefore expected to no greater than the present case, and likely less due to greater available water depths.
2.11 OPERATIONAL / PILOTING PLAN
The parties involved will exchange pertinent information regarding the ship and the transfer facility, either directly or indirectly through an agent or the Port Authority. With regard the ship her specifications in terms of dimensions, arrival draught, ballast condition, fuel, water crew details etc, etc.
The ship’s Master and responsible officer(s) will have consulted the Port Metro Vancouver Harbour Operations Manual, pilot books and charts, etc and will have taken into account any exchange information reflecting on the destination berth and the Port itself, including Port regulations and requirements etc., when constructing their passage plan. This is a normal process and required by IMO and incorporated into The International Convention for the Safety of Life at Sea (SOLAS) as part of the ‘Passage Planning’. A preliminary piloting plan will be developed by the Bridge Team covering coastal and pilotage waters which will recognize and highlight, Traffic Separation Systems (TSS), available official anchorage areas, including potential emergency anchorage areas, the pilot embarkation station, and any surrounding navigational hazards. Allowances will be made to the plan for changes necessitated by, for instance, adverse weather, reduced visibility, availability of the pilot, density of other traffic etc.
The preliminary ‘Arrival and Pilotage Plan’ will be updated and detail added, typically within the remaining 24 hours prior to arrival. This provides sufficient time to adjust for any changes. The exchange of ship/shore information will identify the side and location of the required pilot ladder and/or gangway combination and, in adverse weather, the requirement to provide a ‘lee’ for the pilot boat. All Pilot boarding safety equipment should be made at the ready. The details of the pilot embarkation and individual responsibilities will generally be discussed in detail prior to the event.
The plan will, amongst other details, include the ‘Ship‐to‐Shore/Shore‐to‐ship, Master/Pilot Exchange Forms’ which provides a clear format with which to exchange pertinent information in a clear and efficient manner. To keep the exchange to an understandable minimum, superfluous information should be avoided. It is important that the pilot is made aware of any deficiencies associated with the handling and manoeuvring of the ship and its equipment, particularly the engine and steering gear.

Trans Mountain Expansion Project November 26, 2013
Termpol 3.6: Special Underkeel Clearance Survey 13
Perhaps the most important part of the information given to the pilot will be the ‘Pilot Card’ which provides the pilot with the dimensions, engine power, including the critical rpm of the engine, steering equipment performance and manoeuvring characteristics of the ship and its state of arrival, i.e. amount of ballast or cargo, trim and corresponding fore, aft and amidships draughts etc. It will also list any defects and other important details.
A ‘Manoeuvring Poster’ detailing the ships turning and stopping capabilities along with associated engine rpm should be clearly displayed in line of sight and brought to the pilot’s attention. Any equipment controls i.e. radar, communications, ECDIS and the ship’s whistle should also be explained to the pilot along with the ship’s magnetic compass deviation card and any ship’s gyro error.
In return the Pilot will explain carefully to the Master and Bridge Team what the pilot passage will entail in terms of navigational courses, speeds, anchorages, port requirements and preparation for tugs and/or tug escorts etc.

Trans Mountain Expansion Project November 26, 2013
Termpol 3.6: Special Underkeel Clearance Survey 14
3. REFERENCES
Bertram, H. S. (1998). Ship Design for Efficiency & Economy Second Edition. Woburn: Reed Educational and Professional Publishing Ltd.
Eryuzlu, N. C. (1994). Underkeel Requirements for Large Vessels in Shallow Waterways. PIANC Proceedings 28th International Congress. PIANC.
Fisheries and Oceans Canada ‐ Canadian Coast Guard. (June, 1999). Canadian Waterways ‐ National Manoeuvring Guidelines ‐ Channel Design Parameters. Government of Canada.
Fisheries and Oceans Canada. (2001). Safe Waterways Part 1(a). Retrieved from Canadian Coast Guard: http://www.ccg‐gcc.gc.ca/folios/00020/docs/gdreport01‐eng.pdf
Fisheries and Oceans Canada. (2013). 2013 Tide Tables. Retrieved October 23, 2013, from Government of Canada: http://www.waterlevels.gc.ca/eng/data/predictions/2013
IACS. (January 2006). Common Structural Rules for Double Hull Oil Tankers. International Association of Classification Societies.
IPCC. (2007). IPCC Publications. Retrieved October 23, 2013, from IPCC: http://www.ipcc.ch/publications_and_data/publications_and_data_reports.shtml#1
Pacific Pilotage Authority. (2010, June 4). Second Narrows Tankers. Retrieved from Pacific Pilotage Authority: http://www.ppa.gc.ca/text/notice/Web%20Notice%20to%20Industry%20Second%20Narrows%20April%202010.pdf
Pacific Pilotage Authority. (n.d.). Under Keel Clearance. Vancouver, BC, Canada.
Port Metro Vancouver. (2010, June 10). Harbour Operations Manual. Retrieved October 10, 2013, from http://www.portmetrovancouver.com/docs/default‐source/port‐users‐marine‐operations/WP_‐_2010_Harbour_Operations_Manual.pdf?sfvrsn=0.
R. E. Thomson, B. D. (2008). An Examination of the Factors Affecting Relative and Absolute Sea Level in Coastal British Columbia. Sidney: Fisheries and Oceans Canada.

Trans Mountain Expansion Project November 26, 2013
Termpol 3.6: Special Underkeel Clearance Survey 15
APPENDIX A: ROUTE MAPS AND WATER DEPTHS

Trans Mountain Expansion Project November 26, 2013
Termpol 3.6: Special Underkeel Clearance Survey 16
Figure A‐1: Westridge Terminal, Depth in metres to CD (Chart 3494)

Trans Mountain Expansion Project November 26, 2013
Termpol 3.6: Special Underkeel Clearance Survey 17
Figure A‐2: Vancouver Harbour East, Depth in metres to CD (Chart 3494)

Trans Mountain Expansion Project November 26, 2013
Termpol 3.6: Special Underkeel Clearance Survey 18
Figure A‐3: Vancouver Harbour West, Depth in metres to CD (Chart 3493)

Trans Mountain Expansion Project November 26, 2013
Termpol 3.6: Special Underkeel Clearance Survey 19
Figure A‐4: Burrard Inlet, Depth in metres to CD (Chart 3463)

Trans Mountain Expansion Project November 26, 2013
Termpol 3.6: Special Underkeel Clearance Survey 20
Figure A‐5: Strait of Georgia, Depth in Fathoms to CD (Chart 3001)

Trans Mountain Expansion Project November 26, 2013
Termpol 3.6: Special Underkeel Clearance Survey 21
Figure A‐6: San Juan Islands, Depth in Fathoms to CD (Chart 3001)

Trans Mountain Expansion Project November 26, 2013
Termpol 3.6: Special Underkeel Clearance Survey 22
Figure A‐7: Victoria Area, Depth in Fathoms to CD (Chart 3001)
Trans Mountain Expansion Project November 26, 2013
Termpol 3.6: Special Underkeel Clearance Survey 23
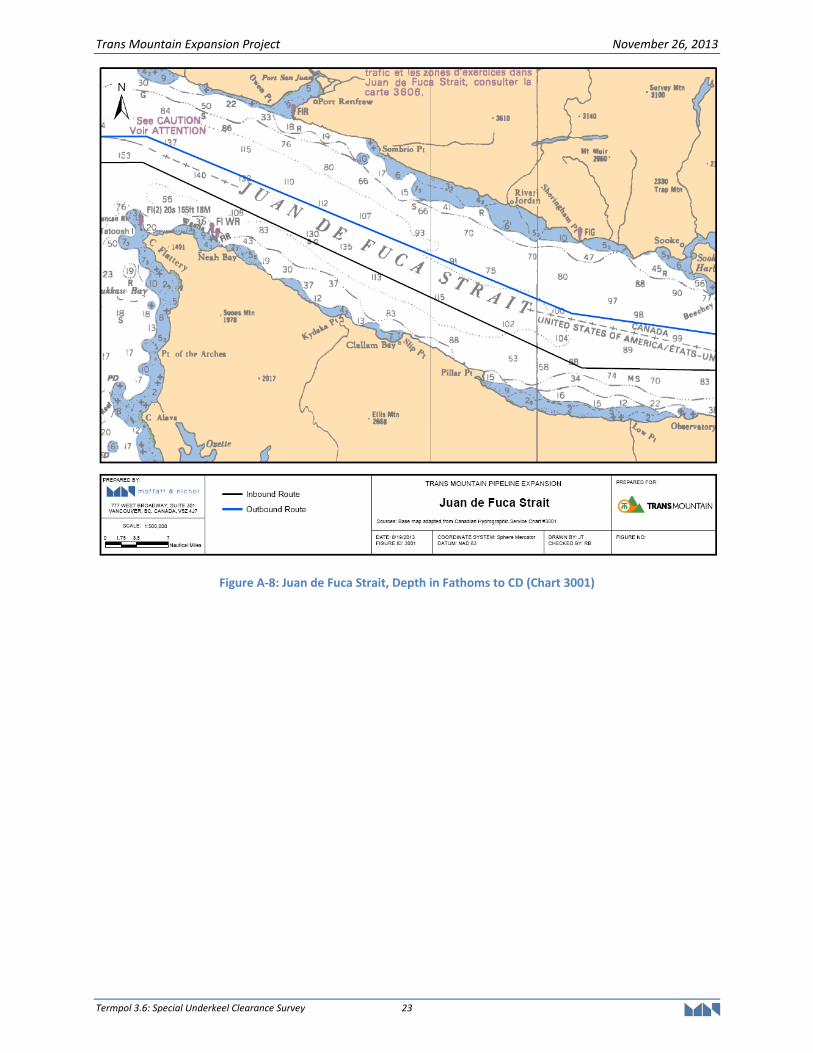
Figure A‐8: Juan de Fuca Strait, Depth in Fathoms to CD (Chart 3001)