Embed Size (px)
Citation preview

Quantification of financial transfers caused by Universal Postal Union terminal duesFinal report
Postal Regulatory Commission22 December 2015

Authors:Henrik Ballebye OkholmAnna Möller BoivieSimon EdkinsJimmy Gårdebrink

Preface
The Universal Postal Union (UPU) system of terminal dues governs payments between des-ignated postal operators for the transport, sorting, and delivery of cross-border letter post items in the destination country. UPU rates are used by many postal operators across the world, both directly and indirectly (as a fall-back provision). In a report from September 20141, Copenhagen Economics identified three types of potential market distortions cre-ated by the current UPU terminal dues system:
1. Distortion of competition for (i) last-mile handling and (ii) first-mile handling of cross-border letter post items
2. Distortion of demand for (i) delivery within and outside the terminal dues system, (ii) domestic versus cross-border delivery, and (iii) cross-border delivery originating in transition versus target countries
3. Financial transfers between delivery operators
As a follow-up on the previous study, the Postal Regulatory Commission has asked Copen-hagen Economics to conduct a quantitative analysis, estimating the magnitude of the third type of distortion: the financial transfers between designated postal operators currently using the terminal dues system.
This report presents the findings of our research conducted from September to December 2015. This report provides updated results compared to an earlier version released in Octo-ber 2015, where there were errors in some of the input data. This means that the financial net transfers in our previous report were too high.
Compared to the previous version of the report, this report also provides more analysis of the patterns of the net transfers, i.e. a breakdown on types of letters and a breakdown of transfers between geographical regions.
The structure of the report is the following: Chapter 1 provides an introduction to terminal dues and their impact on designated postal operators’ financial positions. Chapter 2 de-scribes the model that we use to estimate financial transfers. Chapter 3 discusses the res-ults of the modelling and the caveats that must be considered when interpreting the res-ults.
1 Copenhagen Economics (2014), The Economics of Terminal Dues, report prepared for the Postal Regulatory Commission. Available at http://www.prc.gov/sites/default/files/reports/The%20Economics%20of%20Terminal%20Dues_final%20report%20300914.pdf

Table of contents
Preface 1
Executive summary 8
1 Terminal dues and their impact on postal operators’ financial positions 14
1.1 The UPU system for terminal dues 141.2 Design of the terminal dues system 151.3 Financial net transfers created by terminal dues 17
2 Developing a model for estimating net transfers 21
2.1 A model for estimating financial transfers 212.2 Elements and assumptions in the model 242.3 Interpretation of the results – caveats and cau-
tions 38
3 Applying the model – estimating net transfers 41
3.1 Net financial transfers 413.2 Inbound effect 443.3 Outbound effect 503.4 Net effect by letter format 523.5 Financial transfers between geographical regions 533.6 Sensitivity analysis 56
References 58


List of tables
Table 1 Universal Postal Union groups..............................16Table 2 Terminal dues rates paid.......................................16Table 3 Target countries subject to UPU floors or caps... .17Table 4 Schedule of terminal dues rates............................34Table 5 Illustration: Drivers of positive inbound ef-fects...................................................................................47Table 6 Illustration: Drivers of negative inbound ef-fects...................................................................................50Table 7 Illustration: Drivers of outbound effects...............52Table 8 Sensitivity analysis: Equivalent domestic post-age rates............................................................................56Table 9 Sensitivity analysis: Share of small packets in mail mix.............................................................................57

List of figures
Figure 1 Terminal dues versus domestic postage rates in the US............................................................................19Figure 2 Domestic postage, letter 20g...............................26Figure 3 Process map........................................................27Figure 4 Bilateral mail flows (largest outbound/in-bound flows).......................................................................31Figure 5 Illustration: Calculation of uncapped ter-minal dues..........................................................................35Figure 6 Calculation of equivalent domestic postage rates...................................................................................37Figure 7 Postal operators with largest estimated neg-ative net transfers 2014 (million SDR)...............................42Figure 8 Postal operators with largest estimated pos-itive net transfers 2014 (million SDR)................................43Figure 9 Postal operators with largest estimated pos-itive transfers for inbound mail flows 2014.......................45Figure 10 Estimated gain per item (inbound mail flows - top 15)...................................................................46Figure 11 Postal operators with largest estimated negative transfers for inbound mail flows 2014.................48Figure 12 Estimated loss per item (inbound mail flows - top 15)..............................................................................49Figure 13 Postal operators with largest estimated pos-itive transfers for outbound mail flows..............................51Figure 14 Distribution of net effect by letter format.........53Figure 15 Financial transfers between geographical regions...............................................................................54

List of boxes
Box 1 Financial transfers created by terminal dues..........20Box 2 Calculation of financial transfers, numerical example..............................................................................22Box 3 Assumption of proportional regional participa-tion.....................................................................................28

Executive summary
The Universal Postal Union (UPU) is an intergovernmental organization and a global forum for cooperation between postal sector players, originally foun-ded in 1874. Amongst other things, the UPU sets the rules for terminal dues - payments between designated postal operators for the transport, sorting, and delivery of cross-border letter post2 items in the destination country.
Terminal dues make sure that designated postal operators get compensation when they handle letters originating from designated postal operators in other countries. However, the design of the UPU system for terminal dues may lead to market distortions. In fact, in a report from September 20143, Copenhagen Economics identified three types of potential market distortions present in the current UPU terminal dues system:
1. Distortion of competition for (i) last-mile handling and (ii) first-mile handling of cross-border letter post items
2. Distortion of demand for (i) delivery within and outside the terminal dues system, (ii) domestic versus cross-border delivery, and (iii) cross-border delivery originating in transition versus target countries
3. Financial transfers between delivery operators
Since the completion of the report, there has been interest from the U.S. De-partment of State’s Federal Advisory Committee on International Postal and Delivery Services, operators, regulators, and others in quantifying the poten-tial market distortions. Quantifying the distortions will lend visibility into the extent of the potential problem. Of primary interest is quantifying the finan-cial transfers between delivery operators. Against this background, the Postal Regulatory Commission has asked Copenhagen Economics to estimate the financial transfers between designated postal operators currently using the terminal dues system.
As outlined in the previous report, the potential distortions emerging from the current terminal dues system can be quantified by comparing the actual situation with the current set of terminal dues to a counterfactual situation,
2 Terminal dues apply to “small letters”, “large letters” (sometimes referred to as “flats”), and “bulky letter” (sometimes referred to as “small packets”), defined by a set of minimum and maximum dimensions and weights. Small letters (P) are defined by the characteristics; Minimum dimensions: 90 x 140 mm, Maxi-mum dimensions: 165 x 245 mm, Maximum weight: 100 g, Maximum thickness: 5 mm. Large letters (G) are characterized as items that cannot be classified as small letters; Minimum dimensions: 90 x 140 mm, Maximum dimensions: 165 x 245 mm, Maximum weight: 100 g, Maximum thickness: 5 mm. Bulky letters or small packets (E) (a non-standard envelope or parcel up to 2 kg) are characterized as items classified neither as small letters nor as large letters; Minimum dimensions: 90 x 140 mm, Maximum dimensions: 900 mm length, width and depth combined, with the greatest dimension not exceeding 900 mm, Maximum weight: 2 kg (5 kg for items containing books or pamphlets), cf. UPU 2015 Statistics and Accounting Guide.
3 Copenhagen Economics (2014), The Economics of Terminal Dues, report prepared for the Postal Regulat-ory Commission. Available at http://www.prc.gov/sites/default/files/reports/The%20Economics%20of%20Terminal%20Dues_final%20report%20300914.pdf
7

in which terminal dues are non-distortionary. The difference between the two situations can be considered a distortion of the ideal state. Financial transfers between designated postal operators occur in cases where (compared to a counterfactual situation with non-distortionary ter-minal dues) the sending postal operator today overpays or underpays for last-mile delivery in the destination country. An underpayment for delivery im-plies a financial transfer from the receiving postal operator to the sending one. Similarly, an overpayment for delivery implies a financial transfer from the sending postal operator to the receiving one.
A set of counterfactual and non-distortionary terminal dues are defined by the rates that would be charged to a private company for the same service (i.e., last-mile handling of letter mail). Since these tariffs are not always avail-able in the public domain, previous studies have often applied a set of coun-terfactual terminal dues rates, referred to as the equivalent domestic postage rates, set at 70-80 percent of the domestic postage rates for end-to-end deliv-ery of single-piece letters of three formats (small letters, large letters, and small packets). This is where our analysis begins.4 We also conduct a number of robustness checks where we vary this assumption.
Developing a model for estimating financial net transfersThe current terminal dues system may influence the financial position of postal operators, given their bilateral mail flows, via two channels: inbound cross-border mail flows (import volumes) and outbound cross-border mail flows (export volumes).
On the inbound side, the effect (for a specific receiving postal operator and a specific bilateral mail flow) would equal the difference between the terminal dues charged and the equivalent domestic postage rate, times the amount of inbound letter post items. If the current terminal dues rate is below the do-mestic price for last-mile delivery, this implies a negative financial transfer for the receiving operator.
On the outbound side, the effect (for a specific sending postal operator and a specific bilateral mail flow) would equal the difference between the terminal dues paid and the equivalent domestic postage in the receiving country, times the amount of outbound letter post items. If the current terminal dues rate charged by the postal operator in the destination country is below the domestic price for last-mile delivery in the destination country, this implies a positive financial transfer for the sending operator.
In order to quantify the financial net transfers, we design a model assuming that all bilateral mail flows between designated postal operators are subject
4 An alternative approach could be to depart from the uncapped UPU terminal dues rates. These rates, however, only reflect the domestic postage for small letters (P) and large letters (G). Due to the increased importance of e-commerce and small packets in the cross-border mail mix, including also the domestic postage for small packets (E) will provide a more representative picture of the real cross-border mail mix.
8

to UPU terminal dues. This is, however, not the case in reality.5 For desig-nated postal operators using alternative agreements for remuneration in rela-tion to cross-border letter post flows, the financial transfers estimated in our model may thus be somewhat overstated. Nevertheless, as the UPU terminal dues will always serve as a benchmark in negotiations about alternative agreements, we do not expect these rates to differ substantially from the UPU rates.
As a first step, our model estimates the net financial transfer for one operator in relation to one specific bilateral flow of cross-border letter mail:
π ijI=X ji(TDij−EDP ij)π ijO=X ij (TD ji−EDP ji)NT i=π ij
I−π ijO
In this model, π ijI is country i’s loss (gain) on inbound letter mail from country
j expressed as the difference between what country i gets in terms of ter-minal dues from country j today and what it would get in the counterfactual scenario. X ji is the letter mail flow subject to terminal dues going from coun-try j to country i, TDij is the actual terminal dues rate that country i receives as revenue from country j and EDPij is the equivalent domestic postage, i.e. the counterfactual terminal dues rate, in country i.
Equivalently, π ijO is country i’s gain (loss) on outbound letter mail to country j
expressed as the difference between what country i pays in terms of terminal dues to country j today and what it would pay in the counterfactual scenario.
NT i is thus the net transfer for country i related to its bilateral cross border exchange of mail with country j. In order to get the total net transfer for country i, one has to conduct the same analysis for all bilateral mail flows to and from country i.
When terminal dues change from the current level to the counterfactual rate, this may imply that postal administrations change the prices they charge for outbound cross-border delivery of letters. This may affect the demand for cross-border mail. As a result, the global mail volumes in the counterfactual situation may not be the same as the global mail volumes in the actual situ-ation. This dynamic effect is not taken into account in our model. In order to consider this effect, one would need to include assumptions about (i) the im-pact of terminal dues levels on postal tariffs and (ii) mailers’ elasticities of demand.
5 Two alternatives to the UPU terminal dues are (i) compensation rates negotiated under the REIMS agree-ment (administered by the International Post Corporation (IPC)) and (ii) bilateral agreements between postal administrations.
9

The lack of dynamic effects in our model in combination with a lack of precise data on actual bilateral mail flows, terminal dues in the counterfactual situ-ation, and the existence of alternative agreements not subject to UPU ter-minal dues implies that we cannot claim to estimate precise net financial transfers for individual postal operators. Nevertheless, our estimations provide valuable information regarding the magnitude and direction of finan-cial transfers across designated postal operators worldwide. They also provide valuable insights regarding the characteristics of designated postal operators determining whether and to what extent a postal operator is likely to experience positive or negative financial transfers in the current system.
Applying the model – estimating financial net transfers Our modelling reveals a total value of net financial transfers between 154 designated postal operators in the current terminal dues system in 2014 of approximately 950 million Special Drawing Rights (SDR), corresponding to 1,400 million USD.
The levels of net financial transfers differ substantially across countries. Whereas many countries (primarily in Africa, South America, and the Middle East) experience net financial transfers of 0.5 million SDR (corresponding to approximately 0.7 million USD) or less, there is also a large number of coun-tries experiencing substantially larger transfers (up to 270 million SDR cor-responding to almost 400 million USD). The financial net transfers are signi-ficant for some operators and correspond to up to 13 percent of the mail rev-enue for countries experiencing a negative financial net transfer, and up to 30 percent of mail revenue for countries experiencing positive financial net transfer.
Our estimates show that the financial transfers primarily stem from low ter-minal dues for small packets. Small packets account for 70% of the total fin-ancial transfers. Large letters account for 14% and small letters account for 16% of the financial transfers.
Our estimations show that whereas the negative net transfers generated by the terminal dues system are concentrated to a relatively small number of designated postal operators (31), the positive net transfers are distributed among a larger number of designated postal operators (123). In fact, we find that 98 percent of the negative net transfers generated by the terminal dues system are incurred by only 15 designated postal operators which (according to our estimations) all incurred a net financial loss of more than 6 million SDR (approximately 8.5 million USD) or more in 2014. As regards the posit-ive transfers, we observe a slightly different picture with a larger number of designated postal operators sharing the transfers generated by the terminal dues system. Nevertheless, there are still a small number of postal operators that experience significantly higher gains than others do. Altogether, the 15 designated postal operators experiencing the largest positive net transfers represent 69 percent of the total transfers generated by the system.
10

On a regional level, there are three significant financial net transfers: From Western Europe to Eastern Europe & Central-Asia, from Western Europe to Asia-Pacific and from North America to Asia-Pacific.
The net financial transfer for each postal operator emerges from a combina-tion of two effects: an inbound effect (on cross-border letter mail coming from other countries) and an outbound effect (on cross-border letter mail sent to other countries).
With respect to the inbound effect, our estimations reveal that 97 designated postal operators experience a positive financial transfer whereas 57 postal operators experience a negative financial transfer. The financial loss per op-erator experiencing a negative transfer on inbound volumes is, however, much larger than the financial gain per operator experiencing a positive transfer on inbound volumes. Whereas no postal operators experience a pos-itive inbound transfer larger than 12 million SDR, negative transfers on in-bound volumes can amount to over 275 million SDR.
With respect to the outbound effect, all postal operators in our analysis ex-perience a financial gain on outbound mail flows. Depending on the charac-teristics of the designated postal operator, the positive transfer on outbound mail volumes ranges from less than 1.000 SDR to more than 200 million SDR per operator.
The size of the net financial transfer (i.e. the sum of the inbound and the out-bound effect t) experienced by a specific postal operator depends on (i) the difference between actual and counterfactual terminal dues rates charged from/paid to foreign postal operators as well as on (ii) the size of and compos-ition of inbound/outbound cross-border mail flows. Our analysis reveals that the financial transfers in the UPU terminal dues system are driven by a com-bination of these two factors.
Our estimations suggest that some designated postal operators with relat-ively low cross-border volumes in a global perspective experience large neg-ative financial transfers, due to significant differences between actual ter-minal dues charged for inbound cross-border letters and the equivalent do-mestic postage rate. Similarly, some designated postal operators experience large positive financial transfers due to significant differences between ter-minal dues paid for outbound cross-border letters and the equivalent do-mestic postage rates in the receiving countries.
For any difference between actual and counterfactual terminal dues on in-bound as well as on outbound mail flows, however, larger cross-border mail flows will always increase the financial impact of the terminal dues system. As a consequence, the largest transfers created by the current system of ter-minal dues will follow the largest global mail flows.
11

Our estimations show that a designated postal operator that is losing money on inbound mail flows and gaining money on outbound mail flows will experi-ence larger losses if it is a net importer of mail than if it is a net exporter of mail. Net-importing postal operators with a high price for last-mile handling of domestic letter post items will experience the largest negative transfers in the current system. Net-exporting postal operators with a price for last-mile handling of domestic letter post items below the actual terminal dues rates will experience the largest positive transfers in the current system.
Sensitivity analysisThe model used to estimate financial transfers is based on a number of as-sumptions regarding bilateral mail flows and non-distortionary terminal dues in the counterfactual. In order to take into account that the reality may differ from our assumptions in the model, we conduct two sensitivity checks where we vary the most important assumptions in the model. The two assumptions that we vary in our sensitivity analysis are:
The share of single-piece rates used as a basis for equivalent domestic postage
The share of small packets in the cross-border mail mix
In a study about postal operators’ pricing behaviour, conducted on behalf of the European Commission in 2011, we found that single piece items (on aver-age) were priced over 45 percent higher than transactional bulk mail and bulk mail was priced almost 50 percent higher than direct mail. This suggests that a 30 percent discount on single piece tariffs may not be enough to reflect the equivalent domestic postage for last-mile delivery of cross-border letters. Moreover, in some countries, the domestic postage rates for single-piece items are subject to regulation to ensure that postal services are available to everyone at affordable rates. In these countries, the single-piece postage rates may thus be subsidised to a low level.
In order to take this into consideration, we run our model with the assump-tion that the equivalent domestic postage rates can be approximated by 80 percent, 60 percent and 50 percent of the domestic postage rates for single-piece items respectively. Applying an average share of domestic postage rates to all bilateral mail flows most likely implies that the share of domestic postage applied will be too low for some postal operators and too high for others. Nevertheless, this test allows us to estimate the likely boundaries of financial transfers created by the current set of terminal dues. The sensitivity test reveals total financial transfers generated by the current terminal dues system ranging from 602 million SDR (corresponding to 854 million USD) with 50 percent to 1,160 million SDR (corresponding to 1,647 USD) with 80 percent of the domestic postage rates used as a basis for calculating the equi-valent domestic postage.
12

Moreover, as recognised in several publications already6, an increasing level of cross-border e-commerce implies a change in the cross-border mail mix in terms of a larger share of small packets. In order to take this into account, we run our model with the assumption that the share of E format items in the cross-border mail mix increases by 15 percent and 30 percent respectively for all designated postal operators. While doing this, we assume that the shares of P and G format items decline proportionately, such that the total number of letter post items remains the same. The test reveals that a higher share of small packets in the cross-border mail mix creates larger total trans-fers in the system (ranging from 950 million SDR in the base case to 1,100 million SDR in the case where the share of small packets is increase by 30 percent in all flows).
6 See for example UPU (2014a), “Fulfilling the global e-commerce promise,” and UPU (2013), Union Postale no.4 December 2013, p.17
13

Chapter 1Terminal dues and their impact on postal operators’ financial positions
This report provides a quantitative estimate of the net financial transfers cre-ated by the current system of terminal dues administered by the Universal Postal Union (hereafter referred to as the UPU). In order to better under-stand the model used to quantify net transfers as well as the results from our modelling (described in chapters 2 and 3), we start by providing an overview of the UPU system for terminal dues and explaining how this system affects the financial positions of postal operators across the world.
1.1 The UPU system for terminal duesThe UPU is an intergovernmental organization and a global forum for cooper-ation between postal sector players, originally founded in 1874. At that time, the organization included 21 member countries. Today, 220 countries and territories are part of the UPU.
Amongst other things, the UPU sets the rules for international mail ex-changes between designated postal operators in its member countries. An essential part of this work concerns intergovernmental agreements govern-ing terminal dues - payments between designated postal operators for the transport, sorting, and delivery of cross-border letter post7 items in the des-tination country. UPU members revise the terminal dues rates every four years in a general congress. The next congress takes place in Istanbul in September 2016.
In 2013, 3.5 billion cross-border letter post items were sent globally.8 Ter-minal dues affect all cross-border deliveries of letter mail (either directly or indirectly)9, the level of these payments are very important for designated 7 Terminal dues apply to “small letters”, “large letters” (sometimes referred to as “flats”), and “bulky letter”
(sometimes referred to as “small packets”), defined by a set of minimum and maximum dimensions and weights. Small letters (P) are defined by the characteristics; Minimum dimensions: 90 x 140 mm, Maxi-mum dimensions: 165 x 245 mm, Maximum weight: 100 g, Maximum thickness: 5 mm. Large letters (G) are characterized as items that cannot be classified as small letters; Minimum dimensions: 90 x 140 mm, Maximum dimensions: 165 x 245 mm, Maximum weight: 100 g, Maximum thickness: 5 mm. Bulky letters or small packets (E) (a non-standard envelope or parcel up to 2 kg) are characterized as items classified neither as small letters nor as large letters; Minimum dimensions: 90 x 140 mm, Maximum dimensions: 900 mm length, width and depth combined, with the greatest dimension not exceeding 900 mm, Maximum weight: 2 kg (5 kg for items containing books or pamphlets), cf. UPU 2015 Statistics and Accounting Guide.
8 UPU (2014b), Development of postal services in 2013, p. 4. This corresponds to 1 percent of total letter post traffic world wide.
9 For letter post flows where postal operators have negotiated bilateral agreements, terminal dues are still relevant as they work as a fall-back option in the negotiations. I.e. the bilaterally negotiated rates are usually not very different from the terminal dues. Terminal dues under the REIMS V agreement are not
14

postal operators. As cross-border letter post traffic grows, spurred by the positive development in e-commerce, the importance of terminal dues will increase.10
Terminal dues thus affect designated postal operators across the whole world. The amount of cross-border letter post sent to and from its country influences the amount to which terminal dues affect an individual postal op-erator. Data on global letter post flows within and between regions demon-strates that the main flows of cross-border letter post are between industrial-ised countries.11 This suggests that designated operators in these countries would be most affected by any changes to the current level of terminal dues. However, with an increasing share of citizens in Western Europe and North America shopping at online marketplaces in Asia, the flow of cross-border letter mail from Asia to Western Europe and North America is increasing. As a result, designated operators in these countries will also be significantly affected by any changes to the current terminal dues system.
1.2 Design of the terminal dues systemThe current UPU system for terminal dues is a two-tiered system dating back to 1989. It consists of a target system and a transitional system.
The transitional system mainly applies to exchanges to, from, or between designated operators in countries considered “developing”.
The target system mainly governs the exchange of letter post items between designated operators in countries and territories previously thought of as “industrialised”.12 In 2010, countries and territories classi-fied as “developing” began to join the target system.
Countries in the transitional system can opt in to the target system, but not the other way around.13 Depending on when they joined the target system or when it is foreseen that they will join the target system, UPU members are divided into 6 groups: 1.1, 1.2, 2, 3, 4, and 5, cf. Table 1.
Table 1 Universal Postal Union groups Group Number of countries and territories in the group Description
publicly available, but under REIMS II, terminal dues were set at 80 percent of the domestic price for a single-piece priority letter, i.e. not very different from the uncapped UPU rates.
10 E-commerce deliveries are to a large extent sent by letter post (as “bulky letters” or “small packets”, see for example UPU (2014) “Fulfilling the global e-commerce promise” and UPU (2013), Union Postale no.4 December 2013, p.17
11 According to Universal Postal Union (2014),” Development strategies for the postal sector: An economic perspective”, Chapter 8: Global postal connectedness, p. 196, 43 percent of total international letter post flows (measured in kg) were intra Western Europe and 15 percent were between Western Europe and North America.
12 Classification is from the United Nations Social and Economic Council.13 Campbell (2014) Estimating the effects of UPU terminal dues 2014-2017 and UPU (2015) Statistics and
Accounting Guide
15

1.1 41 Countries in target system prior to 20101.2 13 Joined target system in 20102 24 Joined target system in 20123 39 Will join target system in 20164 53 Will apply transitional system rates for 2014-20175 50 Will apply transitional system rates for 2014-2017
Note: UPU countries and territories are divided into six groups based on the postal development index (PDI), which comprises a macroeconomic component (gross national income, GNI, per capita) and a postal-specific component (normal unit cost per letter based on full-time staff).
Source: UPU (2015) Statistics and Accounting Guide, http://www.upu.int/uploads/tx_sbdownloader/guide-TerminalDuesStatisticsAccountingEn.pdf
The terminal dues received by a designated postal operator for the last-mile handling of cross-border letter post depend on the terminal dues group to which group it belongs as well as on the terminal dues group to which the sending postal operator belongs. Countries or territories part of the target system (groups 1.1, 1.2, and 3) pay each other target rates, while terminal dues to, from, and between countries or territories in the transitional system (groups 3, 4, and 5) are paid at transitional rates, cf. Table 2.
Table 2 Terminal dues rates paidPaying country or territory (origin) Country Receiving (destination) Rate Paid
TargetTarget Target
Transition Transition
TransitionTarget Transition
Transition Transition
Source: UPU (2015), Statistics and Accounting Guide, http://www.upu.int/uploads/tx_sbdownloader/guide-TerminalDuesStatisticsAccountingEn.pdf
The terminal dues rates for the two rate systems are based on different para-meters. In general, the rates in the transitional system are lower than the rates in the target system.
For the transitional system, the UPU prescribes rates (for delivering inbound letter mail) that have both per item and per kilogram components, which are then converted into a per kilogram rate.14 These per item and per kilogram rates for the transitional system are equal to the floor of the target system for any given year.
For the target system, the rates (for delivering inbound mail) are based on 70 percent of the domestic tariff for a 20-gram priority small letter and a 175-gram priority large letter, though subject to caps and floors (per item and per kilogram). The level of the floors and caps depend on group classification
14 For mail flows below 75 tons, an average number of items per kilogram of mail is applied to these per item and per kilogram rates to develop one per kilogram rate for transition countries.
16

(1.1, 1.2 or 2). In practice, however, caps and floors are so close to each other that the terminal dues applied by target countries for inbound letter mail often is a fixed rate, which is not aligned to the domestic tariffs. In addi-tion to this, terminal dues are adjusted based on the quality of service of mail delivery.15
UPU data suggests that more than 80 percent of designated operators in group 1.1 will be subject to either caps or floors for intra-1.1 group letter flows between 2014 and 201716. For letter flows within groups 1.2 and 2, or between groups 1.1, 1.2, and 2, the share of operators subject to caps or floors are between 96 and 100 percent, cf. Table 1.
Table 1 Target countries subject to UPU floors or capsFlows Cap/floor 2013 (%) 2015 (%) 2017 (%)
Intra-1.1(41 countries)
Cap (per kg or per item) 71 71 71Floor (per-kg or per-item) 17 17 17
Cap or floor 88 88 88
Intra-1.2, Intra-2, inter-1.1, 1.2, and 2(76 countries)
Cap (per-kg and per-item) 100 59 57Floor (per-kg and per-item) 100 39 39
Cap or floor 100 98 96
Note: The table shows the share of countries in the relevant group(s) constrained by UPU caps or floors in 2013, 2015 and 2017. Total number of countries in groups 1.1, 1.2 and 2 are 76. Group 1.1 consists of 41 countries.
Source: Copenhagen Economics, based on UPU tool: Terminal Dues Impact, 2012
1.3 Financial net transfers created by terminal dues As demonstrated above, the UPU terminal dues system is effectively a regula-tion of prices for last-mile handling of inbound cross-border letter post. Al-though bilateral agreements can be concluded between postal operators on a voluntary basis, the UPU terminal dues system constitutes a default option. As a result, the UPU terminal dues have become the binding rate for last-mile delivery of cross-border letter mail in the vast majority of cases.
Due to the fact that (i) terminal dues received often are lower than the prices for last-mile handling of domestic (and comparable) letter post items in the receiving country17, and (ii) some countries are net importers of international letter post whereas some are net exporters, the terminal dues system creates financial transfers between postal operators in the system.18 15 For operators in target countries with annual inward mail flows above 100 tons and for operators in the
transition system that choose to participate, terminal dues are adjusted according to quality of service. This can result in a bonus or penalty of 5 percent of the base rate. In addition to this, postal operators in groups 1.1, 1.2, and 2 pay into a Quality of Service Fund for transition system operators. The fund is gov-erned by the UPU, and distributed to postal operators in transition countries to improve postal services.
16 Source: Copenhagen Economics, based on UPU Tool: Terminal Dues Impact, 201217 This is primarily a problem for operators in the target system who often are subject to restrictive caps on
the terminal dues they receive for the handling of inbound letter mail. In contrast to terminal dues, the prices for last-mile handling of domestic letter post are often not subject to strict regulation. Sometimes, however, these prices are subject to cost-orientation requirements.
18 In addition to financial transfers between postal operators, Copenhagen Economics (2014) identifies five types of market distortions caused by the UPU Terminal Dues system: 1) Distortion of competition for last-
17

When assessing the effect of the terminal dues system on designated postal operators’ financial positions, one needs to compare the current situation against a counterfactual situation with an alternative set of terminal dues that provides a demonstrable improvement over the current system. As demonstrated in Copenhagen Economics (2014)19, such a set of alternative terminal dues could equal the domestic prices for last-mile handling of com-parable letter post items (hereafter referred to as the equivalent domestic postage). This would imply that the designated operators charge the same price for the same service (i.e. non-discrimination between domestic and cross-border letter post).
When comparing the actual situation to the counterfactual situation de-scribed above, we find that some postal operators (because of the current system) lose money whereas other operators gain money on the handling of inbound letter mail. Similarly, because of the current system, some operators gain money on outbound delivery since they pay a too low price for the last-mile handling of outbound cross-border letters.
As information about domestic prices for last-mile handling of letter mail sometimes is difficult to obtain in the public domain, the non-distortionary level of terminal dues is often approximated as a share (normally 70-80 per-cent) of the list price for domestic (end-to-end) delivery of single piece let-ters. The difference between the terminal dues per letter received for in-bound delivery and the domestic postage rate thus provides an indication of the loss per inbound letter incurred by the postal operator in the destination country.
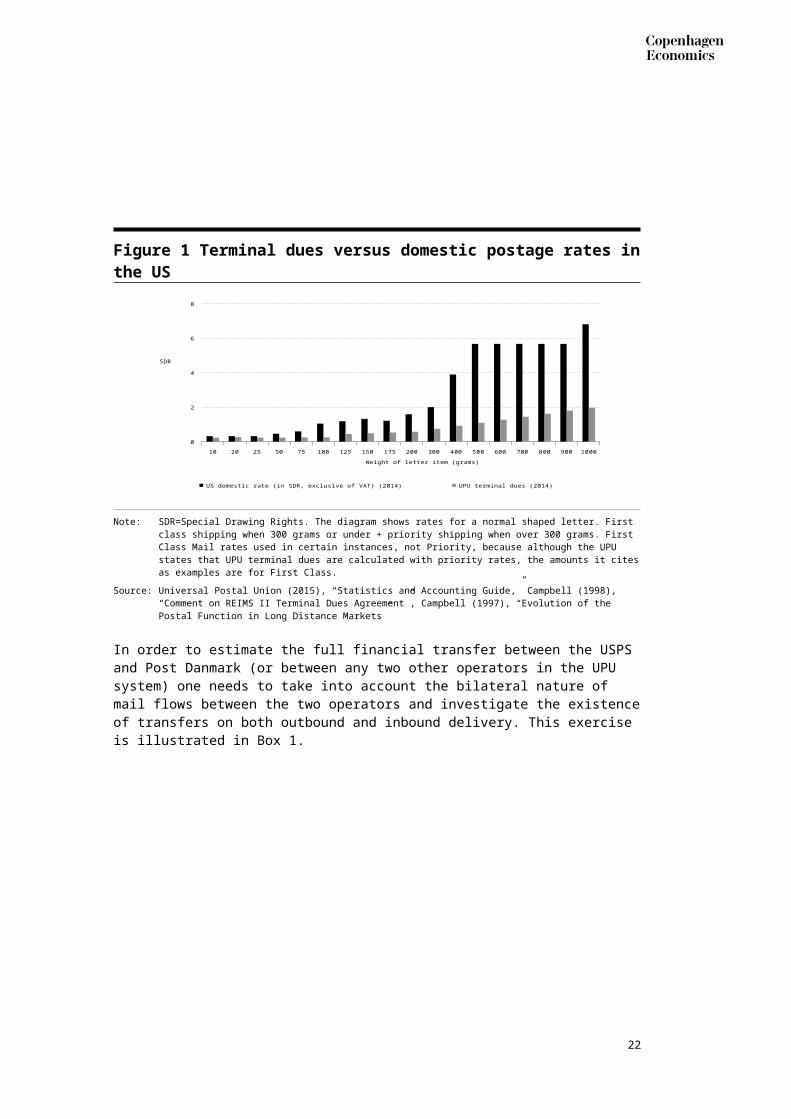
Figure 1 shows the price for domestic first class delivery of a normal shaped letter in the US compared with the terminal dues received by the U.S. Postal Service (USPS) for a cross-border letter sent from Denmark. It reveals a marked difference between the domestic postage rate and the terminal dues, primarily for items weighing more than 25 grams. The difference is still con-siderable if the domestic postage is reduced by 20-30 percent. This indicates a financial transfer from the USPS to Post Danmark created by the current level of terminal dues.
mile handling of cross-border letter post items, 2) Distortion of competition for first-mile handling of cross-border letter post items, 3) Distortion of demand for delivery within and outside the terminal dues system, 4) Distortion of demand for domestic versus cross-border delivery, and 5) Distortion of demand for cross-border delivery originating in transition versus target countries.
19 Copenhagen Economics (2014), “The Economics of Terminal Dues”, report prepared for the Postal Regu-latory Commission, http://www.prc.gov/sites/default/files/reports/The%20Economics%20of%20Terminal%20Dues_final%20report%20300914.pdf
18

Figure 1 Terminal dues versus domestic postage rates in the US
10 20 25 50 75 100 125 150 175 200 300 400 500 600 700 800 900 10000
2
4
6
8
US domestic rate (in SDR, exclusive of VAT) (2014) UPU terminal dues (2014)
Weight of letter item (grams)
SDR
Note: SDR=Special Drawing Rights. The diagram shows rates for a normal shaped letter. First class shipping when 300 grams or under + priority shipping when over 300 grams. First Class Mail rates used in certain instances, not Priority, because although the UPU states that UPU terminal dues are calculated with priority rates, the amounts it cites as examples are for First Class.
Source: Universal Postal Union (2015), “Statistics and Accounting Guide,” Campbell (1998), “Comment on REIMS II Terminal Dues Agreement”, Campbell (1997), “Evolution of the Postal Function in Long Dis-tance Markets”
In order to estimate the full financial transfer between the USPS and Post Danmark (or between any two other operators in the UPU system) one needs to take into account the bilateral nature of mail flows between the two oper-ators and investigate the existence of transfers on both outbound and in-bound delivery. This exercise is illustrated in Box 1.
19

Box 1 Financial transfers created by terminal duesIn this example, we consider two operators, A and B. Operator A’s price for last-mile handling of domestic letter post is 1.0. Operator B’s price for last-mile handling of domestic letter post is 0.6.
The terminal dues on all transactions between A and B are set at 0.5 (i.e., below the price of domestic last-mile activities for both operators). This implies that operator A loses 0.5 (0.5-1.0) on every inbound item and gains 0.1 (0.6-0.5) on every outbound item, compared to a situation where the terminal dues would be equal to the domestic rates. Similarly, operator B loses 0.1 (0.5-0.6) on every inbound item and gains 0.5 (1.0-0.5) on every outbound item, compared to a situation where the terminal dues would equal the domestic rates.
Losses and gains per item in relation to inbound and outbound activitiesA B
Loss per item on inbound activities -0.5 -0.1 Gain per item on outbound activit-ies 0.1 0.5
If the two bilateral flows between A and B are symmetrical, this implies that operator A achieves a net loss of 400 whereas operator B achieves a net gain of 400.
Transfer from country A of country BBalanced flow: 1,000 items from A to B, and 1,000 items from B to A
A B Total loss on inbound activities -500 -100 Total gain on outbound activities 100 500
Net gain/loss -400 400
This mechanism is often referred to as a financial transfer where the operator with the higher domestic price transfers money to the operator with the lower domestic price.
Source: Copenhagen Economics
In certain cases, the loss on inbound delivery may equal the gain on out-bound delivery for both countries in a bilateral relationship. In this case, the net effect for both operators is zero, although transfers occur on both in-bound and outbound delivery.
In the remainder of this report, we focus on the net effect, i.e., the net finan-cial transfers created by the UPU system for terminal dues.
20

Chapter 2Developing a model for estimating net transfers
In order to estimate the financial transfers created by the terminal dues sys-tem, we have created a model that compares the terminal dues received/paid by designated postal operators worldwide in two situations: (i) the actual situation with the current set of terminal dues and (ii) a counterfactual situ-ation with an alternative set of non-distortionary terminal dues. In this chapter, we describe and explain the model, including its elements and the assumptions made.
2.1 A model for estimating financial transfersWhen assessing the effect of the terminal dues system on designated postal operators’ financial positions, one needs to compare the current situation against a counterfactual situation with an alternative set of terminal dues that provides a demonstrable improvement over the current system. The dif-ference between the two situations constitutes an effect of the current ter-minal dues system.
A set of counterfactual terminal dues could for example be defined by ter-minal dues equal to the prices of similar domestic delivery services. This would reduce the financial transfers created by the current system. However, since these tariffs are not always available in the public domain, previous studies have often used a set of counterfactual terminal dues rates set at a percentage (typically 70-80 percent20) of the domestic postage rates for end-to-end delivery of single-piece letters of three formats (small letters, large letters, and small packets). This is where our analysis begins.21 We also con-duct a number of robustness checks where we vary this assumption.
The current terminal dues rates influence the financial position of postal op-erators, given their bilateral mail flows, via two channels: inbound cross-bor-der flows (import volumes) and outbound cross-border flows (export volumes).
On the inbound side, the effect (for a specific postal operator and a specific bilateral mail flow) equals the difference between the terminal dues charged and the equivalent domestic postage times the amount of inbound letter post
20 70 percent of the domestic postage rates is also used by the UPU as the benchmark when calculating terminal dues before adjusting for caps and floors.
21 An alternative approach could be to depart from the uncapped UPU terminal dues rates. These rates, however, only reflect the domestic postage for small letters (P) and large letters (G). Due to the increased importance of e-commerce and small packets in the cross-border mail mix, including also the domestic postage for small packets (E) will provide a more representative picture of the real cross-border mail mix.
21
items. If the current terminal dues rate is below the equivalent domestic postage22, this implies a negative financial transfer for the receiving operator.
On the outbound side, the effect (for a specific postal operator and a specific bilateral mail flow) equals the difference between the terminal dues paid and the equivalent domestic postage in the destination country times the amount of outbound letter post items. If the current terminal dues rate charged by the destination country is below the equivalent domestic postage in the des-tination country, this implies a positive financial transfer for the sending op-erator.
For each bilateral country pair we thus want to estimate:
π ijI=X ji(TDij−EDP ij)π ijO=X ij (TD ji−EDP ji)NT i=π ij
I−π ijO
where π ijI is country i’s loss (gain) on inbound letter mail from country j ex-
pressed as the difference between what country i gets in terms of terminal dues from country j today and what it would get in the counterfactual scen-ario. X ji is the letter mail flow subject to terminal dues going from country j to country i, TDij is the actual terminal dues rate that country i receives as revenue from country j and EDPij is the equivalent domestic postage (i.e. the counterfactual terminal dues rate).
Equivalently, π ijO is country i’s gain (loss) on outbound letter mail to country j
expressed as the difference between what country i pays in terms of terminal dues to country j today and what it would pay in the counterfactual scenario.
NT i is thus the net transfer for country i related to its bilateral cross border exchange of mail with country j. In order to get the total net transfer for country i, one has to conduct the same analysis for all bilateral mail flows to and from country i. This exercise is also illustrated in Box 2 by means of a numerical example.
Box 2 Calculation of financial transfers, numerical ex-ample
Assume there are three designated postal operators (A, B, and C), located in countries A, B, and C. Operator A sends 600,000 pieces to other countries and receives 700,000 pieces, making it a net importer. For every letter it sends to Country B, Operator A pays a terminal dues rate lower than the comparable domestic postage in Country B.
22 The equivalent domestic postage represents the counterfactual and non-distortionary terminal dues rate and is estimated for each country based on information about domestic postage rates for three types of letter formats: small letters (P), large letters (G), and small packets (E) as well as assumptions about the weight distribution for the three formats within the cross-border mail mix.
22

For every letter it sends to Country C, Operator A pays a terminal dues rate equivalent to the comparable domestic postage in Country C. For every letter received from Coun-tries B and C, Operator A receives a terminal dues rate lower than its comparable domestic postage. All country characteristics are outlined in the table below:
Country characteristicsA B C
Actual terminal dues rate(applied to all inbound flows) 0.1 0.1 0.1 Counterfactual terminal dues rate (applied to all inbound flows) 0.5 0.5 0.1 Volume from country A - 400,000 200,000 Volume from country B 400,000 - 100,000 Volume from country C 300,000 400,000 -
The net financial transfers (as well as the losses and gains for each bilateral mail flow) are calculated in the in the following way:
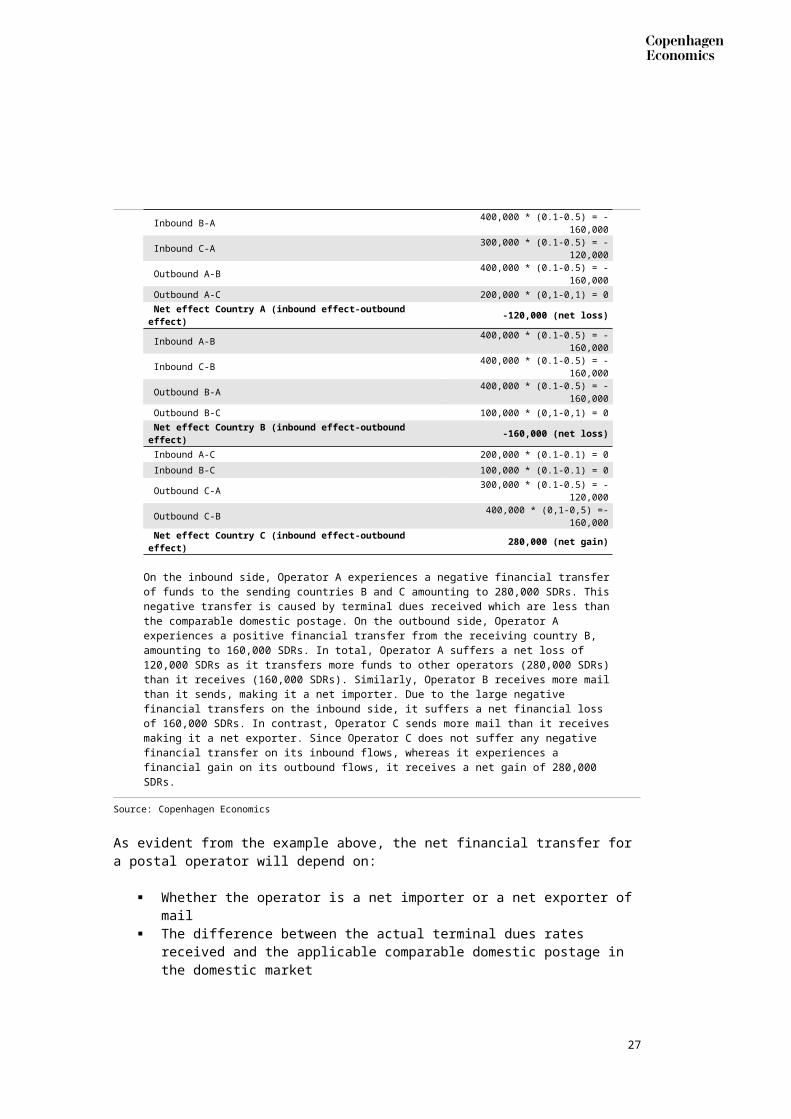
Calculation of financial transfersEffect Calculation Inbound B-A 400,000 * (0.1-0.5) = -160,000 Inbound C-A 300,000 * (0.1-0.5) = -120,000 Outbound A-B 400,000 * (0.1-0.5) = -160,000 Outbound A-C 200,000 * (0,1-0,1) = 0 Net effect Country A (inbound effect-outbound effect) -120,000 (net loss) Inbound A-B 400,000 * (0.1-0.5) = -160,000 Inbound C-B 400,000 * (0.1-0.5) = -160,000 Outbound B-A 400,000 * (0.1-0.5) = -160,000 Outbound B-C 100,000 * (0,1-0,1) = 0 Net effect Country B (inbound effect-outbound effect) -160,000 (net loss) Inbound A-C 200,000 * (0.1-0.1) = 0 Inbound B-C 100,000 * (0.1-0.1) = 0 Outbound C-A 300,000 * (0.1-0.5) = -120,000 Outbound C-B 400,000 * (0,1-0,5) =- 160,000 Net effect Country C (inbound effect-outbound effect) 280,000 (net gain)
On the inbound side, Operator A experiences a negative financial transfer of funds to the sending countries B and C amounting to 280,000 SDRs. This negative transfer is caused by terminal dues received which are less than the comparable domestic post-age. On the outbound side, Operator A experiences a positive financial transfer from the receiving country B, amounting to 160,000 SDRs. In total, Operator A suffers a net loss of 120,000 SDRs as it transfers more funds to other operators (280,000 SDRs) than it receives (160,000 SDRs). Similarly, Operator B receives more mail than it sends, making it a net importer. Due to the large negative financial transfers on the inbound side, it suffers a net financial loss of 160,000 SDRs. In contrast, Operator C sends more mail than it receives making it a net exporter. Since Operator C does not suffer any negative financial transfer on its inbound flows, whereas it experiences a financial gain on its outbound flows, it receives a net gain of 280,000 SDRs.
Source: Copenhagen Economics
As evident from the example above, the net financial transfer for a postal op-erator will depend on:
23
Whether the operator is a net importer or a net exporter of mail The difference between the actual terminal dues rates received and
the applicable comparable domestic postage in the domestic market The difference in between actual terminal due rates paid and the ap-
plicable comparable domestic postage in the destination market
In the following, we describe the model for estimating financial transfers in detail.
2.2 Elements and assumptions in the modelThe model designed to estimate financial transfers from the current system of UPU terminal dues consists of four main elements:
Designated postal operators Bilateral flows of letter mail up to 2kg between all designated postal
operators (in number of items and weight), split by letter format (P, G, E)23
Actual terminal dues rates for each bilateral mail flow Counterfactual terminal dues rates for each bilateral mail flow
Due to shortage of primary data available in the public domain, the input used to construct reliable estimates for each element is collected from vari-ous sources24. In the following, we describe, for each element in turn, how the data set is constructed as well as the assumptions made in the process.
Designated postal operatorsThe model includes designated postal operators in 162 countries and territor-ies across the world. This is a subset of the 220 countries and territories that are part of the UPU. The selection of countries and territories is made based on data availability, primarily regarding cross-border flows of letter mail.
Due to the lack of precise data on actual bilateral mail flows, terminal dues in the counterfactual situation, and the existence of bilateral agreements (not subject to UPU terminal dues), we cannot claim to estimate precise net finan-23 Small letters (P) are defined by the characteristics; Minimum dimensions: 90 x 140 mm, Maximum
dimensions: 165 x 245 mm, Maximum weight: 100 g, Maximum thickness: 5 mm. Large letters (G) are characterized as items that cannot be classified as small letters; Minimum dimensions: 90 x 140 mm, Maximum dimensions: 165 x 245 mm, Maximum weight: 100 g, Maximum thickness: 5 mm. Bulky letters or small packets (E) (a non-standard envelope or parcel up to 2 kg) are characterized as items classified neither as small letters nor as large letters; Minimum dimensions: 90 x 140 mm, Maximum dimensions: 900 mm length, width and depth combined, with the greatest dimension not exceeding 900 mm, Maximum weight: 2 kg (5 kg for items containing books or pamphlets), cf. UPU 2015 Statistics and Accounting Guide
24 Much of our data is collected from documents, publications, and databases from the Universal Postal Union, for example UPU (2015b), “UPU Postal Statistics database”, http://pls.upu.int/pls/ap/ssp_report.-main?p_language=AN&p_choice=BROWSE ; .UPU (2014b), “Development strategies for the postal sector: An economic perspective”, http://www.upu.int/uploads/tx_sbdownloader/publicationTrendsDevelop-mentStrategiesForThePostalSectorEn.pdf ; UPU (2014c), “Development of postal services in 2013”, http://www.upu.int/fileadmin/documentsFiles/resources/postalStatistics/developmentOfPostalServices-In2013En.pdf and UPU (2014d), POC C3 LPRG 2014.2 Doc 4a, “Results of the items per kilogramme (IPK) study”. We complement this with recent research of domestic postage rates from WIK Consult (2013).
24

cial transfers for individual postal operators. Nevertheless, our estimations provide valuable information regarding the magnitude and direction of finan-cial transfers across designated postal operators worldwide. It also provides valuable insights regarding the characteristics of designated postal operators determining whether and to what extent a postal operator is experiencing positive or negative financial transfers in the current system.
Three particularly important characteristics are:
The difference between the terminal dues rates received on inbound flows and the equivalent domestic postage (used as basis for the coun-terfactual terminal dues rate received on inbound flows)
The size of cross-border mail flows and whether the postal operator is a net importer or a net exporter of cross-border letter mail
The composition of cross-border mail flows and whether the terminal dues received on inbound flows are subject to caps
Designated postal operators with a high price for last-mile handling of do-mestic letter post items are more likely to experience negative financial transfers under the current system. This is because the difference between the actual terminal dues rates charged for inbound cross-border letters and the rates that would be charged in the counterfactual situation is larger for these postal operators than for postal operators with low domestic prices (especially if the operator is subject to the caps in the terminal dues system). Postal operators with very low domestic prices may even experience a posit-ive financial transfer on inbound mail volumes as terminal dues in the coun-terfactual situation would be lower than what they are today. The illustration shown in Box 2 demonstrates this. Operators A and B have comparable do-mestic postage rates that are higher than the terminal dues received on in-bound flows and both operators suffer a net financial transfer loss on their inbound flows. In contrast, the domestic postage rates and the terminal dues are equal for Operator C, which produce a net financial transfer gain that operator (zero transfer on inbound flows and a positive transfer on outbound flows).
Figure 2 displays the domestic postage rates for a 20g priority small letter in 163 countries, ranging from less than 0.05 SDR per item to almost 1.1 SDR per item. Many countries with a high domestic postage in Figure 2 belong to the target system for terminal dues. This means that they are capped with respect to the terminal dues they can charge for inbound cross-border mail. In combination with a high domestic postage, this makes it more likely that these countries are experiencing net financial losses due to the current design of terminal dues.
25

Figure 2 Domestic postage, letter 20g
0
0.2
0.4
0.6
0.8
1
1.2
1 163
Note: As a proxy for the price of last-mile handling of domestic letter post items, we depart from the do-mestic postage for end-to-end delivery of a 20g letter.
Source: WIK (2013) ” Main Developments in the Postal Sector (2010-2013)”, UPU(2008)
For any difference between actual and counterfactual terminal dues on in-bound as well as on outbound mail flows, larger cross-border mail flows will increase the financial impact of the terminal dues system. For example, a designated postal operator that is losing money on inbound mail flows and gaining money on outbound mail flows will experience larger losses if it is a net importer of mail than if it is a net exporter of mail. Net-importing postal operators with a high price for last-mile handling of domestic letter post items will experience the largest negative transfers in the current system. Net-exporting postal operators with a price for last-mile handling of domestic letter post items similar or even below the actual terminal dues rates will experience the largest positive transfers in the current system.
Bilateral mail flowsBilateral mail flows between designated postal operators are an essential input in the model. In combination with the difference between the actual terminal dues rates and the counterfactual ones (i.e. the equivalent domestic postage), the magnitude of bilateral mail flows will determine the size of the financial transfers.
In order to estimate financial net transfers in our model, we need information about bilateral flows of letter mail up to 2kg between all designated postal operators (both in number of items and in weight), split by letter format (P, G, E). As this information is not readily available in the public domain, we have to construct our own data set, based on publicly available data and reas-onable assumptions about the performance of global mail markets.
26
Whereas we have information about flows of cross-border letter post between regions, we do not know how the cross-border volume to/from each region is disaggregated among the countries in the region. Moreover, we do not have information about the product mix (i.e., letter formats) in the volumes. For this reason, we use a number of proxies to approximate mail flows subject to UPU terminal dues. The process of estimating bilateral mail flows is depicted in Figure 3 and described in detail below.
Figure 3 Process mapTotal inbound/ outbound letter mail flow per
country
Bilateral mail flows as % of inter-regional
flows
Bilateral mail flows as % of global cross-border flow
Bilateral mail flows in volumes
(number of items)
Bilateral mail flows (no. of items) per
format
Bilateral mail flows (in weight + no. of items)
per format
1
2
3
4
5
6
Source: Copenhagen Economics
As a first step, we create estimates of the total inbound and outbound mail flow (in terms of number of items) for individual countries. The starting point for this is readily available data for total inbound and outbound mail flows from the UPU25, measured in number of items. Since 2011 is the year in the UPU statistics for with we have the broadest coverage of data (139 countries and territories covered), we use this as a reference. If we cannot find inform-ation for a specific country or territory in the UPU dataset from 2011, we turn to UPU statistics from other years. This adds data points for another 31 countries. When neither of these sources can provide us with an estimate, we turn to domestic sources such as the national regulatory authorities. This adds data points for another five countries. For seven additional countries with data for domestic (but not cross-border) letter volumes, we are able to
25 UPU Postal Statistics Database, http://pls.upu.int/pls/ap/ssp_report.main?p_language=AN&p_choice=BROWSE
27

construct our own estimate of cross-border volumes by using a reasonable ratio of cross-border to domestic letter mail volumes.26
This results in a data set of inbound and outbound volumes (in number of items) for 182 countries and territories.
As a second step, we set the estimates of inbound and outbound flows in 2011 for each designated postal operator relative to the 2011 inter-regional mail flows to and from for the region where the postal operator is located.27 This provides us with a ratio (for each designated operator) of (i) the inbound flow relative to the total inbound flow to the region and (ii) the outbound flow relative to the total outbound flow from the region.
As a third step, we make an important assumption about proportional re-gional participation, cf. Box 3, where we depart from the ratios from step two and apply them to inter-regional mail flows from 2014. By applying this as-sumption, we are able to estimate data points for each bilateral mail flow as a percentage of the global cross-border mail flow in 2014. While this methodo-logy fails to take into account factors such as distance and international rela-tions28, it is the best available approximation of bilateral flows and does not suffer from further data gaps.
Box 3 Assumption of proportional regional participationThe assumption about proportional regional participation allows us to estimate the percent-age of the world’s mail flow that goes from a country i in region A to a country j in region B based on the following information:
The percentage of region A’s outbound flow originates in country i,(ii) The percentage of region B’s inbound letter mail flow that is delivered to country j(iii) The share of the global total cross border mail flow that goes from region A to region B
For each mail stream that goes between countries from different regions, we apply the fol-lowing calculation:
X ij=OiOA×I jI B×X AB (1)
For each mail stream that goes between countries within the same region, we apply the following calculation:
26 The ratios used are based on information from previous years regarding the relationship between do-mestic and cross-border mail volumes. Where this information is not available, a ratio is constructed based on assumptions regarding the similarity of countries (i.e. countries of similar size can be expected to have the same ratio between domestic and cross-border flows).
27 Data for inter-regional mail flows are available in Ansón, José, and Matthias Helble, (2014), "Global postal connectedness." In Universal Postal Union, Development Strategies for the Postal Sector: An Economic Perspective. Bern: UPU.
28 Factors such as distance, international relations, and a common language can be important for the mail exchange between certain countries. With respect to the growing share of cross-border e-commerce, for example, we often observe larger online trade between countries that share a common language or culture (e.g., Germany and Austria, the United States and Canada). For the case of the United States, we have tried to compensate for this by adjusting bilateral flows between the US and Canada based on publicly available information about cross-border mail flows between these countries.
28

X ij=OiOA×
I j
I A×(1−( IiI A ))× X AA (2)
X ij= percentage of world’s mail flow that goes from country i to country jX AB= percentage of world’s mail flow that goes from region A to region BX AA=percentage of world’s mail flow that goes within region AOi= total outbound mail flow from country iOA= total outbound mail flow from region AI j= total inbound mail flow to country jIB= total inbound mail flow to region B
The assumption in (1) and (2) is essentially the same but the calculations differ in the relat-ive inbound. The difference is due to the fact that the total inbound flow to region A also includes mail destined for country i. This is a pragmatic solution to solve a mechanical prob-lem in the model because we do not want to include domestic mail.
Source: Copenhagen Economics
As a fourth step, we convert each bilateral flow (until now measured as a per-centage of the global flow of international mail) into an estimate in terms of volumes (number of items). We do this by multiplying it with the global volume of international mail.29
As a fifth step, we split each bilateral mail flow according to the different let-ter formats (P, G, and E). In order to do this, we use a UPU survey among 49 designated postal operators that contain regional estimates for the distribu-tion of formats (in percentage of number of items and weight).30 This study also provides estimates of the average weights per format. By assuming that the distribution of P, G and E items in a specific bilateral mail flow between two regions is the same as the distribution of P, G, and E items in the total inter-regional mail flow between the same two regions, this provides us with a per-format estimate of letter mail volumes for each bilateral mail stream.
As a sixth, and last, step, we apply the average weight for each product type (from the UPU survey referred to above) in order to get the bilateral flows measured in kilograms instead of number of items.
Based on this, we are able to estimate bilateral cross-border flows of letter post items between 183 countries and territories worldwide. Depending on the size and structure of bilateral mail flows, the current design of the ter-minal dues system will affect designated operators differently. For example, large outbound flows of cross-border mail may imply that designated postal operators experience large positive transfers on the outbound side. Similarly,
29 Information about global cross-border letter post volumes is available in UPU (2014c), "Development of Postal Services in 2013" (Powerpoint presentation).
30 UPU, (2014d), POC C3 LPRG 2014.2 Doc 4a, “Results of the items per kilogramme (IPK) study” (commit-tee document).
29

in combination with a negative difference between actual terminal dues re-ceived and the equivalent domestic postage rate, large inbound may imply that designated postal operators experience large negative transfers on the inbound side. Understanding the structure of bilateral mail flows will thus be very helpful when trying to understand the structure of net financial trans-fers created by the current terminal due system.
Figure 4 displays the largest bilateral mail flows estimated in our model. It reveals the United States, Great Britain, and Germany as the countries with the largest flows of outbound cross-border letter mail. It also reveals France, the United States, Canada, and Germany as the countries with the largest inbound flows of cross-border letter mail. In addition to this, the figure also reveals designated postal operators in the United States, Great Britain, France, and Germany as net exporters of mail whereas the designated postal operator in Canada is a net importer of mail. As explained above, in combina-tion with information about the difference between actual terminal dues and equivalent domestic postage rates, this information will be very valuable when analysing the reason for why certain postal operators are experiencing positive financial transfers from the system whereas others experience negat-ive financial transfers.
30

Figure 4 Bilateral mail flows (largest outbound/inbound flows)
Note: The figure displays mail flows above 5 million itemsSource: Copenhagen Economics based on modelling
31

Actual terminal dues ratesOur model estimates financial transfers by comparing the actual situation (with actual terminal dues31) with a counterfactual situation (with counterfac-tual terminal dues).
Actual terminal dues rates are calculated based on the UPU methodology set out in the 25th UPU congress for the period of 2014 through 2017.32 According to this methodology, postal operators that are part of the UPU system fall into one of six different groups (1.1, 1.2, 2, 3, 4, 5, see chapter 1). For postal operators in groups 1.1, 1.2, and 2 (i.e. countries in the target system), the terminal dues for inbound letter mail consists of a per-item rate and a per-kilogram rate based on 70 percent of the domestic postage for a 20g small priority letter and a 175g large priority letter. These rates are, however, sub-ject to caps and floors depending on to which of the three groups the postal operator belongs. There is also a limit depending on the size of mail flows where a fixed per kilogram rate will apply if the total inbound mail flow is less than 75 tons. For postal operators in groups 3, 4, and 5 (i.e. countries in the transitional system), terminal dues charges are calculated as a fixed rate per kilogram if the total inbound flow from a certain country is less than 75 tons and a fixed per-kilogram rate and per-item rate if the total inbound flow from a certain country is above 75 tons. The schedule of terminal dues rates applicable to the different groups is laid out in Table 4.
Table 4 Schedule of terminal dues rates Mail flow Terminal dues
Intra group 1.1Cap: 2.294/kg + 0.924/item (<75 tons: 5.890/kg)
Secondary cap: Max. annual increase: 13%Floor: 1.591/kg + 0.203/item (<75 tons: 4.074/kg)
Intra group 1.2 + between group 1.1. and 1.2 Cap: 1.641/kg + 0.209/item (<75 tons: 5.890/kg)Floor: 1.591/kg + 0.203/item (<75 tons: 4.074/kg)
To, from, and between groups 3, 4, and 5 <75 tons: 4.192/kg>75 tons: 1.591/kg + 0.203/item
Source: UPU (2012b), 2012 Convention, Arts. 29-31; 2013 Letter Post Regulations, Art. RL 220 (target rate formula).
In order to calculate the 2014 terminal dues rates for countries in the target system before any caps and floors are applied, we need information about two reference tariffs:33
The tariff for a 20 g small (P) priority letter post item in the domestic ser-vice (in force at 1 June 2014), converted into SDR (DP1)
31 The model assumes that all designated postal operators (also those part of other multilateral or bilateral agreements) apply the UPU terminal dues rates for cross-border mail flows in the current situation. For letter post flows where postal operators have negotiated alternative agreements, terminal dues are never-theless still relevant as they work as a fall-back option in the negotiations. I.e. the alternative rates are usually not very different from the terminal dues.
32 UPU (2012a), UPU terminal dues system for the period 2014-2017.Joint Council of Administration and Postal Operations Council report.
33 The data is provided by UPU (2014e), “International Bureau Circular 112”
32

The tariff for a 175 g large (G) priority letter-post item in the domestic service (in force at 1 June 2014), converted into SDR (DP2)34
According to the UPU guidelines, the terminal dues rate per item before caps and floors is 70 percent times the tariff of the 0-20g small letter (DP1) times 0.01 (10 grams assumed to be the average weight for a small letter). In order to calculate per-kilogram rates, a linear relationship between weights and tariffs is assumed. These two rates (per item and per kilogram) are then ap-plied to an item of average weight (assumed by the UPU to be 81 grams) in order to get the uncapped terminal dues rate for an average item, cf. Figure 5.
Figure 5 Illustration: Calculation of uncapped terminal dues
0
0.2
0.4
0.6
0.8
1
1.2
1.4
0 20 40 60 80 100 120 140 160 180 200
Price
weight (gr)
Note: Prices in SDRSource: Copenhagen Economics based on UPU (2012)
The target rate is calculated by multiplying the floor rate, both per item and per kilogram separately, with a ratio of uncapped revenue and floor revenue. This means is that if domestic tariffs in one country are high relative to the floor rates, that postal operator will get a higher add-on to the floor rate (but not higher than the cap).
Terminal dues rates per kilogram in the target system are thus calculated as:
Rw=70%×M× (W avg−0.01 )+DP1Rwfl×W avg+Rpfl
× Rwfl
(3)
34 Since the estimates of bilateral mail flows relate to the year 2014, we also depart from domestic postage rates for the same year.
33

And terminal dues rates per item in the target system are calculated as:
Rw=70%×M× (W avg−0.01 )+DP1Rwfl×W avg+Rpfl
× R Ifl
(4)
where,
M=constant rate of change= (DP2-DP1) / (0.175-0.01)DP1 and DP2=Domestic postage rates without VAT for 0-20g P and 100-250g GWavg=The average weight of an letter post item, set to 81gRwfl= Floor rate per kilogram Rpfl= Floor rate per piece
For each bilateral mail flow the effective rate will depend on (i) the group to which a postal operator belongs, (ii) from which country the inbound mail flow is coming, and (iii) whether or not the terminal dues for the bilateral flow in question is subject to a cap or floor.
Counterfactual terminal dues ratesThe counterfactual terminal dues rates should ideally reflect (for each coun-try) the price for last-mile handling of cross-border letter post items that a private company (not part of the UPU) would pay. Since the terminal dues are payments for activities in the receiving postal operator’s domestic mar-ket, this price could be approximated by the price for last-mile handling of domestic letter post items (corrected for any cost difference between do-mestic and cross-border letter mail).
Neither of these two prices are readily available in the public domain. Moreover, collecting these prices for all postal operators that are part of the UPU system is very difficult, requiring detailed information (for each oper-ator) about (i) the mix of inbound letter post items (formats, weights, address quality etc.) and (ii) prices for last-mile handling of domestic letter post for each format, weight, level of address quality, etc. Collecting these data was not possible within the period and budget of this report.
As a proxy for the counterfactual terminal dues rates, we therefore depart from the domestic (end-to-end) postage rates for single-piece items of three different formats (P, G, E) and weights. This means that we use more granu-lar data than what the UPU uses to calculate terminal dues. In particular, the UPU does not use prices for items of E format (small packages). In order to reflect the price charged for last-mile handling of domestic letter mail, we apply an adjustment factor of 70 percent35. The difference between applying 35 This adjustment factor is the same as used by the UPU for the calculation of uncapped terminal dues for
operators in the target system. According to the 25th congress document describing the base for the cur-rent terminal dues system: “Domestic tariffs, exclusive of VAT and other taxes, will be used as a reference for calculating TD rates. The percentage of domestic tariffs retained for use is 70%. This figure results
34

the domestic postage rates used by the UPU as a starting point and applying more granular data on weight and format-specific prices is illustrated in Fig-ure 6. The pink line in the diagram represents the methodology36 for calculat-ing the target revenue for the UPU terminal dues. This rate is calculated based on two reference tariffs: The domestic postage for a 20 g small priority letter and the domestic postage for a 175 g large priority letter (connected by the pink line in the diagram).
Instead of making a simple linear relationship between two tariffs, we use information about different weight-steps for three products. The two grey lines and the black line in the diagram below show the domestic postage rates for small letters (P format), large letters (G format) and small packets (E format) for different weight classes. Our methodology uses three weight steps for small letters, five weight steps for large letters and seven weight steps for small packets. This allows us to calculate equivalent domestic postage rates that mirror the actual situation better than what would have been the case if only two prices would have been used.
Figure 6 Calculation of equivalent domestic postage rates
00.5
11.5
22.5
33.5
44.5
5
0 200 400 600 800 1000 1200 1400 1600 1800 2000
Price (SDR)
Weight (gr)
Source: Copenhagen Economics based on WIK (2013) and UPU (2008)
For industrialized countries and all European countries, information about domestic postage rates mainly comes from a survey conducted by WIK con-sulting, containing a comprehensive overview of domestic postage rates in
from the inbound mail handling cost, calculated based on information from the cost study.”, source: UPU (2012), UPU terminal dues system for the period 2014-2017, Joint Council of Administration and Postal Operations Council report. http://documents.upu.int/Bodies/2012/CNG/CNG%20DOC/MEETING/CNG%20DOC%202012/Doc%2020b/EN/cng_doc_d020b.pdf?Mobile=1&Source=%2F_layouts%2Fmobile%2Fview.aspx%3FList%3D9cab4832-53b8-40f5-9ca4-8566e0ab0364%26View%3D895ea13c-b413-4ce7-b5cb-912051fecf08%26RootFolder%3D%252FBodies%252F2012%252FCNG%252FCNG%2520DOC%252FMEETING%252FCNG%2520DOC%25202012%252FDoc%252020b%252FEN%26CurrentPage%3D1
36 See UPU (2014e), International Bureau Circular 112
35

201337. For other countries domestic postage rates are collected from a UPU database with 2008 priority domestic rates by product type and weight step.38 These rates are adjusted based on inflation to create an estimate of tariff levels in 2014.
However, the UPU data on domestic postage rates is too granular for our purpose. For example, for small letters (P) the dataset contains prices for three weight steps, 20g, 50g and 100g for each country. In order to calculate an average postage rate per small letter, we thus need to make assumptions about the distribution of weights. These assumptions are primarily based on a UPU study from 201439 containing estimated distributions on different weight steps for each product type P, G and E.
Once the weight distribution for each format is established, it is straightfor-ward to calculate a domestic rate per item for each product type.
In order to correct for the first part of end-to-end delivery activities (collec-tion, transport) which is not part of the last-mile handling, we apply an ad-justment factor (70 percent of the domestic postage). It may well be that ap-plying a share of the domestic postage rates for single-piece letters does not reflect the price for last-mile handling of the cross-border letter mail mix. Reasons for this might be that domestic postage rates for single piece letters are regulated, or that low price elasticity of demand for single-piece letters result in higher prices. Nevertheless, since information about special tariffs40 (which may constitute a better starting point) often are not available in the public domain, we consider the single piece rates to be a valid starting point similar to what has been done in previous studies.41In order to check the sens-itivity of our results to this assumption, we conduct a number of robustness checks where we vary this assumption, cf. chapter 3.
Our data set contains domestic postage rates for 163 countries and territor-ies. Combined with the data set of bilateral mail flows (consisting of 182 countries and territories), this leaves us with a set of 154 designated operat-ors (for which we have estimates of all necessary parameters) to include in the analysis.
2.3 Interpretation of the results – caveats and cautions Due to the lack of precise data on actual bilateral mail flows, terminal dues in the counterfactual situation, and the existence of bilateral agreements (not subject to UPU terminal dues), we cannot claim that our model estimates
37 WIK (2013), ” Main Developments in the Postal Sector (2010-2013)”38 The database from 2008 is the most recent source available containing such a comprehensive and granu-
lar overview of domestic tariffs. 39 UPU, (2014b), POC C3 LPRG 2014.2 Doc 4a, “Results of the items per kilogramme (IPK) study” (commit-
tee document).40 Special tariffs are work-sharing discounts applicable to the distribution of bulk mail41 See for example Campbell, James (2014), “Estimating the effects of UPU terminal dues 2014-2017”
36

precise net financial transfers for individual postal administrations. Neverthe-less, we believe that our estimations provide valuable information regarding the magnitude and direction of financial transfers across postal administra-tions worldwide.
Although our model tries to mimic the reality as well as possible, some effects are not captured and the results have to be interpreted with some care. In the following, we briefly discuss three aspects that one should be aware of when interpreting the results.
The existence of alternative agreementsOur estimates assume that all bilateral mail flows captured in the model are subject to UPU terminal dues. This is, however, not the case in reality. Two alternatives to the UPU terminal dues are (i) compensation rates negotiated under the REIMS42 agreement (administered by the International Post Cor-poration (IPC)) and (ii) bilateral agreements between postal administrations.
The REIMS agreement currently has 26 signatories, including all major European designated operators. According to the IPC, about one-third of EU international mail volumes were settled under REIMS in 2009.43 Compensa-tion rates under the current REIMS agreement are not publicly available. However, under REIMS II, compensation rates were set at 80 percent of the domestic price for a single-piece priority letter (without any caps or floors). As many of the European postal administrations would be subject to restrict-ive caps in the current UPU system, the REIMS system brings the charges for last-mile handling of cross-border mail closer to the non-distortionary rate level. For the countries part of the REIMS agreement, the financial transfers estimated in our model may be overstated.
The same applies to postal administrations that have negotiated bilateral agreements with rates closer to the non-distortionary ones. However, as the UPU terminal dues will always serve as a benchmark in negotiations, we do not expect bilaterally negotiated rates to differ substantially from the UPU rates.
Impact on mail flows of changes in terminal dues When terminal dues change from the current level to the counterfactual rate, this may imply that postal administrations change the prices they charge for outbound cross-border delivery of letters. This may affect the demand for cross-border mail. As a result, the global mail volumes in the counterfactual situation may not be the same as the global mail volumes in the actual situ-ation.
42 REIMS stands for Remuneration of International Mails43 Approximately one third were settled under alternative agreements such as UPU or bilateral agreements
and approximately one third were injected directly in domestic networks. Source: IPC (2009), ”Trends and challenges in cross-border mail markets”
37

This dynamic effect is not taken into account in our model. In order to con-sider this effect, one would need to include assumptions about (i) the impact of terminal dues levels on postal tariffs and (ii) mailers’ elasticities of de-mand. For designated postal operators for which higher terminal dues in the counterfactual situation would reduce the demand for cross-border mail, holding volumes constant in the model is likely to overstate net financial transfers.
Related to this issue is the topic of remailing. As acknowledged in Copenha-gen Economics (2014), the current UPU system for terminal dues may create incentives for mailers to post letters in a country other than the country where the mailer “resides”44. The mailer might physically send the mail to a second country for posting using a private operator or ETOE45 or “cause it to be posted” by transferring the electronic data from which the mail is pre-pared. In the counterfactual situation with non-distortionary terminal dues rates, the incentive to remail would disappear, meaning that global mail flows may change. This dynamic effect is not taken into account in our model.
Proportional regional participation model In lack of detailed data on bilateral mail volumes, our model assumes that the bilateral mail flows between two countries in different geographical regions mirror the aggregated mail flows between those regions. I.e. if 30 percent of region A’s mail volume from region B comes from country y in region B, then 30 percent of the mail volume from region B going to country x in region A is also assumed to come from country y. This is a rather strict assumption that does not take into account that some countries may have strong links, in-creasing the relative mail flow between those two countries. This may for example be the case with respect to some countries in Europe with strong links to previous colonies in Africa or in the Caribbean. It may also be the case with respect to some countries, e.g. in Europe, where the level of e-com-merce from Asia is particularly high.
In order to correct for this, one would have to collect more detailed informa-tion about specific bilateral mail volumes. Since this information often is not publicly available, we have refrained from this in our model.
44 Where a company is considered to reside is matter of judgement for postal officials. A large multinational company like Citibank (in one famous case in Europe) could be deemed to reside in almost every country in the world.
45 An extraterritorial office of exchange (ETOE) is defined as a facility operated by a designated postal oper-ator in the territory of another country.
38

Chapter 3Applying the model – estimating net transfers
Based on the model described in chapter 2, we are able to estimate financial transfers between 183 designated postal operators worldwide. For each postal operator exhibiting certain characteristics with respect to the size and composition of bilateral mail flows, the actual terminal dues received/paid, and the level of the equivalent domestic postage in the home market, we are able to estimate financial transfers related to inbound as well as outbound cross-border mail. In this chapter, we outline our findings.
Since our model includes a number of assumptions regarding bilateral mail flows, terminal dues in the counterfactual situation, and the existence of bi-lateral agreements (not subject to UPU terminal dues), we cannot claim to estimate precise net financial transfers for individual postal operators. For this reason, when reporting the results from our modelling, we refrain from identifying individual postal operators.
Irrespective of this, our results still provide valuable information regarding the magnitude and direction of financial transfers across designated postal operators worldwide. They also provide valuable insights regarding the char-acteristics of designated postal operators determining whether and to what extent a postal operator is likely to experience positive or negative financial transfers in the current system.
3.1 Net financial transfersOur modelling exercise estimates a total value of net financial transfers between 154 designated postal operators of 966 million SDR in 2014, corres-ponding to 1,371 million USD. Taking into account that some postal operat-ors in our analysis use other types of agreements (e.g. REIMS or bilateral agreements), these figures most likely represent an upper bound of financial transfers created by the UPU terminal dues system.
The estimated levels of financial transfers in our model differ substantially across countries. Whereas many designated postal operators (primarily in Africa, South America, and the Middle East) experience estimated net finan-cial transfers of 5 million SDR (approximately 7 million USD) or less, there is also a large number of postal operators that experience substantially larger estimated net transfers (up to approximately 268 million SDR, corresponding to over 381 million USD).
39

Our estimations show that whereas the negative net transfers generated by the terminal dues system are concentrated to a relatively small number of designated postal operators (31), the positive net transfers are distributed among a much larger number of operators (123). In fact, according to our model, 98 percent of the estimated negative net transfers generated by the terminal dues system are concentrated to only 15 designated postal operat-ors. Among these, the postal operators with the largest estimated negative net transfers incurred losses of more than 6 million SDR each (approximately 8.5 million USD) in 2014, cf. Figure 7.
Figure 7 Postal operators with largest estimated negative net transfers 2014 (million SDR)
1 2 3 4 5 6 7 8 9 10 11 12 13 14 15
(300.00)
(250.00)
(200.00)
(150.00)
(100.00)
(50.00)
-
Million SDR
Note: Each number represents a designated postal operatorSource: Copenhagen Economics based on modelling results
As regards the positive net transfers, we observe a slightly different picture with a larger number of designated postal operators sharing the estimated positive transfers generated by the terminal dues system. Nevertheless, there are a small number of postal operators that experience significantly higher positive estimated transfers than the others. These operators all incurred an estimated net gain of more than 50 million SDR (approximately 70 million USD) each in 2014, cf. Figure 8. Altogether, the net financial gains experi-enced by the 15 postal operators with the largest positive transfers in 2014 represent 69 percent of the total positive net transfers generated by the cur-rent system.
40

Figure 8 Postal operators with largest estimated positive net transfers 2014 (million SDR)
16 17 18 19 20 21 22 23 24 25 26 27 28 29 30 -
20.00
40.00
60.00
80.00
100.00
120.00
140.00
160.00 Million SDR
Note: Each number represents a designated postal operatorSource: Copenhagen Economics based on modelling results
The net financial transfer experienced by a designated postal operator is composed of two effects: an inbound effect (for cross-border letter mail com-ing from other countries) and an outbound effect (for cross-border letter mail sent to other countries). Thus, an operator experiencing positive financial transfers on the outbound side can still experience negative net transfers if the negative transfers on the inbound side are large enough.
As a general rule, a designated postal operator that is losing money on in-bound mail flows and gaining money on outbound mail flows will experience larger losses if it is a net importer of mail than if it is a net exporter of mail. Net-importing postal operators with a high price for last-mile handling of do-mestic letter post items (i.e. a high counterfactual terminal dues rate) will experience the largest negative transfers in the current system. Net-export-ing postal operators with a price for last-mile handling of domestic letter post items similar or even below the actual terminal dues rates will experience the largest positive transfers in the current system.
Nevertheless, a large cross-border flow of letter mail is capable of offsetting a small difference between actual and counterfactual terminal dues applic-able to that mail flow. Similarly, a large difference between actual and coun-terfactual terminal dues can lead to a large financial gain/loss, also for an operator with relatively small cross-border mail volumes. For any difference between actual and counterfactual terminal dues on inbound as well as on outbound mail flows, however, larger cross-border mail flows will always in-crease the financial impact of the terminal dues system. As a consequence, the largest transfers created by the current system of terminal dues will fol-low the largest global mail flows.
41
In order to understand better what factors determine whether and to what extent a specific postal operator is likely to experience positive or negative financial transfers, we will in the following disaggregate the net financial transfers into the inbound effect and the outbound effect and analyse both of them more in depth.
3.2 Inbound effectThe inbound effect (for a receiving postal operator and a specific bilateral mail flow) equals the difference between the actual terminal dues rate re-ceived for inbound letter mail and the equivalent domestic postage (repres-enting the counterfactual terminal dues), times the amount of inbound cross-border letter post affected by terminal dues.
If the current terminal dues rate is below the equivalent domestic postage rate, this means that the payment per inbound letter post item would in-crease in the counterfactual, thereby making the receiving postal operator better off. In terms of financial transfers, this means that the receiving postal operator today is experiencing a negative financial transfer on the inbound letter flow.
According to our estimations, 69 designated postal operators experience a negative financial transfer on inbound volumes whereas 85 postal operators experience a positive financial transfer on inbound volumes. However, in terms of value, the positive financial transfers on the inbound side corres-pond to only three percent of the negative inbound transfers. This implies that the positive inbound transfer per operator is very low, something that is also supported by our modelling results. Taking a closer look at the desig-nated operators receiving positive net transfers on the inbound side, we ob-serve that none of the operators in our model has an estimated positive trans-fer on inbound volumes larger than 8 million SDR and all but three operators have an estimated positive transfer lower than 5 million SDR, cf. Figure 9.
42

Figure 9 Postal operators with largest estimated positive transfers for inbound mail flows 2014
31 17 25 16 18 20 32 29 33 34 35 36 37 38 390
2
4
6
8
10
12
14Million SDR
Note: Each number represents a designated postal operator.Source: Copenhagen Economics based on modelling results
As the diagram above reveals, some of the designated operators with large positive transfers on inbound flows (operators 16, 17, 18, and 20) are also among the designated operators with the largest positive net transfers, cf. Figure 8.
The size of the financial transfer on inbound mail volumes depend on two parameters: (i) the difference between the actual and the counterfactual ter-minal dues rates and (ii) the amount of inbound mail volumes.
As a proxy for the difference between actual and counterfactual terminal dues rates, we use the ratio between the financial transfers experienced on inbound mail volumes and the total inbound mail flow. This provides us with an estimate of the gain (or loss) per inbound item experienced by the desig-nated postal operator. The analysis reveals three designated postal operators that gain more than 0.5 SDR (0.7 USD) per inbound letter. The relatively large gains in these countries may reflect the fact that domestic postage rates for single-piece letters often are subsidised in order to ensure affordab-ility and accessibility of a basic letter service.
43

Figure 10 Estimated gain per item (inbound mail flows - top 15)
41 42 43 44 45 46 47 48 49 50 51 52 37 38 530
0.1
0.2
0.3
0.4
0.5
0.6
0.7
0.8
0.9SDR
Note: Each number represents a designated postal operatorSource: Copenhagen Economics based on modelling results
Worth noting is that only two of the 15 designated postal operators in the diagram above (operators 37 and 38) also belong to the group of 15 postal operators experiencing the largest positive transfers on inbound mail flows, cf. Figure 9. The reason for this is that most operators in the diagram above have very small inbound mail flows (resulting in a small total transfers on inbound volumes). Thus, the main driver for large positive transfers does not seem to be the difference between actual and counterfactual terminal dues, but a large inbound mail flow.
In order to understand better how different drivers affect the levels of finan-cial transfers, Table 5 shows how the size of the inbound mail flow and the difference between terminal dues and equivalent domestic postage rates translate into different levels of financial transfers on inbound volumes.
Table 5 Illustration: Drivers of positive inbound effectsOperator Inbound mail flow
(million items)Gain per inbound item
(SDR) Estimated financial transfer on inbound flows
(million SDR)20 28.0 0.20 5.525 27.6 0.32 8.730 3.3 0.20 0.632 26.1 0.20 5.341 0.04 0.79 0.03
Source: Copenhagen Economics based on modelling data
The table reveals three important findings. First, comparing the results for operator 20 and operator 24 in the table above reveals that, in cases where inbound volumes are fairly similar, differences in the gain per inbound item
44

can lead to significant differences in financial transfers. A large gain per item may, for example, be caused by an artificially low (regulated) domestic post-age. Second, comparing the results for operator 30 and operator 32 reveals that, when the gain per item is the same or very similar, the size of inbound mail flows are the determining factor for the size of inbound transfers. Third, a closer look at operator 44 reveals that, irrespective of how high the gains per item are, low volumes will still lead to a small total transfer.
If we instead turn to the postal operators experiencing a negative inbound effect, our estimations show that some postal operators experience estimated negative financial transfers of more than 100 million SDR, cf. Figure 11. The negative financial transfers per postal operator is thus significantly larger than the positive financial transfers per operator identified above. In other words, the financial loss per operator experiencing a negative transfer is much larger than the financial gain per operator experiencing a positive transfer.
Figure 11 Postal operators with largest estimated negative transfers for inbound mail flows 2014
1 2 19 3 4 23 22 5 6 8 7 9 11 10 40
(300.00)
(250.00)
(200.00)
(150.00)
(100.00)
(50.00)
-
Million SDR
Note: Each number represents a designated postal operator.Source: Copenhagen Economics based on modelling results
We also observe that 11 of the designated operators with the largest estim-ated negative financial transfer on the inbound side also are among the des-ignated operators who experience the largest negative net transfers, cf. Fig-ure 7. For these operators, the large negative transfers on inbound volumes outweigh any positive transfers that they may experience on outbound volumes. Worth noting is also that two of the operators in Figure 11 above, despite their large negative transfers on inbound volumes, still belong to the group of postal operators experiencing the largest positive net transfers, cf. Figure 8. For these operators, positive financial transfers on outbound volumes will outweigh the negative effect on inbound volumes.
45

Similar to the case of positive transfers on the inbound side, the negative transfers observed above can be the result of a large difference between ac-tual and counterfactual terminal dues rates and/or a large inbound mail flow. Using the loss per inbound item as a proxy for the difference between actual and counterfactual terminal dues rates, we observe losses per inbound item over 1.8 SDR per item, cf. Figure 12.
Figure 12 Estimated loss per item (inbound mail flows - top 15)
54 2 1 12 7 55 10 4 56 13 57 11 58 23 59
-2-1.8-1.6-1.4-1.2
-1-0.8-0.6-0.4-0.2
0
SDR
Note: Each number represents a designated postal operator.Source: Copenhagen Economics based on modelling results
Several of the postal operators in the diagram above are also, due to their large inbound mail flows, among the 15 postal operators experiencing the largest negative transfers on inbound mail flows.
Table 6 demonstrates how different characteristics with respect to the size of the inbound mail flow and the difference between terminal dues and equival-ent domestic postage rates translate into different levels of financial transfers on inbound volumes.
Table 6 Illustration: Drivers of negative inbound effectsOperator Inbound mail flow
(million items)Loss per inbound item
(SDR) Estimated financial transfer on inbound flows
(million SDR)61 25.0 -0.29 -7.112 25.4 -1.07 -27.27 63.4 -0.99 -63.455 0.5 -0.99 -0.554 0.6 -1.82 -1.1
Source: Copenhagen Economics based on modelling data
46

The table reveals three important findings, very similar to those for the posit-ive inbound effects. First, comparing the results for operator 64 and operator 12 in the table above reveals that, in cases where inbound volumes are fairly similar, differences in the loss per inbound item can lead to significant differ-ences in financial transfers. A large loss per item may, for example, be caused by a high domestic postage rate in combination with a large share of inbound volumes being subject to capped terminal dues. Second, comparing the results for operator 7 and operator 58 reveals that, when the loss per item is the same or very similar, the size of inbound mail flows are the de-termining factor for the size of inbound transfers. Third, a closer look at oper-ator 57 reveals that, irrespective of how high the losses per item are, low volumes will still lead to a small total transfer.
3.3 Outbound effectThe outbound effect (for a specific postal operator and a specific bilateral mail flow) equals the difference between the terminal dues paid to the receiv-ing postal operator and the equivalent domestic postage in the receiving country, times the amount of outbound letter post items.
If the current terminal dues rate charged by the designated postal operator in the destination country is below the counterfactual terminal dues rate (in our model represented by the equivalent domestic postage), this means that the payment per outbound letter post item would increase in the counterfac-tual, thereby making the sending postal operator worse off. In terms of finan-cial transfers, this means that the sending postal operator today is experien-cing a positive financial transfer on the outbound letter flow (since it is pay-ing less than what it would pay in the counterfactual situation).
Our modelling shows that, in contrast to the inbound mail flows, all desig-nated postal operators experience an estimated financial gain on outbound mail flows. The positive transfers on outbound mail volumes range from less than 1,000 SDR for some operators to more than 200 million SDR for others. The 15 designated postal operators with the largest estimated positive trans-fers on outbound mail flows are displayed in Figure 13.
47

Figure 13 Postal operators with largest estimated positive transfers for outbound mail flows
19 16 23 22 17 18 3 20 40 21 9 8 24 60 26 -
50
100
150
200
250 Million SDR
Note: Each number represents a designated postal operator.Source: Copenhagen Economics based on modelling results
As the diagram reveals, there are a few postal operators that, due to the size of their outbound mail flows and their composition of bilateral mail flows, generate significantly higher positive transfers than the others. In addition to this, we also observe that ten out of the 15 operators in the diagram above belong to the group of operators in Figure 8 with the largest positive net transfers generated from the current system of terminal dues. Three of these operators are number 19, 22 and 23, which also were among the operators with the largest negative transfers on inbound mail flows. The positive net financial transfers for these operators are thus a result of large positive ef-fects on the outbound side outweighing large negative effects on the inbound side. As for the other operators in the diagram above belonging to the group with the largest positive net transfers, the large positive net transfer is due to a combination of a large positive transfer on both inbound and outbound mail volumes.
Table 7 demonstrates how different characteristics with respect to the size of the outbound mail flow and the composition of bilateral mail flows translate into different levels of financial transfers on outbound volumes.
Table 7 Illustration: Drivers of outbound effectsOperator Outbound mail flow
(million items)Share of outbound flows subject to capped TDs
Estimated financial transfer on outbound flows(million SDR)
20 44.7 High 38.71 44.5 Low 7.224 28.6 High 22.760 78.5 Low 21.1
48

Source: Copenhagen Economics based on modelling data
The information in the table above reveals that differences in the share of outbound flows subject to capped terminal dues can be a determining factor for the size of outbound financial transfers. However, large differences in the share of outbound flows subject to capped terminal dues can be compensated for by large differences in outbound mail flows, thereby leading to similar levels of financial transfers. This clearly shows that the composition of finan-cial transfers is complex and that two postal operators experiencing very sim-ilar levels of transfers can do so for different reasons.
3.4 Net effect by letter formatWe have examined how the financial transfers are allocated among different letter formats (P, G and E). The conclusion from this analysis is quite clear: The financial net transfers are primarily caused by small packets. Out of the total financial net effect of 966 million SDR 158 million (16%) comes from small letters, 136 million (14%) from large envelopes and 672 million (70%) from small packets, see Figure 14. Small packets are the largest contributor because the equivalent domestic prices for these are the highest, while the current terminal due rates do not incorporate this into the calculations.
Figure 14 Distribution of net effect by letter format
P
G
E
Source: Copenhagen Economics based on modelling data
49

3.5 Financial transfers between geographical regionsOur model based on bilateral mail flows, also enable us to analyse the geo-graphical pattern of financial transfers. We have done this by focussing on the financial net transfers between the seven regions in our model.
In essence, we find three significant financial net transfers, when we con-sider transfers between regions:
1. A financial net transfer from Western Europe to Eastern Europe & Central Asia
2. A financial transfer from North America to Asia-Pacific3. A Financial transfer from Western Europe to Asia-Pacific.
The two regions with largest negative effect are Western Europe and North America, and the two regions with largest positive net effect are Asia-Pacific and Eastern Europe & Central Asia, see Figure 15.
50

Figure 15 Financial transfers between geographical re-gions
Note: The figures show the total financial net transfer between the regions. A green box indicates that there is a positive net transfer to the region, while a red box indicates that there is a negative net transfer from the region.
Source: Copenhagen Economics based on modelling data
51
-500
-250
0
250
500 Asia-Pacific

3.6 Sensitivity analysisThe model used to estimate financial transfers is based on a number of as-sumptions regarding bilateral mail flows and non-distortionary terminal dues in the counterfactual. In order to take into account that the reality may differ from our assumptions in the model, we conduct two sensitivity checks where we vary the most important assumptions in the model. The outcome of the sensitivity analysis will show (i) how important these assumptions are for the outcome of our analysis and (ii) within which span the actual levels of net financial transfers are likely to be.
The two assumptions that we vary in our sensitivity analysis are: The share of single-piece rates used as a basis for equivalent domestic
postage The share of small packets in the cross-border mail mix
Share of single-piece rates used as basis for equivalent domestic postage
The assumption that the equivalent domestic postage rates for last-mile deliv-ery of cross-border mail can be approximated by 70 percent of the price for domestic end-to-end delivery of single piece letters is not necessarily correct. In a study about postal operators’ pricing behaviour, conducted on behalf of the European Commission in 2011, we found that single piece items (on aver-age) were priced over 45 percent higher than transactional bulk mail and bulk mail was priced almost 50 percent higher than direct mail. This suggests that a 30 percent discount on single piece tariffs may not be enough to reflect the equivalent domestic postage for last-mile delivery of cross-border letters. Moreover, in some countries, the domestic postage rates for single-piece items are subject to regulation to ensure that postal services are available to everyone at affordable rates. In these countries, the single-piece postage rates may thus be subsidised to a low level.
In order to take this into consideration, we conduct a sensitivity analysis where we run our model with the assumption that the equivalent domestic postage rates can be approximated by 80 percent, 60 percent and 50 percent of the domestic postage rates for single-piece items respectively. Table 8 shows the outcome of the sensitivity analysis. It reveals total financial trans-fers generated by the current terminal dues system ranging from 602 million SDR (corresponding to 855 million USD) to 1,160 million SDR (corresponding to 1,647 USD). For every 10 percent increase/reduction in the share of the single-piece postage used as basis for calculating equivalent domestic post-age rates, we observe that the total financial transfers generated increase/de-cline by approximately 20 percent.
52

Table 8 Sensitivity analysis: Equivalent domestic postage ratesShare of single-piece domestic rates used as basis for equivalent do-mestic postage
Total financial transfers created by the current terminal dues system
(million SDR)
Number of operators experiencing positive financial net transfers
Number of operators experiencing negative financial net transfers
50% 602 124 30 60% 774 124 30 70% (base case) 966 123 31 80% 1,160 121 33
Source: Copenhagen Economics based on modelling
Share of small packets in the cross-border mail mixIn our base case, the share of small packets (E format items) in the cross-bor-der mail mix is estimated based on a UPU survey from among 49 designated postal operators. The survey contains regional estimates for the distribution of formats (P, G, E) in the cross-border mail mix (in percentage of number of items and weight).46 By assuming that the distribution of P, G and E items in a specific bilateral mail flow between two regions is the same as the distribu-tion of P, G, and E items in the total inter-regional mail flow between the same two regions, we arrive at a per-format estimate of letter mail volumes for each bilateral mail stream.
However, as recognised in several publications already47, an increasing level of cross-border e-commerce also implies a change in the cross-border mail mix in terms of a larger share of small packets. In order to take this into ac-count, we conduct a sensitivity analysis where we run our model with the assumption that the share of E format items in the cross-border mail mix in-creases by 15 percent and 30 percent respectively for all designated postal operators. While doing this, we assume that the shares of P and G format items decline proportionately, such that the total number of letter post items remains the same. Table 9 shows the outcome of the sensitivity analysis. It reveals that a higher share of small packets in the cross-border mail mix cre-ates larger total transfers in the system (ranging from 966 million SDR in the base case to 1,131 million SDR in the case where the share of small packets is increase by 30 percent in all flows).
Table 9 Sensitivity analysis: Share of small packets in mail mixRelative increase in the share of small packets in the cross-border mail mix
Total financial transfers created by the current terminal dues system
(million SDR)
Number of operators experiencing positive financial net transfers
Number of operators experiencing negative financial net transfers
0 (base case) 966 123 31
46 UPU, (2014b), POC C3 LPRG 2014.2 Doc 4a, “Results of the items per kilogramme (IPK) study” (commit-tee document).
47 See for example UPU (2014), “Fulfilling the global e-commerce promise,” and UPU (2013), Union Postale no.4 December 2013, p.17
53

15 percent 1,048 123 31 30 percent 1,131 123 31
Source: Copenhagen Economics based on modelling
Worth noting is also that the number of designated postal operators experien-cing negative net transfers declines as the share of small packets in the mail mix increases. This is due to the fact that two designated postal operators with very small negative net transfers in the base case (less than 1,000 SDR each) will experience small positive net transfers as the share of small pack-ets in the mail mix increases.
54

References
Campbell (2014), “Estimating the effects of UPU terminal dues 2014-2017”, http://idei.fr/sites/default/files/medias/doc/conf/pos/2014/presentations/camp-bell_presentation_postconf_2014.pdf Campbell (1998), “Comment on REIMS II Terminal Dues Agreement”, http://www.jcampbell.com/Papers/CP_specific_issues.pdf Campbell (1997), “Evolution of the Postal Function in Long Distance Mar-kets”, http://www.jcampbell.com/Papers/CP_specific_issues.pdf Copenhagen Economics (2014), “The Economics of Terminal Dues”, report prepared for the Postal Regulatory Commission, http://www.prc.gov/sites/de-fault/files/reports/The%20Economics%20of%20Terminal%20Dues_final%20report%20300914.pdfIPC (2009), ”Trends and challenges in cross-border mail markets”, https://www.ipc.be/en/media/~/media/documents/public/crossborder_bukovc.ashx UPU (2015a), “Statistics and Accounting Guide”, http://www.upu.int/uploads/tx_sbdownloader/guideTerminalDuesStatisticsAccountingEn.pdfUPU (2015b), “UPU Postal Statistics Database”, http://pls.upu.int/pls/ap/ssp_report.main?p_language=AN&p_choice=BROWSEUPU (2014a), “Fulfilling the global e-commerce promise” UPU (2014b), ”Development strategies for the postal sector: An economic perspective”, http://www.upu.int/uploads/tx_sbdownloader/publication-TrendsDevelopmentStrategiesForThePostalSectorEn.pdf UPU (2014c), “Development of postal services in 2013”, http://www.upu.int/fileadmin/documentsFiles/resources/postalStatistics/developmentOf-PostalServicesIn2013En.pdf UPU, (2014d), POC C3 LPRG 2014.2 Doc 4a, “Results of the items per kilo-gramme (IPK) study” (committee document).UPU (2014e), “International Bureau Circular 112”UPU (2013), “Union Postale no.4 December 2013”, http://news.upu.int/up-loads/media/union_postale_4_2013_en.pdf UPU (2012a), “UPU terminal dues system for the period 2014-2017, Joint Council of Administration and Postal Operations Council report”, http://docu-ments.upu.int/Bodies/2012/CNG/CNG%20DOC/MEETING/CNG%20DOC%202012/Doc%2020b/EN/cng_doc_d020b.pdf?Mobile=1&Source=%2F_lay-

outs%2Fmobile%2Fview.aspx%3FList%3D9cab4832-53b8-40f5-9ca4-8566e0ab0364%26View%3D895ea13c-b413-4ce7-b5cb-912051fecf08%26RootFolder%3D%252FBodies%252F2012%252FCNG%252FCNG%2520DOC%252FMEETING%252FCNG%2520DOC%25202012%252FDoc%252020b%252FEN%26CurrentPage%3D1UPU (2012b), “2012 Convention”, Arts. 29-31; 2013 Letter Post Regulations, Art. RL 220 (target rate formula).WIK Consult (2013), “Main developments in the postal sector 2010-2013”, http://ec.europa.eu/internal_market/post/doc/studies/20130821_wik_md2013-final-report_en.pdf
56