Embed Size (px)
Citation preview

1
Tennessee Gas Pipeline
2015 Customer Meeting Business Session
Thursday August 13,2015

2
Agenda
Thursday, August 13th, 2015
8:30 a.m. Welcome Sital Mody
8:45 a.m. Pipeline Operations Update Ray Miller
9:05 a.m. Macro Overview and TGP flow changes Ernesto Ochoa
9:25 a.m. Break
9:45 a.m. Business Development Projects Paul Smith
10:05 a.m. Northeast Energy Direct Update Curtis Cole
10:25 a.m. Pipeline Expansion in New England Suedeen Kelly
11:20 a.m. Closing Remarks and Q&A TGP Team
11:45 a.m. Lunch Salt
11:50 to 5:30 p.m. Afternoon Activities (As Selected)
6:30 p.m. Social Solarium
7:45 p.m. Dinner Wentworth Ballroom

3
This presentation contains forward-looking statements. These forward-looking statements are identified as any statement that does not relate strictly
to historical or current facts. In particular, statements, express or implied, concerning future actions, conditions or events, future operating results or
the ability to generate revenues, income or cash flow or to pay dividends are forward-looking statements. Forward-looking statements are not
guarantees of performance. They involve risks, uncertainties and assumptions. Future actions, conditions or events and future results of operations of
Kinder Morgan, Inc. may differ materially from those expressed in these forward-looking statements. Many of the factors that will determine these
results are beyond Kinder Morgan's ability to control or predict. These statements are necessarily based upon various assumptions involving
judgments with respect to the future, including, among others, the ability to achieve synergies and revenue growth; national, international, regional
and local economic, competitive and regulatory conditions and developments; technological developments; capital and credit markets conditions;
inflation rates; interest rates; the political and economic stability of oil producing nations; energy markets; weather conditions; environmental
conditions; business and regulatory or legal decisions; the pace of deregulation of retail natural gas and electricity and certain agricultural products;
the timing and success of business development efforts; terrorism; and other uncertainties. There is no assurance that any of the actions, events or
results of the forward-looking statements will occur, or if any of them do, what impact they will have on our results of operations or financial
condition. Because of these uncertainties, you are cautioned not to put undue reliance on any forward-looking statement. Please read "Risk Factors"
and "Information Regarding Forward-Looking Statements" in our most recent Annual Report on Form 10-K and our subsequently filed Exchange Act
reports, which are available through the SEC’s EDGAR system at www.sec.gov and on our website at www.kindermorgan.com.
We use non-generally accepted accounting principles (“non-GAAP”) financial measures in this presentation. Our reconciliation of non-
GAAP financial measures to comparable GAAP measures can be found in the Appendix to our Analyst Day presentation, dated
1/28/2015, on our website at www.kindermorgan.com. These non-GAAP measures should not be considered an alternative to GAAP
financial measures.
Forward-Looking Statements / Non-GAAP Financial Measures

5
Marcellus/Utica
SCOOP/Stack
5

6
Agenda
• Past Winter
• This Summer
• Storage
• Pipeline Integrity
• Operational Expectations
• Pictures
• Scheduling NOPR
7
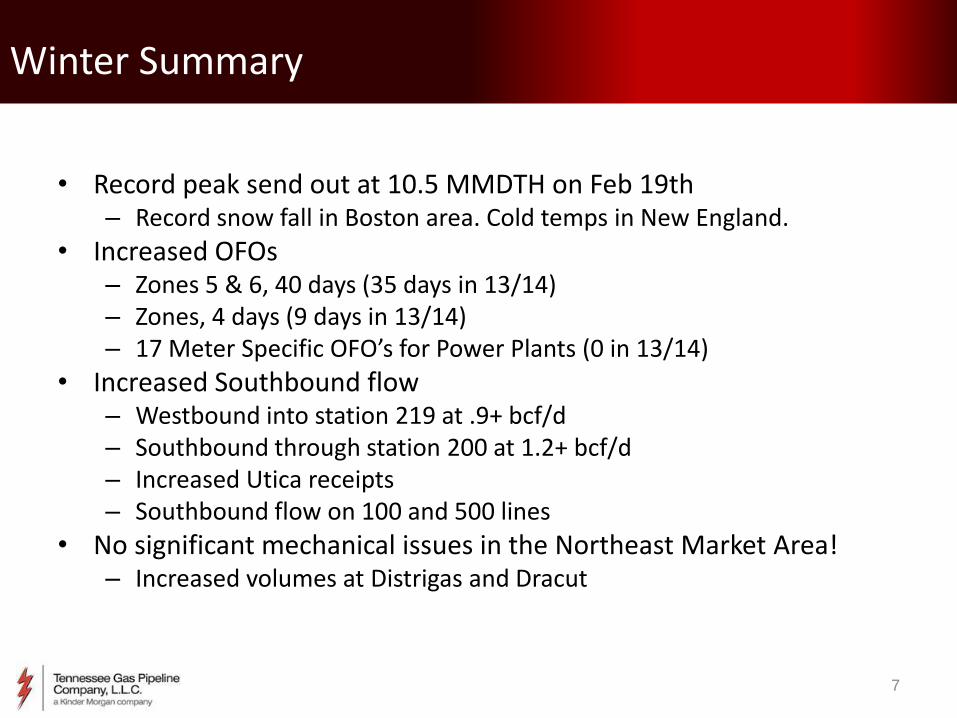
Winter Summary
• Record peak send out at 10.5 MMDTH on Feb 19th – Record snow fall in Boston area. Cold temps in New England.
• Increased OFOs – Zones 5 & 6, 40 days (35 days in 13/14) – Zones, 4 days (9 days in 13/14) – 17 Meter Specific OFO’s for Power Plants (0 in 13/14)
• Increased Southbound flow – Westbound into station 219 at .9+ bcf/d – Southbound through station 200 at 1.2+ bcf/d – Increased Utica receipts – Southbound flow on 100 and 500 lines
• No significant mechanical issues in the Northeast Market Area! – Increased volumes at Distrigas and Dracut
8
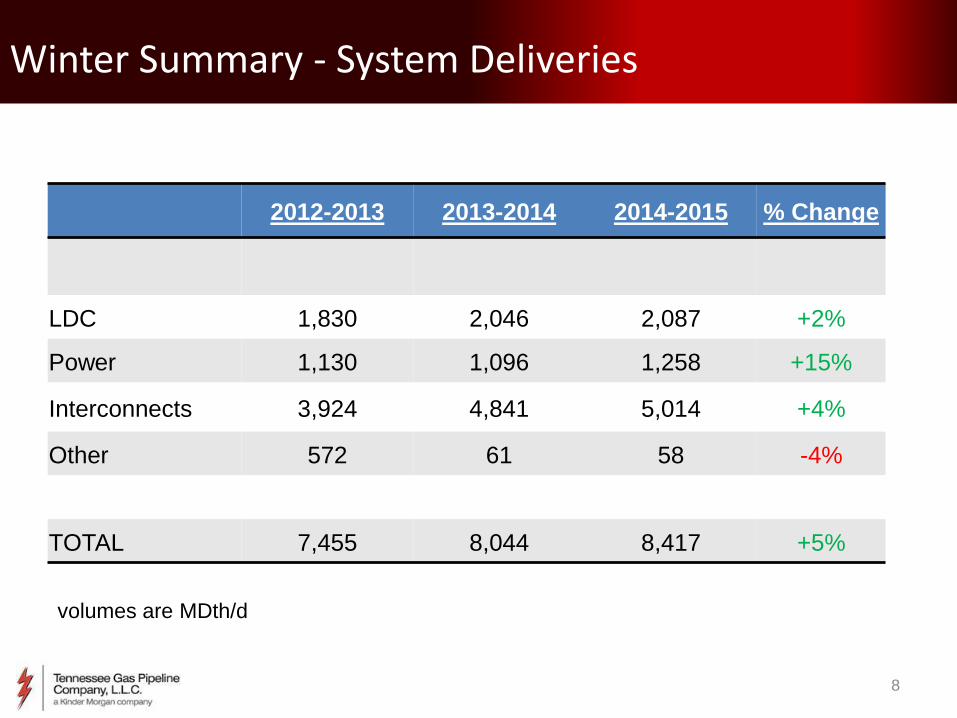
Winter Summary - System Deliveries
2012-2013 2013-2014 2014-2015 % Change
LDC 1,830 2,046 2,087 +2%
Power 1,130 1,096 1,258 +15%
Interconnects 3,924 4,841 5,014 +4%
Other 572 61 58 -4%
TOTAL 7,455 8,044 8,417 +5%
volumes are MDth/d
9
-
200
400
600
800
1,000
1,200
1,400
1,600
2009-2010 2010-2011 2011-2012 2012-2013 2013-2014 2014-2015
Zone 6
Zone 5
Zone 4
Zone 2
Zone 1
Zone 0
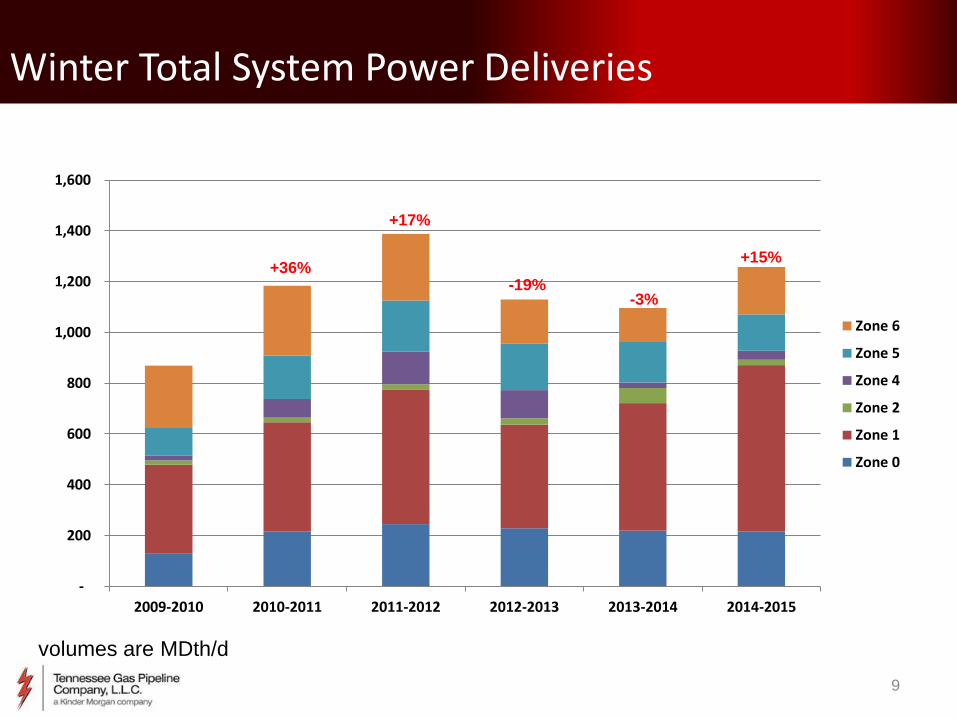
Winter Total System Power Deliveries
volumes are MDth/d
+36%
+17%
-19% -3%
+15%

10
Cold New England Weather
200
400
600
800
1000
1200
1400
Nov Dec Jan Feb Mar
HD
Ds
Winter 2014/15
Winter 2013/14
Winter 2012/13
30 Year Average

11
Winter New England Deliveries
2012-2013 2013-2014 2014-2015 % Change
LDC 1,324 1,467 1,511 +3%
Power 346 274 315 +15%
Interconnects 468 1,316 1362 +3%
TOTAL 2,137 3,057 3,187 +4%
volumes are MDth/d

12
0
200
400
600
800
1,000
1,200
1,400
1,600
1,800
2,000
Jan Feb Mar Apr May Jun Jul Aug Sep Oct Nov Dec
2012 2013 2014 2015 YTD
• All volumes are MDth/d
Winter New England LDC Deliveries

13
Winter North Supply Analysis
Winter Period (Nov-Mar) Average MDth/d
0
500
1,000
1,500
2,000
2,500
3,000
3,500
4,000
4,500
5,000
09-10 10-11 11-12 12-13 13-14 14-15
Dracut
Distrigas
Shelton
Wright
Niagara
Marcellus
Utica
Rex
+70%
+15% +5%
+38%
+17%
Total Marcellus supply was
over 19 bcf/d this winter!

14
0
100
200
300
400
500
600
700
800
900
1,000
11-12 12-13 13-14 14-15
Canada
Mexico
Winter System Exports
-1% -2%
volumes are MDth/d
+155%

15
Summer Summary
• Demand is up (vs previous summer) – Overall system - 7% higher – Power Generation - 15% higher
• Market Area Supply continues to increase – Increase in both Utica and Marcellus Supply
• Increased Southbound Flows – Station 200 (Ohio) – 1.5 to 1.6 Bcf/d – Station 860 (Tennessee) - 0.8 – 0.9 Bcf/d – South Texas market remains strong
• Main drivers – Heat and Storage fill – High level of system maintenance, repair, rebuild activity
• GETTING READY FOR WINTER
16
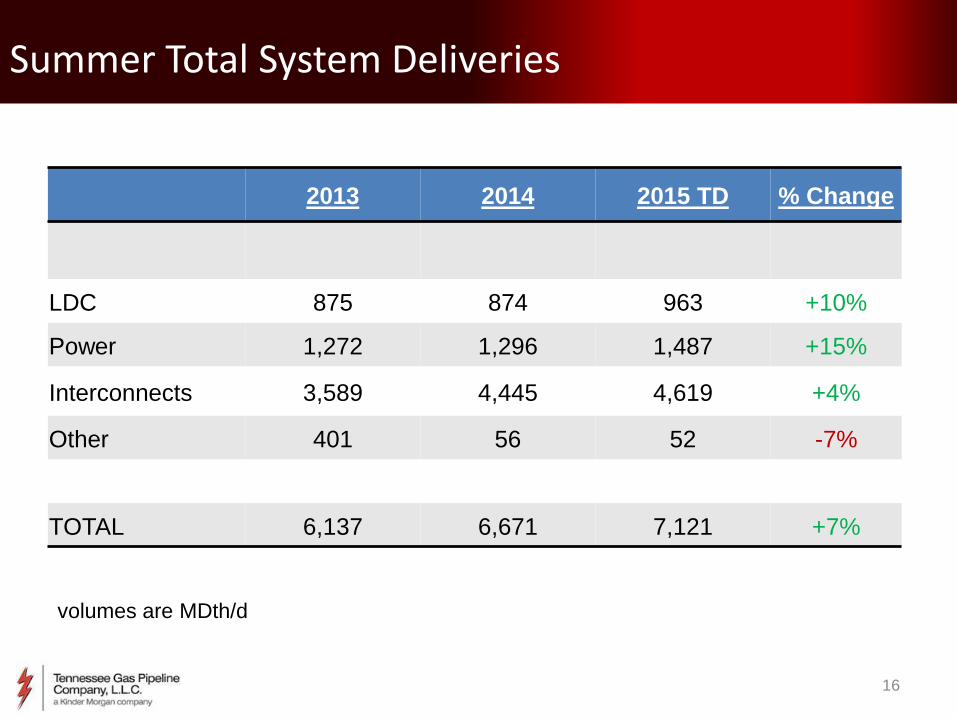
Summer Total System Deliveries
2013 2014 2015 TD % Change
LDC 875 874 963 +10%
Power 1,272 1,296 1,487 +15%
Interconnects 3,589 4,445 4,619 +4%
Other 401 56 52 -7%
TOTAL 6,137 6,671 7,121 +7%
volumes are MDth/d
17
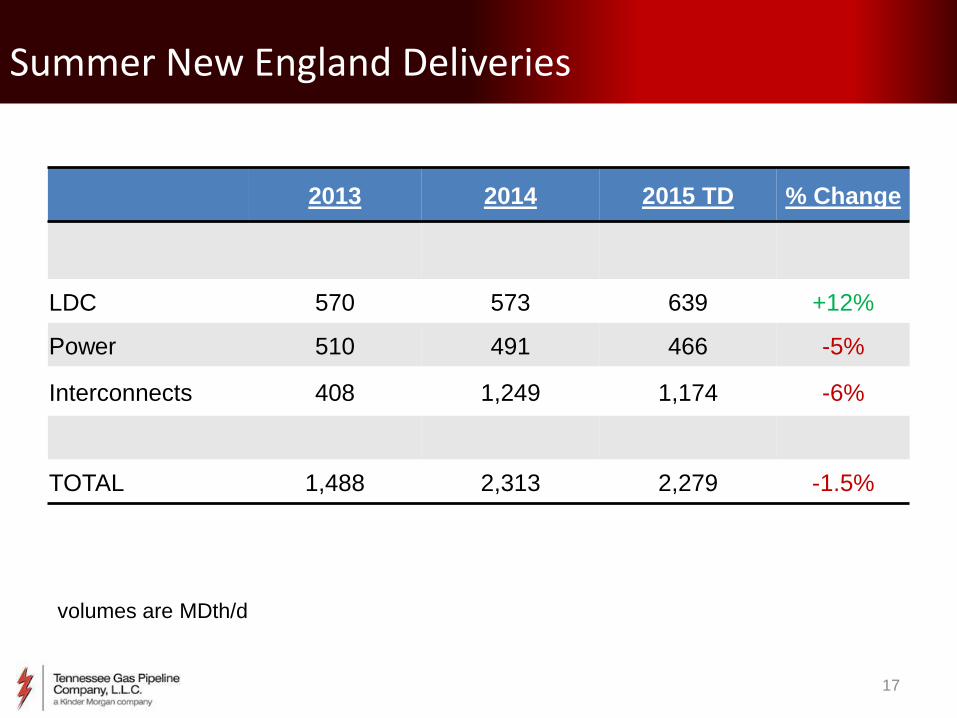
Summer New England Deliveries
2013 2014 2015 TD % Change
LDC 570 573 639 +12%
Power 510 491 466 -5%
Interconnects 408 1,249 1,174 -6%
TOTAL 1,488 2,313 2,279 -1.5%
volumes are MDth/d

18
-
200
400
600
800
1,000
1,200
1,400
1,600
1,800
2009 2010 2011 2012 2013 2014 2015 TD
Zone 6
Zone 5
Zone 4
Zone 2
Zone 1
Zone 0
Summer Total System Power Deliveries
volumes are MDth/d
+22%
+9%
+16%
-22% +2%
+15%

19
0
500
1,000
1,500
2,000
2,500
3,000
3,500
4,000
4,500
2010 2011 2012 2013 2014 2015 TD
Dracut
Distrigas
Shelton
Wright
Niagara
Marcellus
Utica
Rex
Summer North Supply Analysis
volumes are MDth/d
+52%
+13% +8%
+36%
+15%
Total Marcellus supply near
20 bcf/d this summer!

20
National EIA Storage Statistics Through 07-31-2015
0
500
1000
1500
2000
2500
3000
3500
4000
Oct Nov Dec Jan Feb Mar Apr May Jun Jul Aug Sep Oct
BC
F
5 Year Range
2002-2003
2013-2014
2014-2015
5 Year Average 2009-2014
535 Bcf > 2014; 64 Bcf > 5 Yr. Avg. 32 Bcf Inj
2.912 Tcf Current Inventory
21
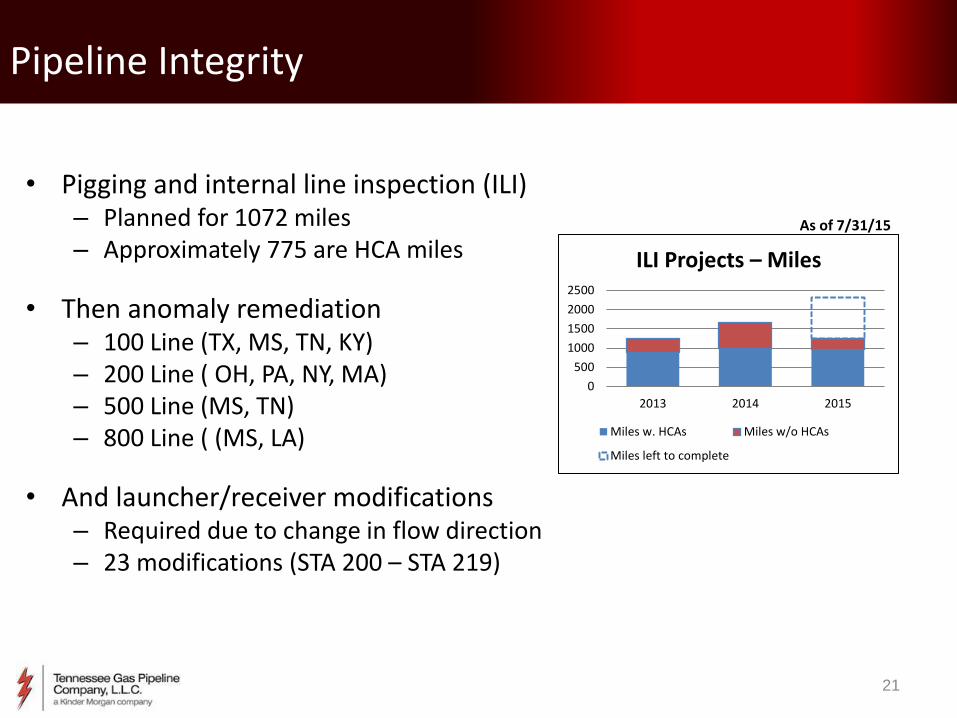
Pipeline Integrity
• Pigging and internal line inspection (ILI) – Planned for 1072 miles – Approximately 775 are HCA miles
• Then anomaly remediation – 100 Line (TX, MS, TN, KY) – 200 Line ( OH, PA, NY, MA) – 500 Line (MS, TN) – 800 Line ( (MS, LA)
• And launcher/receiver modifications – Required due to change in flow direction – 23 modifications (STA 200 – STA 219)
0
500
1000
1500
2000
2500
2013 2014 2015
ILI Projects – Miles
Miles w. HCAs Miles w/o HCAs
Miles left to complete
As of 7/31/15

22
Pipeline Integrity - Continued
• Hydrotest and Stress Corrosion Cracking (SCC) – 7 projects remaining 121 miles – 10 HCA miles – 200 Line- valve sections 261 and 262 – 100 Line, June - Nov – 800 Line valve section 843, Sept – Oct
• Class Changes – 100 & 500 Line – 17 miles of pipe to be replaced – 50% complete
• Other Integrity Work – 200 Line in Ohio – Pipe Inspections – Locational (IMU) Pig runs
0
50
100
150
2013 2014 2015
Pressure Test Projects - Miles
Miles w. HCAs Miles w/o HCAs
Miles left to complete
As of 7/31/15
23
Question
• It seems like we are seeing more events and postings that are causing interruptible service to be interrupted, including a few with warnings about firm service being interrupted, why?
24
Answer
• TGP utilization is at historical highs
• Good news: TGP is serving more customer needs than ever before
• Bad news: Limited flexibility to perform maintenance or repairs without an interruption.

25
Answer continued
Recent causes for limiting interruptible service – Planned maintenance – Unplanned maintenance – Required class location upgrades – Integrity work
• Installing/modifying pig launchers and receivers • Managing speed of internal tools during pig runs • Anomaly remediation (if required)
– Soil movement remediation program – Expansion Project work
• Tie-ins for new construction • Rebuilding of compressor stations • New interconnections

26
Top Ten List – Compressor Station Maintenance
• Top ten compressor station maintenance items – Reciprocating power piston damaged
– Reciprocating power head cracked
– Metal detection in lubricating oil
– Turbocharger overhaul or replacement
– Centrifugal power turbine replacement
– Hardware or software automation issue
– Environmental compliance
– Valve not operating properly during start/stop
– Component vibration exceeding limit
– Complete rebuild of compressor station
– Emergency shut down (ESD)

27
Top Ten List – Pipeline maintenance
• Top ten pipeline maintenance items – ID/OD metal loss (magflux internal inspection tool)
– Diameter (dent) analysis (Caliper tool)
– Seam corrosion (AFD tool)
– Stress corrosion cracking (hydrotest or emat tool)
– Non piggable inspections (hydrotest or direct inspection)
– Construction records program (hydrotest)
– Wrinkle bend inspections
– Pressure weld inspections
– Soil movement monitoring program
– Third party damage to the pipe

28
Operational Expectations
• Continued high utilization driven by Marcellus and Utica supplies
– Both East and West from on TGP 300 Line
– South on TGP 200 Line
– South on TGP 500 Line
– South on TGP 100 Line
• Exports to Mexico & Canada increase
• Maintenance activities continue
– Scheduling of work on 100, 200, 300, 400, 500, 800 lines
• SOP, SIP, (maybe PIP) may be at risk depending on many factors including amount of integrity remediation, weather, permitting, etc.
• Available capacity is and will continue to be tight

29
FERC Ruling on Scheduling NOPR
• FERC – Rule to modify regulations for the scheduling of transportation services on interstate natural gas pipelines to:
(1) improve coordination of the gas and electric industries, and (2) provide additional liquidity and scheduling flexibility to all shippers
• INGAA collectively and KM individually participated during process • Order 809 - effective April 1, 2016 for the entire gas industry
– No change to start of Gas Day – remains 9 am CCT – Timely Cycle nomination deadline; changed from 11:30am to 1pm CCT – Additional intraday nomination cycle at 7 pm CCT
• Reduced cycle processing times by 1 hour, and • Adjusted cycle timelines to minimize overlaps
• In addition NAESB 2.1 (now 3.0) modifications ordered
DART and KM processes will be upgraded to be compliant by deadline date

30
Station 245 HP Replacement
Main Line #1 Tie-in
with coating removed for
cut
Compressor Building construction
31
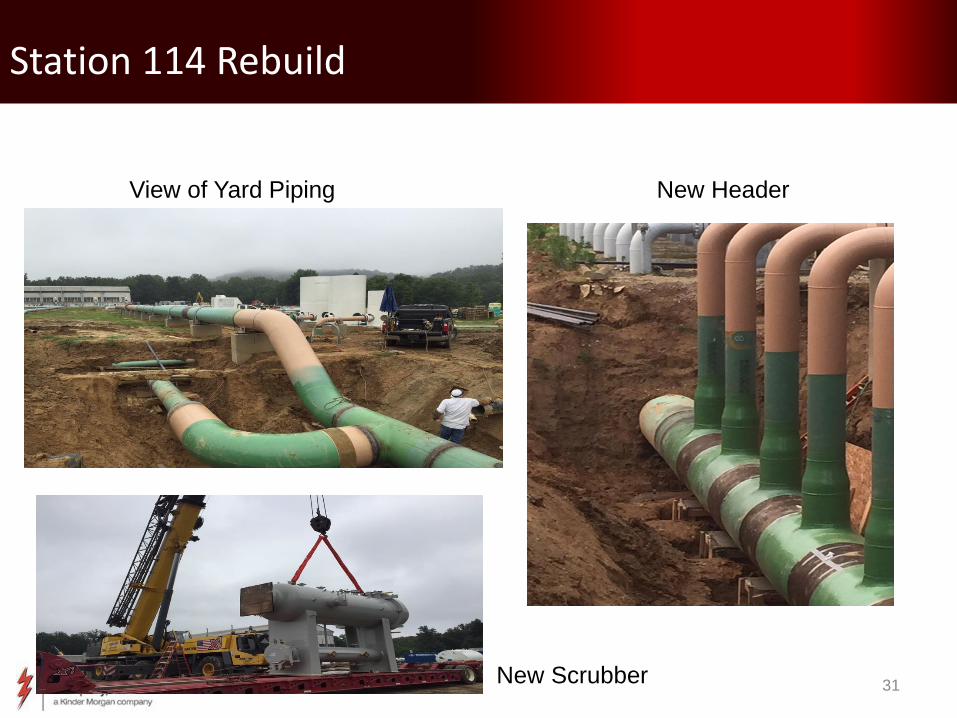
Station 114 Rebuild
View of Yard Piping New Header
New Scrubber
32
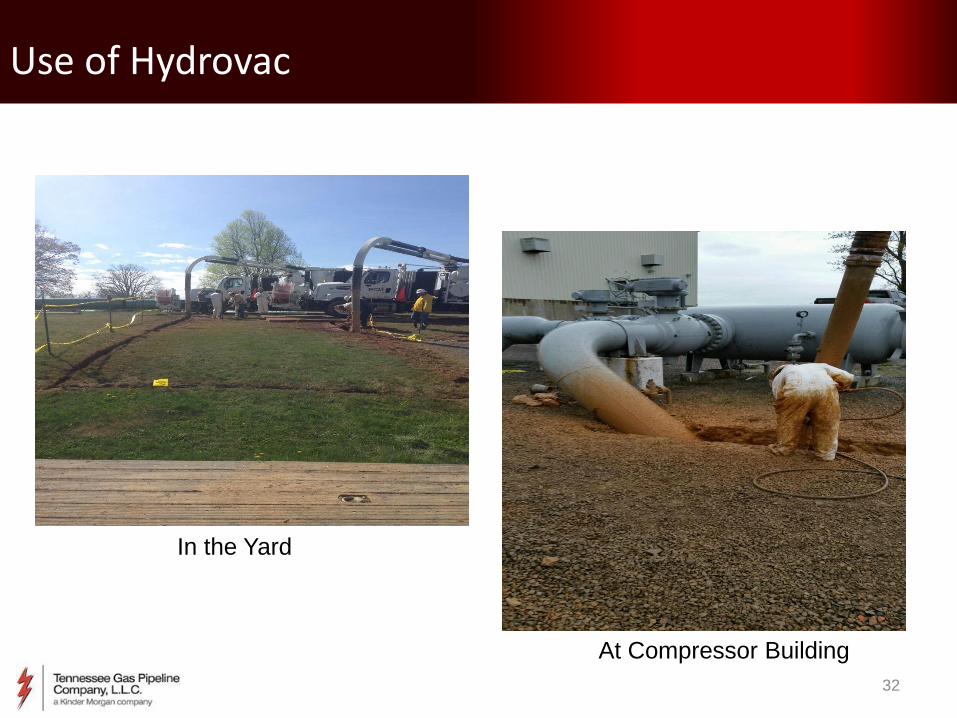
At Compressor Building
In the Yard
Use of Hydrovac

33
Hydrotest Work
Clearing and Grubbing
Pipe Replacement Test Heads

34
Pigging
Pig Launcher

35
Loading magflux tool into launcher
Removing tool from receiver
Pigging

36
Caliper Pig Received
Caliper Pig Pre-Launch
Difficult Operations at Times

37
Tennessee Gas Pipeline 24 Hour Contact List
Gas Control
24 hour and emergency
800-231-2800
Ganesh Venkateshan –
Mgr.
713-420-2099
Cell –205-746-5752
Layne Sanders –
Director
713-420-5024
Cell – 832-563-5024
Danny Ivy - VP
713-369-9311
Cell – 713-829-2761
Ray Miller – VP
713-369-9330
Cell – 713-206-8338
Transport and Storage
Services
24 hour Scheduling Hotline
713-369-9683
Cathy Soape – Manager
713-420-3814
Cell – 713-922-5083
Debbie Vasquez – Manager
713-420-3864
Cell – 713-806-7723
Sherri Glazebrook – Director
713-420-3677
Cell – 281-678-1183
Gene Nowak – VP
713-369-9329
Cell – 713-252-9759
Commercial/Marketing
Ernesto Ochoa – Director
713-420-1734
Cell – 281-414-3823
Sital Mody – VP
713-420-7336
Cell – 832-643-0042
Norman Holmes - VP
713-420-4442
Cell – 205-901-0456
Kim Watson – President
713-369-3229
Cell – 713-204-5423
Field Operations
Ron Bessette– Director
(Northeast)
860-763-6027
Cell – 985-209-4478
John Pannel – Director (Central)
615-221-1511
Cell – 615-714-1930
Cy Harper – Director (South)
281-689-4534
Cell – 205-613-6701
Tom Dender – VP
205-325-3883
Cell – 7205-572-1549
Gary Buchler – COO GAS
Pipelines
713-369-8463
Cell – 713-824-3904
Colorado Springs, CO Office
713-420-2600
Two North Nevada Ave
Colorado Springs, Co 80903
Birmingham, AL Office
713-420-2600
569 Brookwood Village St
Birmingham, AL 35209
Downers Grove, IL Office
630-725-3000
3250 Lacey Rd
Suite 700
Downers Grove, IL 60515
Houston, TX Office
713-369-9000
1001 Louisiana St
Houston TX 77002
August 2015

39
The Macro View
Trends continue
Dramatic supply growth
Growing long-term demand Changing trade balance New Infrastructure

40
Key Assumptions
+2.7
+6.9 +0.9 Bcfd
+18.6 Bcfd +4.7 Bcfd
-3.4 Bcfd
+5.7 Bcfd

41
Supply
42
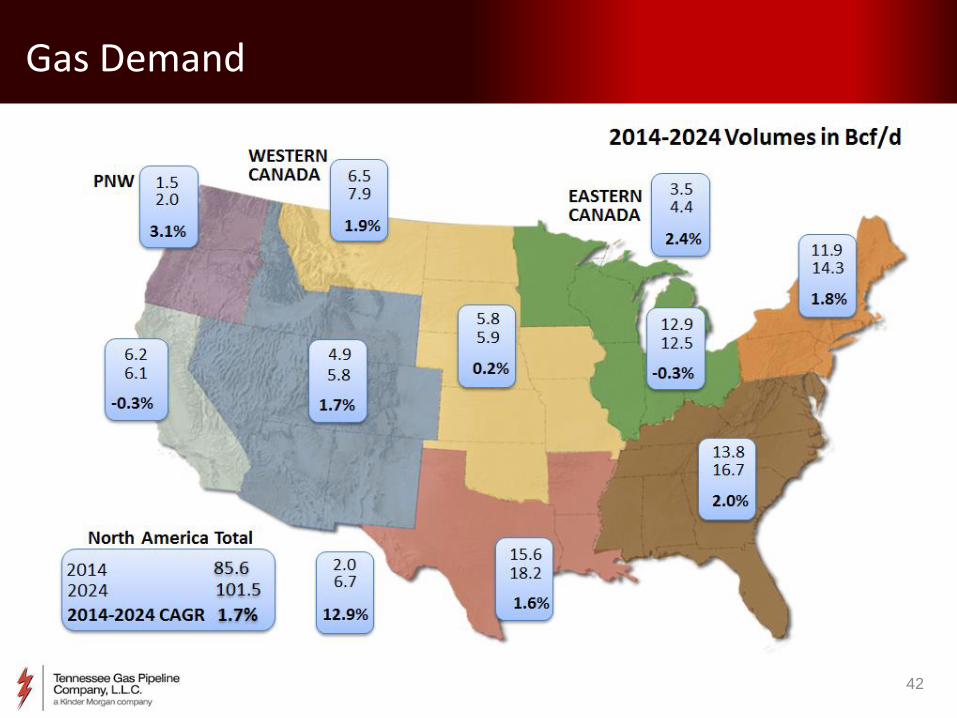
Gas Demand

43
Flows Change
Marcellus Shale
Utica Shale
Southeast
Northeast
EagleFord Shale
Haynesville Shale
44
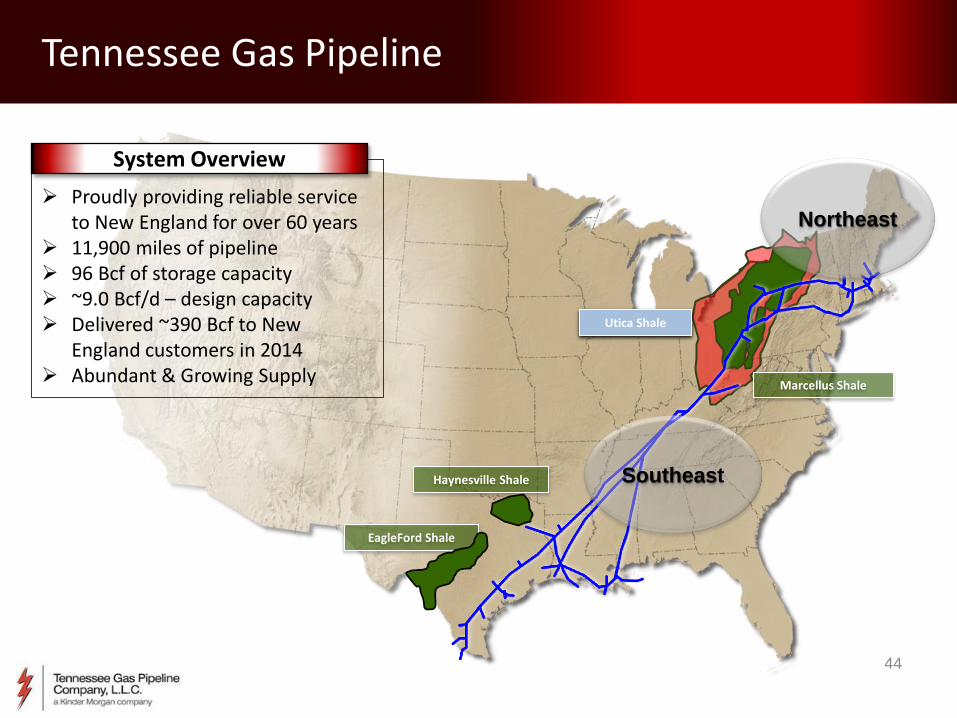
Tennessee Gas Pipeline
Proudly providing reliable service to New England for over 60 years
11,900 miles of pipeline 96 Bcf of storage capacity ~9.0 Bcf/d – design capacity Delivered ~390 Bcf to New
England customers in 2014 Abundant & Growing Supply
System Overview
45
0
5
10
15
20
25
30
35
40
45
200
7
200
8
200
9
201
0
201
1
201
2
201
3
201
4
201
5
201
6
201
7
201
8
201
9
202
0
202
1
202
2
202
3
202
4
202
5
202
6
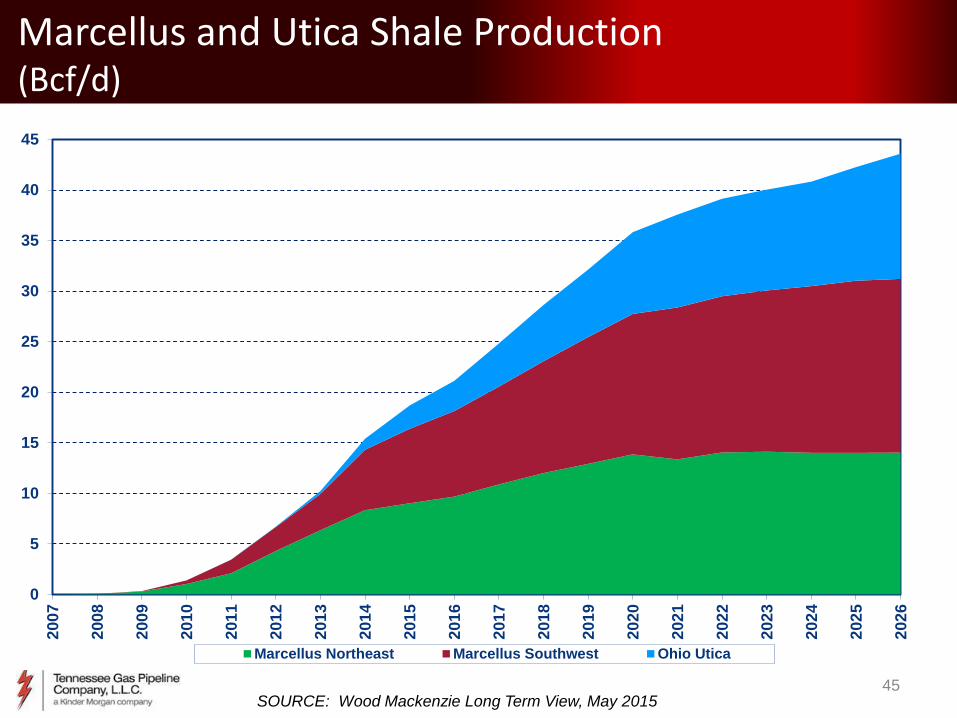
Marcellus Northeast Marcellus Southwest Ohio Utica
SOURCE: Wood Mackenzie Long Term View, May 2015
Marcellus and Utica Shale Production (Bcf/d)

46
Winter Period (Nov – Mar) Average Dth/d
Market Area Supply
0
500
1,000
1,500
2,000
2,500
3,000
3,500
4,000
4,500
5,000
09-10 10-11 11-12 12-13 13-14 14-15
Utica
Marcellus
Rex
Dracut
Distrigas
Wright
Shelton
Niagara
47
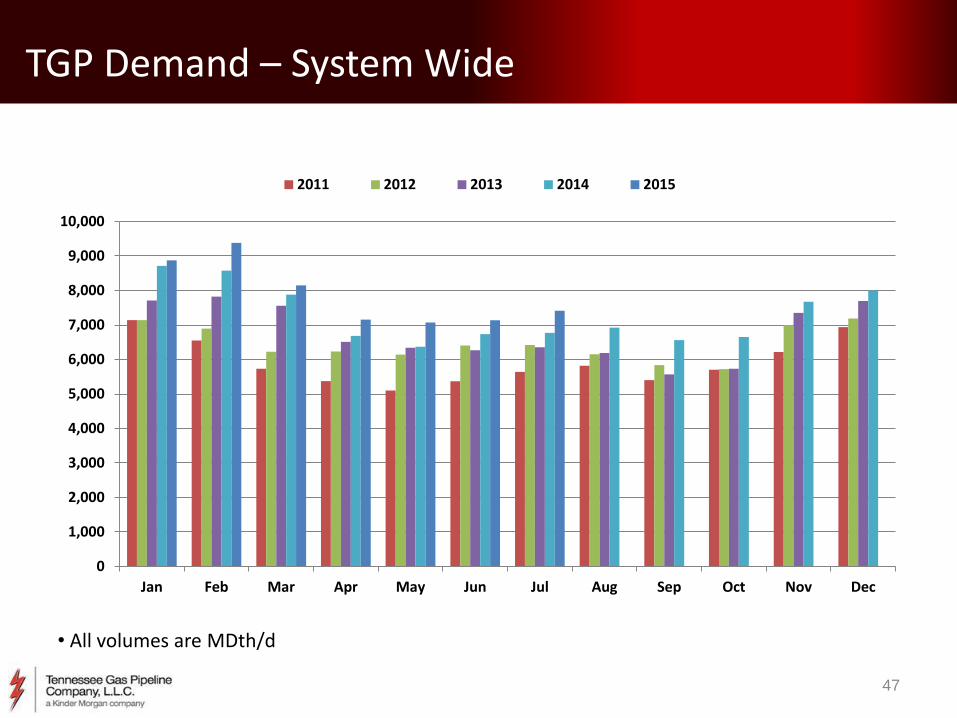
TGP Demand – System Wide
• All volumes are MDth/d
0
1,000
2,000
3,000
4,000
5,000
6,000
7,000
8,000
9,000
10,000
Jan Feb Mar Apr May Jun Jul Aug Sep Oct Nov Dec
2011 2012 2013 2014 2015

48
TGP Increasing Annual Throughput
*2015 through July
MD
th/d
-
1,000
2,000
3,000
4,000
5,000
6,000
7,000
8,000
9,000
2010 2011 2012 2013 2014 2015 YTD
Z6
Z5
Z4
Z3
Z2
Z1
ZL
Z0
49
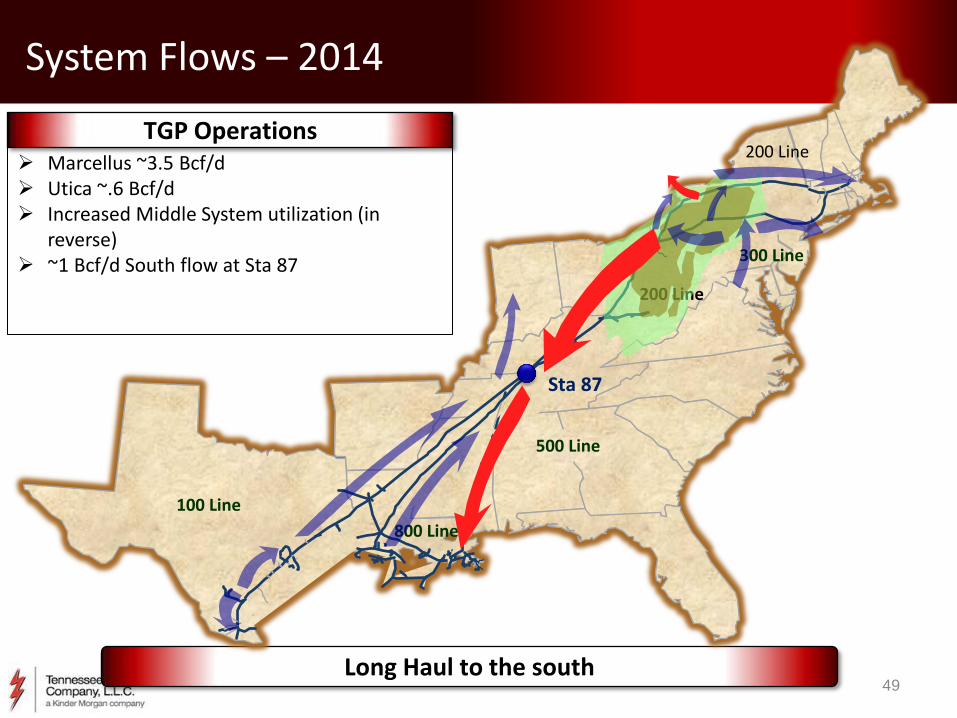
System Flows – 2014
Long Haul to the south
Marcellus ~3.5 Bcf/d Utica ~.6 Bcf/d Increased Middle System utilization (in
reverse) ~1 Bcf/d South flow at Sta 87
TGP Operations
800 Line
500 Line
200 Line
300 Line
100 Line
200 Line
Sta 87

50
System Flows – 2015
800 Line
500 Line
200 Line
300 Line
100 Line
200 Line
Long Haul to the south
Sta 87
Marcellus ~3.5 Bcf/d Bifurcated flows with long haul to the south Utica ~1 Bcf/d ~1.6 Bcf/d South flow at Sta 200 and ~1.5
Bcf/d at 87 Consistent exports to Mexico and Canada High system utilization- Maintenance
performed at mutually agreeable times
TGP Operations
51
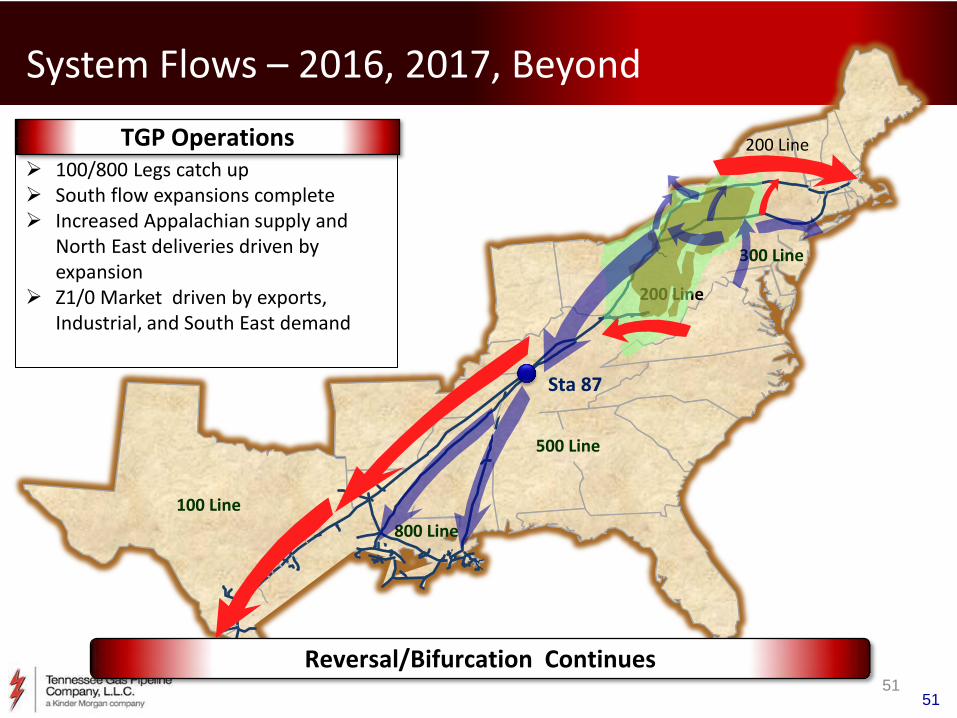
System Flows – 2016, 2017, Beyond
51
800 Line
500 Line
200 Line
300 Line
100 Line
200 Line
Reversal/Bifurcation Continues
Sta 87
100/800 Legs catch up South flow expansions complete Increased Appalachian supply and
North East deliveries driven by expansion
Z1/0 Market driven by exports, Industrial, and South East demand
TGP Operations
53
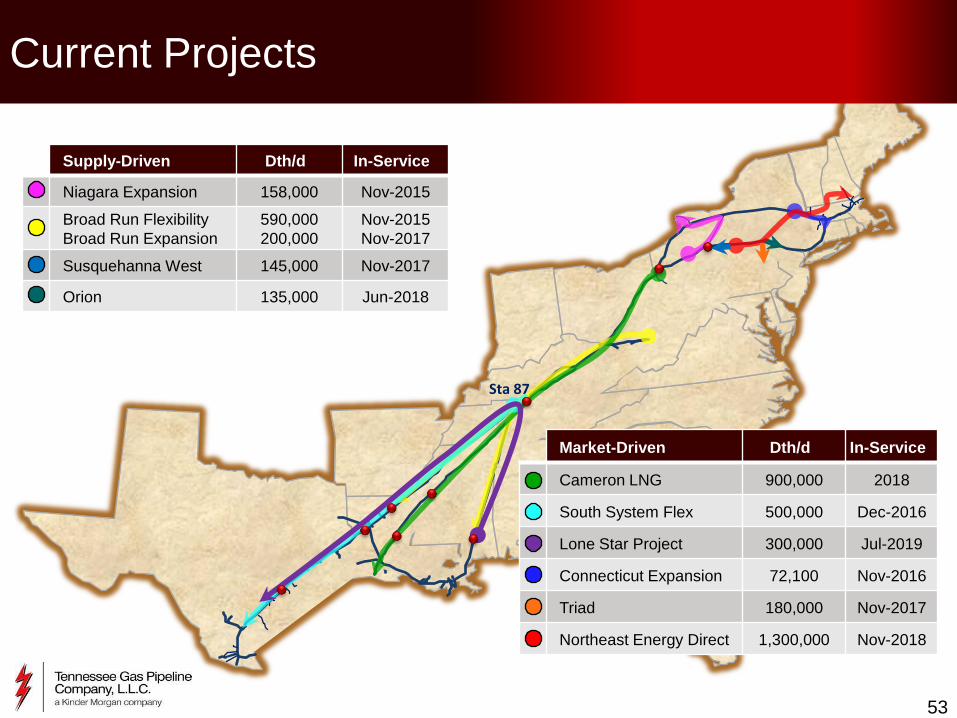
Sta 87
Supply-Driven Dth/d In-Service
Niagara Expansion 158,000 Nov-2015
Broad Run Flexibility
Broad Run Expansion
590,000
200,000
Nov-2015
Nov-2017
Susquehanna West 145,000 Nov-2017
Orion 135,000 Jun-2018
Market-Driven Dth/d In-Service
Cameron LNG 900,000 2018
South System Flex 500,000 Dec-2016
Lone Star Project 300,000 Jul-2019
Connecticut Expansion 72,100 Nov-2016
Triad 180,000 Nov-2017
Northeast Energy Direct 1,300,000 Nov-2018
Current Projects

54
Increase in new and redundant taps to minimize the impact of outages on customers without FT
Increased number of inquiries from power plants, LDCs, and related to pipeline expansions
Fewer producer inquiries for new facilities; increased number for upgrades to existing facilities
Projects in development — Marcellus Production: 6 Projects, 2.2 Bcf
• Top Receipts: Access Midstream (1,000 MMscf/d); Columbia Gas “Cobb” upgrade
(790 MMscf/d)
— Utica Production: 5 Projects, 658 MMscfd
• Top Receipts: M3 (290 MMscf/d)
— Deliveries: 10 Projects, 4.4 Bcf/d
• Top Deliveries: Columbia Gas “Milford” upgrade (349 MMcf/d), Iroquois Wright (950
MMcf/d), NET Mexico (500 MMcf/d), Cheniere Sinton (1,000 MMcf/d), Sempra (1,200
MMcf/d)
Interconnect Trends

55
Development Trends
Marcellus
Utica
LNG
Export
Canada
Southeast
New
England
Eagle Ford
Haynesville
Mexico
Supply-Push — Resolve remaining capacity
constraints
— Address new supply growth
— Connect supply to liquid trading points
Market-Pull — LNG export
— Pipeline export (Mexico, Canada)
— Power generation
— Shifting receipt points to match with supply
— Supply diversification
Reviewing “out of corridor” expansions
56
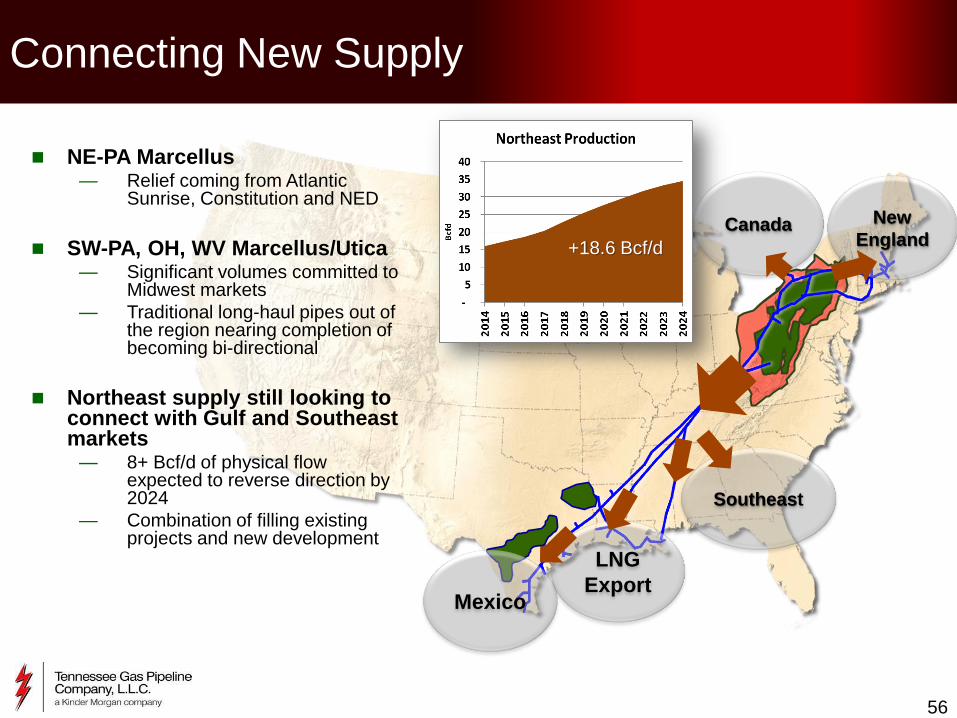
Connecting New Supply
LNG
Export
Southeast
NE-PA Marcellus — Relief coming from Atlantic
Sunrise, Constitution and NED
SW-PA, OH, WV Marcellus/Utica — Significant volumes committed to
Midwest markets
— Traditional long-haul pipes out of the region nearing completion of becoming bi-directional
Northeast supply still looking to connect with Gulf and Southeast markets
— 8+ Bcf/d of physical flow expected to reverse direction by 2024
— Combination of filling existing projects and new development
+18.6 Bcf/d
New
England Canada
Mexico

57
New England LDC & Power-Gen
Power Generation
— PJM
— NYISO
— Southeast
— ERCOT
LNG Export
— Gulf – MS
— Cameron – LA
— Golden Pass – TX
— Freeport – TX
— Brownsville – TX
Pipeline Export
— Mexico
— Canada
Connecting New Markets
Marcellus
Utica
Haynesville
Eagle Ford
+2.7
+6.9
+5.7 Bcf/d
+4.7 Bcf/d
Active Pursuits

58
BD Summary
Thank you for keeping us busy
New faces on the team
Focus on execution for our current project backlog — Ten major projects in development – 4.5 Bcf/d of new capacity
New project development transitioning from “producer-push” to “market-pull”
— Driven by lower commodity prices, LNG and Mexico export, and power generation growth
Northeast supply keeps coming (with no end in sight)
Significant projects carrying much of this supply out of the region – to Gulf/Export, Southeast, Midwest
— NED targets the New England market directly

59
59
Northeast Energy Direct
And Connecticut Expansion Update
Curtis Cole
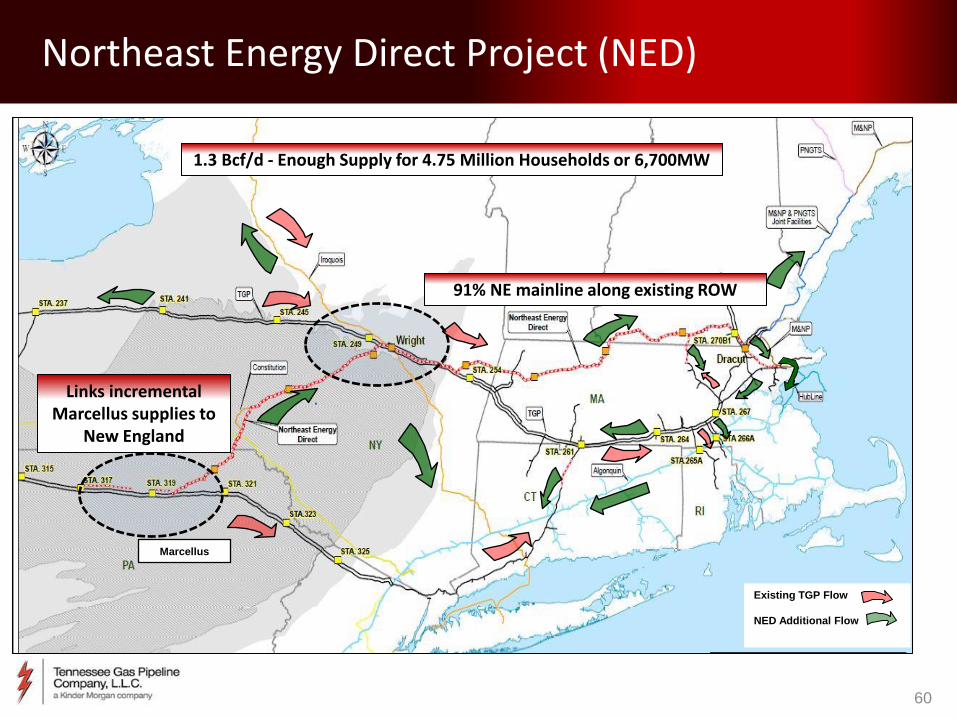
Northeast Energy Direct Project (NED)
60
Marcellus
Existing TGP Flow
NED Additional Flow
1.3 Bcf/d - Enough Supply for 4.75 Million Households or 6,700MW
91% NE mainline along existing ROW
Links incremental Marcellus supplies to
New England
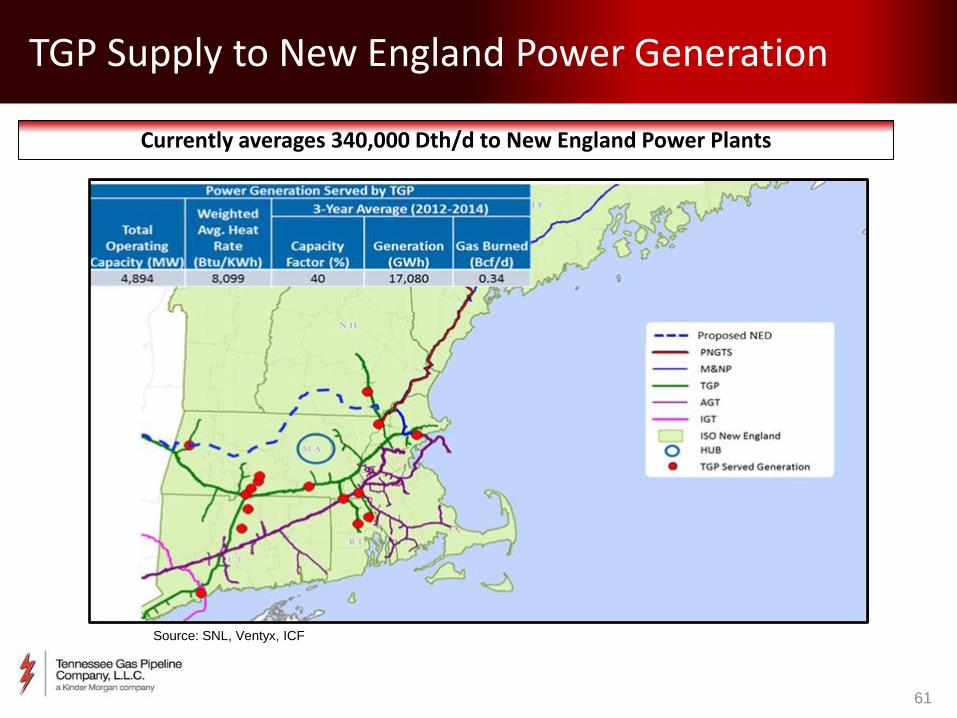
TGP Supply to New England Power Generation
61
Currently averages 340,000 Dth/d to New England Power Plants
Source: SNL, Ventyx, ICF

Northeast Energy Direct – The Right Solution for EDCs
62
TGP is an active participant in each of the New England State proceedings regarding the EDC solution for pipeline infrastructure
Provides EDC or generators with rate certainty and benefits
of scale
Services designed for power generation No-Notice Hourly flexibility Park & Loan options

NED Bridges Critical Gaps
63
Balanced approach to solving long-term energy needs includes: Large-scale renewables Enhanced Demand Reduction programs Expanding natural gas pipeline capacity to the region
Opportunity for EDC to lower energy costs and increase reliability to
gas and power grids Natural Gas-Fired Generation Supports Renewables
Integrated response: Not “either-or” Environmentally cleanest fossil fuel allows conversion Provides necessary and flexible backup source of generation to support
growth in wind and solar
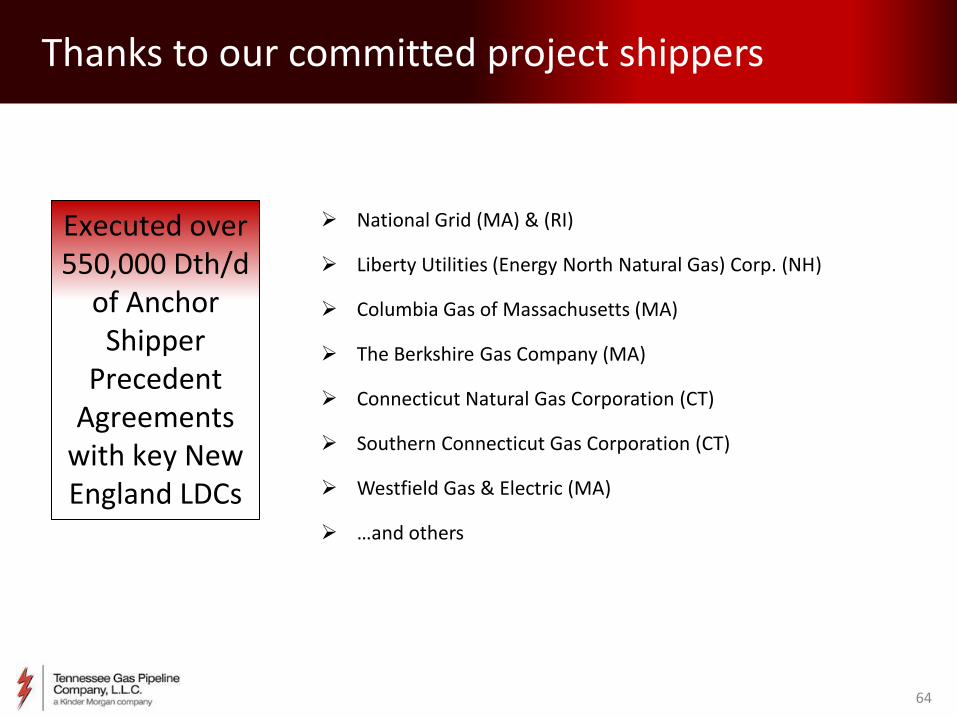
Thanks to our committed project shippers
64
National Grid (MA) & (RI)
Liberty Utilities (Energy North Natural Gas) Corp. (NH)
Columbia Gas of Massachusetts (MA)
The Berkshire Gas Company (MA)
Connecticut Natural Gas Corporation (CT)
Southern Connecticut Gas Corporation (CT)
Westfield Gas & Electric (MA)
…and others
Executed over 550,000 Dth/d
of Anchor Shipper
Precedent Agreements
with key New England LDCs

NED Timeline
65
Milestone Date
Conduct open houses (complete) January - April 2015
FERC holds scoping meetings July- August 2015
File ER Draft #1 (Resource Reports 1 through 12) (complete) March 13, 2015
File ER Draft #2 (Resource Reports 1 through 12) July 2015
File certificate application with FERC (includes final ER) October 2015
FERC reviews application, conducts public comment meetings, addresses comments, prepares and issues draft and final EIS
October 2015- October 2016
Requested date for FERC certificate order October 2016
Accept certificate order November 2016
Commission issues permission to fell trees and start HDD’s January 2017
Start remaining construction April 2017
Anticipated in-service date for NED project (mainline and certain laterals) November 1, 2018
Milestone Date
NED Benefits
66
Critical component to any regional solution to address gas & electric reliability
Transformative solution that will lower gas and electricity prices for all New England consumers
Direct access to incremental supply from the most prolific shale play in the US
Vital enabler of renewables growth efforts
Provides incremental supply to all New England pipelines
Directly replaces declining Canadian imports

6
7
Capital: $85.7MM
Commercial Benefit: Additional capacity to serve New England market
Capacity: 72,100 Dth/d
Customers: Yankee, Southern Connecticut, Connecticut Natural
Estimated In-service: November 2016
Project Scope: 13.46 miles of pipeline loop Acquisition of Thompsonville
Lateral
Project Status: Contracts executed Lateral acquired FERC certificate filed July 2014
Docket CP14-529-000 MEPA certificate received
Connecticut Expansion Project