Embed Size (px)
Citation preview

Tendring District Council
Jaywick Strategic Flood Risk Study
May 2008
FINAL REPORT
JBA Consulting Crowmarsh Battle Barns 100 Preston Crowmarsh WALLINGFORD Oxon OX10 6SL UK t: +44 (0)1491 836688 f: +44 (0)8700 519307 [email protected]
Tendring District Council
Council Offices Weeley
Clacton-on-Sea Essex
CO16 9AJ

Tendring District Council Jaywick Strategic Flood Risk Study Stage 1 and 2
REVISION HISTORY
Revision Ref./ Date Issued
Amendments Issued to
Final draft after comment from EA and TDC v2.1 20 May 2008
Graham Robertson, Gill Burden
Final Draft Stage 1&2 Report V1_5 January 2007
Karl Randall, TDC
CONTRACT
This report describes work commissioned from JBA by Tendring District Council. Tendring District Council’s representative for the contract was Karl Randall. Tony Green, Balaji Angamuthu and Liu Yang of JBA Consulting carried out the work. Prepared by: ................................................... Balaji Angamuthu, BEng MTech Msc Engineer Reviewed by: ................................................... Tony Green , BSc(Eng), PhD, C Eng MICE, MCIWEM Technical Director Approved by: ....................................…............ David Pettifer, C Eng FICE, FCIWEM Director PURPOSE
This document has been prepared as a Strategic Flood Risk Study for Tendring District Council. JBA Consulting accepts no responsibility or liability for any use that is made of this document other than by the Client for the purposes for which` it was originally commissioned and prepared. ACKNOWLEDGMENTS
JBA would like to thank all those who provided information and data for this project. Tendring District Council: Karl Randall and Environment Agency: Jeremy Bloomfield, Graham Robertson and Richard Houghton.
JBA Consulting www.jbaconsulting.co.uk N:\2007\Projects\2007s2589 - Tendring District Council - Jaywick Strategic Flood Study\Reports\Stage 2 Draft\2007s2589 JaywickSFRS_v2_1.doc i
Tendring District Council Jaywick Strategic Flood Risk Study Stage 1 and 2
EXECUTIVE SUMMARY
Introduction
In August 2007 JBA Consulting was commissioned by Tendring District Council to undertake a Strategic Flood Risk Study for Jaywick. The study has been prepared in accordance with a brief produced by TDC and current best practice, Planning Policy Statement 25 Development and Flood Risk (PPS25)1 introduced in December 2006. PPS25 reinforced the responsibility of Local Planning Authorities to ensure that flood risk is managed effectively and sustainably as an integral part of the planning process, balancing socio-economic needs, existing framework of landscape and infrastructure, and flood risk.
Jaywick is a low lying coastal town, but is well defended against flooding from the sea by defences consisting of a sea wall or bank, a sandy beach, offshore reefs and breakwaters to a standard of around 0.5% annual probability (1 in 200 years) for present conditions. There is, however, a long history of flood events due to bank failure and overtopping. Should there be a failure of a major flood defence during a storm surge much of the area is at risk as defined by the Environment Agency’s Flood Zone maps which represent the extent of flooding expected if defences were not in place. Using the sea level rise predictions given in PPS25 for the next 100 years then the standard of protection falls over time and, unless sea walls are raised, breaches and overtopping will become more likely resulting in a significantly increased hazard over much of the Jaywick area.
The flood event of 1953 illustrates the high hazard of a defence breach at Jaywick. Following this catastrophic event when much damage was done at Jaywick and lives were lost, coastal defences were improved and strengthened. Apart from work on the sea walls an additional earth bank (counterwall) running north from the Martello Tower to high ground was constructed to provide a secondary defence against a breach in the banks towards St Osyth. A re-occurrence of the 1953 breaching is therefore much less likely for the same sea conditions. The Environment Agency have also more recently invested significantly in improvements to the beach management through construction of offshore rock groynes and beach recharge to lower the risk of overtopping or a breach in the sea wall at Jaywick. The more likely flood event is thus the risk of fluvial flooding and maintenance of the outfall of the Jaywick ditch is given a high priority by the Environment Agency.
Application of PPS25 to planning development at Jaywick
A key aspect of PPS25 is the application of the Sequential Test which is intended to direct development towards areas of lower flood risk. Within the area of Tendring District Council there are other areas available for development at lower risk than Jaywick and thus the sequential test would indicate that new development should not be sited at Jaywick. However, it is recognised within PPS25 that where there is an existing community already protected by flood defences then the Exception test may be applicable.
The flood hazard mapping produced by this study will help Tendring District Council to adopt a sequential approach to future re-development plans through the identification of land areas with the highest and lowest risks arising from potential flooding.
The Exception Test is “only appropriate for use when there are large areas in Flood Zones 2 and 3 where the Sequential Test alone cannot deliver acceptable sites, but where some continuing
1 Communities and Local Government. 2006 Planning Policy Statement 25: Development and Flood Risk. December 2006.
http://www.communities.gov.uk/pub/955/PlanningPolicyStatement25DevelopmentandFloodRisk_id1504955.pdf
JBA Consulting www.jbaconsulting.co.uk N:\2007\Projects\2007s2589 - Tendring District Council - Jaywick Strategic Flood Study\Reports\Stage 2 Draft\2007s2589 JaywickSFRS_v2_1.doc ii

Tendring District Council Jaywick Strategic Flood Risk Study Stage 1 and 2
development is necessary for wider sustainable development reasons, taking into account the need to avoid social or economic blight and the need for essential infrastructure to remain operational during floods.”
For the Exception Test to be passed:
a. It must be demonstrated that the development provides wider sustainability benefitsto the local community that outweigh flood risk, informed by an SFRA, where one has been prepared. If the Development Plan Document (DPD) has reached the ‘submission’ stage – see Figure 4 of PPS12: Local Development Frameworks – thebenefits of the development should contribute to the Core Strategy’s Sustainability appraisal.
t t
,
b. The development should be on developable previously developed land or, if it is noton previously developed land, tha there are no reasonable alterna ive sites on developable previously developed land; and
c. A Flood Risk Assessment must demonstrate that the development will be safe, without increasing flood risk elsewhere, and, where possible, will reduce flood risk overall.
It can be seen that the Exception Test is necessary for planning redevelopment within Jaywick and that the SFRS needs to provide the background information necessary for its application.
Commercial land use could be considered as appropriate in some locations as adequate access and egress could be maintained for a limited design lifetime and the existing sea defences provide the required standard of protection (including the forecast impacts of climate change over this form of development’s design lifetime).
Development of the Strategic Flood Risk Study
The strategic flood risk study has been carried out on two stages:
1. Stage 1 concentrated on quantifying existing flood risks in Jaywick for a range of possible locations as specified in the brief;
2. Stage 2 detailed the flood risk assessment at preferred options for redevelopment for both present day and in the future taking account of climate change and sea level rise. In examining possible mitigation measures the effects on flood risk elsewhere was assessed and recommendations made to make potential redevelopment sites safe from flooding.
Both fluvial and tidal risks have been simulated through use of detailed computer modelling. Outputs of the modelling include flood hazard which gives an indication of the danger to life of the flood water due to high velocities or depths. The variation of flood hazard between different sites allows a sequential approach to redevelopment to be followed by identifying the locations of higher or lower risk. Maps and animations have been prepared to illustrate this variation. Simulation of mitigation measures such as raising of walls or land levels has been completed and consideration given to access and egress during or following a breach.
Findings of the Strategic Flood Risk Study
Existing Situation
Simulations of the effect of breaches in the sea defences at Jaywick show potentially high levels of hazard at existing property and the potential development sites indicated in the study brief. Should a breach occur in the area on the western side of the counterwall then the counterwall does provide protection to the main residential areas of Jaywick on its east side and only limited overtopping of this wall is simulated in a 0.5% event. If the breach occurs on the other side of the counterwall, however the effect is containment of the flood within Jaywick and thus flood depths are raised. Typical results for flood hazard following a breach in the sea defence are given in Map 7 and Map 19.
JBA Consulting www.jbaconsulting.co.uk N:\2007\Projects\2007s2589 - Tendring District Council - Jaywick Strategic Flood Study\Reports\Stage 2 Draft\2007s2589 JaywickSFRS_v2_1.doc iii
Tendring District Council Jaywick Strategic Flood Risk Study Stage 1 and 2
There is a risk of fluvial flooding from the Jaywick ditch on the fields to the north of Brooklands/ Grassland areas.
Effect of Climate Change
The effect of climate change is expected to be increased frequency of storms and an accelerating rise in sea level. Sea levels predictions used in the SFRA are as advised in PPS25. In common with many coastal areas, the standard of protection provided by existing sea defences declines as sea level rises and more frequent overtopping can be expected if no changes are made. Once sea levels exceed the defence height during a surge event then overtopping flows increase rapidly and the risk of breaching increases significantly. This situation could arise in a 1 in 200 year probability surge some 50 to 75 years into the future and if nothing were done by 2107 then the overtopping alone would result in high flood hazard throughout the entire coastal area of Jaywick and the most westerly part of Clacton.
The effect of increased rainfall and longer periods of tide locking on fluvial flooding is much less severe and the main area of risk is outside currently developed areas.
Emergency Planning
Tidal surges are forecast well in advance of the tidal peak by the Meteorological Office’s Storm Tide Forecasting Service and the Environment Agency’s flood forecasting and warning system is operated for the area. Local decisions to sound warning sirens may also be taken by the County Emergency Planning team in consultation with Essex Police.
The people most vulnerable to flooding could thus be evacuated prior to the time of highest risk subject to this being determined by a local emergency plan as an appropriate action by the response agencies at such a time. The main access roads into Jaywick pass over lower ground near Jaywick ditch and in the event of a tidal breach this area can be rapidly flooded cutting off access to the coastal properties. The only access routes are then either the beach paths from Clacton, along the counterwall or via the roads to Seawick if these are not flooded and still accessible (ie not blocked by a breach). The main roads into Jaywick could remain flooded and impassable for over 24 hours.
Flood Management and Mitigation Measures
The current policy of coastal management set by the Shoreline Management Plan is to ‘hold the line’. The longer term policy will be subject to detailed review in the next SMP starting in 2008. Not withstanding the future decisions regarding management of the sea defences there will always be some residual risk to the property at Jaywick that must be taken into account in planning. Therefore based on the stage 1 results of the SFRS and subsequent project meetings, sites in Brooklands and Grasslands in Jaywick were selected for further study including definition and initial costing of mitigation measures.
The flood management measures considered fall into three categories:
1. Reduction of the risk of breaching affecting Jaywick – improvement of beach and sea defences and raising of the counterwall
2. Reduction in the consequence: Raising of land when redeveloping sites, resiting existing property and building more flood resistant housing
3. Improvement of emergency access
The Environment Agency have a project already planned to improve the beach in front of Brooklands and reduce the risk of breaching involving a further offshore groyne and beach replenishment. The estimated life cost of this scheme is £9m. Note that such works cannot eliminate the risk of a breach occurring anywhere and in particular at the location identified as vulnerable for the SFRS study breach simulations, close to the Jaywick ditch outfall structure. This was identified in this SFRS as the location of a breach which potentially would have the highest impact. The counterwall is also an important component in the defences. Raising this above its original construction level to continue to be effective is already desirable and within 50 years it will need to be raised. The estimated cost of raising the counterwall to a level of 4.5m
JBA Consulting www.jbaconsulting.co.uk N:\2007\Projects\2007s2589 - Tendring District Council - Jaywick Strategic Flood Study\Reports\Stage 2 Draft\2007s2589 JaywickSFRS_v2_1.doc iv

Tendring District Council Jaywick Strategic Flood Risk Study Stage 1 and 2
AOD from its existing level would be around £0.5 million. Assuming that the existing sluice is opened, additional sluices through the counterwall have a very limited effect on lowering flood levels should a breach occur on the Jaywick side of the counterwall.
The predicted level of flood water in the case of a breach occurring for a 0.5% event with current day sea levels would be 2.9m AOD but allowing for climate change to 2107 this rises to 4.0m AOD. The land level in Grasslands is around 1.6m AOD and Brooklands is on average around 1m higher. If land were to be raised, a large part of the cost will be in new infrastructure and thus it would desirable to ensure dry access allowing for predicted climate change impacts. Raising ground to a level of 4.1m AOD would also take the raised land above the Flood Zone 3 level.
The cost of raising the land from its existing level in potential redevelopment areas would vary but for the housing densities envisaged (assuming 30 properties/ha in Brooklands and 40 properties/ha in Grasslands) it is estimated that this would vary from £3.2m or around £9000/property in Brooklands to £16,000 per unit in lower lying parts. If sites are to be totally redeveloped with a new density and layout then the additional cost of road, water, drainage and other services will be incurred in any case and are not included in the above estimates, otherwise these costs would add significantly more to the cost of land raising. Whilst a comprehensive program of land raising in an undeveloped area or where total redevelopment is proposed is an option that could be taken further if economically feasible, the problems of progressively achieving the same effect in an existing community are much greater with large negative impacts at the limit of the raised land. The effect of raising land in one area on flood levels elsewhere was also studied and a small rise in water level elsewhere was predicted. Mitigation such as flood compensation at the limit of the flood zone or extra flapped openings through the counterwall will thus be needed to offset the land raising and demonstrate no adverse effects on others.
The PPS25 Exception Test requires that a development should be ‘safe’, without increasing flood risk elsewhere and, where possible, will decrease flood risk overall. The PPS25 Practice Guide gives further advice that safe access and egress should be provided for the design life of a development in all bar exceptional cases. Improvements to the current access would be needed to satisfy this requirement though this would not necessarily require a major new road. The options for improvement to access routes considered are shown in Map 5 but further study was subsequently carried out and more detail is given in a separate report.
Planning Implications
The introduction of PPS25 in December 2006 has significant implications for the regeneration of Jaywick and the options considered in the previous masterplanning. The Test indicates that (a) development must give wider sustainability benefits to the local community that outweigh flood risk, (b) development should be on previously developed land and (c) the development should be safe.
The SFRS has shown where flood hazards would be highest and this allows a sequential approach to minimising flood risk in planning. Condition (c) of the Exception test could be met by ensuring that housing is not sited where flood hazard could be high (now or in the future) and that safe access is possible both locally to properties and to Jaywick as a whole. It is unlikely that development could take place in low lying areas such as Grasslands without land raising but the available higher areas of Brooklands could be considered if improvements were made to access following a flood.
Safe access and egress means that people are able to evacuate the area, and that emergency services vehicles are able to enter the area if the emergency services deem that necessary. Preferably the route should remain flood free, but inundation below certain defined depths and velocities may be acceptable. Consideration should be given to the potentially higher than average proportion of people in Jaywick with restricted mobility who may need to be evacuated. Further consultation with emergency planners and emergency services, is needed to better define the requirement. Dry access is an aspiration but not a requirement of PPS25 although new development must be safe from flood risk for its lifetime.
JBA Consulting www.jbaconsulting.co.uk N:\2007\Projects\2007s2589 - Tendring District Council - Jaywick Strategic Flood Study\Reports\Stage 2 Draft\2007s2589 JaywickSFRS_v2_1.doc v

Tendring District Council Jaywick Strategic Flood Risk Study Stage 1 and 2
The level of the current (and planned) sea defences prevent clear water overtopping for the next 50-75 years after which raising of defence levels would be needed to combat sea level rise due to climate change. The Exception Test of PPS25 requires that climate change is taken into account in the consideration that a development is ‘safe’. There is no guarantee that improvements will be provided though and thus the planning horizon for new development is likely to be limited to 50-75 years.
Summary and Conclusions
The strategic flood risk study has shown that the whole coastal part of Jaywick is within the high flood risk zone (FZ3) though is currently defended to a high standard. Behind the sea walls there remains a residual flood risk of high hazard to lower lying areas of Jaywick that will increase markedly over time due to sea level rise (current defences could be overtopped at the design storm 50-75 years in future). Under PPS25 the area should therefore not be selected for new development unless the Exception test can be passed. Under the Exception test of PPS25 any redevelopment needs to be shown to be safe for the life of the development. The higher ground such as in parts of Brooklands should be favoured for siting of more vulnerable development such as health facilities and housing. New development should not increase the overall flood risk. Raising land is a possibility but has significant cost implications and practical difficulties close to existing developments. Improvements to planning for emergency access and egress following a breach will be needed.
JBA Consulting www.jbaconsulting.co.uk N:\2007\Projects\2007s2589 - Tendring District Council - Jaywick Strategic Flood Study\Reports\Stage 2 Draft\2007s2589 JaywickSFRS_v2_1.doc vi

Tendring District Council Jaywick Strategic Flood Risk Study Stage 1 and 2
This page is intentionally left blank.
JBA Consulting www.jbaconsulting.co.uk N:\2007\Projects\2007s2589 - Tendring District Council - Jaywick Strategic Flood Study\Reports\Stage 2 Draft\2007s2589 JaywickSFRS_v2_1.doc vii

Tendring District Council Jaywick Strategic Flood Risk Study Stage 1 and 2
CONTENTS
PageREVISION HISTORY i CONTRACT i PURPOSE i ACKNOWLEDGEMENTS i EXECUTIVE SUMMARY ii CONTENTS v
1 INTRODUCTION ---------------------------------------------------------------------------------- 1 1.1 Introduction....................................................................................................................................1 1.2 Objectives ......................................................................................................................................1 1.3 Study area......................................................................................................................................1 1.4 Background to the study ...............................................................................................................1
2 THE PLANNING FRAMEWORK------------------------------------------------------------------ 3 2.1 Introduction....................................................................................................................................3 2.2 National planning policy.................................................................................................................3 2.3 Local planning policy .....................................................................................................................8 2.4 Environment Agency policy ...........................................................................................................8 2.5 Additional documents of relevance ...............................................................................................9
3 DATA SOURCES --------------------------------------------------------------------------------- 10 3.1 Flood zone maps and properties at risk of flooding....................................................................10 3.2 Flood defences and structures ....................................................................................................10 3.3 Topographical data ......................................................................................................................12 3.4 Other evidence of flood risk.........................................................................................................12 3.5 History of flooding........................................................................................................................13 3.6 Previous flood risk studies covering Jaywick..............................................................................13
4 METHODOLOGY FOR ANALYSIS OF FLOOD RISK ------------------------------------------ 15 4.1 Introduction..................................................................................................................................15 4.2 Main Sources of Flood Risk.........................................................................................................15 4.3 Other sources of flood risk...........................................................................................................16 4.4 Flood defences and structures ....................................................................................................16 4.5 Analysis of Tidal residual risk.......................................................................................................17 4.6 Calculation of Flood hazard .........................................................................................................22 4.7 Fluvial flooding .............................................................................................................................23
5 FLOOD RISKS AT POTENTIAL SITES---------------------------------------------------------- 26 5.1 Introduction..................................................................................................................................26 5.2 Model results at specified locations current day conditions .......................................................26 5.3 Changes in tidal flood hazard in the future assuming breaching ................................................28 5.4 Changes in tidal flood hazard in the future assuming overtopping only .....................................30 5.5 Fluvial Flooding ............................................................................................................................30 5.6 Screening of sites 1 to 8 ..............................................................................................................32
6 MITIGATION MEASURES AND POSSIBLE FLOOD RISKS ----------------------------------- 33 6.1 Introduction..................................................................................................................................33 6.2 Potential Mitigation Measures .....................................................................................................33 6.3 Options for selected for testing ...................................................................................................34 6.4 Representation of mitigation measures in model ........................................................................35 6.5 Model results................................................................................................................................35 6.6 Costs of mitigation measures ......................................................................................................37 6.7 Flood warning systems ................................................................................................................38 6.8 Emergency planning ....................................................................................................................39 6.9 Safe access routes and egress....................................................................................................39
JBA Consulting www.jbaconsulting.co.uk N:\2007\Projects\2007s2589 - Tendring District Council - Jaywick Strategic Flood Study\Reports\Stage 2 Draft\2007s2589 JaywickSFRS_v2_1.doc viii

Tendring District Council Jaywick Strategic Flood Risk Study Stage 1 and 2
7 CONCLUSIONS ---------------------------------------------------------------------------------- 42 7.1 Flood Risks ..................................................................................................................................42 7.2 Planning Implications...................................................................................................................42
APPENDICES:
APPENDIX A: - HAZARDS AT SPECIFIED SITES
APPENDIX B: - CONTENTS OF ANIMATION CD
APPENDIX C: - THE PROJECT BRIEF
APPENDIX D: - BEACH PROFILES LIST OF FIGURES
Figure 2-1 The Sequential Test: its practical application...................................................................................4 Figure 3-1 Jaywick Sea defences ....................................................................................................................11 Figure 3-2 Cross section of beach profile near West Clacton at OS 616414, 213528....................................12 Figure 4-1 Illustration of residual risk behind coastal defences.......................................................................15 Figure 4-2 200 year tidal time series ................................................................................................................18 Figure 4-3 1000 year tidal time series ..............................................................................................................19 Figure 4-4 200 year plus 50 year climate change tidal time series..................................................................19 Figure 4-5 200 year plus 100 year climate change tidal time series................................................................19 Figure 4-6 Comparison of seawall and tidal levels ..........................................................................................20 Figure 4-7 Typical Cross section of Jaywick Ditch extracted from LiDAR data..............................................24 Figure 4-8 100 year inflow hydrograph of Jaywick Ditch.................................................................................24 Figure 4-9 Tidal time series derived for downstream boundary condition ......................................................25 Figure 5-1 Velocity vectors for maximum water level for current 200 year tidal event at Breach 1 –
Brooklands and Grasslands areas ...................................................................................................................27 Figure 5-2 Velocity vector for maximum water level for current 200 year tidal event at Breach 1 – Existing
Tudor Estate and Tudor Fields .........................................................................................................................27 Figure 5-3 Current and future scenario fluvial flooding extent........................................................................31 Figure 6-1 Emergency Access Route F current constrictions preventing use as vehicle access..................40 Figure 6-2 Route F access details...................................................................................................................41 LIST OF MAPS
Map 1: Study area
Map 2: Flood zones
JBA Consulting www.jbaconsulting.co.uk N:\2007\Projects\2007s2589 - Tendring District Council - Jaywick Strategic Flood Study\Reports\Stage 2 Draft\2007s2589 JaywickSFRS_v2_1.doc ix

Tendring District Council Jaywick Strategic Flood Risk Study Stage 1 and 2
Map 3: Historical floods
Map 4: Defences
Map 5: Access routes
Map 6: Coastal defences
Map 7 to 24: 200 and 1000 year Maximum water depths and flood hazards for breaches 1,2, and 3
Map 25: Mitigation Measures LIST OF TABLES
Table 2.1Flood Risk Vulnerability Classification.................................................................................................7 Table 2.2: Flood risk vulnerability and Flood Zone compatibility.......................................................................6 Table 2.3: Example Table ..................................................................................................................................6 Table 3.1 Sea Wall Crest Levels (from EA Asset Database) ............................................................................11 Table 3.2 History of flooding ............................................................................................................................13 Table 4.1 Present day extreme sea level near Jaywick ...................................................................................17 Table 4.2 Future climate 0.5% annual probability extreme sea level near Jaywick ........................................18 Table 4.2 Possible combinations of sea surge level and wave height that give a 1:100 year return period...21 Table 4.4 Categories of Flood hazard ..............................................................................................................23 Table 5.1 Water depths, velocities and hazards for 200 year tidal event ........................................................26 Table 5.2 Water depths, velocities and hazards 1000 year tidal event ...........................................................26 Table 5.3 200 year maximum water level for a breach in sea wall ..................................................................28 Table 5.4 1000 year maximum water level for a breach in sea wall ................................................................28 Table 5.5 Tidal event water depths, velocities and hazards for a breach in sea wall 200 year plus climate
change to 2107.................................................................................................................................................29 Table 5.6 Water depths, velocities and hazards for a breach in sea wall 200 year tidal event with sea level
rise to 2057......................................................................................................................................................29 Table 5.8 Maximum water level for a breach in sea wall occurring during a 200 year surge event in the future
considering sea level rise .................................................................................................................................29 Table 6.1 Mitigation measures tested in the breach model .............................................................................35 Table 6.2 Water depths at redevelopment sites for a breach in sea wall near Brooklands (Breach 1) 200 year
tidal event current day......................................................................................................................................36 Table 6.3 200 year tidal event velocities at redevelopment sites for breach in sea wall near Brooklands
(Breach 1)..........................................................................................................................................................36 Table 6.4 200 year tidal event flood hazard at redevelopment sites for breach in sea wall near Brooklands
(Breach 1)..........................................................................................................................................................36 Table 6.5 200 year event maximum water level for breach near Brooklands (Breach 1) ...............................37 Table 6.6 Estimation of quantity and cost for raising the Counterwall to 4.5mAOD ......................................37 Table 6.7 Estimation of quantity and indicative cost for raising land (to 4.2mAOD) in Jaywick......................38 Table 6.8 Flood warning levels.........................................................................................................................39
JBA Consulting www.jbaconsulting.co.uk N:\2007\Projects\2007s2589 - Tendring District Council - Jaywick Strategic Flood Study\Reports\Stage 2 Draft\2007s2589 JaywickSFRS_v2_1.doc x

Tendring District Council Jaywick Strategic Flood Risk Study Stage 1 and 2
ABBREVIATIONS
Actual Risk The risk posed to development situated within a defended area (i.e. behind defences), expressed in terms of the probability that the defence will be overtopped, and/or the probability that the defence will suffer a structural failure, and the consequence should a failure occur
Area Action Plan AAP Planning document to guide development in a specific area. Forms part of the Local Development Framework.
Area Benefiting from Defence
ABD Those areas which benefit from formal flood defences in the event of flooding from rivers with a 1% chance in any given year or from the sea with a 0.5% chance in any given year. If the defences were not there, these areas would be flooded.
Annual Exceedance Probability
AEP Annual Exceedance probability. The chance of a flood event exceeding a particular severity in any year. A 0.5% AEP is equivalent to a 1:200 year event.
Brownfield Brownfield (sites or land) is a term in common usage that may be defined as ‘development sites or land that has previously been developed’. Prior to PPS25 the term ‘Brownfield’ was used in Governmental Guidance and Statements, but in PPS25 has been replaced with ‘Previously-developed land’ See ‘Greenfield’.
Centre for Ecology and Hydrolgy
CEH
Core Strategy
CS This is the strategic vision of the area and is a central pillar of the Local Development Framework, comprising: A vision; Strategic objectives; A spatial land use strategy; Core policies and; A monitoring and implementation framework. The Core Strategy is a Development Plan Document which will determine overall patterns of future development, identifying broad locations where future growth or conservation will take place. All other Development Plan Documents should be in broad conformity with the Core Strategy Document. The Core Strategy is a mandatory document, and a timetable for production is set out within the Local Development Scheme.
Defended Area An area offered a degree of protection against flooding through the presence of a flood defence structure
DG5 register DG5 Register held by water companies on the location of properties at risk of sewage related flooding problems
Development Plan Documents
DPDs These documents have Development Plan Status and consequently form part of the statutory development plan for the area. A DPD will be subject to a independent examination. Typical documents that will have DPD status include the Core Strategy, Site-specific Allocations of Land, Proposals Map, and Area Actions Plans (where needed).
Extreme Flood Outline
EFO Flood ‘zone’ maps released by the Environment Agency in June 2004 depict anticipated 0.1% (1 in 1000 year) flood extents in a consistent manner throughout the UK
Flood Alleviation Scheme
FAS Works designed to provide protection from flooding.
Flood Risk Management
The introduction of mitigation measures (or options) to reduce the risk posed to property and life as a result of flooding. It is not just the application of physical flood defence measures
Flood Estimation Handbook
FEH Provides current methodologies for estimation of flood flows for the UK
Floodplain Any area of land over which water flows or is stored during a flood event or would flow but for the presence of defences
Flood Risk Assessment
FRA A detailed site-based investigation that is undertaken by the developer at planning application stage
Flood Storage Area FSA Area designed to store water in a flood and release it later when flood waters have subsided.
Flood Zone Areas of land at risk from tidal or fluvial flooding as delineated by the Environment Agency. Zone 1: Low probability of flooding Zone 2: Medium probability of flooding Zone 3: High probability of flooding
Fluvial Flooding
Flooding caused by high flows in rivers or streams exceeding the capacity of the normal river channel.
Formal Defence A flood defence asset that is maintained by the Environment Agency
JBA Consulting www.jbaconsulting.co.uk N:\2007\Projects\2007s2589 - Tendring District Council - Jaywick Strategic Flood Study\Reports\Stage 2 Draft\2007s2589 JaywickSFRS_v2_1.doc xi

Tendring District Council Jaywick Strategic Flood Risk Study Stage 1 and 2
Freeboard A ‘safety margin’ to account for residual uncertainties in water level prediction and/or structural
performance,
Functional Floodplain
An area of land where water has to flow or be stored in times of flood. In a fluvial river the 1:20 year outline may also be used to define this according to PPS25.
Greenfield Greenfield (sites or land) is a term in common usage that may be defined as ‘development sites or land that has not previously been developed’. Prior to PPS25 the term ‘Greenfield’ was used in Governmental Guidance and Statements, but in PPS25 has been replaced with ‘Undeveloped land’ See ‘Brownfield’.
Informal Defence A structure that provides a flood defence function, however is not owned nor maintained by the Environment Agency
ISISv2.4 1 Dimensional hydrodynamic modelling package developed by Halcrow and HR Wallingford
Local Development Framework
LDF The Local Development Framework is made up of a series of documents that together will form part of the Development Plan. Broadly Local Development Framework documents fall into two categories: Development Plan Documents Supplementary Planning Documents
Local Planning Authorities
LPAs Ie Tendring District Council
Measure A deliverable solution that will assist in the effective management (reduction) of risk to property and life as a result of flooding, e.g. flood storage, raised defence, effective development control and preparedness, and flood warning
Mitigation The management (reduction) of flood risk
National Property Dataset
NPD GIS based national database of residential and commercial properties used by the Environment Agency for Flood Studies.
Probability 1% A measure of the chance that an event will occur. The probability of an event is typically defined as the relative frequency of occurrence of that event, out of all possible events. Probability can be expressed as a fraction, % or a decimal. For example, the probability of obtaining a six with a shake of a fair dice is 1/6, 16% or 0.166. Probability is often expressed with reference to a time period, for example, annual exceedance probability
Rapid Inundation Zone
An area immediately behind defences which, should they fail, will generate a combination of high velocities and flood depths that would cause a risk to life.
Residual Risk The risk that inherently remains after implementation of a mitigation measure (option)
Return Period The expected (mean) time (usually in years) between the exceedance of a particular extreme threshold. Return period is traditionally used to express the frequency of occurrence of an event, although it is often misunderstood as being a probability of occurrence.
Risk The threat to property and life as a result of flooding, expressed as a function of probability (that an event will occur) and consequence (as a result of the event occurring)
Standard of Protection
SoP The return period to which properties are protected against flooding
Strategic Flood Risk Assessment
SFRA The assessment of flood risk on a catchment-wide basis for proposed development in a District
Strategic Flood Risk Study
SFRS The assessment of flood risk at particular location for a specific purpose as outlined in a terms of reference, for example this study
Strategic Flood Risk Management
SFRM Considers the management of flood risk on a catchment-wide basis, the primary objective being to ensure that the recommended flood risk management ‘measures’ are sustainable and cost effective
Supplementary Planning Documents
SPD Supplementary Planning Documents or SPD support DPDs in that they may cover a range of issues, both thematic and site specific. Examples of SPD may be design guidance or development briefs. SPD may expand policy or provide further detail to policies in a DPD. They will not be subject to independent examination.
Sustainability Appraisal
SA A Sustainability Appraisal is a systematic process to predict and assess the economic, environmental and social effects likely to arise from DPDs and SPDs, enabling each document to be tested and refined, ensuring that it contributes towards sustainable development.
Sustainable (Urban) Drainage System
SUDS Current ‘best practice’ for new urban development that seeks to minimise the impact upon the localised drainage regime, e.g. through the use of pervious areas within a development to reduce the quantity of runoff from the site
Tidal Flooding Flooding caused by extreme tide levels
TUFLOW 2-Dimension hydrodynamic modelling package developed by BMT WBM Australia.
Uncertainty A reflection of the (lack of) accuracy or confidence that is considered attributable to a predicted water level or flood extent
JBA Consulting www.jbaconsulting.co.uk N:\2007\Projects\2007s2589 - Tendring District Council - Jaywick Strategic Flood Study\Reports\Stage 2 Draft\2007s2589 JaywickSFRS_v2_1.doc xii

Tendring District Council Jaywick Strategic Flood Risk Study Stage 1 and 2
This page is intentionally left blank
JBA Consulting www.jbaconsulting.co.uk N:\2007\Projects\2007s2589 - Tendring District Council - Jaywick Strategic Flood Study\Reports\Stage 2 Draft\2007s2589 JaywickSFRS_v2_1.doc xiii

Tendring District Council Jaywick Strategic Flood Risk Study Stage 1 and 2
1 INTRODUCTION
1.1 Introduction
In August 2007 JBA Consulting was commissioned by Tendring District Council to undertake the Jaywick Strategic Flood Study. This report details the scoping potential areas/sites (Stage 1) and detailed flood risk study at agreed redevelopment sites (Stage 2).
This strategic flood study has been prepared in accordance with current best practice, Planning Policy Statement 25 Development and Flood Risk (PPS25)2. PPS25 reinforced the responsibility of LPAs to ensure that flood risk is managed effectively and sustainably as an integral part of the planning process, balancing socio-economic needs, existing framework of landscape and infrastructure, and flood risk.
1.2 Objectives
It is clear from the project brief that Tendring District Council requires a pragmatic approach to the assessment of current and future flood risk in Jaywick and Seawick. This will inform the Regeneration Framework for the area, which in turn relates to the Tendring Draft Replacement Local Plan.
The core objectives of the study as defined by the brief are as follows:
1. Define existing flood risk
2. Identify and quantify potential flood risk taking into account climate change and existing/planned defences.
3. Articulate the implications of this risk for regeneration and greenfield development options:
a. In terms of current levels of risk
b. In terms of additional defences required to achieve an acceptable level of risk.
1.3 Study area
The study area comprises Jaywick and its surroundings (Map 1). Jaywick is an Essex seaside village on the east coast of England. The urban settlements in Jaywick and its surroundings include Jaywick Village, Brooklands, Grasslands, Tudor Estate and Seawick.
The rivers in this area are small as the catchment area is limited and the various ditches and creeks reflect the natural state of the area as a coastal marsh prior to construction of the sea defences. Jaywick ditch drains Jaywick and Grasslands and confluences with Bonds ditch before draining to the sea. All these ditches are banked by inland flood defences and have flapped outfalls to prevent backflow from the sea.
The coastal boundary for this study has been chosen from the higher land at Point Clear to Clacton-on-Sea. Sea defences exist all along from Point Clear to Clacton-on-Sea with hard defences protecting the reach at Brooklands. Structures include sluice gates, flood gates, pedestrian and vehicle access over the defences and rock reefs. These defences and structures act in combination as flood defences of this area.
1.4 Background to the study
The standard of flood defence at Jaywick meets the current guidelines for protection against tidal/coastal flooding to 1:200 year or 0.5% probability. There has been significant expenditure on coastal defences and the current shoreline policy is to ‘hold the line’.
2 Communities and Local Government. 2006 Planning Policy Statement 25: Development and Flood Risk. December 2006.
http://www.communities.gov.uk/pub/955/PlanningPolicyStatement25DevelopmentandFloodRisk_id1504955.pdf
JBA Consulting www.jbaconsulting.co.uk N:\2007\Projects\2007s2589 - Tendring District Council - Jaywick Strategic Flood Study\Reports\Stage 2 Draft\2007s2589 JaywickSFRS_v2_1.doc 1
Tendring District Council Jaywick Strategic Flood Risk Study Stage 1 and 2
There are also residual flood risks over the life of any new development:
1. from more extreme tide events than the current design standard,
2. from the fluvial flood risks that have not previously been well defined,
3. from future sea level rise will cause a lower of the standard of protection over time, and
4. there is always a risk that defences could fail or breach in an extreme event. .
The risk of embankment breach is relatively well-known in Jaywick from past events such as the storm of 1953, when water swept across a weak spot in the defences near St Osyth and 37 people drowned. The embankments were reconstructed after 1953 to higher levels and to a higher standard than existed previously are now in very much better condition than they were at that time so the probability of another failure occurring has reduced. At the same time the occupancy of houses at Jaywick is less seasonal and the population has a high number of vulnerable people and thus the consequences of a breach could be higher.
Parts of Jaywick suffer from poor housing, infrastructure and associated social problems and are being considered for regeneration led by Tendring District Council with support from EEDA and Government Office East.
The SFRS is needed to provide baseline data for a better understanding of the possible flood risks over the next 100 years within the coastal floodplain around Jaywick in the context of the planning decisions that must be made for the direction of future development.
JBA Consulting www.jbaconsulting.co.uk N:\2007\Projects\2007s2589 - Tendring District Council - Jaywick Strategic Flood Study\Reports\Stage 2 Draft\2007s2589 JaywickSFRS_v2_1.doc 2

Tendring District Council Jaywick Strategic Flood Risk Study Stage 1 and 2
2 THE PLANNING FRAMEWORK
2.1 Introduction
The purpose of this section of the report is to identify and outline those high level documents which need to be taken in to account in preparing this strategic study, from a national to local level. The documents which have been reviewed include national planning legislation and the Tendring District Replacement Plan, together with the Environment Agency policy guidance.
2.2 National planning policy
2.2.1 PPS25 Development and Flood Risk
In December 2006 the Government published PPS25: Development and Flood Risk. The aim of PPS25 is to ensure that flood risk is taken into account at all stages in the planning process to avoid inappropriate development in areas at risk of flooding and to direct development away from areas at highest risk. The key planning objectives are that “Regional Planning Bodies (RPBs) and Local Planning Authorities (LPAs) should prepare and implement planning strategies that help to deliver sustainable development by:
• Identifying land at risk and the degree of risk of flooding from river, sea and other sources in their areas;
• Preparing Regional or Strategic Flood Risk Assessments (RFRAs/SFRAs) as appropriate, either as part of the Sustainability Appraisal of their plans or as a freestanding assessment that contributes to that Appraisal;
• Framing policies for the location of development which avoid flood risk to people and property where possible and manage any residual risk, taking account of the impacts of climate change;
• Only permitting development in areas of flood risk when there are no suitable alternative sites in areas of lower flood risk and the benefits of the development outweigh the risks from flooding;
• Safeguarding land from development that is required for current and future flood management e.g. conveyance and storage of flood water and flood defences;
• Reducing risk to and from new development through location, layout and design, incorporating sustainable drainage systems (SUDS);
• Using opportunities offered by new development to reduce the causes and impacts of flooding e.g. surface water management plans; making the most of the benefits of green infrastructure for flood storage, conveyance and SUDS; recreating functional floodplain and setting back defences;
• Working effectively with the Environment Agency and other stakeholders to ensure that best use is made of their expertise and information so that decisions on planning applications can be delivered expeditiously; and
• Ensuring spatial planning supports flood risk management policies and plans; River Basin Management and emergency planning.”
In addition to setting out the roles and responsibilities for LPAs and RPBs, PPS25 identifies that landowners also have a primary responsibility for safeguarding their land and other property against natural hazards such as flooding. Those promoting sites for development are also responsible for:
• Demonstrating that it is consistent with PPS25 and Local Development Documents (LDDs);
• Providing a Flood Risk Assessment (FRA) demonstrating whether the proposed development: is likely to be affected by current or future flooding; satisfies the LPA that the development is safe; and identifies management and mitigation measures.
JBA Consulting www.jbaconsulting.co.uk N:\2007\Projects\2007s2589 - Tendring District Council - Jaywick Strategic Flood Study\Reports\Stage 2 Draft\2007s2589 JaywickSFRS_v2_1.doc 3

Tendring District Council Jaywick Strategic Flood Risk Study Stage 1 and 2
PPS25 also introduces an amendment to Article 10 of The Town and Country Planning (General Development Order) 1995 which makes the Environment Agency a Statutory Consultee on all applications for development in flood risk areas.
The introduction of PPS25 enables local authorities to make a direction under Article 4 of the Town and County Planning (General Permitted Development) Order 1995. This will enable Local Authorities to remove permitted development rights where those rights threaten to have a direct, significant and adverse effect on a flood risk area, or its flood defences and their access, or the permeability and management of surface water, or flood risk to occupants.
Sequential Test
PPS25 provides the basis for the sequential approach, it recommends that LPAs use a risk based approach to development planning and specifies the need for undertaking RFRAs and SFRAs in Annex E. When allocating or approving land for development in flood risk areas, those responsible for making development decisions are expected to demonstrate that there are no suitable alternative development sites located in lower flood risk areas.
The methodology introduces a Sequential Test that is core to the SFRA process ( ). The Sequential Test is the key driver for an SFRA. The Environment Agency Flood Zone Map will provide the basis of the test, which will be undertaken a number of times, considering a greater resolution and understanding of flood risk at each stage taking into account flooding from other sources. At each step, sites of lower flood risk are identified and prioritised in order of vulnerability to flood risk (Table 2.3) and their safety in terms of allocation for development. A further level of analysis may be required where development is planned behind or adjacent to existing defences in order to test the sustainability and robustness of the mitigation measures.
Figure 2-1
Figure 2-1 The Sequential Test: its practical application
The Council will be required to prioritise the allocation of land for development in ascending order from Flood Risk Zone 1 to 3, including the subdivisions of Flood Risk Zone 3, if necessary. The Environment Agency has statutory responsibility and must be consulted on all development applications allocated with medium and high risk zones, including those in areas with critical drainage problems and for any development on land exceeding 1 hectare outside flood risk areas. In these circumstances, the Environment Agency will require the Council to demonstrate that there are no reasonable alternatives, in lower flood risk categories, available for development. Where appropriate, the Exception Test is to be applied.
The Exception Test
Where departures from the Sequential Test are justified by the need to locate development in higher risk zones than is appropriate, in order to meet the wider aims of sustainable development, it is
JBA Consulting www.jbaconsulting.co.uk N:\2007\Projects\2007s2589 - Tendring District Council - Jaywick Strategic Flood Study\Reports\Stage 2 Draft\2007s2589 JaywickSFRS_v2_1.doc 4
Tendring District Council Jaywick Strategic Flood Risk Study Stage 1 and 2
necessary to apply the Exception Test. PPS25 acknowledges that flood risk is one of many issues (including transport, housing, economic growth, natural resources, regeneration and the management of other hazards) which need to be considered in spatial planning.
The Exception Test is “only appropriate for use when there are large areas in Flood Zones 2 and 3, where the Sequential Test alone cannot deliver acceptable sites, but where some continuing development is necessary for wider sustainable development reasons, taking into account the need to avoid social or economic blight and the need for essential infrastructure to remain operational during floods.” It may also be appropriate to use it where restrictive national designations such as landscape, heritage and nature conservation designations, e.g. Green Belt areas, Areas of Outstanding Natural Beauty (AONBs), Sites of Special Scientific Interest (SSSIs) and World Heritage Sites (WHS), prevent the availability of unconstrained sites in lower risk areas.
PPS25 explains where and for what type of development the Exception Test needs to be applied. In some situations, for certain types of development, it is not appropriate to use the Exception Test to justify development, for example, development which is highly vulnerable to flooding cannot be justified within the high risk zone through the use of the Exception Test. The situations where it is necessary and appropriate to apply the Exception Test are outlined below.
Where the Exception Test is required, it should be applied as soon as possible to all Local Development Document (LDD) allocations for development and all planning applications other than for minor development3. All three elements of the Exception Test have to be passed before development is allocated or permitted. For the Exception Test to be passed:
d. It must be demonstrated that the development p ovides wider sustainability benefits to the local community that ou weigh flood risk, informed by an SFRA, where one has been prepared. If the Development Plan Document (DPD) has reached the ‘submission’ stage – see Figure 4 of PPS12: Local Development F amewo ks – the benefits of the developmen should contribute to the Core Strategy’s Sustainability appra sal.
rt
r r ti
rt
e. The development should be on developable p eviously developed land or, if it is not on previously developed land, tha there are no reasonable alternative sites on developable, previously developed land; and
f. A Flood Risk Assessment must demonstrate that the development will be safe, without increasing flood risk elsewhere, and, where possible, will reduce flood risk overall.
PPS25 (paragraphs D11 and D12) states that the Exception Test “should be applied to LDD site allocations for development and used to draft criteria-based policies against which to consider planning applications…Where the Exception Test has been applied in LDD allocations or in criteria-based policies, the local planning authority should include policies in its LDDs to ensure that the developer’s FRA satisfies criterion C). The Environment Agency and other appropriate operating authorities such as Internal Drainage Boards should be consulted on the drafting of any policy intended to apply the Exception Test at a local level”.
Compliance “with each part of the Exception Test should be demonstrated in an open and transparent way”.
Table 2.1 summarises the applicability of the Exception Test for different development sites; housing allocations are classified as ‘more vulnerable’ and employment allocations are ‘less vulnerable’.
3 Definition of minor development:
-Minor non-residential extensions: Industrial/Commercial/Leisure etc. extensions with a footprint less than 250m2
-Alterations: development that does not increase the size of buildings e.g. alterations to external appearance.
-‘Householder’ development: e.g. sheds, garages, games rooms etc. within the curtilage of the existing dwelling in addition to physical extensions to the existing dwelling itself. This definition EXCLUDES any proposed development that would create a separate dwelling within the curtilage of the existing dwelling e.g. subdivision of houses into flats.
JBA Consulting www.jbaconsulting.co.uk N:\2007\Projects\2007s2589 - Tendring District Council - Jaywick Strategic Flood Study\Reports\Stage 2 Draft\2007s2589 JaywickSFRS_v2_1.doc 5

Tendring District Council Jaywick Strategic Flood Risk Study Stage 1 and 2
Flood Risk Vulnerability Classification
In PPS25 different types of development are divided into five flood risk vulnerability classifications:
• Essential infrastructure
• Highly vulnerable
• More vulnerable
• Less vulnerable
• Water compatible development.
Subject to the application of the Sequential Test, PPS25 specifies which of these types of development are suitable within each zone:
Zone 1: All the uses of land listed above are appropriate in this zone.
Zone 2: The water-compatible, less vulnerable and more vulnerable uses of land and essential infrastructure are appropriate in this Zone. The highly vulnerable uses are only appropriate in this zone if the Exception Test is passed.
Zone 3a: The water-compatible and less vulnerable uses of land are appropriate in this zone. The highly vulnerable uses should not be permitted in this zone. The more vulnerable and essential infrastructure uses should only be permitted in this zone if the Exception Test is passed.
Zone 3b: Only the water-compatible uses and the essential infrastructure that has to be there should be permitted in this zone. Essential infrastructure in this zone should pass the Exception Test and be designed and constructed to meet a number of flood risk related targets. The less vulnerable, more vulnerable and highly vulnerable uses should not be permitted in this zone.
Table 2.1: Flood risk vulnerability and Flood Zone compatibility
Table 2.2: Example Table
Vulnerability classification
Essential infrastructure
Water compatible
Highly vulnerable
More vulnerable
Less vulnerable
Zone 1
Zone 2 Exception Test
Zone 3a Exception Test
x Exception Test
Flo
od
zo
ne
Zone 3b Exception Test
x x x
Key: Development is appropriate
x Development should not be permitted Source: PPS25 Table D3
A Practice Guide Companion to PPS25 Living Draft
The Government has produced a consultation companion guide to PPS25 during February 2007. The practice guide provides guidance on the implementation of the policy set out in PPS25. The guide provides further guidance on the preparation of SFRA’s and FRA’s, the Sequential and Exception Test, outlines potential mitigation measures e.g. SUDS and risk management techniques.
JBA Consulting www.jbaconsulting.co.uk N:\2007\Projects\2007s2589 - Tendring District Council - Jaywick Strategic Flood Study\Reports\Stage 2 Draft\2007s2589 JaywickSFRS_v2_1.doc 6

Tendring District Council Jaywick Strategic Flood Risk Study Stage 1 and 2
Table 2.3 Flood Risk Vulnerability Classification
Essential • Essential transport infrastructure and strategic utility infrastructure, including
• Basement dwellings, caravans, mobile homes and park homes intended for
• Hospitals, residential institutions such as residential care homes, children’s homes,
Buildings used for dwelling
• Non–residential uses for health services, nurseries and
• Landfill and waste management facilities for hazardous waste.
cafes, offices, industry, storage and distributi
and processing (except for sand and gravel).
measures are in place).
• Flood control infrastructure, water transmission infrastructure and pumping stations.
• Sewage transmission infrastructure and pumping stations.
• Docks, marinas and wharves, navigation facilities.
• MOD defence installations.
rocessing and refrigeration and compatible activities requiring a waterside location.
•
• Amenity open space, nature conservation and biodiversity, outdoor sports and
• Essential sleeping or residential accommodation for staff required by uses in this rning and evacuation plan.
Notes:
This classification is based partly on DEFRA/Environment Agency research on Flood Risks to People (FD2321/TR2) and a uring flooding.
Buildings that combine a mixture of uses should be placed into the higher of the relevant classes of flo nts that ributed over the site may fall within several classes of flood risk sensitivity.
The impact of a flood o his flood risk vulnerability cla vary within each vulnerability class. Therefore, the flood risk management infrastructure and other risk mi ded to ensure the development is safe may differ betwee uses within a particular vulnerability classification.
(Source: PPS25 Table D2)
• Sand and gravel workings.
• Ship building, repairing and dismantling, dockside fish p
• Water-based recreation (excluding sleeping accommodation).
Lifeguard and coastguard stations.
recreation.
category, subject to a wa
lso on the need of some uses to keep functioning d
od risk. Developme allow uses to be dist
n the particular uses identified within tssification will
tigation measures neen
Infrastructure electricity generating power stations and grid and primary substations.
Highly Vulnerable
• Police stations, Ambulance stations and Fire stations and Command Centres and telecommunications installations and emergency dispersal points.
permanent residential use.
• Installations requiring hazardous substances consent.
More Vulnerable
social services homes, prisons and hostels.
• s, student halls of residence, drinking establishments, nightclubs, hotels and sites used for holiday or short-let caravans and camping.
education.
Less Vulnerable
• Buildings used for shops, financial, professional and other services, restaurants and on, and assembly and leisure.
• Land and buildings used for agriculture and forestry.
• Waste treatment (except landfill and hazardous waste facilities), minerals working
• Water treatment plants and sewage treatment plants (if adequate pollution control
Water-compatible
Development
JBA Consulting www.jbaconsulting.co.uk N:\2007\Projects\2007s2589 - Tendring District Council - Jaywick Strategic Flood Study\Reports\Stage 2 Draft\2007s2589 JaywickSFRS_v2_1.doc 7

Tendring District Council Jaywick Strategic Flood Risk Study Stage 1 and 2
JBA Consulting
2.2.2 Other Planning Policy Statem
PPS1 Delivering Sustainable Development published in February 2005 sets out the overarching planning policies for the dethe tone for other PPSs that . PPS1 explicitly states that development plan policies should take account of flooding, including flood risk. It proposes that new development in areas at risk of flooding should be adevelopments are “sustainable, durable and adaptable” including taking into account natural hazards such as flooding.
ot directly relevant to this strategic study, it is important to recognise that the exercise takes place within the context of other planning policy statements, some of which also require sequential
pwithin
p efo
2.3
ents
livery of sustainable development across the planning system and sets will follow
voided. Planning authorities are also advised to ensure that
Whilst n
testing of site allocations and development roposals. PPS3 Housing, PPG4 Industrial and Commercial Development and Small Firms and PPS6 Planning for Town Centres are intrinsic the planning rocess, and ther re an understanding of the constraints faced as a result of thisadditional policy guidance is imperative.
Local planning policy
Tendring District Replacement Local Plan
The principle of regeneration is based on the Policy CL15 in th
2.3.1
e Tendring District Replacement ovember 2005).
raft Policy CL15 is for the residential development in Jaywick. According to this policy, the council encourages the redevelopment of the original Brooklands, Grasslands and Village areas in
plan4. According to Policy CL15a, Jaywick Regeneration, at 4 specified sites in Jaywick the Council allows only residential and mixed-use development.
2.3.2
upgrading, more new dwellings and raising the land levels.
2.4
Local Plan – Re-deposit draft (N
D
accordance with the Jaywick Master
Jaywick Masterplan
The master plan5 of the Jaywick Regeneration Framework (August 2006) proposed three options for Jaywick regeneration. Option 1 is the minimum intervention option with proposals for infrastructure upgrading and few new dwellings. Option 2 is the medium level option with proposals for infrastructure upgrading and more new dwellings. Option 3 is the most radical option with proposals for infrastructure
Environment Agency policy
Shoreline Management Plan
The current policy is ‘hold the line’ as regards seas defences in the area. This will be reviewed as part of the SMP II studies starting in 2008
2.4.1
.
The draft copy of the first stage of Blackwater and Colne Estuary Strategy (June 2005) is available a and studies and does not indicate likely options for
2.4.3 an
hould be flood risk at its current level, accepting that the risk of flooding could
increase in the future due to climate change. The plan is being revised but given the findings of this
2.4.2 Colne Estuary Strategy
though this only gives some background datfuture management.
North Essex Catchment Flood Management Pl
The draft North Essex Catchment Management Plan (December 2006) gives draft policies for management of fluvial (not tidal) flood risks in the catchments of the Chelmer, Blackwater, Colne and Stour catchments for the future. For minor coastal streams such as the Jaywick ditch, Policy 3 would be followed. According to Policy 3, the existing or alternative flood risk actions scontinued to maintain
study it is unlikely that this Policy will revise as regards fluvial flooding.
4 Tendring District Replacement Local Plan Re-Deposit Draft November 2005. 5 Jaywick Master Plan. Issue 02, May 2006.
www.jbaconsulting.co.uk N:\2007\Projects\2007s2589 - Tendring District Council - Jaywick Strategic Flood Study\Reports\Stage 2 Draft\2007s2589 JaywickSFRS_v2_1.doc 8

Tendring District Council Jaywick Strategic Flood Risk Study Stage 1 and 2
JBA Consulting
2.5 Additional documents of relevance
South Essex SFRA 2.5.1
vember 2006) similar low lying areas such as Canvey Island were considered. Extensive use of breach modelling was employed to highlight areas of greater flood
aywick SFRS were the choice of breach widths of 20m for hard defences and 60m for earth banks.
2.5.2
Mid Essex SFRA covers the Chelmsford, Braintree and Maldon areas. At the time of writing only the able.
2.5.3
e whole Tendring District Council area used flood zone mapping to produce a high level study focused on the potential local plan sites at that time provided by the council and
tails for Jaywick.
In the South Essex SFRA (No
hazard. Of relevance to the J
Mid Essex SFRA
inception report was avail
Tendring SFRA – April 2004
This early SFRA for th
applies pre PPS25 (PPG25) guidance. The study gives no de
www.jbaconsulting.co.uk N:\2007\Projects\2007s2589 - Tendring District Council - Jaywick Strategic Flood Study\Reports\Stage 2 Draft\2007s2589 JaywickSFRS_v2_1.doc 9

Tendring District Council Jaywick Strategic Flood Risk Study Stage 1 and 2
3 DATA SOURCES
3.1 Flood zone maps and properties at risk of flooding
The Environment Agency Flood Zone 2 and 3 maps show the areas presently at risk from tidal flooding in this area. The Flood Zone Maps are precautionary in that they do not take account of flood defences and, therefore, represent a worst-case extent of flood possible. The actual extent of flooding is mitigated by flood defences. In this area due to the topography the extent of flood zones 2 and 3 are effectively the same as shown in Map 2.
The number of properties at flood risk in the area i.e. within Flood Zone 2 was determined using the national property dataset. This indicates that there are 1882, 390 and 395 residential and commercial properties at tidal flood risk in Jaywick, St Osyth and West Clacton respectively, totalling 2667.properties. In addition there are a large number of holiday caravans or mobile homes and associated service facilities primarily at Seawick but also to the east of the counterwall near the Jaywick Martello tower.
3.2 Flood defences and structures
As discussed above the Environment Agency Flood Zone Maps do not take account of the presence of flood defences. PPS256 states that defended areas (i.e. those areas that are protected to some degree against flooding by the presence of a formalised flood defence) are still at risk of flooding, and therefore sites within these areas must be assessed with respect to the adequacy of the defences.
The relevant part of the Environment Agency’s National Flooding and Coastal Defence Database (NFCDD) has been supplied and provides information on existing defences and structures in the area, as well as categorising them by type and providing information on who owns and maintains them. Areas Benefiting from Defences (ABDs) have also been provided. ABDs are those areas which benefit from formal flood defences in the event of flooding from rivers with a 1% chance in any given year or from the sea with a 0.5% chance in any given year. These two datasets are shown on Map 4.
The banks or beach along the Jaywick frontage have concrete wave walls with occasional openings for access that have heavy duty flood gates. There are a number of sections constructed at different times and thus crest levels vary between different designs and condition.
The crest levels may be taken from the beach profile surveys, from LiDAR, information from previous studies such as the Estuary Strategy or the nominal defence levels provided by the Environment Agency as shown in . The wall levels are lower between West Clacton and Jaywick in front of the golf course and also lower in the Colne Estuary where the wave climate is less severe.
Table 3.1
6 Communities and Local Government. 2006 Planning Policy Statement 25: Development and Flood Risk. Annex G para G2.
JBA Consulting www.jbaconsulting.co.uk N:\2007\Projects\2007s2589 - Tendring District Council - Jaywick Strategic Flood Study\Reports\Stage 2 Draft\2007s2589 JaywickSFRS_v2_1.doc 10
Tendring District Council Jaywick Strategic Flood Risk Study Stage 1 and 2
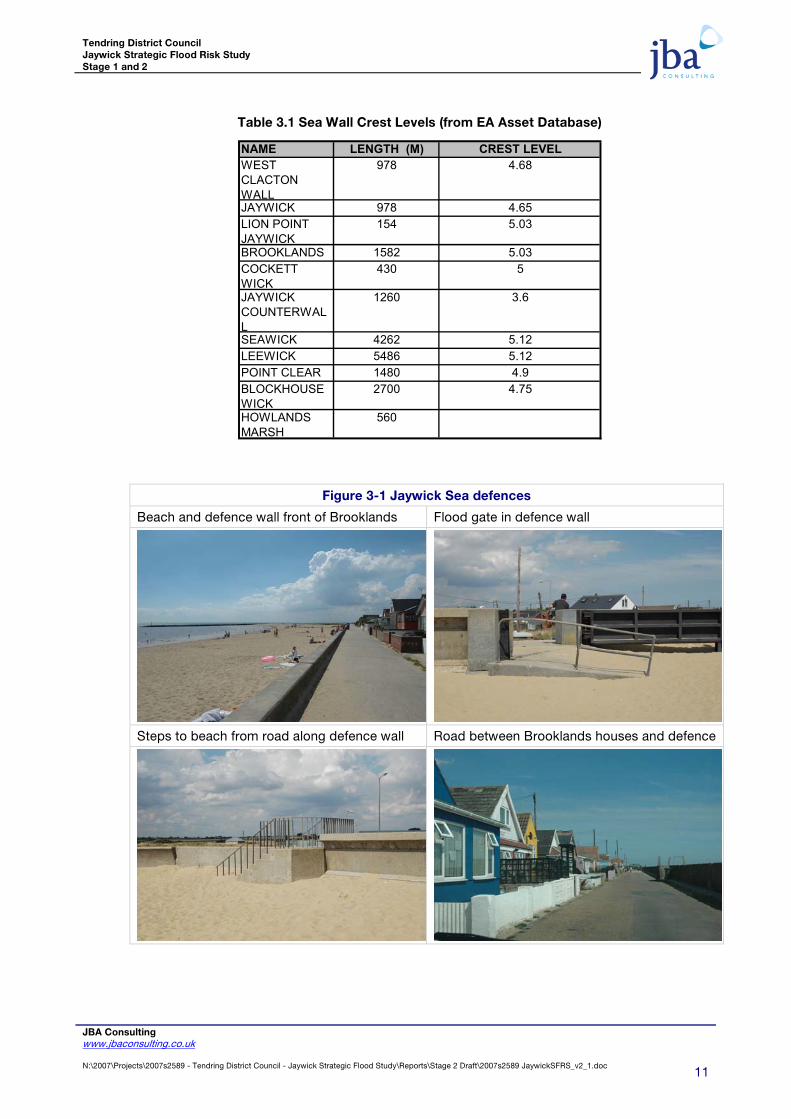
Table 3.1 Sea Wall Crest Levels (from EA Asset Database)
NAME LENGTH (M) CREST LEVELWEST CLACTON WALL
978 4.68
JAYWICK 978 4.65LION POINT JAYWICK
154 5.03
BROOKLANDS 1582 5.03COCKETT WICK
430 5
JAYWICK COUNTERWALL
1260 3.6
SEAWICK 4262 5.12LEEWICK 5486 5.12POINT CLEAR 1480 4.9BLOCKHOUSE WICK
2700 4.75
HOWLANDS MARSH
560
Figure 3-1 Jaywick Sea defences
Beach and defence wall front of Brooklands Flood gate in defence wall
Steps to beach from road along defence wall Road between Brooklands houses and defence
JBA Consulting www.jbaconsulting.co.uk N:\2007\Projects\2007s2589 - Tendring District Council - Jaywick Strategic Flood Study\Reports\Stage 2 Draft\2007s2589 JaywickSFRS_v2_1.doc 11

Tendring District Council Jaywick Strategic Flood Risk Study Stage 1 and 2
3.3 Topographical data
3.3.1 Digital elevation models
Both filtered and unfiltered remotely sensed LiDAR datasets giving details of the ground topography with 2m cell size were provided by the Environment Agency. The influence of the buildings and vegetation are removed in the filtered form. The filtered LiDAR was used as the basis for the ground model. The ground levels used in the model are shown in Map 1.
3.3.2 Beach profiles
The Environment Agency provided beach profile cross-section data for every year from 1993 to 2006 along Essex coast. Figure 3-2 shows one of the beach profiles along the coast in Jaywick. These beach profile cross section data has been processed to get the crest levels of defences. The crest level of the latest cross sections has been used to represent the sea defences in the model. More beach profiles are shown in Appendix D. From these figures the evolution of the beach over time in Jaywick area can be seen. Map 6 shows location for these beach profile plots.
Figure 3-2 Cross section of beach profile near West Clacton at OS 616414, 213528
3.3.3 Existing access routes
Master map data provided by the Environment Agency shows the existing routes connecting Jaywick and its surroundings. See Map 5.
3.4 Other evidence of flood risk
3.4.1 Environment Agency
A GIS layer with extents of previous flooding events was supplied by the Environment Agency. This shows the extents of the coastal tidal flood in 1953 and 1978. These are shown in Map 3.
3.4.2 Internet searches
An internet search was carried out for references to flooding in Jaywick beyond the ones provided by the Environment Agency and the ‘Story of Jaywick Sands Estate’ book which covers the 1953 and subsequent events. Additional information is available:
• In 1730 there was a most severe flood and most of Jaywick area was inundated under water. (http://shewolf.notnet.co.uk/jaywick/history/floods.shtml ).
• In November 1946 there was a flood due to a breach along the sea wall caused by south west gale with heavy rain and thunderstorm.
JBA Consulting www.jbaconsulting.co.uk N:\2007\Projects\2007s2589 - Tendring District Council - Jaywick Strategic Flood Study\Reports\Stage 2 Draft\2007s2589 JaywickSFRS_v2_1.doc 12
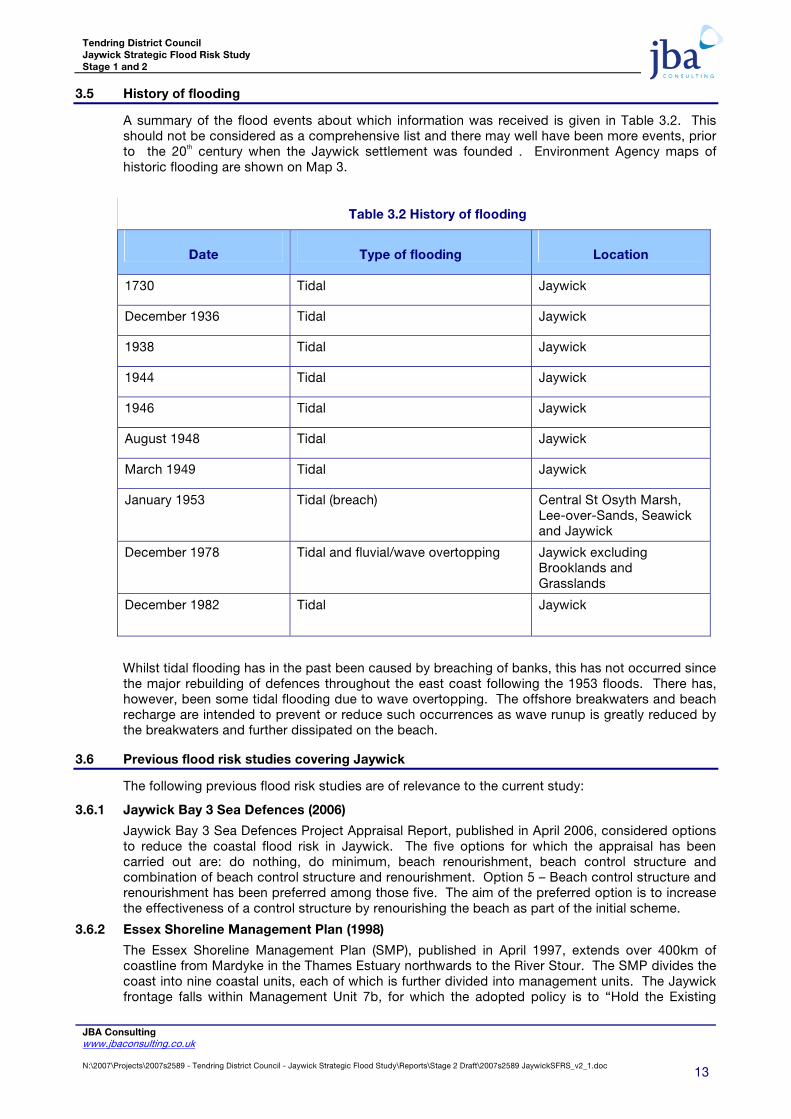
Tendring District Council Jaywick Strategic Flood Risk Study Stage 1 and 2
3.5 History of flooding
A summary of the flood events about which information was received is given in Table 3.2. This should not be considered as a comprehensive list and there may well have been more events, prior to the 20th century when the Jaywick settlement was founded . Environment Agency maps of historic flooding are shown on Map 3.
Table 3.2 History of flooding
Date
Type of flooding
Location
1730 Tidal Jaywick
December 1936 Tidal Jaywick
1938 Tidal Jaywick
1944 Tidal Jaywick
1946 Tidal Jaywick
August 1948 Tidal Jaywick
March 1949 Tidal Jaywick
January 1953 Tidal (breach) Central St Osyth Marsh, Lee-over-Sands, Seawick and Jaywick
December 1978 Tidal and fluvial/wave overtopping Jaywick excluding Brooklands and Grasslands
December 1982 Tidal Jaywick
Whilst tidal flooding has in the past been caused by breaching of banks, this has not occurred since the major rebuilding of defences throughout the east coast following the 1953 floods. There has, however, been some tidal flooding due to wave overtopping. The offshore breakwaters and beach recharge are intended to prevent or reduce such occurrences as wave runup is greatly reduced by the breakwaters and further dissipated on the beach.
3.6 Previous flood risk studies covering Jaywick
The following previous flood risk studies are of relevance to the current study:
3.6.1 Jaywick Bay 3 Sea Defences (2006)
Jaywick Bay 3 Sea Defences Project Appraisal Report, published in April 2006, considered options to reduce the coastal flood risk in Jaywick. The five options for which the appraisal has been carried out are: do nothing, do minimum, beach renourishment, beach control structure and combination of beach control structure and renourishment. Option 5 – Beach control structure and renourishment has been preferred among those five. The aim of the preferred option is to increase the effectiveness of a control structure by renourishing the beach as part of the initial scheme.
3.6.2 Essex Shoreline Management Plan (1998)
The Essex Shoreline Management Plan (SMP), published in April 1997, extends over 400km of coastline from Mardyke in the Thames Estuary northwards to the River Stour. The SMP divides the coast into nine coastal units, each of which is further divided into management units. The Jaywick frontage falls within Management Unit 7b, for which the adopted policy is to “Hold the Existing
JBA Consulting www.jbaconsulting.co.uk N:\2007\Projects\2007s2589 - Tendring District Council - Jaywick Strategic Flood Study\Reports\Stage 2 Draft\2007s2589 JaywickSFRS_v2_1.doc 13

Tendring District Council Jaywick Strategic Flood Risk Study Stage 1 and 2
Defence Line”. Work will begin on updating the SMP when the SMP II review begins in late 2007 or 2008.
3.6.3 Jaywick Masterplan studies
Breach analysis As part of the production of the Jaywick Masterplan by Llewelyn Davies Yeang (September 2006) WSP carried out an initial breach analysis for a 200 year plus climate change tidal event with a peak level of 4.6mAOD. A simple spreadsheet of flood storage and spills was used to estimate the flood levels. The assumptions involved in such an analysis are crude and give a limited indication of flood hazard compared with the more comprehensive modelling used in the current study.
Each breach was run for 36 hours of simulation and the results for sixteen scenarios were produced. The analysis suggests that the worst scenario of flooding considered was for a breach of 200m wide at Seawick Holiday Village. The predicted flood levels at Brooklands, Grasslands and Central Storage is 3.8mAOD and at Seawick is 4.47mAOD respectively. A 50m breach of Brooklands hard defences would result in flood level of 2.66mAOD at Brooklands, 2.34mAOD at Grasslands, 1.98mAOD at Central Storage and no flood at Seawick. Overtopping analysis An analysis of the potential overtopping flows was carried out for 1 in 1000 year tidal event including the effect of predicted climate change on sea level (a peak level of 5.20mAOD was assumed which is less than would be currently expected for such an event in 2105). The analysis indicated that for the existing situation flood levels at Brooklands, Grasslands and Central Storage are 2.823mAOD and at Seawick is 1.306mAOD. Further analysis WSP carried out further analysis to determine the effect of varying the height of the counter wall and the effect after decreasing the breach width at Seawick Holiday Village from 200m to 100m.
Repairing the Jaywick counter wall to a height of 3.6mAOD increased the modelled flood level at Seawick from 4.21 to 4.34 mAOD. Increasing the counter wall further to 4.5mAOD increased the flood levels in Seawick to 4.59mAOD but could prevent breaches to the west affecting Brooklands and Grasslands. Decreasing the breach width from 200m to 100m at Seawick Holiday Village showed that, as would be expected, flooding decreases for a narrower breach.
JBA Consulting www.jbaconsulting.co.uk N:\2007\Projects\2007s2589 - Tendring District Council - Jaywick Strategic Flood Study\Reports\Stage 2 Draft\2007s2589 JaywickSFRS_v2_1.doc 14

Tendring District Council Jaywick Strategic Flood Risk Study Stage 1 and 2
4 METHODOLOGY FOR ANALYSIS OF FLOOD RISK
4.1 Introduction
This section introduces how flood risks in Jaywick have been assessed, for the present day condition and for future climate scenarios for 50 and 100 years into the future (year 2057 and 2107).
4.2 Main Sources of Flood Risk
4.2.1 Tidal flood risk
Most of the area of Jaywick, Brooklands, Grasslands, Seawick and the St Osyth marshes would be at risk from tidal flooding were it not for the defences in place along the coast. The area is in Flood Zones 2 and 3 which represents the area that would be flooded in 1:200 year and 1:1000 year return period tidal surge if there were no defences. The risk is borne out by the events of 1953 when extensive areas were flooded due to overtopping and breaching of the defences. In the year 1978 there was also some flooding due to wave overtopping at Jaywick.
The probability of a failure of the sea defences occurring is minimised by the actions of the Environment Agency in maintaining the defences and beach but there remains a residual risk from tidal flooding.
The concept of residual risk is illustrated in Figure 4-1. An assessment of the ‘residual’ risk is essential for planning purposes. A more detailed assessment, with more attention to likely locations of defence failure is detailed in this section.
Figure 4-1 Illustration of residual risk behind coastal defences
Rapid Inundation Zone
Level inferred by Flood Zone Map Lower
residual risk area
Level calculated from breach or overtopping modelling Sea Defence Floodplain
4.2.2 Fluvial flood risk
Fluvial flooding in the Jaywick area caused when high flows occur following rainfall at a time of high tide and thus limited discharge to the sea.
The Environment Agency provided the location of main rivers, and in the Jaywick area there are only relatively small ditches (Map 2) from which the fluvial flood extent is not currently shown on Environment Agency mapping due to the dominance of tidal flooding in the area. Jaywick ditch drains Jaywick Village and Grasslands and confluences with Bonds ditch before draining to the sea through a flapped outfall. The St Osyth ditch connects with Bonds ditch draining Seawick via a sluice through the counterwall to the Jaywick side and the main outfall is to the Colne Estuary controlled by Leewick sluice.
JBA Consulting www.jbaconsulting.co.uk N:\2007\Projects\2007s2589 - Tendring District Council - Jaywick Strategic Flood Study\Reports\Stage 2 Draft\2007s2589 JaywickSFRS_v2_1.doc 15

Tendring District Council Jaywick Strategic Flood Risk Study Stage 1 and 2
A separate outfall serves the Brooklands ditch which drains the Brooklands area and outfalls directly to the sea and is not linked to any other ditches. Outfalls of all these ditches are controlled by flap gates backed up by a manual sluice in case of failure.
There was flooding from the Jaywick ditch in 1978 when the ditch was draining wave overtopping of the seawall. The extent and significance of the flooding along the Jaywick ditch was not severe and few properties were flooded.
There is a potential for blockage of such structures by debris, both from natural and human sources. Small culverts are most at risk from blockage, and those with trash screens (if they are not cleared during the event), but even larger culverts can get blocked quite rapidly as debris accumulates. Poor maintenance and damage to the structures by the owners can exacerbate blockage problems. Any blockage that does occur as a result of debris accumulation will cause water levels to be raised upstream of the structure and consequently increase flood risk in these locations. The draft North Essex Catchment Management Plan (December 2006) states that Jaywick ditch has the highest priority for maintenance in the area.
4.3 Other sources of flood risk
In addition to tidal and fluvial flood risks, alternative sources of flooding are from surface water, sewers, groundwater, and flooding from lakes.
4.3.1 Surface water flooding
Flooding from surface water runoff is usually caused by intense rainfall that may only last a few hours, and usually occurs in lower lying areas often where the drainage system is unable to cope with the volume of water. The urban developments in Jaywick and its surroundings are not large and there is no recorded history of surface water flooding in Jaywick.
4.3.2 Sewer flooding
Information from the CFMP indicates that there are no properties recorded as being flooded by overloaded sewers on the Anglian Water DG5 register within the study area.
4.3.3 Groundwater flooding
There is no history of groundwater flooding so far in Jaywick due to raised groundwater table or water logging.
4.3.4 Flooding from lakes
There is no lake in the model limit study area. There was an effort in 1929 to create an artificial lake for recreational purpose but the water pumped in to the lake drained away at the same speed as it was pumped in.
4.4 Flood defences and structures
4.4.1 Defences and structures
There are both coastal and fluvial defences in the area although the coastal defences dominate. The Environment Agency database NFCDD shows that there are manmade sea defences all along the coast from Point Clear, East bank of Colne Estuary, to Clacton-on-Sea. There are also inland fluvial defences along the ditches. The levels of sea defences ranges from 4.38m to 5.7m AOD. Sea wall levels defending Brooklands varies between 4.7m and 5.7m AOD. These top levels of defences are extracted from the beach profile data supplied by the Environment Agency.
The counter wall separates Seawick and Grasslands by running north from the beach to Cockett Wick Farm. The level of the counter wall ranges from 2.89m to 3.6m AOD. St Osyth ditch crosses the counter wall before joining Bonds ditch. The flow of St Osyth ditch through the counter wall is controlled by a sluice gate. The surveyed levels of inland defences are not available.
Structures include sluice gates, flood gates, pedestrian and vehicle access over the defences and they are also used for flood defence purposes. Structures in the sea include rock reefs and groynes.
Defences and structures are shown in Map 4. The major source of flood risk with the greatest consequence to sites in the Jaywick area is in reality from failure or overtopping of these coastal defences during a high magnitude storm surge event.
JBA Consulting www.jbaconsulting.co.uk N:\2007\Projects\2007s2589 - Tendring District Council - Jaywick Strategic Flood Study\Reports\Stage 2 Draft\2007s2589 JaywickSFRS_v2_1.doc 16

Tendring District Council Jaywick Strategic Flood Risk Study Stage 1 and 2
4.5 Analysis of Tidal residual risk
4.5.1 Approach
The approach followed was to use a two dimensional model of the passage of flow over or through a bank and the subsequent paths around Jaywick and its surroundings. The latest version of the software ‘TUFLOW’ (2007-07-AB) has been used for all the simulations.
The 2D TUFLOW model calculates flows using a regular square grid for which elevation is defined at each corner, at each side centre and cell centre. The grid should be aligned in the primary direction of flood flows which in this case is from Colne Point to Clacton-on-Sea. The model was built with uniform grid size of 10m.
All the flood defences were represented by elevation lines using supplied beach profile and unfiltered LiDAR data. Breaches at different locations were modelled by resetting defence levels to their nearest ground levels. Tidal time series as detailed in the next section, were applied as model boundary conditions at breaching and overtopping locations.
Breaches for the present day 0.5% and 0.1% annual probability tidal events, and for future climate scenario 0.5% annual probability tidal events have been modelled. Overtopping of the 0.5% annual probability tidal event plus climate change scenario for the existing situations has been modelled.
4.5.2 Tidal level time series
For running a realistic simulation of the variation of flow through a breach a tidal time series of water levels is required. This will allow flow to drain out to the sea through a breach during low water as well as flow back on the next tide cycle until the breach is repaired. Design event tidal-graphs were therefore derived for present (0.5% and 0.1% AEP) and future climate scenarios (0.5% AEP, 2107). This involved consideration of the following elements of a tide-surge event:
(1) the peak level of the events;
(2) the shape and magnitude of the underlying astronomical tide;
(3) the shape and magnitude of the storm surge, and;
(4) the timing of the storm surge relative to astronomical high tide.
The peak level for the design events are based on extreme still water sea levels (tide + surge) calculated by Haskoning as part of the recently completed report on Anglian Region Eastern and Central Area Extreme Sea Levels7. As part of the Haskoning study, extreme sea levels were calculated for Clacton-on-Sea and Colne Point near Jaywick. Extreme sea level estimates for Jaywick were determined through a linear interpolation between these two sites and results are given in Table 4.1.
Table 4.1 Present day extreme sea level near Jaywick
Return Period (years)/AEP
1 5 10 20 25 50 100 (1%)
200 (0.5%)
250 500 1000 (0.1%)
Peak level (mAOD)
2.91 3.27 3.43 3.58 3.63 3.79 3.94 4.10 4.15 4.31 4.46
To account for climate change the latest Defra guidelines for sea level rise (and ground subsidence), published in 20068 were used. The predicted rate of sea level rise accelerates significantly after 50
7 Environment Agency, Anglian Region Eastern and Central Areas Report of Extreme Tide Level. Report completed by Royal
Haskoning on behalf of the Environment Agency, February 2007. 8 Flood and Coastal Defence Appraisal Guidance: FCDPAG3 Economic Appraisal. Supplementary Note to Operating Authorities –
Climate Change Impacts, October 2006.
JBA Consulting www.jbaconsulting.co.uk N:\2007\Projects\2007s2589 - Tendring District Council - Jaywick Strategic Flood Study\Reports\Stage 2 Draft\2007s2589 JaywickSFRS_v2_1.doc 17

Tendring District Council Jaywick Strategic Flood Risk Study Stage 1 and 2
years and the expected mean sea levels in 100 years time are predicted to be over 1m above the current day. As shown in the 0.5% annual probability tidal event extreme sea level for Jaywick for the year 2107 is therefore estimated to be 5.12mAOD.
Table 4.2
Table 4.2 Future climate 0.5% annual probability extreme sea level near Jaywick
Year
2007 2032 2057 2082 2107
Duration from 2007 (years)
0 25 50 75 100
Rise in sea level (m) 0 0.13 0.35 0.65 1.02
Peak level (mAOD) 4.10 4.23 4.45 4.75 5.12
In addition to peak extreme sea levels, the shape and timing of the design storm surge can have a significant impact on flooding. The shape of the storm surge was taken from the 1953 storm surge profile, as recorded at Southend as this was a particularly long duration surge that gives an extreme case. The shape of the underlying astronomical tide for the design tidal-graph is taken from tide data collected at Clacton-on-sea. The peak magnitude of the central tide has been set equal to the predicted Highest Astronomical Tide (HAT) for the area. This value has been interpolated from HAT estimates for Felixstowe and Sheerness provided by the Proudman Oceanographic Laboratory9,10 The interpolated HAT level at the study site for present day mean sea level conditions is 2.66mAOD.
The design tidal-graphs for each scenario were constructed by combining an astronomical tide with the design storm surge to give the calculated peak as shown in to Figure 4-5. For each scenario, the peak of the storm surge has been situated such that it occurs 2 hours before high tide, as it did in the 1953 event11. The surge was then scaled so that when combined with the astronomical tide the peak level of the central tide equalled the predicted peak level for the two present day scenarios.
Figure 4-2
Figure 4-2 200 year tidal time series
(200 year Design Curve)
-3.00-2.00-1.000.001.002.003.004.005.006.00
0.00 10.00 20.00 30.00 40.00 50.00 60.00 70.00
Time (hours)
Leve
l (m
AO
D)
Astronomical TideSurge ResidualsTotal Sea Level
9 http://www.pol.ac.uk/ntslf/tgi/portinfo.php?port=felix.html
10 http://www.pol.ac.uk/ntslf/tgi/portinfo.php?port=sheer.html
11 This is related to tide-surge interaction processes, which normally result in surges peaking at approximately mid tide.
JBA Consulting www.jbaconsulting.co.uk N:\2007\Projects\2007s2589 - Tendring District Council - Jaywick Strategic Flood Study\Reports\Stage 2 Draft\2007s2589 JaywickSFRS_v2_1.doc 18

Tendring District Council Jaywick Strategic Flood Risk Study Stage 1 and 2
Figure 4-3 1000 year tidal time series
(1,000 year Design Curve)
-3.00-2.00-1.000.001.002.003.004.005.006.00
0.00 10.00 20.00 30.00 40.00 50.00 60.00 70.00
Time (hours)
Leve
l (m
AO
D)
Astronomical TideSurge ResidualsTotal Sea Level
Figure 4-4 200 year plus 50 year climate change tidal time series
(200year + 50 yr Climate Change Design Curve)
-3.00-2.00
-1.000.001.00
2.003.00
4.005.00
0.00 10.00 20.00 30.00 40.00 50.00 60.00 70.00
Time (hours)
Leve
l (m
AO
D)
Astronomical TideSurge ResidualsTotal Sea Level
Figure 4-5 200 year plus 100 year climate change tidal time series
(200 year +100 year Climate Change Design Curve)
-3.00-2.00-1.000.001.002.003.004.005.006.00
0.00 10.00 20.00 30.00 40.00 50.00 60.00 70.00
Time (hours)
Leve
l (m
AO
D)
Astronomical TideSurge ResidualsTotal Sea Level
JBA Consulting www.jbaconsulting.co.uk N:\2007\Projects\2007s2589 - Tendring District Council - Jaywick Strategic Flood Study\Reports\Stage 2 Draft\2007s2589 JaywickSFRS_v2_1.doc 19

Tendring District Council Jaywick Strategic Flood Risk Study Stage 1 and 2
4.5.3 Flood defence levels
The crest level of the defence is critical for estimating when overtopping will occur. Along the Jaywick frontage there are a number of reaches of wall and bank constructed in different years that have different crest levels and/or have suffered some settlement but unfortunately no recent survey of the sea defences was available. There were, however, two sources of data:
(a) nominal design levels (asset data), and
(b) a combination of data from beach profile surveys and the unfiltered LiDAR data where there were no beach profiles available.
A comparison between the two data sources can be seen in . There is relatively good agreement for the critical reaches in the area of Jaywick itself where good beach profile information is available and the defence crest is a solid concrete wave wall. The confidence in these levels is thus good.
Figure 4-6
Figure 4-6 Comparison of seawall and tidal levels
Towards St Osyth no beach surveys were available, and greater deviation is seen between the design levels and the LiDAR. Better survey data would be desirable though was not critical to this study due to the greater importance of the defences close to Jaywick itself. There may be information available from the current Colne Estuary Strategy being carried out by the Environment Agency but this could not be obtained for the study.
The existing sea defences were represented in the model by elevation lines connecting the crest level point of surveyed beach profile cross sections. Where the beach profile cross section data points are not available, in the area of Colne Estuary the elevation points were defined from the unfiltered LiDAR. The counter wall has been represented by elevation lines connecting the elevation points defined from the unfiltered LiDAR which suggests some settlement of the bank from design level.
4.5.4 Overtopping
The potential for ‘still water’ overtopping over the existing sea defences due to tidal surges (but excluding the effect of wave action) is important as the probability of a bank failing increases rapidly when the defence is continuously overtopped.
The peak tidal levels for present day 200 year and 1000 year return period events (0.5% and 0.1% annual probability) are estimated as 4.10m and 4.46m AOD respectively. The existing sea defence levels ranges from 4.65 to 5.12m AOD thus present day tide levels even to such extreme event probabilities are below the existing sea defence levels and still water overtopping should not occur for these events.
In the future, however, as sea level rises then unless the sea wall crest is raised then overtopping becomes more likely. As shown in Figure 4-6 there would be very little overtopping in 2057 but by 2082, unless the wall walls are raised, significant overtopping would occur. By 2107 a long length of sea wall is overtopped at the peak of a storm surge by around 0.2m.
JBA Consulting www.jbaconsulting.co.uk N:\2007\Projects\2007s2589 - Tendring District Council - Jaywick Strategic Flood Study\Reports\Stage 2 Draft\2007s2589 JaywickSFRS_v2_1.doc 20

Tendring District Council Jaywick Strategic Flood Risk Study Stage 1 and 2
The crest level of the earth banks towards Point Clear are lower than the asset standard according to the beach survey and LiDAR and thus there is uncertainty for this part of the bank as to whether overtopping would occur. The difference in crest levels is significant for potential overtopping to the St Osyth marshes but is less critical for Jaywick where the lower wall levels along the golf course are of more importance. The more severe case is assumed for the modelling.
Wave overtopping
The height of waves reaching the seawall at Jaywick will be highly dependent on the effect of the offshore groynes and the impact of the beach. As the beach varies greatly and the groynes reflect and diffract the waves, overtopping is also likely to be localised rather than being extensive as would occur with a ‘still water’ event of the same relative magnitude.
The construction of the offshore structures and the beach recharge since previous overtopping events makes wave overtopping at Jaywick now much less likely to reoccur. Detailed analysis of the wave behaviour is beyond the scope of this study but to estimate the likelihood of wave action being significant for overtopping over the existing defences, a standard joint probability analysis of wave height and sea level (astronomical tide plus surge) events was considered. The mean wave heights for 1, 10 and 100 year return periods are available from Essex Shoreline Management Plan12 and these were combined with sea level, for the 100 year joint exceedance return period.
For a constant joint exceedance return period of 100 years for different combinations of surge level and nearshore wave height, a simple summation of sea level and wave amplitude ranges from 3.40 to 4.31 mAOD the highest predicted levels occurring in the case where surge is the most significant component. Provided then that near shore wave amplitude is indicatative of the likely wave runup levels at the sea wall (after taking account of the beach and offshore structures) then the most critical case is for ‘still water’ conditions. All combined levels are below the defence crest levels. Although there is a record of overtopping due to wave action at Jaywick, this occurred prior to the offshore structures and beach recharge that together severely limit the likely impact of waves at the sea wall.
Table 4.3 Possible combinations of sea surge level and wave height that give a 1:100 year return period
Variable 1 – Sea level Variable 2 – Wave height Sum
Return Period (years)
Sea level (Tide plus
Surge) (mAOD)
Return Period (years)
Extreme wave mean height
(m)
Current sea level plus wave
amplitude (mAOD)
0.1 2.39 100 2.01 3.40
0.2 2.55 71 1.87 3.49
0.5 2.75 28 1.67 3.59
1 2.91 14 1.61 3.72
2 3.07 7 1.47 3.81
5 3.27 2.8 1.25 3.90
10 3.43 1.4 1.20 4.03
20 3.58 0.70 1.03 4.10
50 3.79 0.28 0.86 4.22
100 3.94 0.14 0.73 4.31
12 Essex Shoreline Management Plan – Volume 3, Report prepared by Mouchel Consulting Limited on behalf of Environment Agency, April 1997
JBA Consulting www.jbaconsulting.co.uk N:\2007\Projects\2007s2589 - Tendring District Council - Jaywick Strategic Flood Study\Reports\Stage 2 Draft\2007s2589 JaywickSFRS_v2_1.doc 21

Tendring District Council Jaywick Strategic Flood Risk Study Stage 1 and 2
4.5.5 Breaching
Three breaches of the existing sea defences were modelled at the areas specified by the Tendring District Council.
The brief suggested three breaching locations:
1. Breach 1 - hard defence wall in Brooklands
2. Breach 2 - soft coastal defence in Seawick to Colne Point (Lee-over-Sands) and
3. Breach 3 - soft estuarine defence in Colne Point and Point Clear
The selection of actual breach locations within the areas specified by the brief was carried out taking into consideration the condition of the sea defences given in the Environment Agency Asset database (NFCDD), the nearby ground levels which influence the likely severity of a breach and likely impact. NFCDD shows the condition of sea defences at breach locations 2 and 3 is Condition Grade 3. Condition 3 means fair, some cause for concern and requires careful monitoring. Condition of sea defences at breach location 1 is Grade 2. Condition 2 means good, but minor defects. The breach locations selected were chosen where the ground levels behind the defences were lowest, giving a conservative estimate of breach flows. Maps 7, 15 and 19 show the breach locations modelled.
The width of breach assumed has an important effect on the flows and thus the extent of flooding simulated. All of the banks have some protection such as concrete ‘Essex’ blocks or piled foundations and a wave wall. There are no standard breach widths but commonly 20m is used for hard defences, 50m for earth banks on rivers and estuaries and 200m for unprotected banks on exposed coastline. The assumption behind this is that the concrete or stone in a hard defence would limit the spread of a breach which initially is likely to be small in size. After discussion with the Environment Agency, to be consistent with South Essex SFRA and slightly more conservative than standard practise, breach widths of 20m for hard defence wall at Brooklands and 60m for the banks at St Osyth were used in the model.
The breaches have been modelled by resetting the elevation of the sea defences to their nearest ground level. To model the 20 m wide breach, Breach 1 in Brooklands and 60m wide breach, Breach 2 in Lee-over-Sands, the ground levels within the breach are assumed to be scoured to 1.0mAOD. The level of Breach 3 in Colne Estuary has been set to 0.0mAOD.
These breaches have been modelled for the current 200 year and 1000 year return period events and future climate 200 year events for 50 and 100 years into the future (2057 and 2107). Each breach event has been modelled individually (ie multiple breaches are assumed not to occur).
4.6 Calculation of Flood hazard
Based on recent research the calculation of a flood hazard indicator can be used to indicate the flood conditions in which people are likely to be swept over or drown in a flood. The flood hazard is calculated as a combination of flood depth, velocity and the presence of debris. The UK flood hazard formula which was development as part of the EA/Defra funded research‘13 used in the modelling is
HR = d*(v+0.5) +DF
where HR is flood hazard rating, d is depth of flooding in m, v is velocity of flood waters in m/sec, and DF is debris factor has been chosen to calculate flood hazard.
The debris factor depends on the type of land use. Here, urban type land use has been chosen to include the effect of debris.
The TUFLOW model used for simulation of breaching, is able to directly calculate the hazard indicator and output maximum results for a particular simulation. Based in the Defra Research, the calculated flood hazard can be classified to identify the areas for community development, emergency planning and safe access and egress routes as shown in Table 4.4.
13 Flood Risks to People Defra Report FD2321 (2006)
JBA Consulting www.jbaconsulting.co.uk N:\2007\Projects\2007s2589 - Tendring District Council - Jaywick Strategic Flood Study\Reports\Stage 2 Draft\2007s2589 JaywickSFRS_v2_1.doc 22

Tendring District Council Jaywick Strategic Flood Risk Study Stage 1 and 2
Table 4.4 Categories of Flood hazard
From To Description 0 0.75 Caution 0.75 1.50 Danger for some 1.50 2.50 Danger for most
Flo
od
ha
zard
va
lues
2.50 20.0 Danger for all
4.7 Fluvial flooding
The Jaywick ditch runs from Clacton in a westerly direction to a flapped outfall structure near to the counterwall. There is no river section survey available though the available LiDAR survey gives information on the channel top width and details of the floodplain. An ISIS model was set up based on this data and a field visit from which the channel bed level could be estimated. For a channel such as this the key factor is the period during which high tides prevent discharge and the storage that is needed during this period. This tide locking period will vary with the state of the tide within the spring/neap variation, and a typical design approach is to use a mean high water spring tide.
A 1 D ISIS model of Jaywick ditch was built to help assess the fluvial flood risk. The 1D model cross sections of ditch and flood plains were extracted from the LiDAR data at regular intervals as there was no detailed survey available. The site was, however visited to verify the information used. The location of Cockett Wick sluice is very close to the sea wall defence, downstream of the confluence with Bonds ditch and only few metres upstream of the entrance into the outfall through the sea wall. A typical model cross section of Jaywick ditch on the rear side of Grasslands is given in Figure 4-7.
Catchment details of Jaywick ditch at its outlet were derived to produce a 100 year flood event hydrograph using the FEH Rainfall-Runoff method (Figure 4-8). The catchment area of Jaywick ditch at its outlet is 4.51 km2 and critical storm duration of 12.5 hours has been used as this is a highly pervious catchment. Sensitivity to storm duration was tested and it was found that a relatively long duration event of 12.5 hours with the peak corresponding to high tide was the most critical.
Tidal time series derived from Mean High Water Springs (MHWS) were used as the downstream boundary conditions. Current day MHWS at Clacton-on-Sea based on the Haskoning report14 is 2.21mAOD has been used to derive the current day tidal time series at Jaywick ditch outfall. Simulations of this 1D model were carried out for 1 in 100 year fluvial events during a mean spring tide for current and future climate conditions.
Plotting the predicted peak water levels against the ground topographic data indicates that the area rear of Grasslands can be flooded as shown in Figure 5-3. The maximum water level in the channel cross sections and floodplains at that location were 1.19 and 1.32 mAOD respectively for the current and future scenario in 2107 taking account of sea level rise.
Although the modelling is based on fairly sparse information, results are relatively insensitive to channel and outfall assumptions. Sensitivity tests were carried out and for example it is assumed that the outfall has a 7m2 area of downstream end flap gate, if this is reduced to 4m2, there is no change in the maximum water level. Blockage of the screens at the outfall could worsen the peak levels though the gated link through the counterwall to the St Osyth ditch system could offer some relief depending on the state in that system.
14 Environment Agency, Anglian Region Eastern and Central Areas Report of Extreme Tide Level. Report completed by Royal Haskoning on behalf of the Environment Agency, February 2007.
JBA Consulting www.jbaconsulting.co.uk N:\2007\Projects\2007s2589 - Tendring District Council - Jaywick Strategic Flood Study\Reports\Stage 2 Draft\2007s2589 JaywickSFRS_v2_1.doc 23

Tendring District Council Jaywick Strategic Flood Risk Study Stage 1 and 2
Figure 4-7 Typical Cross section of Jaywick Ditch extracted from LiDAR data
Figure 4-8 100 year inflow hydrograph of Jaywick Ditch
FEH derived design inflow hydrgraph - 100 year flood event
0
0.5
1
1.5
2
2.5
3
0 5 10 15 20 25 30 35
Time (hours)
Flow
(cue
mcs
)
Design Flow (cumecs)
JBA Consulting www.jbaconsulting.co.uk N:\2007\Projects\2007s2589 - Tendring District Council - Jaywick Strategic Flood Study\Reports\Stage 2 Draft\2007s2589 JaywickSFRS_v2_1.doc 24

Tendring District Council Jaywick Strategic Flood Risk Study Stage 1 and 2
Figure 4-9 Tidal time series derived for downstream boundary condition
Tidal time series - Downstream boundary condition
-2
-1
0
1
2
3
4
0 10 20 30 40 5
Time (hours)
Leve
l (m
AO
D
0
)
Current tide (mAOD)Current+50year tide (mAOD)Current+100year tide (mAOD)
JBA Consulting www.jbaconsulting.co.uk N:\2007\Projects\2007s2589 - Tendring District Council - Jaywick Strategic Flood Study\Reports\Stage 2 Draft\2007s2589 JaywickSFRS_v2_1.doc 25

Tendring District Council Jaywick Strategic Flood Risk Study Stage 1 and 2
5 FLOOD RISKS AT POTENTIAL SITES
5.1 Introduction
In this section the tidal and fluvial flood risks are presented for 8 locations specified in the brief (Map 1). In Appendix A, a series of detailed sheets are presented to complement the information collated here and simulation results are presented for the whole study area in the Maps 7 to 24 and as animations attached on CD as detailed in Appendix B.
5.2 Model results at specified locations current day conditions
The 2D model generates a large volume of information for each run. Model results have been analysed using the processing tools in TUFLOW/ ARCGIS outputs and TUFLOW/SMS outputs to interrogate data in the 2D domain and create animations.
Results for a breach occurring in the present day (Maps 7 to 10) are summarised in Table 5.1 to Table 5.6 showing peak water depths, velocities and hazards at the specified locations. The values in the tables below are representative of the location though there may be variation within a site due to local topography. Velocity vector plots for 200 year current tidal event at Breach 1 are presented in and . As shown in any Hazard rating above 0.75 represents a danger to life.
Figure 5-1 Figure 5-2 Table 4.4
Table 5.1 Water depths, velocities and hazards for 200 year tidal event
Maximum water depth (m) Maximum velocities (m/s) Maximum flood hazard Location Number Breach
1 Breach
2 Breach
3 Breach
1 Breach
2 Breach
3 Breach
1 Breach
2 Breach
3 1 1.00 0.00 0.00 0.00 0.00 0.00 1.27 0.00 0.00 2 1.53 0.00 0.00 0.03 0.00 0.00 2.00 0.00 0.00 3 1.19 0.00 0.00 0.01 0.00 0.00 1.70 0.00 0.00 4 1.38 0.00 0.00 0.01 0.00 0.00 1.63 0.00 0.00 5 1.72 0.00 0.57 0.01 0.00 0.00 1.90 0.00 0.39 6 0.00 1.40 1.83 0.00 0.01 0.02 0.00 1.80 2.07 7 0.00 1.33 2.00 0.00 0.04 0.04 0.00 2.00 2.32 8 0.00 1.39 2.00 0.00 0.02 0.03 0.00 2.00 2.15
Note: 1) Locations can be found in Map 1.
Table 5.2 Water depths, velocities and hazards 1000 year tidal event
Maximum water depth (m) Maximum velocities (m/s) Maximum flood hazard Location Number
Breach1
Breach2
Breach3
Breach1
Breach2
Breach 3
Breach 1
Breach 2
Breach3
1 1.12 0.00 0.61 0.04 0.00 0.02 1.72 0.00 1.28
2 1.93 0.00 1.26 0.05 0.00 0.06 2.11 0.00 1.63
3 1.86 0.00 1.08 0.10 0.00 0.00 1.96 0.00 1.32
4 1.82 0.00 1.15 0.04 0.00 0.00 1.87 0.00 1.43
5 2.17 0.00 1.43 0.04 0.00 0.00 2.14 0.00 1.95
6 0.37 1.81 2.43 0.00 0.00 0.13 1.19 1.94 2.42
7 0.00 1.98 2.38 0.00 0.03 0.12 0.00 2.05 2.46
8 0.00 1.94 2.57 0.00 0.02 0.14 0.00 2.21 2.48
Note: 1) Locations can be found in Map 1.
JBA Consulting www.jbaconsulting.co.uk N:\2007\Projects\2007s2589 - Tendring District Council - Jaywick Strategic Flood Study\Reports\Stage 2 Draft\2007s2589 JaywickSFRS_v2_1.doc 26

Tendring District Council Jaywick Strategic Flood Risk Study Stage 1 and 2
Figure 5-1 Velocity vectors for maximum water level for current 200 year tidal event at Breach 1 – Brooklands and Grasslands areas
Figure 5-2 Velocity vector for maximum water level for current 200 year tidal event at Breach 1 – Existing Tudor Estate and Tudor Fields
JBA Consulting www.jbaconsulting.co.uk N:\2007\Projects\2007s2589 - Tendring District Council - Jaywick Strategic Flood Study\Reports\Stage 2 Draft\2007s2589 JaywickSFRS_v2_1.doc 27

Tendring District Council Jaywick Strategic Flood Risk Study Stage 1 and 2
Away from the immediate vicinity of a breach the velocity of flow is generally not high though the flood Hazard is extreme in many cases. More information is shown in Appendix A including plots of the variation of depth with time at the specified locations.
From Table 5.1 and Table 5.3, it can be seen that if there is a breach in the Brooklands sea wall (Breach 1) then the area west of the counter wall Seawick, Central and North St.Osyth marshes do not get flooded due to the counter wall. If there is a breach on the Colne Estuary defence (Breach 3) then Brooklands, there is some overtopping of the counterwall and only lower lying areas such as Grasslands are affected. However if a breach occurs on the coastal frontage (Breach 2), then the counterwall does not get overtopped and the Jaywick side is protected.
For breaches Breach 2 and 3, the flood hazard in a large part of the area on the western side of the counter wall is greater than 1.5 which means that the Hazard is extreme and would be dangerous for all.
The extent of flood varies for each breach and is shown in Maps 7, 8, 15, 16, 19 and 20.
Table 5.3 200 year maximum water level for a breach in sea wall
Breach Western side of Counter wall (mAOD)
Eastern side of Counter wall (mAOD)
1 Dry 2.92 2 2.72 Dry 3 3.29 1.25
The situation for a breach occurring during a 1000 year tidal surge event is similar to above though more severe as would be expected. From Table 5.2 and Table 5.4, it can be seen that if there is a breach in the Brooklands (Breach 1) area west of the counter wall then the St.Osyth marshes do not get affected. None of the potential sites on the eastern side of the counterwall are flooded but all the sites on western side are flooded for Breach 2 as shown in Maps 18 and 19. All the potential sites including Brooklands, Grasslands, existing Tudor estate and Tudor fields are flooded for a breach at location 3 (Breach 3). For breaches 2 and 3, the flood hazard in the areas on the western side of the counter wall is greater than 1.5 and could be dangerous for all. The extent of flood varies for each breach scenario (Maps 9, 10, 17, 18, 21 and 22).
Table 5.4 1000 year maximum water level for a breach in sea wall
Breach Western side of Counter wall (mAOD)
Eastern side of Counter wall (mAOD)
1 1.57 3.27 2 3.17 1.00 3 3.72 2.61
5.3 Changes in tidal flood hazard in the future assuming breaching
The effect of sea level rise to 2107 was considered and simulations carried out for conditions in 2057 and 2107 for a breach occurring on a 1 in 200 year tidal surge. Although overtopping could occur in 2107, this was not included in the breach analysis as sea walls could be raised and overtopping is simulated in another case.
As would be expected depths and hazards increase markedly as shown in Table 5.5 and Table 5.6, it can be seen that if there is a breach in Brooklands (Breach 1) all sites except St.Osyth marshes get affected. Peak water depths are around 1m greater and the flood hazard is higher than present day and in places is extreme and could be dangerous for all (Maps 11 and 12). Parts of Brooklands and Existing Tudor Estate/Jaywick Village have flood hazard values less than 1.5 as shown in Maps 13 and 14.
Note that it was not necessary to simulate breaches at Breach 2 site as this had already been found to give less severe conditions than a breach on the Colne Estuary Breach 3, though clearly this
JBA Consulting www.jbaconsulting.co.uk N:\2007\Projects\2007s2589 - Tendring District Council - Jaywick Strategic Flood Study\Reports\Stage 2 Draft\2007s2589 JaywickSFRS_v2_1.doc 28
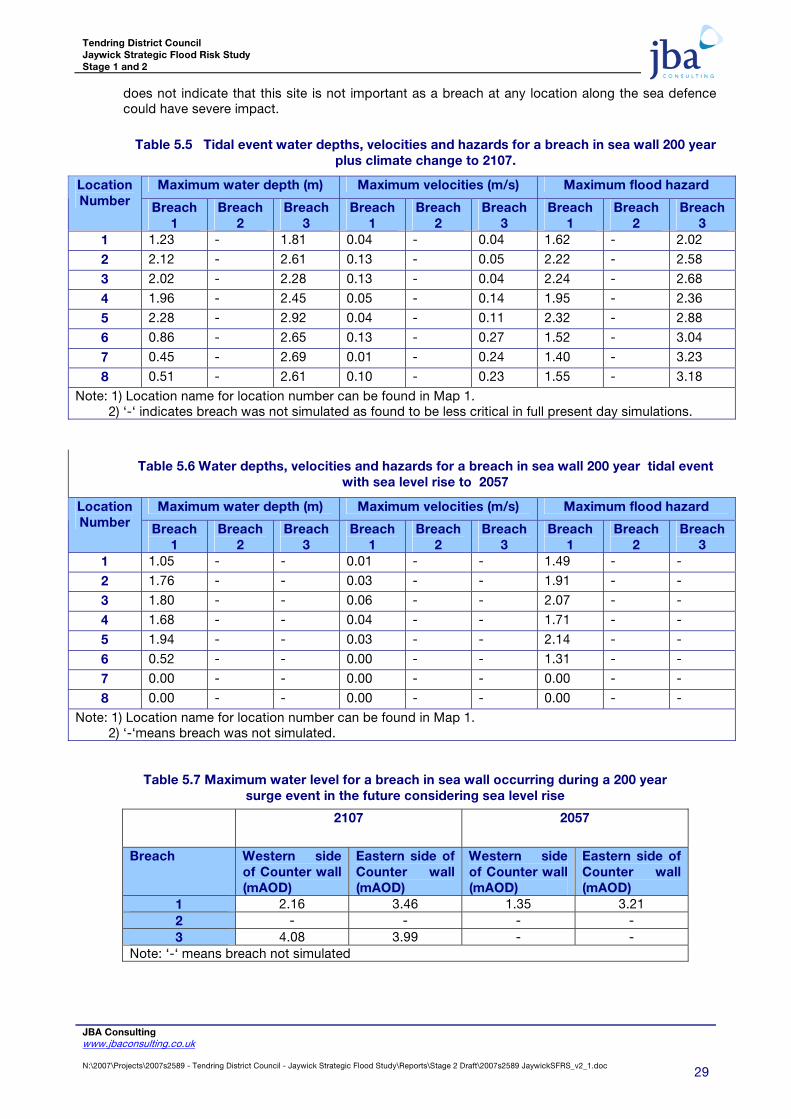
Tendring District Council Jaywick Strategic Flood Risk Study Stage 1 and 2
does not indicate that this site is not important as a breach at any location along the sea defence could have severe impact.
Table 5.5 Tidal event water depths, velocities and hazards for a breach in sea wall 200 year plus climate change to 2107.
Maximum water depth (m) Maximum velocities (m/s) Maximum flood hazard Location Number Breach
1 Breach
2 Breach
3 Breach
1 Breach
2 Breach
3 Breach
1 Breach
2 Breach
3 1 1.23 - 1.81 0.04 - 0.04 1.62 - 2.02
2 2.12 - 2.61 0.13 - 0.05 2.22 - 2.58
3 2.02 - 2.28 0.13 - 0.04 2.24 - 2.68
4 1.96 - 2.45 0.05 - 0.14 1.95 - 2.36
5 2.28 - 2.92 0.04 - 0.11 2.32 - 2.88
6 0.86 - 2.65 0.13 - 0.27 1.52 - 3.04
7 0.45 - 2.69 0.01 - 0.24 1.40 - 3.23
8 0.51 - 2.61 0.10 - 0.23 1.55 - 3.18
Note: 1) Location name for location number can be found in Map 1. 2) ‘-‘ indicates breach was not simulated as found to be less critical in full present day simulations.
Table 5.6 Water depths, velocities and hazards for a breach in sea wall 200 year tidal event with sea level rise to 2057
Maximum water depth (m) Maximum velocities (m/s) Maximum flood hazard Location Number Breach
1 Breach
2 Breach
3 Breach
1 Breach
2 Breach
3 Breach
1 Breach
2 Breach
3 1 1.05 - - 0.01 - - 1.49 - -
2 1.76 - - 0.03 - - 1.91 - -
3 1.80 - - 0.06 - - 2.07 - -
4 1.68 - - 0.04 - - 1.71 - -
5 1.94 - - 0.03 - - 2.14 - -
6 0.52 - - 0.00 - - 1.31 - -
7 0.00 - - 0.00 - - 0.00 - -
8 0.00 - - 0.00 - - 0.00 - -
Note: 1) Location name for location number can be found in Map 1. 2) ‘-‘means breach was not simulated.
Table 5.7 Maximum water level for a breach in sea wall occurring during a 200 year
surge event in the future considering sea level rise
2107 2057
Breach Western side of Counter wall (mAOD)
Eastern side of Counter wall (mAOD)
Western side of Counter wall (mAOD)
Eastern side of Counter wall (mAOD)
1 2.16 3.46 1.35 3.21 2 - - - - 3 4.08 3.99 - -
Note: ‘-‘ means breach not simulated
JBA Consulting www.jbaconsulting.co.uk N:\2007\Projects\2007s2589 - Tendring District Council - Jaywick Strategic Flood Study\Reports\Stage 2 Draft\2007s2589 JaywickSFRS_v2_1.doc 29
Tendring District Council Jaywick Strategic Flood Risk Study Stage 1 and 2
5.4 Changes in tidal flood hazard in the future assuming overtopping only
If there is an overtopping of the future 0.5% (Year 2107) annual probability tidal event over the existing defences all the potential sites could be flooded at a water level of 3.47mAOD on both sides of the counterwall. Though at most of the potential sites, the flood hazards are greater than 1.5, there are some parts of Brooklands and Existing Jaywick Estate with flood hazards below this threshold (danger to most) shown in Maps 23 and 24.
5.5 Fluvial Flooding
As described in Chapter 4, there is no existing modelling of the Jaywick ditch and a simple hydrodynamic model was assembled to enable the flood risk to be quantified. The data available for the modelling was sparse as there is no cross section data of the river though detailed topography of the floodplain in the form of the LiDAR was used and it is thought that the model is sufficient for the purpose of this study.
The model was run for present conditions assuming a 1 in 100 year fluvial flood and normal spring tide and the flood extents predicted were plotted as shown in Figure 5-3. The flood extends into the caravan park area but flooding is not predicted for Grasslands or Brooklands.
Climate change impacts on tidal rivers such as the Jaywick ditch in two ways: the fluvial flows increase by up to 20% over the next 50-100 years; and sea level rise results in longer periods of tide locking. Including both of these impacts to 2107 the predicted flood extent increases as shown in (b). The Tower caravan park is more significantly affected but no flooding is expected in the main residential areas of Grasslands and Brooklands.
Figure 5-3
Because there is a separate outfall in the Brooklands area for local drainage, the actual surface water flooding in these locations could differ from the simulation which only considers the impact of the Jaywick ditch.
JBA Consulting www.jbaconsulting.co.uk N:\2007\Projects\2007s2589 - Tendring District Council - Jaywick Strategic Flood Study\Reports\Stage 2 Draft\2007s2589 JaywickSFRS_v2_1.doc 30
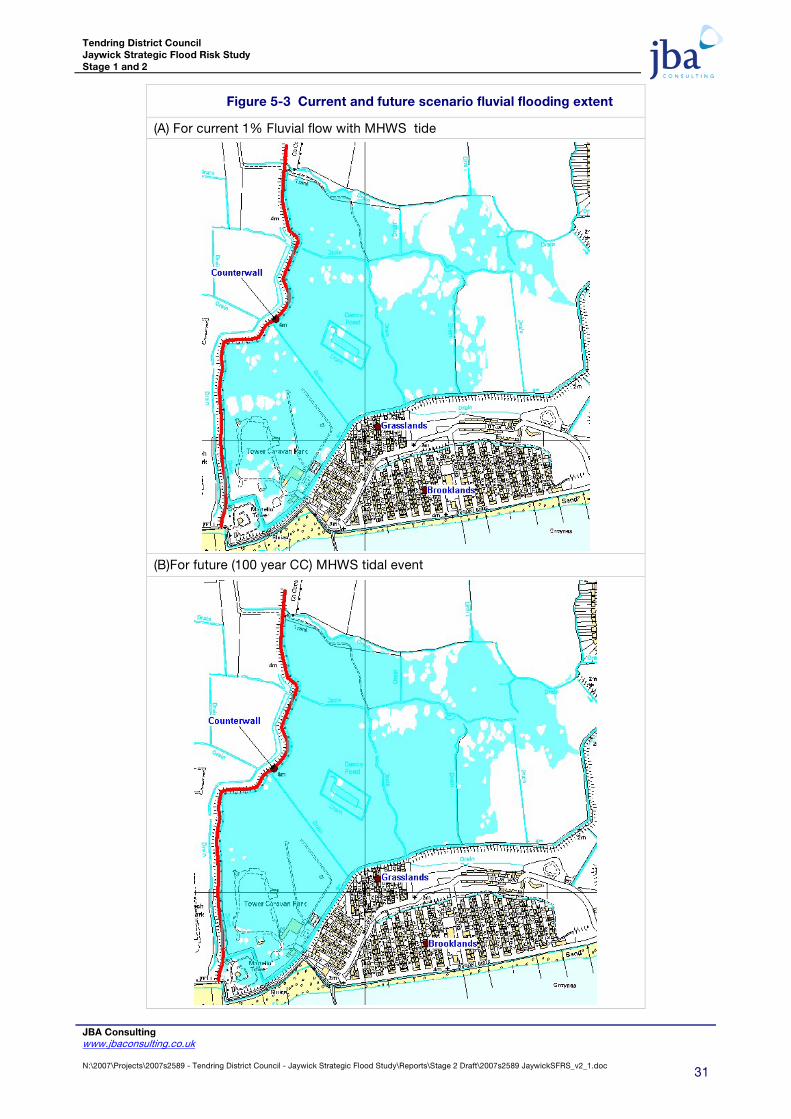
Tendring District Council Jaywick Strategic Flood Risk Study Stage 1 and 2
Figure 5-3 Current and future scenario fluvial flooding extent
(A) For current 1% Fluvial flow with MHWS tide
(B)For future (100 year CC) MHWS tidal event
JBA Consulting www.jbaconsulting.co.uk N:\2007\Projects\2007s2589 - Tendring District Council - Jaywick Strategic Flood Study\Reports\Stage 2 Draft\2007s2589 JaywickSFRS_v2_1.doc 31

Tendring District Council Jaywick Strategic Flood Risk Study Stage 1 and 2
5.6 Screening of sites 1 to 8
The results presented above raise severe concerns about the suitability of the Jaywick area for future development as flood hazards behind the sea defences are high in many locations should there be a failure of the sea wall. The effect does depend on where the failure occurs and the counterwall provides some relief if the failure is to the west of the counterwall. Though clearly if a failure did occur to the east, then the counterwall prevents flow from spreading across a wider area with the result that residential areas are more significantly affected.
In the event of a breach the sites (6, 7 and 8) to the west of the counterwall at Seawick, and St Osyth marsh could be exposed to severely hazardous flood flow and these locations should be eliminated from further consideration as potential development areas. Sites 6, 7 and 8 can be flooded in less than 2 hours if there is a breach on the western side of the counterwall. The condition of the sea defences on the western side of the counterwall require monitoring and the future of the defences for this area should receive more attention in the forthcoming Shoreline Management Plan.
The counterwall can be effective for breaches to the west of Jaywick but if the breach occurs to the east of the counterwall then the effect is to make conditions worse within the more limited size ‘compartment’ that the counterwall creates. Thus for a breach on the eastern side of the counterwall (eg Breach 1), the rate of rise of the flood water increases. For example site 2 gets can be flooded in less than an hour, site 3 in 3.5 hours, site 4 in 3 hours and site 5 in 2 hours. Flood hazards at sites 2, 3, 4 and 5 are significant to extreme. Most of the area of site 1 would experience low to moderate flood hazard if there is a breach on the eastern side of the counterwall.
For this reason site 1, Brooklands and the higher land in its immediate surroundings, is preferred under the sequential test of PPS25 for further consideration and an emphasis should be placed on these areas for future planning.
JBA Consulting www.jbaconsulting.co.uk N:\2007\Projects\2007s2589 - Tendring District Council - Jaywick Strategic Flood Study\Reports\Stage 2 Draft\2007s2589 JaywickSFRS_v2_1.doc 32

Tendring District Council Jaywick Strategic Flood Risk Study Stage 1 and 2
6 MITIGATION MEASURES AND POSSIBLE FLOOD RISKS
6.1 Introduction
Mitigation measures reduce the impact of flooding or increase the ability of people affected to recover from flooding. The possible measures chosen will depend on the nature of the flood risk. In this section, details of proposed mitigation measures to make developments on Brooklands, Grasslands and the ‘Gap’ Site (the gap site lies between Brooklands and the Existing Tudor Estate) to be safe from flooding are presented.
6.2 Potential Mitigation Measures
6.2.1 Relocation
People in areas of redevelopment could be dispersed or relocated to an area of lesser or no flood risk. This option is not without cost or continuing risks to people who remain in the existing properties. It does not need to be detailed further in the SFRS as the issues that such a policy raises are primarily social rather than technical.
6.2.2 Redevelopment of site layout and design
Low-lying waterside areas can be used for recreation, amenity and environmental purposes, allowing the preservation of flow routes and flood storage, and at the same time providing valuable social and environmental benefits contributing to other sustainability objectives. Landscaping should ensure safe access to higher ground from these areas, and avoid the creation of isolated islands as water levels rise.
6.2.3 Raising ground levels
Raising ground levels behind the defence may offer a reduction in risk of failure as well as lower hazard of flooding for the raised development. This must be offset against the relatively high cost and difficulty of achieving this in an existing built up area. The effect of the land raising on other locations and compensatory storage must also be considered.
6.2.4 Secondary Flood defences and raising of the counterwall
Additional secondary defences in the form of roads or flood banks could be used to form more compartments limiting the extent of a breach such as the existing counterwall between Jaywick and Seawick, and for example the area around Brooklands and Grasslands could be further compartmentalised. The difficulty with compartmentalising in this way however is that should a breach into the compartment occur then flood levels would increase markedly as flood water cannot readily spread elsewhere.
The existing counterwall could be raised from its existing level to a level to reduce the occurrence of overtopping identified for the current situation.
6.2.5 Additional openings through the counterwall
The existing sluice gate through the counterwall could opened or closed to reduce the flood risk or modified to allow flow westward only. More openings in the form of sluice gates or culverts could be provided through the existing counterwall to divert the flows between the flood compartments.
6.2.6 Raising floor levels
The raising of floor levels within a development avoids damage occurring to the interior, furnishings and electrics in time of flood. Ideally floor levels should be raised to a height of 300mm-600mm above the water level occurring as a result if a 1 in 200 year event (the event with a 0.5% chance of occurring each year). This additional height that floor level is raised is referred above expected water levels allows for ‘freeboard’ and the effect on internal drainage systems.
Floor levels may be raised by ensuring living accommodation is at a higher level than the ground by increasing slab level or by utilising lower levels only for storage and less vulnerable uses. Access and egress may still be an issue when raising floor levels and resilience of services such as
JBA Consulting www.jbaconsulting.co.uk N:\2007\Projects\2007s2589 - Tendring District Council - Jaywick Strategic Flood Study\Reports\Stage 2 Draft\2007s2589 JaywickSFRS_v2_1.doc 33
Tendring District Council Jaywick Strategic Flood Risk Study Stage 1 and 2
electricity, gas, water supply and drainage may be a concern. This is impractical for most sites within Jaywick due to the large increase in floor level needed above the existing ground level.
6.2.7 Two or three storey properties
Single floor buildings such as ground floor flats or bungalows ae especially vulnerable in the case of rapid rise of water such as occurs after a breach and this risk can be reduced by use of multiple storey construction and raised areas that provide an escape route. Because the flood duration is likely to be of the order of days, however, access and egress to a safer location would still be an issue.
6.2.8 Resistance and Resilience
The potentially high hazards of a breach and the consequent threat to life are the overriding factors and typical flood damage reduction measures are largely inappropriate in Jaywick. For those few locations where there is a threat from fluvial flows, surface drainage limitations or wave splash additional resilience measures such as temporary or permanent barriers or wet proofing can be put in place to reduce damage in a flood and increase the speed of recovery.
The 2003 ‘Preparing for Floods’ document published by the Office of the Deputy Prime Minister and the 2007 Communities and Local Government document ‘Improving the Flood performance of New Buildings – Flood Resilient Construction’ provides further details on resilience measures.
6.2.9 Beach management
The Environment Agency have studied the current beach management at Jaywick and concluded that a further breakwater and beach nourishment is justified to reduce the risk of breach in the sea wall at Brooklands. This scheme is likely to proceed when funds are available. Renourishment of the beach using imported material is expected every 20 years. The estimated capital cost of the initial phase of this option is £ 6.9 million pounds.
The issues of response to long term sea level rise is being studied in the Shoreline Management Plans which will set the future policy for sea defences throughout the country. Although the current policy is to hold the line at Jaywick there is no guarantee that this will be the optimal solution in the longer term. This measure affects the probability of a breach though does not impact on the consequence so was not simulated in the model.
6.2.10 Sea wall crest raising with time
The level of sea wall crest can be raised with time to reduce the flood risk due to any overtopping or breaches in that area. The concrete wavewalls present along the main Jaywick frontage may need to be rebuilt to allow for raising of sufficient strength to counter wave impacts. Breaches with and without future overtopping are considered.
6.3 Options selected for testing
A combination of physical Mitigation Measures (MM1 to MM7) were selected to be modelled to determine their effect on reducing flood risk as shown in Table 6.1. Measures such as increased resilience and design of new development to reduce flood risks should not be ignored but would complement the physical measures tested.
The long term future of the sea defences is critical to the whole Jaywick area and clearly the future policy of beach and sea wall maintenance are critical factors determining the risk of failure of the defence.
JBA Consulting www.jbaconsulting.co.uk N:\2007\Projects\2007s2589 - Tendring District Council - Jaywick Strategic Flood Study\Reports\Stage 2 Draft\2007s2589 JaywickSFRS_v2_1.doc 34

Tendring District Council Jaywick Strategic Flood Risk Study Stage 1 and 2
Table 6.1 Mitigation measures tested in the breach model
Mitigation Measures (MM)
Description
MM1 Counterwall with the existing sluice gate opened MM2 Counterwall with 6 culverts and flap gates MM3 Counterwall raised to 4.5mAOD with 6 culverts and flap gates MM4 Land raised to 4.2mAOD in Brooklands, Grasslands, Lotus way and Gap Site MM5 Land raised to 4.2mAOD with 6 Counterwall culverts and flap gates MM6 Land raised in Brooklands, Lotus way and Gap Site) without counterwall openings MM7 Land raised in Brooklands and Gap Site without Counterwall openings
6.4 Representation of mitigation measures in model
The various measures MM1-MM7 were represented in the model and simulations carried out for key breach events to show the impact on water levels and hazards.
A linked 1D-2D ESTRY-TUFLOW model was been used to model the culvert openings through the counterwall. The 6 culverts with flap gates through the counterwall have been modelled as uni-directional culverts in 1D ESTRY model. These 1 D model culverts are connected to floodplains, on both sides of the counterwall. Each culvert was assumed to be 2 m diameter and 30 m in length beneath the embankment.
To represent the land raising in the model, the topography of the area concerned was reset to a level of 4.2mAOD, which is a likely design level taking account of future increases and always remains dry.
6.5 Model results
The 2D model with mitigation measures generates a large volume of information for each run. Model results have been analysed using the processing tools in TUFLOW/ ARCGIS outputs and TUFLOW/SMS outputs to interrogate data in the 2D domain and create animations.
Results are presented in Table 6.2 to Table 6.4 showing peak water depths, velocities and hazards at potential redevelopment sites. The values in the tables below are just representative and they vary within the sites. Plots of simulated water level time series at each site are presented in Appendix 1.
JBA Consulting www.jbaconsulting.co.uk N:\2007\Projects\2007s2589 - Tendring District Council - Jaywick Strategic Flood Study\Reports\Stage 2 Draft\2007s2589 JaywickSFRS_v2_1.doc 35
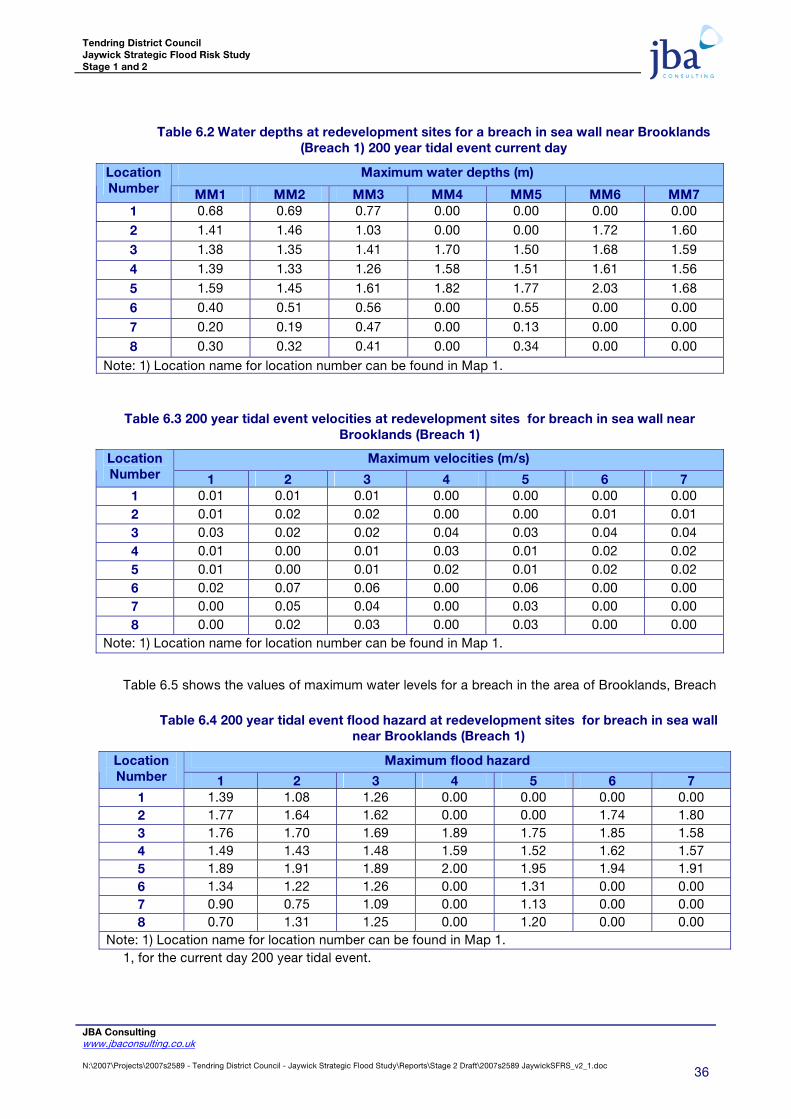
Tendring District Council Jaywick Strategic Flood Risk Study Stage 1 and 2
Table 6.2 Water depths at redevelopment sites for a breach in sea wall near Brooklands (Breach 1) 200 year tidal event current day
Maximum water depths (m) Location Number MM1 MM2 MM3 MM4 MM5 MM6 MM7
1 0.68 0.69 0.77 0.00 0.00 0.00 0.00
2 1.41 1.46 1.03 0.00 0.00 1.72 1.60
3 1.38 1.35 1.41 1.70 1.50 1.68 1.59
4 1.39 1.33 1.26 1.58 1.51 1.61 1.56
5 1.59 1.45 1.61 1.82 1.77 2.03 1.68
6 0.40 0.51 0.56 0.00 0.55 0.00 0.00
7 0.20 0.19 0.47 0.00 0.13 0.00 0.00
8 0.30 0.32 0.41 0.00 0.34 0.00 0.00 Note: 1) Location name for location number can be found in Map 1.
Table 6.3 200 year tidal event velocities at redevelopment sites for breach in sea wall near Brooklands (Breach 1)
Maximum velocities (m/s) Location Number 1 2 3 4 5 6 7
1 0.01 0.01 0.01 0.00 0.00 0.00 0.00 2 0.01 0.02 0.02 0.00 0.00 0.01 0.01 3 0.03 0.02 0.02 0.04 0.03 0.04 0.04 4 0.01 0.00 0.01 0.03 0.01 0.02 0.02 5 0.01 0.00 0.01 0.02 0.01 0.02 0.02 6 0.02 0.07 0.06 0.00 0.06 0.00 0.00 7 0.00 0.05 0.04 0.00 0.03 0.00 0.00 8 0.00 0.02 0.03 0.00 0.03 0.00 0.00
Note: 1) Location name for location number can be found in Map 1.
Table 6.5 shows the values of maximum water levels for a breach in the area of Brooklands, Breach
1, for the current day 200 year tidal event.
Table 6.4 200 year tidal event flood hazard at redevelopment sites for breach in sea wall near Brooklands (Breach 1)
Maximum flood hazard Location Number 1 2 3 4 5 6 7
1 1.39 1.08 1.26 0.00 0.00 0.00 0.00 2 1.77 1.64 1.62 0.00 0.00 1.74 1.80 3 1.76 1.70 1.69 1.89 1.75 1.85 1.58 4 1.49 1.43 1.48 1.59 1.52 1.62 1.57 5 1.89 1.91 1.89 2.00 1.95 1.94 1.91 6 1.34 1.22 1.26 0.00 1.31 0.00 0.00 7 0.90 0.75 1.09 0.00 1.13 0.00 0.00 8 0.70 1.31 1.25 0.00 1.20 0.00 0.00
Note: 1) Location name for location number can be found in Map 1.
JBA Consulting www.jbaconsulting.co.uk N:\2007\Projects\2007s2589 - Tendring District Council - Jaywick Strategic Flood Study\Reports\Stage 2 Draft\2007s2589 JaywickSFRS_v2_1.doc 36

Tendring District Council Jaywick Strategic Flood Risk Study Stage 1 and 2
Table 6.5 200 year event maximum water level for
breach near Brooklands (Breach 1)
Mitigation Measures
Western side of Counter wall (mAOD)
Eastern side of Counter wall (mAOD)
Existing Dry 2.92 MM1 1.79 2.84 MM2 1.89 2.74 MM3 1.90 2.81 MM4 Dry 3.10 MM5 1.91 2.90 MM6 Dry 3.07 MM7 Dry 3.03
The effect of leaving the existing sluice in the counterwall open (MM1) results in minor flooding to the west but there is a reduction of water level on the eastern side of around 0.1m. The effect increases marginally if 6 additional sluices are provided (MM2) which give a total reduction of 0.20m water depth on the eastern side.
It was found that land raising of development areas could give a small increase of flood water depths in other areas. Mitigation measure 4, to raise land in Brooklands, Grasslands, Lotus way and Gap site to keep these areas dry, for example results in an increase of 0.18m of maximum water level in other areas. However, land raising combined with mitigation measures such as counterwall openings (MM5), shows an increase of only 0.08m of maximum water level. Also, raising land only in Brooklands and Gap site has resulted in an increase of only 0.11m of water level in other areas which may be counteracted if the existing sluice gate through the counterwall would be kept opened. If the land raising results in higher land in the vicinity of a potential breach then there may still be an overall reduction in flood risk.
If a breach occurs near Colne Estuary during a 200 year tidal surge in 2107, the counterwall is overtopped and the peak water levels are 4.08m and 3.99m AOD are predicted on the western and eastern side of the counterwall respectively. For the same event with the counterwall raised to a level of 4.50mAOD, peak water levels change to 4.56m and 1.34 mAOD on the western and the eastern side of the counterwall. The raising of counterwall would thus result in an increase of water level on the western side by 0.48m. The increase in flood hazard to the west may, however, not be significant as the area will already be submerged and exposed to high flood hazard in such a situation.
6.6 Costs of mitigation measures
For each of the tested mitigation measures, material quantity and construction costs has been estimated. Table 6.6 shows the estimated volume and costs, to raise the counterwall to a level of 4.5mAOD from its existing levels. It has been estimated that cost of constructing culvert and its inlet structures including providing access routes would be around £50,000 per culvert. Under Defra guidance as used by the Environment Agency an additional contingency should be added to these costs of up to 60% at this outline stage.
Table 6.6 Estimation of quantity and cost for raising the Counterwall to 4.5mAOD
Additional import and fill volume (000m3) 33.1 Top soil strip and fill volume (000m3) 1.2 Cost for import and fill volume (£000) (Rate: £15 per m3) 497 Cost for top soil replacement (£000) (Rate: £10 per m3) 12 Total cost (£) £0.51 million
JBA Consulting www.jbaconsulting.co.uk N:\2007\Projects\2007s2589 - Tendring District Council - Jaywick Strategic Flood Study\Reports\Stage 2 Draft\2007s2589 JaywickSFRS_v2_1.doc 37
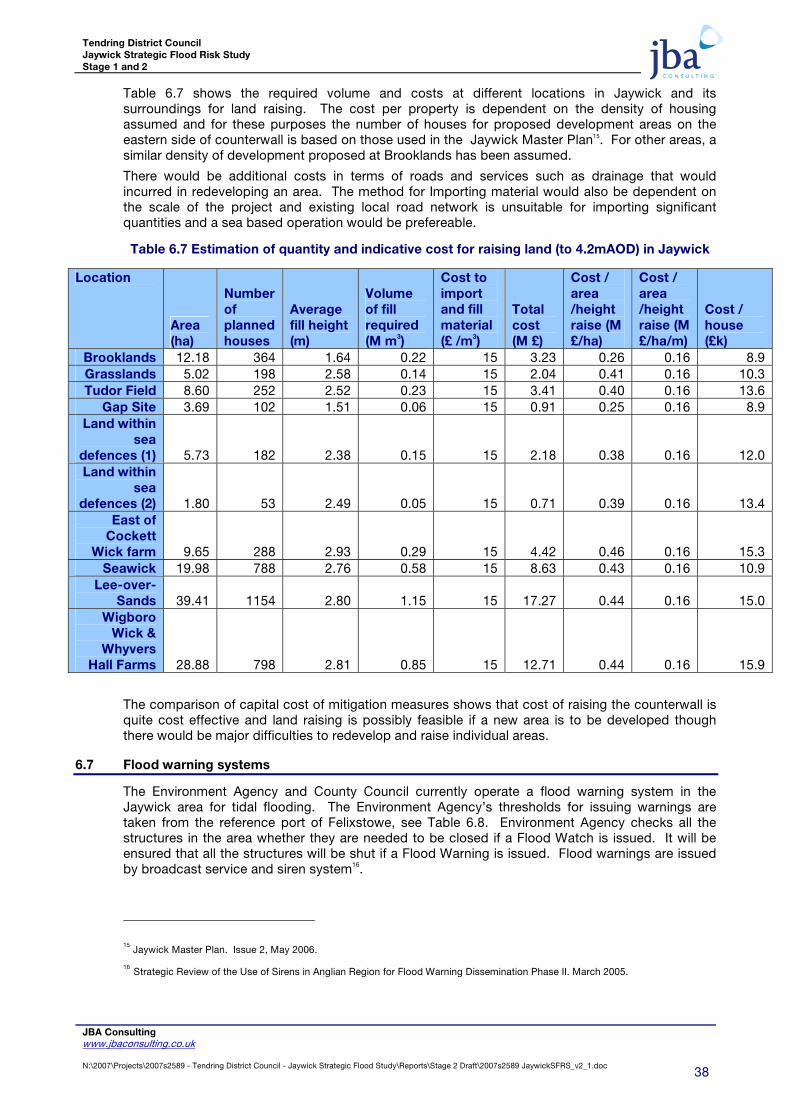
Tendring District Council Jaywick Strategic Flood Risk Study Stage 1 and 2
Table 6.7 shows the required volume and costs at different locations in Jaywick and its surroundings for land raising. The cost per property is dependent on the density of housing assumed and for these purposes the number of houses for proposed development areas on the eastern side of counterwall is based on those used in the Jaywick Master Plan15. For other areas, a similar density of development proposed at Brooklands has been assumed.
There would be additional costs in terms of roads and services such as drainage that would incurred in redeveloping an area. The method for Importing material would also be dependent on the scale of the project and existing local road network is unsuitable for importing significant quantities and a sea based operation would be prefereable.
Table 6.7 Estimation of quantity and indicative cost for raising land (to 4.2mAOD) in Jaywick
Location
Area (ha)
Number of planned houses
Average fill height (m)
Volume of fill required (M m3)
Cost to import and fill material (£ /m3)
Total cost (M £)
Cost / area /height raise (M £/ha)
Cost / area /height raise (M £/ha/m)
Cost / house (£k)
Brooklands 12.18 364 1.64 0.22 15 3.23 0.26 0.16 8.9 Grasslands 5.02 198 2.58 0.14 15 2.04 0.41 0.16 10.3 Tudor Field 8.60 252 2.52 0.23 15 3.41 0.40 0.16 13.6
Gap Site 3.69 102 1.51 0.06 15 0.91 0.25 0.16 8.9 Land within
sea defences (1) 5.73 182 2.38 0.15 15 2.18 0.38 0.16 12.0 Land within
sea defences (2) 1.80 53 2.49 0.05 15 0.71 0.39 0.16 13.4
East of Cockett
Wick farm 9.65 288 2.93 0.29 15 4.42 0.46 0.16 15.3 Seawick 19.98 788 2.76 0.58 15 8.63 0.43 0.16 10.9
Lee-over-Sands 39.41 1154 2.80 1.15 15 17.27 0.44 0.16 15.0
Wigboro Wick &
Whyvers Hall Farms 28.88 798 2.81 0.85 15 12.71 0.44 0.16 15.9
The comparison of capital cost of mitigation measures shows that cost of raising the counterwall is quite cost effective and land raising is possibly feasible if a new area is to be developed though there would be major difficulties to redevelop and raise individual areas.
6.7 Flood warning systems
The Environment Agency and County Council currently operate a flood warning system in the Jaywick area for tidal flooding. The Environment Agency’s thresholds for issuing warnings are taken from the reference port of Felixstowe, see . Environment Agency checks all the structures in the area whether they are needed to be closed if a Flood Watch is issued. It will be ensured that all the structures will be shut if a Flood Warning is issued. Flood warnings are issued by broadcast service and siren system16.
Table 6.8
15 Jaywick Master Plan. Issue 2, May 2006.
16 Strategic Review of the Use of Sirens in Anglian Region for Flood Warning Dissemination Phase II. March 2005.
JBA Consulting www.jbaconsulting.co.uk N:\2007\Projects\2007s2589 - Tendring District Council - Jaywick Strategic Flood Study\Reports\Stage 2 Draft\2007s2589 JaywickSFRS_v2_1.doc 38
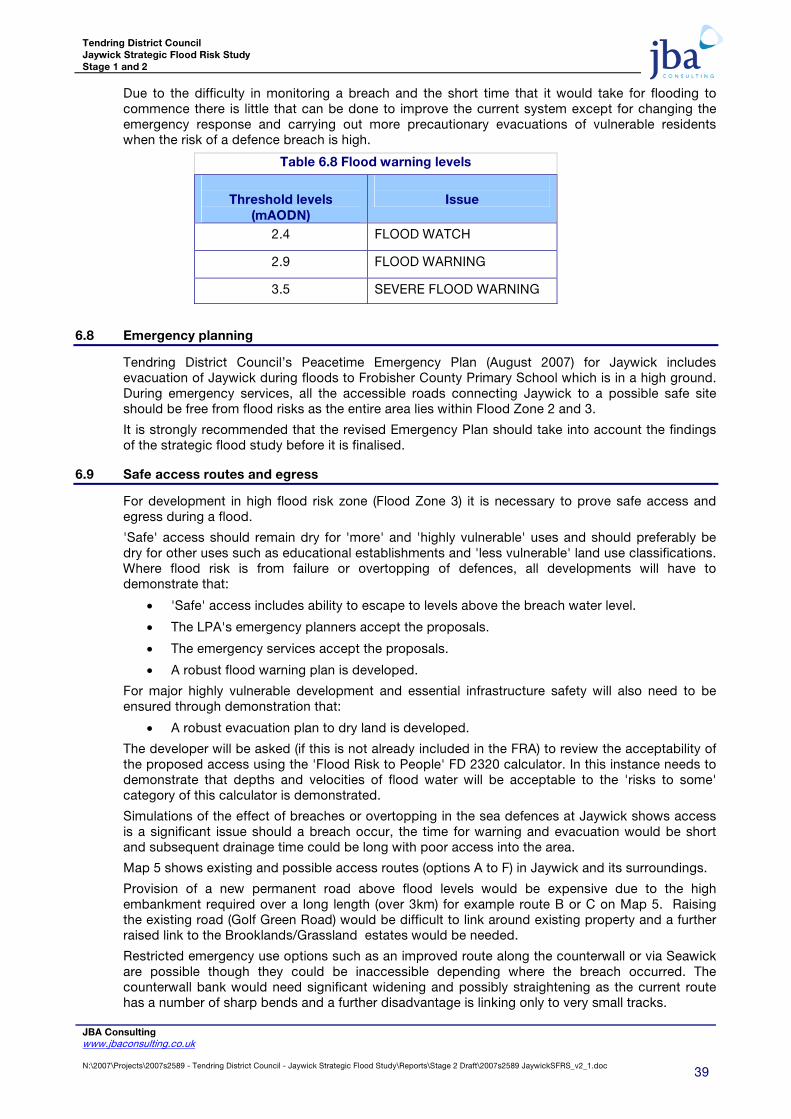
Tendring District Council Jaywick Strategic Flood Risk Study Stage 1 and 2
Due to the difficulty in monitoring a breach and the short time that it would take for flooding to commence there is little that can be done to improve the current system except for changing the emergency response and carrying out more precautionary evacuations of vulnerable residents when the risk of a defence breach is high.
Table 6.8 Flood warning levels
Threshold levels
(mAODN)
Issue
2.4 FLOOD WATCH
2.9 FLOOD WARNING
3.5 SEVERE FLOOD WARNING
6.8 Emergency planning
Tendring District Council’s Peacetime Emergency Plan (August 2007) for Jaywick includes evacuation of Jaywick during floods to Frobisher County Primary School which is in a high ground. During emergency services, all the accessible roads connecting Jaywick to a possible safe site should be free from flood risks as the entire area lies within Flood Zone 2 and 3.
It is strongly recommended that the revised Emergency Plan should take into account the findings of the strategic flood study before it is finalised.
6.9 Safe access routes and egress
For development in high flood risk zone (Flood Zone 3) it is necessary to prove safe access and egress during a flood.
'Safe' access should remain dry for 'more' and 'highly vulnerable' uses and should preferably be dry for other uses such as educational establishments and 'less vulnerable' land use classifications. Where flood risk is from failure or overtopping of defences, all developments will have to demonstrate that:
• 'Safe' access includes ability to escape to levels above the breach water level.
• The LPA's emergency planners accept the proposals.
• The emergency services accept the proposals.
• A robust flood warning plan is developed.
For major highly vulnerable development and essential infrastructure safety will also need to be ensured through demonstration that:
• A robust evacuation plan to dry land is developed.
The developer will be asked (if this is not already included in the FRA) to review the acceptability of the proposed access using the 'Flood Risk to People' FD 2320 calculator. In this instance needs to demonstrate that depths and velocities of flood water will be acceptable to the 'risks to some' category of this calculator is demonstrated.
Simulations of the effect of breaches or overtopping in the sea defences at Jaywick shows access is a significant issue should a breach occur, the time for warning and evacuation would be short and subsequent drainage time could be long with poor access into the area.
Map 5 shows existing and possible access routes (options A to F) in Jaywick and its surroundings.
Provision of a new permanent road above flood levels would be expensive due to the high embankment required over a long length (over 3km) for example route B or C on Map 5. Raising the existing road (Golf Green Road) would be difficult to link around existing property and a further raised link to the Brooklands/Grassland estates would be needed.
Restricted emergency use options such as an improved route along the counterwall or via Seawick are possible though they could be inaccessible depending where the breach occurred. The counterwall bank would need significant widening and possibly straightening as the current route has a number of sharp bends and a further disadvantage is linking only to very small tracks.
JBA Consulting www.jbaconsulting.co.uk N:\2007\Projects\2007s2589 - Tendring District Council - Jaywick Strategic Flood Study\Reports\Stage 2 Draft\2007s2589 JaywickSFRS_v2_1.doc 39
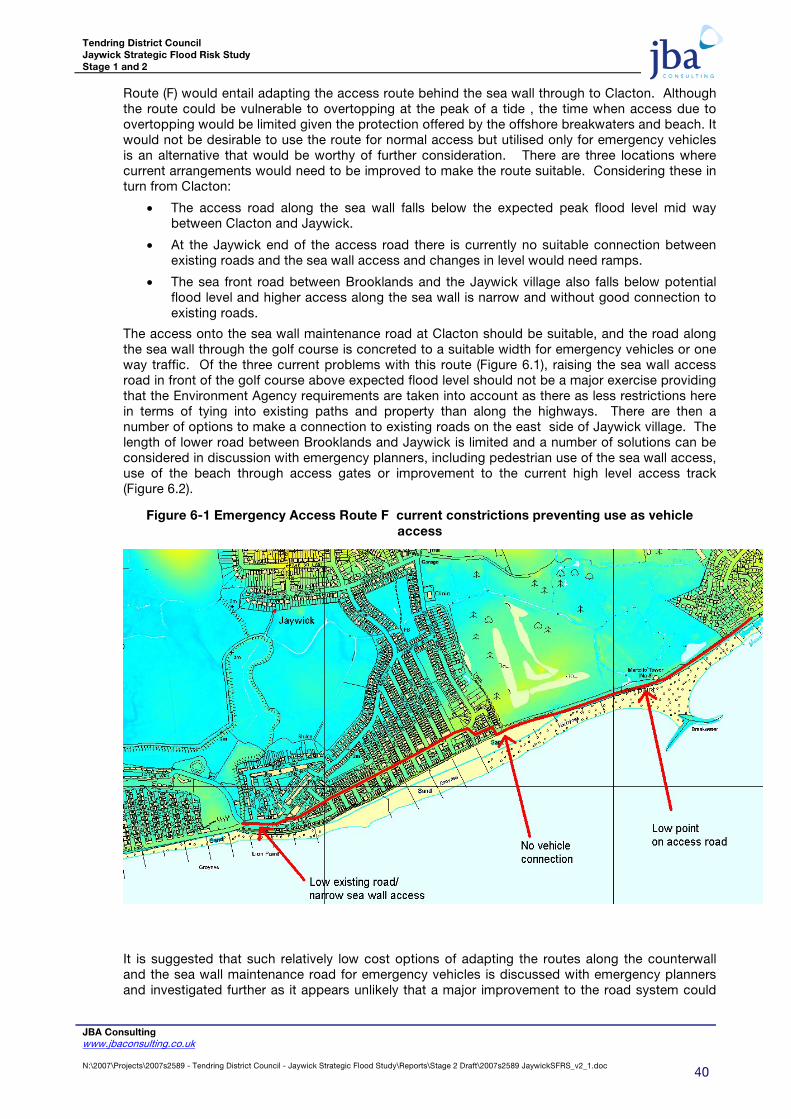
Tendring District Council Jaywick Strategic Flood Risk Study Stage 1 and 2
Route (F) would entail adapting the access route behind the sea wall through to Clacton. Although the route could be vulnerable to overtopping at the peak of a tide , the time when access due to overtopping would be limited given the protection offered by the offshore breakwaters and beach. It would not be desirable to use the route for normal access but utilised only for emergency vehicles is an alternative that would be worthy of further consideration. There are three locations where current arrangements would need to be improved to make the route suitable. Considering these in turn from Clacton:
• The access road along the sea wall falls below the expected peak flood level mid way between Clacton and Jaywick.
• At the Jaywick end of the access road there is currently no suitable connection between existing roads and the sea wall access and changes in level would need ramps.
• The sea front road between Brooklands and the Jaywick village also falls below potential flood level and higher access along the sea wall is narrow and without good connection to existing roads.
The access onto the sea wall maintenance road at Clacton should be suitable, and the road along the sea wall through the golf course is concreted to a suitable width for emergency vehicles or one way traffic. Of the three current problems with this route (Figure 6.1), raising the sea wall access road in front of the golf course above expected flood level should not be a major exercise providing that the Environment Agency requirements are taken into account as there as less restrictions here in terms of tying into existing paths and property than along the highways. There are then a number of options to make a connection to existing roads on the east side of Jaywick village. The length of lower road between Brooklands and Jaywick is limited and a number of solutions can be considered in discussion with emergency planners, including pedestrian use of the sea wall access, use of the beach through access gates or improvement to the current high level access track (Figure 6.2).
Figure 6-1 Emergency Access Route F current constrictions preventing use as vehicle access
It is suggested that such relatively low cost options of adapting the routes along the counterwall and the sea wall maintenance road for emergency vehicles is discussed with emergency planners and investigated further as it appears unlikely that a major improvement to the road system could
JBA Consulting www.jbaconsulting.co.uk N:\2007\Projects\2007s2589 - Tendring District Council - Jaywick Strategic Flood Study\Reports\Stage 2 Draft\2007s2589 JaywickSFRS_v2_1.doc 40
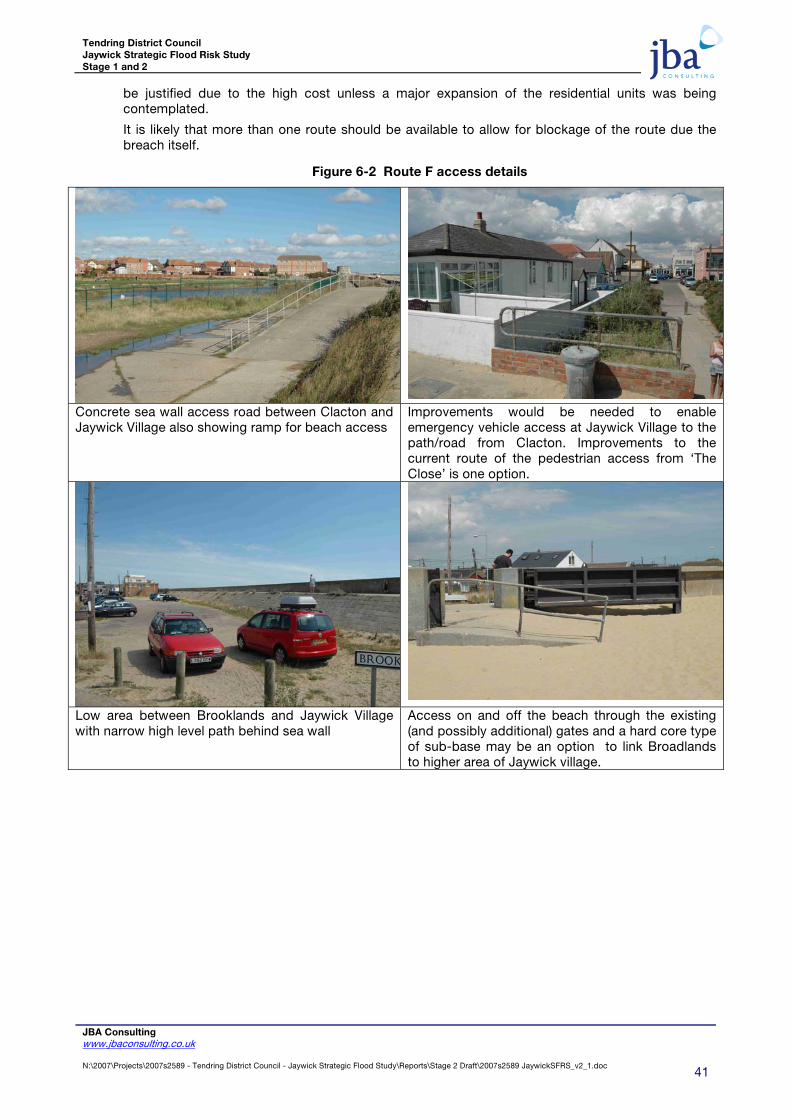
Tendring District Council Jaywick Strategic Flood Risk Study Stage 1 and 2
be justified due to the high cost unless a major expansion of the residential units was being contemplated.
It is likely that more than one route should be available to allow for blockage of the route due the breach itself.
Figure 6-2 Route F access details
Concrete sea wall access road between Clacton and Jaywick Village also showing ramp for beach access
Improvements would be needed to enable emergency vehicle access at Jaywick Village to the path/road from Clacton. Improvements to the current route of the pedestrian access from ‘The Close’ is one option.
Low area between Brooklands and Jaywick Village with narrow high level path behind sea wall
Access on and off the beach through the existing (and possibly additional) gates and a hard core type of sub-base may be an option to link Broadlands to higher area of Jaywick village.
JBA Consulting www.jbaconsulting.co.uk N:\2007\Projects\2007s2589 - Tendring District Council - Jaywick Strategic Flood Study\Reports\Stage 2 Draft\2007s2589 JaywickSFRS_v2_1.doc 41

Tendring District Council Jaywick Strategic Flood Risk Study Stage 1 and 2
7 CONCLUSIONS
7.1 Flood Risks
The strategic flood risk study has shown that the whole coastal part of Jaywick is within the high flood risk zone (FZ3). Though the area is currently defended to a high standard, behind the sea walls there remains a residual flood risk of high hazard to lower lying areas of Jaywick that will increase markedly over time due to sea level rise (current defences could be overtopped at the reference 200 year storm 50-75 years in future).
Mitigation measures could reduce the impact of flooding or increase the ability of people affected but these are potentially costly. Raising of the counterwall is likely to be needed to protect the area from a breach of the long length of sea wall to the west in which a breach failure is more likely. There is one existing sluiced opening through the counterwall that would provide some relief if a failure occurred on the Jaywick side though additional sluices have only a small further impact.
Plans for precautionary evacuation of all caravan sites within the floodplain, the Grassland area and lower parts of Brooklands should be considered further due to the high hazards predicted should a sea wall failure occur on a significant tidal surge.
7.2 Planning Implications
Under PPS25 the area should not be selected for new development unless the Exception test can be passed. Under the Exception test of PPS25 any redevelopment needs to be shown to be safe for the life of the development. The higher ground such as in parts of Brooklands should be favoured for siting of more vulnerable development such as health facilities and housing. New development should not increase the overall flood risk. Raising land is a possibility but has significant cost implications and practical difficulties close to existing developments. Improvements to planning for emergency access and egress following a breach will be needed.
JBA Consulting www.jbaconsulting.co.uk N:\2007\Projects\2007s2589 - Tendring District Council - Jaywick Strategic Flood Study\Reports\Stage 2 Draft\2007s2589 JaywickSFRS_v2_1.doc 42

Tendring District Council Jaywick Strategic Flood Risk Study Stage 1 and 2
MAPS
JBA Consulting www.jbaconsulting.co.uk N:\2007\Projects\2007s2589 - Tendring District Council - Jaywick Strategic Flood Study\Reports\Stage 2 Draft\2007s2589 JaywickSFRS_v2_1.doc 43

Tendring District Council Jaywick Strategic Flood Risk Study Stage 1 and 2
This page is intentionally left blank.
JBA Consulting www.jbaconsulting.co.uk N:\2007\Projects\2007s2589 - Tendring District Council - Jaywick Strategic Flood Study\Reports\Stage 2 Draft\2007s2589 JaywickSFRS_v2_1.doc 44

Tendring District Council Jaywick Strategic Flood Risk Study Stage 1 and 2
APPENDICES
JBA Consulting www.jbaconsulting.co.uk N:\2007\Projects\2007s2589 - Tendring District Council - Jaywick Strategic Flood Study\Reports\Stage 2 Draft\2007s2589 JaywickSFRS_v2_1.doc 45

Tendring District Council Jaywick Strategic Flood Risk Study Stage 1 and 2
This page is intentionally left blank.
JBA Consulting www.jbaconsulting.co.uk N:\2007\Projects\2007s2589 - Tendring District Council - Jaywick Strategic Flood Study\Reports\Stage 2 Draft\2007s2589 JaywickSFRS_v2_1.doc 46

Tendring District Council Jaywick Strategic Flood Risk Study Stage 1 and 2
Appendix A: - Hazards at Specified Sites
JBA Consulting www.jbaconsulting.co.uk N:\2007\Projects\2007s2589 - Tendring District Council - Jaywick Strategic Flood Study\Reports\Stage 2 Draft\2007s2589 JaywickSFRS_v2_1.doc 47

Tendring District Council Jaywick Strategic Flood Risk Study Stage 1 and 2
This page is intentionally left blank.
JBA Consulting www.jbaconsulting.co.uk N:\2007\Projects\2007s2589 - Tendring District Council - Jaywick Strategic Flood Study\Reports\Stage 2 Draft\2007s2589 JaywickSFRS_v2_1.doc 48

Tendring District Council Jaywick Strategic Flood Risk Study Stage 1 and 2
JBA Consulting
Appendix B: - Contents of animation CD
www.jbaconsulting.co.uk N:\2007\Projects\2007s2589 - Tendring District Council - Jaywick Strategic Flood Study\Reports\Stage 2 Draft\2007s2589 JaywickSFRS_v2_1.doc 49

Tendring District Council Jaywick Strategic Flood Risk Study Stage 1 and 2
This page is intentionally left blank.
JBA Consulting www.jbaconsulting.co.uk N:\2007\Projects\2007s2589 - Tendring District Council - Jaywick Strategic Flood Study\Reports\Stage 2 Draft\2007s2589 JaywickSFRS_v2_1.doc 50

Tendring District Council Jaywick Strategic Flood Risk Study Stage 1 and 2
B.1.1 Contents
The attached CD contains animations of flooding for breaches at the following locations:
Breach 1 – sea wall in Brooklands near to Martello Tower
Breach 2 - soft coastal defence in Seawick to Colne Point (Lee-over-Sands)
Breach 3 - soft estuarine defence in Colne Point and Point Clear
These animations were made to assist in presentation of the results of the 2D modelling but do not replace the description on the modelling report. For present conditions no clear water overtopping is expected but by 2107 overtopping alone causes major flooding for current seawall elevation for 200 year surge.
Breaches For the Existing Conditions: a) Current 0.5% annual probability event
Breach 1 Water depth: Depth 200yr Breach1 20m.avi Breach 1 Flood Hazard Hazard 200yr Breach1 20m.avi Breach 2 Water depth Depth 200yr Breach2 60m.avi Breach 2 Flood Hazard Hazard 200yr Breach2 60m.avi
Breach 3 Water depth Depth 200yr Breach3 60m.avi Breach 3 Flood Hazard Hazard 200yr Breach3 60m.avi b) Current 0.1% annual probability event
Breach 1 Water depth Depth 1000yr Breach1 20m.avi Breach 1 Flood Hazard Hazard 1000yr Breach1 20m.avi Breach 2 Water depth Depth 1000yr Breach2 60m.avi Breach 2 Flood Hazard Hazard 1000yr Breach2 60m.avi
Breach 3 Water depth Depth 1000yr Breach3 60m.avi Breach 3 Flood Hazard Hazard 1000yr Breach3 60m.avi
Future 0.5% annual probability (Year 2107) event including the effect of climate change Overtopping Water depth Depth 200yr overtopping (2107).avi Overtopping Flood Hazard Hazard 200yr overtopping (2107).avi
JBA Consulting www.jbaconsulting.co.uk N:\2007\Projects\2007s2589 - Tendring District Council - Jaywick Strategic Flood Study\Reports\Stage 2 Draft\2007s2589 JaywickSFRS_v2_1.doc: 20/05/2008 A-1

Tendring District Council Jaywick Strategic Flood Risk Study Stage 1 and 2
This page is intentionally left blank.
JBA Consulting www.jbaconsulting.co.uk N:\2007\Projects\2007s2589 - Tendring District Council - Jaywick Strategic Flood Study\Reports\Stage 2 Draft\2007s2589 JaywickSFRS_v2_1.doc C-1

Tendring District Council Jaywick Strategic Flood Risk Study Stage 1 and 2
Appendix C: - The project Brief
JBA Consulting www.jbaconsulting.co.uk N:\2007\Projects\2007s2589 - Tendring District Council - Jaywick Strategic Flood Study\Reports\Stage 2 Draft\2007s2589 JaywickSFRS_v2_1.doc C-2

Tendring District Council Jaywick Strategic Flood Risk Study Stage 1 and 2
This page is intentionally left blank
JBA Consulting www.jbaconsulting.co.uk N:\2007\Projects\2007s2589 - Tendring District Council - Jaywick Strategic Flood Study\Reports\Stage 2 Draft\2007s2589 JaywickSFRS_v2_1.doc C-3

Tendring District Council Jaywick Strategic Flood Risk Study Stage 1 and 2
JAYWICK – STRATEGIC FLOOD STUDY PURPOSE The purpose of this study is to inform the development of a sound and robust Regeneration Framework for the area. This Regeneration Framework must relate to the emerging Tendring Draft Replacement Local Plan (subject to Inspector’s comments, anticipated Autumn 2007) and provide a comprehensive basis for future development control decisions within the area, and will underpin the forthcoming Area Action Plan for the renewal of Jaywick. It must deliver the following outputs: 1. Define the existing level of flood risk across the area; 2. Identify and quantify the potential level of risk (with existing/planned defences) taking into account climate change;
and 3. Articulate the implications of this potential risk for regeneration and greenfield development options:
(a) in terms of the level of risk applying to the various areas/sites (and with defences maintained as they are); and (b) in terms of what additional defences would be required to achieve an acceptable level of risk for the different areas/sites, and the cost implications.
The client appreciates that 3(b) in this sequence deviates from what may or may not be acceptable in policy (PPS25) terms. However because this study will inform the policy decisions that need to be made in the light of PPS25 and other considerations a clear idea of current/future risks and the feasibility/costs of mitigation is required. All the possibilities for regenerating Jaywick need to be fully explored, however whilst in principle much of the land around Jaywick may be capable of being defended to a sufficient standard for development to proceed, in reality this would in some cases be at enormous cost (both financial and environmental) and in direct conflict with national policy objectives. The study therefore needs to be clear about the extent of these costs and conflicts so that the decisions of the agencies are informed by awareness of all the options and the associated implications. APPROACH The client requires a 2 stage approach to be adopted to complete this study. Discussions will be held with the client at the completion of stage 1 so that the results can be used to inform and agree the sites to be chosen for further consideration at stage 2. Stage 1 – Scoping potential areas/sites. Scoping all of the target area in order to quantify the risk to all potential renewal/redevelopment sites. This stage will most likely eliminate some sites/areas that are clearly impractical based on criteria to be discussed with the client, thereby identifying possible sites/areas where renewal/regeneration is reasonably likely. This initial scoping stage must be robust and demonstrate that any eliminations of unlikely sites are sound, looking at all options for regeneration, not just those generated by the Llewelyn Davies Yeang (LDY) study. It is important to note that eliminations should not be solely on the basis of PPS25. To be able to fully evaluate the regeneration possibilities for Jaywick the client wishes to see a broad range of possibilities explored, some of which may involve exceptions to current national policy. Stage 2 - Possible Regeneration Sites. Following a meeting with the client to review the findings of stage 1 and agree the sites to be investigated at stage 2, stage 2 consists of identifying and quantifying the potential protection and mitigation measures that will be needed at these possible sites. – it will look more fully at the level of risk, development prospects and potential mitigation measures & costs associated with these sites.
JBA Consulting www.jbaconsulting.co.uk N:\2007\Projects\2007s2589 - Tendring District Council - Jaywick Strategic Flood Study\Reports\Stage 2 Draft\2007s2589 JaywickSFRS_v2_1.doc C-4
Tendring District Council Jaywick Strategic Flood Risk Study Stage 1 and 2
BACKGROUND Regeneration of the Brooklands and Grasslands areas of Jaywick is under consideration for a number of social reasons. However, the location, nature and quality of the existing settlements are such that they are extremely vulnerable if exposed to overtopping or breaching of the existing flood defences and this constraint needs to be explored fully in identifying and costing regeneration options. It is the aim of this study to provide the necessary data and interpretation to enable all regeneration options (both those already established by the previous LDY work and any future options) to be fully evaluated in terms of the hazard and risk of flooding. It is therefore required for the study to provide baseline data to facilitate the best understanding of the nature of flood risk over the next 100 years at any point within the coastal floodplain (Flood zones 2 & 3) which includes Jaywick. To further identify and quantify the degree of flood hazard that exists over a range of locations within the coastal flood plain which includes Jaywick, and its environments. This information will be used to help identify options for the safe, sustainable regeneration of the Brooklands and Grasslands areas of Jaywick, taking into account the latest Government guidance on climate change and sea level rise as described in Planning Policy Statement 25 (PPS25). The study will determine the time-variant nature of flood hazard and the likely duration of safe access and egress to potential development areas. This will enable emergency planning to be fully undertaken and community resilience to flood incidents to be determined. It will further be assessed to identify those existing regeneration options that can be located, designed and managed to be safe for the lifetime of the development, and identify any other areas that are reasonably practicable to develop or regenerate to be safe by location, design and management. It will further include an outline justification for the potential flood protection and mitigation steps that will be required to ensure the regeneration options and locations can be safe by design and management. SCOPE It will be necessary for the regeneration options to be demonstrated as being safe, through the flood study, for the 100 year lifetime of the development allowing for climate change. The study will therefore: i) take into account the standard and effectiveness of existing flood and coastal defences, including taking account of currently planned schemes, with reference to the forecast 0.5% annual probability tidal flood level and the 0.1% extreme tidal flood level for the 100 year design life of the development. The forecast effects will include those recommended contingency allowances for sea level rise as stated in PPS25; ii) determine and report the existing flood risk for the study area and the future level of risk for the area, taking account of climate change and the currently planned defence scheme, iii) undertake and present simulations of flood hazard through scenarios of both defence overtopping and defence breaching (building on the simple flood study carried out in 2006 by WSP Consultants and including cumulative effect of combined overtopping and breach scenarios, as appropriate), using advanced ground terrain and time variant modelling representation to replicate the nature and rate of flood water propagation into the coastal floodplain in such events. (The study will consider the effects of existing secondary defences in the floodplain. It will, as necessary to maximise the opportunities for safe regeneration, consider the benefits or disbenefits of options such as removing the counterwall completely, raising and widening the counterwall, a retired line of secondary defence (particularly for the scenario of future development north of Jaywick Ditch) and the removal of minor relic floodbanks from the rear of Brooklands/Grasslands. The balance of the flood hazard to other settlements within this coastal flood compartment should be assessed with each modification of secondary defences within the flood compartment). iv) employ two dimensional flood modelling to simulate flood flow pathways, depths, velocities and duration. v) use the modelled outputs to identify flood propagation routes within the coastal floodplain and determine the duration of safe access and egress to and from a range of localities within the coastal floodplain. vi) identify opportunities for new facilities to improve access and egress to and from the identified areas during flood conditions (including the provision of access and egress for the emergency services). vii) identify the likelihood of defence failure in the event of overtopping and the opportunities for further secondary defences within the coastal floodplain. viii) have regard to the following guiding principles in respect of safety:
• The safety of people within the buildings.
JBA Consulting www.jbaconsulting.co.uk N:\2007\Projects\2007s2589 - Tendring District Council - Jaywick Strategic Flood Study\Reports\Stage 2 Draft\2007s2589 JaywickSFRS_v2_1.doc C-5
Tendring District Council Jaywick Strategic Flood Risk Study Stage 1 and 2
• The safety of the buildings themselves i.e. the resistance to collapse when subject to the force and pressure of floodwater
• The ability of people to safely access and exit the buildings - references to identifying what is "safe" and defining "safe access and egress" shall relate to the Flood Hazard guidance provided in the DEFRA/EA R&D publication "FD2320/TR2 - Flood Risks Assessment Guidance for New Development" with specific regard to Section 13.7.2 and Table 13.1. http://www.defra.gov.uk/science/Project_Data/DocumentLibrary/FD2320/FD2320_3364_TRP.pdf
• The ability of the emergency services to evacuate or rescue people from the buildings in both the 0.5%
annual probability (including climate change adjustments) and other extreme events exceeding this probability up to the 0.1% annual probability flood.
The above principles need to be considered and assessed with respect to the source and nature of a potential flood event. Additionally, the flooding characteristics derived for each location through both overtopping and breach assessments should be applied to the safety criteria to assess hazards to people and buildings in such events.
ix) using the outputs from the foregoing steps, identify those existing regeneration options that can be located, designed and managed to be safe for the lifetime of the development, and identify any other areas that are reasonably practicable to develop or regenerate to be safe by location, design and management. The study will explain the reasons why any locations are deemed unsuitable for development or regeneration. x) with regard to part ix) above, include an outline justification for the potential flood protection and mitigation measures that will be required to ensure the regeneration options and locations can be safe by design and management. The study will produce indicative costs for the protection and mitigation measures that are required, and outline any potential technical or environmental constraints to the introduction of the aforementioned measures. In order to enable full consideration of the potential hazards of flooding in this regeneration area and those other locations within the vicinity of the regeneration area for which the flood hazard may be affected by the regeneration, the analysis shall consider the following locations, also identified on map annex a: i) Existing Brooklands development, ii) Existing Grasslands development, iii) Existing Tudor Estate, iv) Tudor Fields (to rear of Brooklands/Grasslands) and close to Jaywick ditch, v) Area to the north of Jaywick ditch and towards Jaywick Sewage Treatment Works (to east of Cockett Wick
Farm), vi) Existing Seawick development, vii) Central St Osyth Marsh and Lee-over-Sands, viii) North St Osyth Marsh to Wigboro Wick and Whyvers Hall Farms. The study shall consider breaches at the following locations for each return period event: i) Breach of hard defence – Brooklands wall, ii) Breach of coastal embanked defence – Seawick to Colne Point (Lee-over- Sands), iii) Breach of estuarine defences between Colne Point and Point Clear. The study shall consider overtopping for each return period event, at locations determined and justified by the analysis of local data and which can be shown to be reasonable and representative. It will also include the cumulative effect of combined overtopping and breach scenarios, as appropriate. Overall Assessment For each breach or overtopping scenario, the study will consider each location. The results shall be expressed by reference to the time taken from commencement of the flood incident to the location's inundation, the peak depth of floodwater inundation, and the relative hazard level in the propagation of floodwaters to the location. The duration of safe access/egress to each location from the commencement of the flood incident shall be reported. The duration of unsafe conditions in and around the location will also be reported. Conclusions The study will assess the foregoing outputs to evaluate the benefits and disbenefits of each location with regard to overall flood hazard. It will rank order upon hazard the locations for each scenario. It will identify those existing
JBA Consulting www.jbaconsulting.co.uk N:\2007\Projects\2007s2589 - Tendring District Council - Jaywick Strategic Flood Study\Reports\Stage 2 Draft\2007s2589 JaywickSFRS_v2_1.doc C-6
Tendring District Council Jaywick Strategic Flood Risk Study Stage 1 and 2
regeneration options that can be located, designed and managed to be safe for the lifetime of the development. It will also identify any additional areas that are reasonably practicable to develop or regenerate to be safe by way of location, design and management. It should therefore, as appropriate, include recommendations for the further reduction of the hazard or risk of flooding based on findings made during the study. To assist further consideration of the existing regeneration options, the study will determine those locations for which prior evacuation will be the only safe option for the community in extreme flood scenarios. It will also identify those locations that may have safe access/egress available for significant duration of time from the onset of flooding. To assist with interpretation of the data, it will present clear visual hazard mapping including modelled animations. To further facilitate the interpretation of the data with regard to determining the safety and sustainability of development options over the life of the development, and to aid comparison between future and current hazard levels, the study shall present the hazard scenarios as they appear now and as they appear at 100 years (including climate change allowances). The study report will include a non-technical summary paper, supported by necessary illustrations, designed to enable the communication of the outcome of the analysis to a non-technical audience. The Consultants will be required to make a formal presentation to representatives of the key stakeholders on completion of the consultancy. .
JBA Consulting www.jbaconsulting.co.uk N:\2007\Projects\2007s2589 - Tendring District Council - Jaywick Strategic Flood Study\Reports\Stage 2 Draft\2007s2589 JaywickSFRS_v2_1.doc C-7

Tendring District Council Jaywick Strategic Flood Risk Study Stage 1 and 2
Appendix D: - Beach Profiles
JBA Consulting www.jbaconsulting.co.uk N:\2007\Projects\2007s2589 - Tendring District Council - Jaywick Strategic Flood Study\Reports\Stage 2 Draft\2007s2589 JaywickSFRS_v2_1.doc C-8

Tendring District Council Jaywick Strategic Flood Risk Study Stage 1 and 2
JBA Consulting www.jbaconsulting.co.uk N:\2007\Projects\2007s2589 - Tendring District Council - Jaywick Strategic Flood Study\Reports\Stage 2 Draft\2007s2589 JaywickSFRS_v2_1.doc C-9
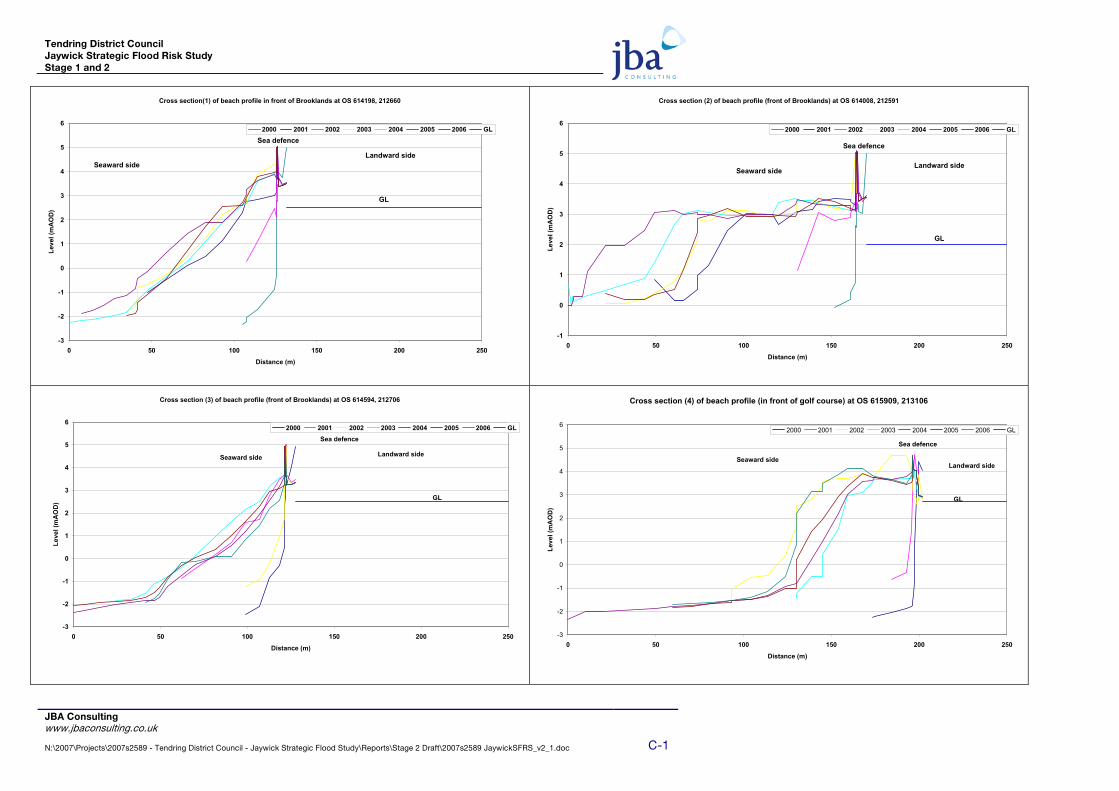
Tendring District Council Jaywick Strategic Flood Risk Study Stage 1 and 2
Cross section(1) of beach profile in front of Brooklands at OS 614198, 212660
-3
-2
-1
0
1
2
3
4
5
6
0 50 100 150 200 250
Distance (m)
Leve
l (m
AO
D)
2000 2001 2002 2003 2004 2005 2006 GL
Seaward sideLandward side
Sea defence
GL
Cross section (2) of beach profile (front of Brooklands) at OS 614008, 212591
-1
0
1
2
3
4
5
6
0 50 100 150 200 250
Distance (m)
Leve
l (m
AO
D)
2000 2001 2002 2003 2004 2005 2006 GL
Seaward sideLandward side
Sea defence
GL
Cross section (3) of beach profile (front of Brooklands) at OS 614594, 212706
-3
-2
-1
0
1
2
3
4
5
6
0 50 100 150 200 250
Distance (m)
Leve
l (m
AO
D)
2000 2001 2002 2003 2004 2005 2006 GL
Seaward side Landward side
Sea defence
GL
Cross section (4) of beach profile (in front of golf course) at OS 615909, 213106
-3
-2
-1
0
1
2
3
4
5
6
0 50 100 150 200 250
Distance (m)
Leve
l (m
AO
D)
2000 2001 2002 2003 2004 2005 2006 GL
Seaward side
Sea defence
Landward side
GL
JBA Consulting www.jbaconsulting.co.uk N:\2007\Projects\2007s2589 - Tendring District Council - Jaywick Strategic Flood Study\Reports\Stage 2 Draft\2007s2589 JaywickSFRS_v2_1.doc C-1
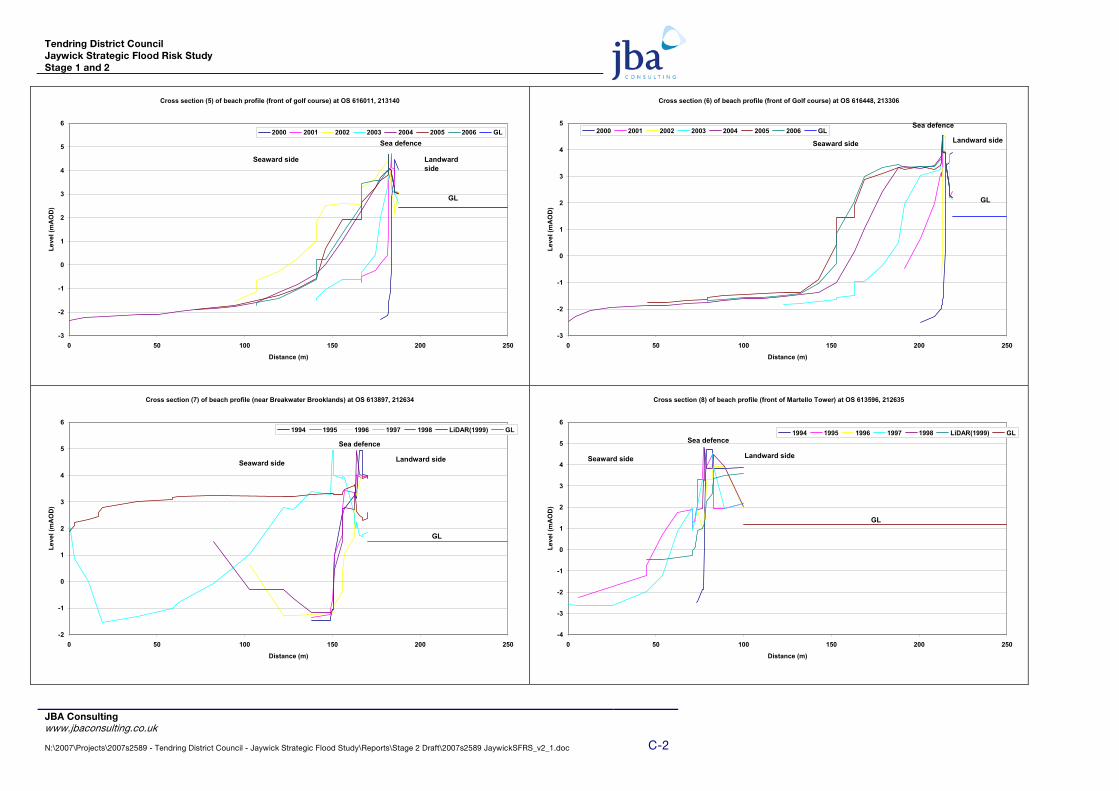
Tendring District Council Jaywick Strategic Flood Risk Study Stage 1 and 2
Cross section (5) of beach profile (front of golf course) at OS 616011, 213140
-3
-2
-1
0
1
2
3
4
5
6
0 50 100 150 200 250
Distance (m)
Leve
l (m
AO
D)
2000 2001 2002 2003 2004 2005 2006 GL
Seaward side Landward side
Sea defence
GL
Cross section (6) of beach profile (front of Golf course) at OS 616448, 213306
-3
-2
-1
0
1
2
3
4
5
0 50 100 150 200 250
Distance (m)
Leve
l (m
AO
D)
2000 2001 2002 2003 2004 2005 2006 GL
Seaward side Landward side
Sea defence
GL
Cross section (7) of beach profile (near Breakwater Brooklands) at OS 613897, 212634
-2
-1
0
1
2
3
4
5
6
0 50 100 150 200 250
Distance (m)
Leve
l (m
AO
D)
1994 1995 1996 1997 1998 LiDAR(1999) GL
Seaward side Landward side
Sea defence
GL
Cross section (8) of beach profile (front of Martello Tower) at OS 613596, 212635
-4
-3
-2
-1
0
1
2
3
4
5
6
0 50 100 150 200 250
Distance (m)
Leve
l (m
AO
D)
1994 1995 1996 1997 1998 LiDAR(1999) GL
Seaward side Landward side
Sea defence
GL
JBA Consulting www.jbaconsulting.co.uk N:\2007\Projects\2007s2589 - Tendring District Council - Jaywick Strategic Flood Study\Reports\Stage 2 Draft\2007s2589 JaywickSFRS_v2_1.doc C-2
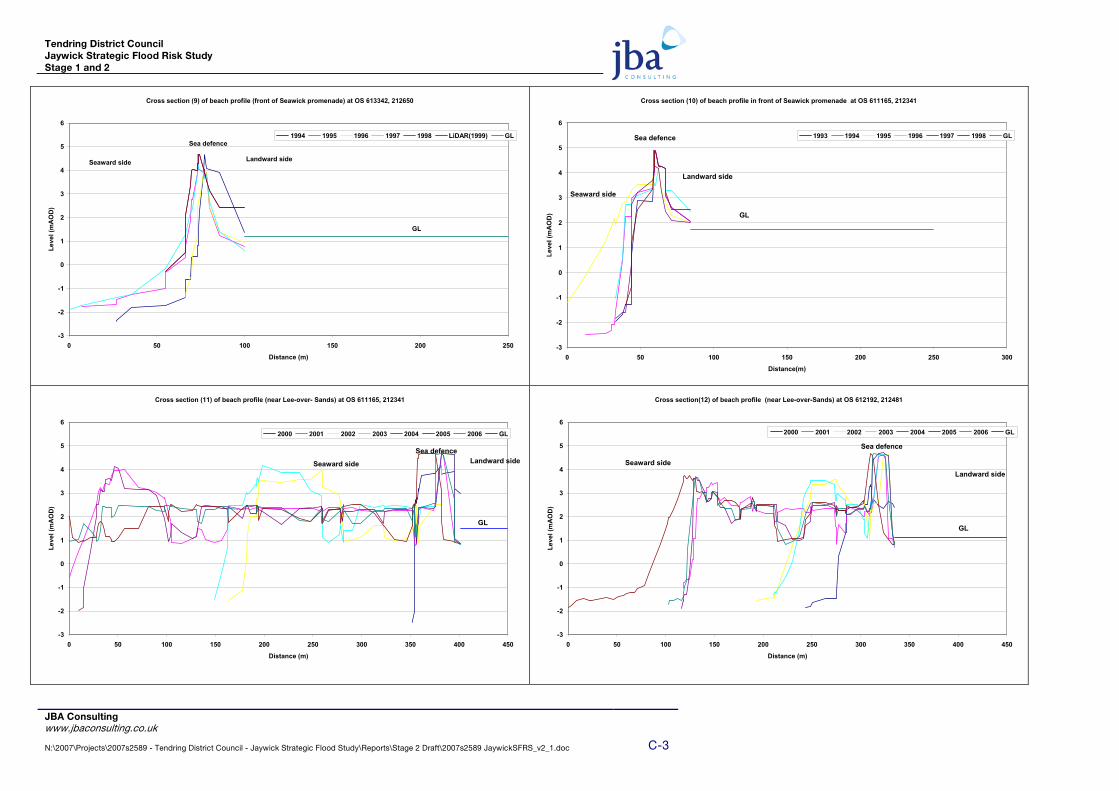
Tendring District Council Jaywick Strategic Flood Risk Study Stage 1 and 2
Cross section (9) of beach profile (front of Seawick promenade) at OS 613342, 212650
-3
-2
-1
0
1
2
3
4
5
6
0 50 100 150 200 250
Distance (m)
Leve
l (m
AO
D)
1994 1995 1996 1997 1998 LiDAR(1999) GL
Seaward side Landward side
Sea defence
GL
Cross section (10) of beach profile in front of Seawick promenade at OS 611165, 212341
-3
-2
-1
0
1
2
3
4
5
6
0 50 100 150 200 250 300
Distance(m)
Leve
l (m
AO
D)
1993 1994 1995 1996 1997 1998 GL
Seaward side
Landward side
Sea defence
GL
Cross section (11) of beach profile (near Lee-over- Sands) at OS 611165, 212341
-3
-2
-1
0
1
2
3
4
5
6
0 50 100 150 200 250 300 350 400 450
Distance (m)
Leve
l (m
AO
D)
2000 2001 2002 2003 2004 2005 2006 GL
Seaward side Landward sideSea defence
GL
Cross section(12) of beach profile (near Lee-over-Sands) at OS 612192, 212481
-3
-2
-1
0
1
2
3
4
5
6
0 50 100 150 200 250 300 350 400 450
Distance (m)
Leve
l (m
AO
D)
2000 2001 2002 2003 2004 2005 2006 GL
Seaward sideLandward side
Sea defence
GL
JBA Consulting www.jbaconsulting.co.uk N:\2007\Projects\2007s2589 - Tendring District Council - Jaywick Strategic Flood Study\Reports\Stage 2 Draft\2007s2589 JaywickSFRS_v2_1.doc C-3

Tendring District Council Jaywick Strategic Flood Risk Study Stage 1 and 2
Cross section (13) of beach profile ( near Lion Point) at OS 614785, 212759
-3
-2
-1
0
1
2
3
4
5
6
0 50 100 150 200 250
Distance (m)
Leve
l (m
AO
D)
2000 2001 2002 2003
2004 2005 2006 GL
Seaward side
Landward side
Sea defence
GL
Cross section (14) of beach profile (near Lion Point - front of Jaywick) at OS 614879, 212783
-4
-3
-2
-1
0
1
2
3
4
5
6
0 50 100 150 200 250
Distance (m)
Gro
und
leve
l (m
AO
D)
2000 2001 2002 2003 2004 2005 2006 GL
Seaward side
Landward side
Sea defence
GL
Cross section (15) of beach profile (in front of Jaywick village) at OS 615133, 212774
0
1
2
3
4
5
6
0 50 100 150 200 250
Distance (m)
Leve
l (m
AO
D)
2000 2001 2002 2003 2004 2005 2006 GL
Seaward side
Landward side
Sea defence
GL
Cross section (16) of beach profile (near Jaywick Village - Broadway) at OS 615408,212904
-3
-2
-1
0
1
2
3
4
5
6
0 50 100 150 200 250
Distance (m)
Leve
l (m
AO
D)
2000 2001 2002 2003 2004 2005 2006 GL
Seaward side Landward side
Sea defence
GL
JBA Consulting www.jbaconsulting.co.uk N:\2007\Projects\2007s2589 - Tendring District Council - Jaywick Strategic Flood Study\Reports\Stage 2 Draft\2007s2589 JaywickSFRS_v2_1.doc C-4

Tendring District Council Jaywick StrStage 1 and
JBA Consulting www.jbaco N:\2007\Project
ategic Flood Risk Study 2
nsulting.co.uk
s\2007s2589 - Tendring District Council - Jaywick Strategic Flood Study\Reports\Stage 2 Draft\2007s2589 JaywickSFRS_v2_1.doc C-5
Tendring District Council Jaywick Strategic Flood Risk Study Stage 1 and 2
JBA Consulting www.jbaconsulting.co.uk N:\2007\Projects\2007s2589 - Tendring District Council - Jaywick Strategic Flood Study\Reports\Stage 2 Draft\2007s2589 JaywickSFRS_v2_1.doc C-1
REFERENCES
References
1. Communities and Local Government. 2006 Planning Policy Statement 25: Development and Flood Risk, December 2006.
2. Defra/ Environment Agency. Use of Joint Probability Methods in Flood Management A guide to best practice. R&D Technical Report FD2308/TR2, March 2005.
3. Defra/Environment Agency. Flood Risk to People: Phase 2. R&D Report FD2321/TR1, 2006. 4. Defra/Environment Agency. Flood Risk Assessment Guidance for New Development. R&D Report
FD2320/TR2, 2006. 5. Environment Agency. Project Appraisal Report Post National Review group Issue, April 2006. 6. Environment Agency, Anglian Region Eastern and Central Areas Report of Extreme Tide Level. Report
completed by Royal Haskoning on behalf of the Environment Agency, February 2007. 7. Essex Shoreline Management Plan – Volume 3, Report prepared by Mouchel Consulting Limited on
behalf of Environment Agency, April 1997. 8. Flood and Coastal Defence Appraisal Guidance: FCDPAG3 Economic Appraisal. Supplementary Note
to Operating Authorities – Climate Change Impacts, October 2006. 9. Jaywick Agencies Group. Jaywick Regeneration Framework Llewelyn Davies Yeang in association with
Environment Trust Associates, Knight Frank and WSP, September 2006 10. Strategic Review of the Use of Sirens in Anglian Region for Flood Warning Dissemination Phase II,
March 2005. 11. Tendring District Replacement Local Plan Re-Deposit Draft, November 2005. 12. http://www.pol.ac.uk