Embed Size (px)
Citation preview

c
r Ten Steps to Effective Pollution Prevention
Robert W. Rittmeyer and Paula A. Comella
ny product generates waste during manufacturing. Cars. Medicine. Books. Bicycles. Tennis balls. Paints. Perfume. Furniture. Clothing. Pet A food. You might say that waste is our country’s gross national by-
product. But whether it occurs in the form of air emissions, discharges into water, or solid or hazardous substances that must be disposed of in some fashion, waste becomes a problem only if it is not properly managed. But where does effective waste management begin? In 1989, U.S. industry released more than 5.7 billion pounds of toxic pollutants into the environment, according to toxic chemical release reports under Title I11 of the Superfund Amendments and Reauthorization Act of 1986 (SARA). That was nearly triple EPA’s pollution estimates for that year. Nearly half the pollutants were emitted into the air, with the balance released into water or disposed of on land.
At the same time, industry has not been blind to the problem. Every year, U.S. companies spend almost $50 million in pollution control measures and equipment. Why, then, do waste emissions persist, and in such vast quantities?
Robert W. Rittmeyer is general manager of the Pittsburgh office of ENSR Consulting and Engineering. Paula A. Comella is a senior marketing writer at the same firm. They are primary contributing author and an editor, respectively, of the National Association of Manufacturers’ publication Waste Minimization: Manufacturers’ Strategies for Success.
TRADITIONAL WASTE MANAGEMENT: END-OF-PIPE APPROACH Traditionally, the focus for managing and regulating waste has been nearly
exclusively on the “end-of-pipe” method. This approach to waste manage- ment treats waste after it has been generated, at the point where the waste is released to the air, water, or land. Although this approach is widespread, and certainly successful in many cases, the end-of-pipe method of pollution control has two principal drawbacks.
First, the end-of-pipe approach does not necessarily destroy a waste, nor is it always a permanent solution. Frequently, this “after the fact” technique succeeds merely in moving a pollutant from one medium to another, from air to water to land and so forth. In addition, although waste treatment may eliminate certain harmful characteristics of a waste, there is no guarantee that the remaining waste will be environmentally acceptable. In fact, treatment may actually exacerbate the risk to human health and the environment.
A second major limitation of “end-of-pipe” treatment is that it is hardly an integrated approach to waste management. If companies concentrate prima- rily on treating a waste only after the fact, once it has already been produced, they are, in effect, accepting waste generation as the status quo. Consequently, these companies may have little initiative to explore the full range of possibilities for waste reduction, even though these opportunities may abound during routine procedengineering operations. Unfortunately some com-
IOURNAL OF ENVIRONMENTAL REGULATION/ WINTER 2992-92 203
~ O B E R T W. R ~ M E Y E R AND PAULA A. COMELLA
panies have the opinion that pollution prevention activities may increase their operating costs, thus reducing their profits and affecting their competitive advantage. Furthermore, waste reduction opportunities may involve not only hazardous wastes, but also solid wastes, “industrial trash,” wastewater, and atmospheric emissions. Unfortunately, chances for waste reduction can be easily overlooked if companies view wastes as the necessary and inevitable by- products of the manufacturing process.
THE NEW MEW: PREVENT WMTE IN THE FIRST PLACE New regulations have caused more companies to take another look at
pollution prevention and understand its place in their operations. Pollution prevention programs address all releases to air, water, and land of all environmentally significant materials, including:
State-listed hazardous wastes SARA Title I11 Section 313 reportable chemicals Solid waste, including industrial wastes produced during the manufac- turing process and industrial “trash” (e.g., boxes and packing materials)
In passing the Pollution Prevention Act of 1990, Congress made an effort to control the existing waste management crisis. The Act constitutes a fundamental shift in the views and methodologies that have historically dominated waste management. Essentially, pollution prevention shifts the waste management emphasis from treating waste after the fact to preventing waste generation in the first place. Additionally, pollution prevention aims to reduce the quantity and toxicity of multimedia wastes and does not limit itself just to hazardous or regulated wastes.
Also, the Pollution Prevention Act provides for public access to reported data on source reduction and recycling. Specifically, the law requires companies to file a toxic chemical source reduction and recycling report for each SARA Title I11 reportable chemical in use. For each reporting year, the report must specify the:
y o u might say that waste is our county‘s gross national by-productm
Amount of a chemical entering any waste stream prior to recycling, treatment, or disposal Quantity of chemicals from a facility that is recycled, the method employed, and the percentage change from the prior year Type of source reduction applied to the chemical Estimates of chemical quantities that will be released for the next two calendar years Ratio of chemical release between current and previous year Methods employed to determine source reduction opportunities Catastrophic releases Quantities of a chemical treated on-site and off-site Optional data on source reduction, recycling, and other pollution prevention methods used in the past
204 JOURNAL OF ENVIRONMENTAL REGULATION1 WINTER 199 1-92
TEN STEPS TO EFFECTIVE POLLUTION PREVENTION
IMPLEMENTING POLLUTION PREVENTION Although the scope and objectives of pollution prevention programs (PPP)
vary from company to company, certain basic steps are common to all pollution prevention initiatives. These steps include the following:
1.
2.
3.
4.
Formalize and Communicate Commitment. Begin with a written state- ment to all employees that establishes the company’s commitment to pollution prevention and solicits worker assistance with program implementation. The announcement also describes the benefits of waste reduction, including safeguarding employees and the commu- nity. Ideally, the written piece is followed by a general meeting to answer questions and enlist employee assistance. Assemble a Tmk Force. Because pollution prevention pervades every organizational layer and many different operations, teamwork is critical. Organize an employee task force to help implement the PPP. Members should represent all manufacturing and administrative op- erations and might typically include health and safety personnel, process and environmental engineers, attorneys, accountants, main- tenance personnel, purchasing staff, clerical workers, and others. If there is insufficient staff in-house to do the job, seek outside help. Designate specific individuals to lead the effort and give them the proper authority to carry out their mission, including serving as a central information contact, keeping records, scheduling meetings, supervising implementation activities, and monitoring and evaluating results. Establish Goals and Schedules. Draw up continuous improvement and reduction goals at the plant level. For the first year, base these goals on existing experience and available information on plant operations. Set consistent, measurable objectives such as reduce releases of SARA chemicals by 90 percent by 1995, or eliminate landfill disposal of all hazardous and industrial (i.e., nongarbage) waste by 1995. Formulate a schedule for measuring progress toward these goals. The schedule provides a visible yardstick for management and employees to see program gains and compare results with those at other facilities. Compilea Waste Invento y . Identify the primary and secondary sources
of releases to air, wastewater, and liquid and solid residuals and determine why these streams occur. It is essential to find out how much waste each stream emits and how frequently; the stream’s characteristics; and how the stream is managed. To make these determinations, begin with a records survey by consulting:
production records SARA Title 111 Section 313 reports material safety data sheets permits internal waste tracking reports
~~
IOURNAL OF ENVIRONMENTAL REGULATION/ WINTER 1991-92 205
ROBERT W. R ~ M E Y E R AND PAULA A. COMELLA
. . . i t is useful to provide a brief questionnaire to workers who are knowledgeable about plant and site operations.
Waste segregation to eliminate mixing of hazardous and nonhazardous wastes Better material handling and inventory practices to reduce expired shelf-life materials Production scheduling to reduce batch-generated wastes or unused raw materials Improved housekeeping to minimize spill cleanup residues
vendor transport, treatment, disposal, recycling contracts environmental assessment reports biennial hazardous waste generator reports
To verify information obtained through the records search and to fill in data gaps, it is useful to provide a brief questionnaire to workers who are knowledgeable about plant and site operations.
A visual inspection of the facility is the next critical step in the waste inventory process. Questions should be drawn up beforehand and should focus on documenting each plant waste stream from beginning to end, including collection and storage, treatment, recycling, transport, discharge, and disposal. It is essential to maintain a written record of all observations from the plant inspection, including the ideas offered by the plant’s operating staff.
To compile the formal waste inventory, summarize and document information for each waste stream. Particularly if operations are extensive, consider computerizing the information so that you can sort data by plant area, type of waste, and disposal method and cost. Another benefit of computerization is ease of updating to incorporate operation or process changes that affect waste volumes, rates, or composition. Computerizing data can also facilitate tracking and the generation of reports for management and government agencies.
5. Evaluate Waste Streams. Decide which waste streams or emissions are the best candidates for reduction, recycling, or other pollution preven- tion measures. Issues to consider include regulatory compliance, toxicity, quantity, management costs, potential environmental liability, safety/health risks, and likelihood of success.
6. Begin with the “Basics. ”Frequently, relatively “painless” changes can be done quickly, and they can save time and money. Modifications that do not require a large capital investment, but that often produce results, include:
7. Compile List of Potential Options. Once waste streams and emissions have been ranked, compile a list of potential pollution prevention options. It is important to realize that not every problem can be resolved immediately; sometimes a second look at a process makes sense before implementing final changes.
8. Zero in on the ‘ShortList. ”Screen the list of pollution prevention options
206 IOURNAL OF ENVIRONMENTAL REGULATION/ WNTER 1991 -92
TEN STEPS TO EFFECTWE POLLUTION PREVENTION
further to determine which of them make the most sense from a technical and a financial perspective. The technical evaluation considers factors such as product quality, product safety, worker health and safety, space requirements, installation schedule, production downtime, reliability, commercial availability, permitting requirements, regulatory constraints, effect on other environmental media, personnel skill requirements, and customer acceptance. If an option does not seem technically feasible, drop it temporarily but do not eliminate it from further consideration. It may become more tenable later should operations, personnel, products, or environmental regulations change.
The economic evaluation includes looking at capital requirements and profitability, or the retum on investment. Also consider less direct savings such as reduced compliance costs or elimination of penalties for improper handling and disposal of wastes. Any infeasible options, again, should be set aside but not discarded.
Once the evaluation has been completed, present the short list and its justifications to management for final approval and support. As much as possible, quantify projected savings, waste reductions, and other benefits to gain support and commitment from management.
9. Measure and Monitor Results. The key to successful program imple- mentation is consistent, conscientious tracking and evaluation of important milestones and other progress toward attaining corporate goals. Tracking and reporting methods will vary with facility type, complexity, size, internal resources such as personnel and computer systems, and the company’s individual goals. Tracking must also consider how waste streams are generated as well as the program’s scope.
The initial waste survey should serve as a benchmark for “before and after” comparisons. Note, however, that a variety of factors may sometimes make such an analysis impractical. These include:
changes in production rate changes in product mix multiproduct production lines areas where waste is not directly related to production rate
These scenarios can be addressed in other ways. If production rate modifications occur, a ratio of waste generated to production rate instead of absolute waste volumes can be used. For multiproduct lines, tracking waste reduction by product line is the best gauge unless there are too many products to make this approach practical. Finally, wastes that derive from maintenance activities may be more accurately measured on the basis of time or by plant area.
As for tracking data, be certain to investigate whether or not a tracking system already exists, for example, for data from SARA Title 111 reports, air permits, solid waste disposal, and wastewater discharges.
IOURNAL OF ENVIRONMENTAL REGULATION/ WINTER 1991 -92 207
If this is the case, expand the database into a comprehensive multimedia plant pollution source tracking system. Remember, clear and organized measures of progress can help to justify any future projects.
10. Publicize Effoorts and Achievements. Above all, share activities and results with management, employees, and the community. Manage- ment will want to know about successes, failures, costs, and hture plans. Workers want feedback on the impacts of their contributions and where to apply themselves in the future. The community has a keen interest in the company’s measures to protect health and the environment. If public relations resources are lacking, consider using a consultant to formulate and help implement an effective community relations program. Remember, also, to share plant successes with other facilities in the organization to speed corporate progress and eliminate dupli- cation of effort.
POLLUTION PREVENTION BENEFITS Pollution prevention is finding its place in more and more companies
primarily because it offers attractive benefits to organizations that take it seriously. As these benefits assume a higher profile, other companies are bound to sit up and take notice. There are essentially four broad categories of advantages: economics, public relations, liability reduction, and regula- tory.
Economics
spending in a range of areas such as: Waste minimization can help companies achieve savings and reduce
Reduced storage and handling costs Lower waste transport, disposal, or recycling costs Increased income from sale, reuse, or recycling of waste Lower raw materials costs Higher production capacity Reduced state taxes and fees Reduced insurance rates Lower health and safety costs Lower reporting, manifesting, and permit costs Improved product quality
Public Relations News coverage of the data industry was required to make public under
SARA Title 111 has intensified concern about the types and quantities of pollutants that companies release into the environment. People are especially concerned about the potential adverse health effects of chemical releases. Because the average person does not have the technical expertise to translate SARA Title I11 statistics into meaningful health information, public anxiety is frequently based on misconceptions or “half truths.” However, perception
208 JOURNAL OF ENVIRONMENTAL REGULATION/ WINTER 1991-92
TEN STEPS TO EFFECTIVE POLLuTlohr PREVENTION
Pollut ion prevention he 1ps eliminate potentially serious liabilities associated with waste management, transport, and disposa 1.
becomes reality. For companies to maintain or build their credibility as good environmental citizens, they must explain what SARA Title 111 data really mean in terms that nontechnical audiences can understand. Sharing positive news about pollution prevention can help companies build credibility with their different publics: employees, stockholders, and the community.
Liability Reduction Pollution prevention helps eliminate potentially serious liabilities associ-
ated with waste management, transport, and disposal. Even when a waste is shipped off-site to a permitted disposal facility, the waste generator’s responsibility does not end. In fact, even after the disposal facility shuts down, that facility must be carefully monitored for thirty years to ensure that hazardous wastes do not leak into groundwater, surface water, soils, and other pathways to the environment. Should such a hazardous release occur, any companies that shipped waste to the facility could be held liable for cleanup.
Although it is not easy to attach a precise figure to waste management costs, it is estimated that between $8.4 billion and $11.2 billion will be spent annually. For individual companies, avoiding future liabilities connected with waste disposal runs anywhere from $100 to $300 per ton depending on various contingencies. Given the recent increase in toxic tort cases as well as the high cost of remediation-which can exceed $100 million at some Superfund sites-more and more companies are finding that pollution prevention makes good business sense.
Regulatory Compliance By implementing effective waste minimization programs, companies not
only meet Hazardous and Solid Waste Amendments (HSWA) and other EPA requirements, but also compiy with certain aspects of other environmental legislation, such as Clean Air Act; Clean Water Act; Comprehensive Environ- mental Response, Compensation, and Liability Act; Superfund Amendments and Reauthorization Act; Resource Conservation and Recovery Act; Safe Drinking Water Act; Federal Insecticide, Fungicide and Rodenticide Act; and Toxic Substances Control Act.
Although regulations governing pollution prevention are still in their infancy, experts tend to agree that industry should take proactive measures to initiate waste minimization programs now. Requirements are likely to become stricter and more wide-ranging as concerns about waste management and human health continue to escalate.
PUBLIC AND PRIVATE RESOURCES Both public and private resources exist to assist companies in their
pollution prevention efforts. A prime resource at the federal level is the U.S. EPA Office of Pollution Prevention, which provides industry with information about waste management policy, new publications, and grant programs. Interested parties can contact the agency at:
JOURNAL OF ENVIRONMENTAL REGULATION/ WINTER 1991-92 209
, ROBERT W. R~TTMEYER AND PAULA A. COMELLA
U.S. EPA Office of Pollution Prevention OPPE 401 M Street SW (PM 219) Washington, D.C. 20460 202-382-4332
In addition, the regional offices of EPA are useful reference points for information on pollution prevention, and EPA also has a hazardous waste branch in its Office of Solid Waste. This branch can furnish industrial companies with the most recent information on hazardous waste management policy, written material, and state grants.
Also at the federal level, EPA maintains a toll-free RCWSuperfund hotline at 800-424-9346 to answer questions on waste management requirements and activities.
Because many states monitor waste generators within their borders, a variety of pollution prevention resources also exist at the state level. States such as Califomia, Georgia, Minnesota, Pennsylvania, and North Carolina already have formal programs. Other states, such as Connecticut, Maryland, Massa- chusetts, Michigan, New Jersey, and Ohio are in the program development stages. State programs include resources associated with:
Data collection Grants Information about taxes and fees Reporting Information distribution Financial assistance Technical information Advisory bodies
Private resources on pollution prevention include:
Chemical suppliers for information on chemical safety and waste management Trade associations and local Chambers of Commerce for educational programs Consulting and engineering firms for identifying and classifying waste: drum handling, site assessment, preparation of manifests Hazardous waste management contractors for information about waste treatment, disposal, and transport costs
We are witnessing an evolution in the way the public, regulators, and legislators view pollution. Where once the end-of-pipe method seemed the logical way to deal with wastes, the focus is now shifting from pollution control to pollution prevention. Like most new approaches, pollution prevention presents obstacles as well as opportunities. But as more and more companies
210 IOURNAL OF ENVIRONMENTAL REGULATION/ WINTER 1991-92
TEN STEPS TO EFFECTIVE POLLUTION PREVENTION
implement effective waste minimization programs, they are finding that the benefits far outweigh the difficulties associated with putting new waste reduction programs in place.+
IOURNAL OF ENVIRONMENTAL REGULATION/ WINTER 1992-92 211
New Hazardous Waste Reduction r Strategies for Business Richard M. Walk-a and Andriani Harris
~~
Richard M. Walka is a senior associate with William F. Cosulich Associates, P.C., an environmental engineering firm headquartered in Woodbu y, New York. He was previously chief of the hazardous waste facilities branch of U.S. EPA Region 11. Andn‘ani Harris is a project engineer with the same firm.
azardous waste reduction, waste minimization, recycling, pollution prevention, source reduction, industrial toxics or 33/50 Project-are these simply new buzzwords for the environmental community in the
1990s or an entirely new way of thinking about conducting manufacturing operations, managing waste generation, and regulating hazardous waste into the next century? The short answer is probably a little bit of both and then some.
Science and engineering continuously work toward the goal of measuring and achieving higher and higher standards with respect to improving the efficiency of natural and manufacturing systems through process optimization. However, the degree to which industry, for example, ultimately decides to optimize or improve the efficiency of its unit processes is dictated by the capital cost associated with the process improvements, the cost of raw materials, the operation and maintenance savings realized by proceeding with the capital improvement, and the “payback” period, among other factors. The payback period, or return on investment, can be more or less attractive due to extemal considerations such as the costs of raw materials, waste disposal, and environmental compliance, as well as the supply and demand situation of the final product in the marketplace.
RAISING THE ANTE ON ENVIRONMENTAL PROTECTION Prior to the enactment of the Clean Water Act and Clean Air Act in the early
1970s and the Resource Conservation and Recovery Act CRCRA) and Toxic Substances Control Act in the mid- and late 1970s, respectively, industry was simply not confronted with much in the way of complex or expensive environmental protection regulations or pollution control requirements.
Add to these classic environmental statutes ominous legislation, such as the Comprehensive Environmental Response, Compensation, and Liability Act and its sister Superfund Amendments and Reauthorization Act, the Hazardous and Solid Waste Amendments (HSWA) of 1984, the Safe Drinking Water Act, the air toxics provisions of the Clean Air Act Amendments of 1990, and countless environmental laws and regulations at the state and local level, and you have set the stage for the initiation of a change in the way America does business.
Since the early seventies, industrial expenditures for environmental compliance and pollution control and treatment technology have grown
IOURNAL OF ENVIRONMENTAL REGULATION/ W l N T € R 1991-92 123
RICHARD M. WALKA AND ANDRIAN~ HARRIS
. . . C ongress intended to discourage the management of hazardous waste via land disposal by subjecting i t to burdensome regulato y requirements,
dramatically in the United States, In 1990, expenditures for pollution control in the United States exceeded $115 billion, or 2.1 percent of the gross national product, as compared with $30 billion or .9 percent of the gross national product (1990 dollars) in 1972.’ This significant increase in capital expendi- tures, in combination with the energy crisis of the late seventies, the increasing cost of raw materials, the competition among foreign markets, and more stringent environmental regulations driving the cost of waste management and disposal to new heights are the critical factors that make hazardous waste reduction, waste minimization, recycling, pollution prevention, and source reduction a prescription for the survival of business in the United States through the 1990s and into the next century.
From Waste Management to Waste Reduction When Congress passed the Hazardous and Solid Waste Amendments in
1984, it not only attempted to close statutory and regulatory loopholes created by RCRA in 1976, but also established a framework aimed at eliminating a number of the historical and less sophisticated forms of waste management, such as land disposal, in favor of the use of more technologically advanced, permanent destruction methods, such as incineration.
At the time HSWA was enacted, Congress intended to discourage the management of hazardous waste via land disposal by subjecting it to burdensome regulatory requirements. It would rely on U.S. business and the marketplace to invest the resources and capital necessary to increase incin- eration capacity to offset the decrease in disposal capacity associated with the phase-out of less desirable waste management options. In theory this would have a stabilizing effect on disposal costs along with dramatic improvements in the area of environmental protection. However, as the new technological requirements associated with land disposal and the promulgation of the land disposal restriction rule regulations became effective, the cost of incineration was driven higher because national incinerator capacity was not keeping pace with waste generation due to the birth of a national phenomenon known as “Not In My Back Yard (NIMBY) syndrome.
NIMBY syndrome rose to such high proportions in the mid- to late 1980s that it forced a number of large waste management corporations to cancel their plans to design, build, and operate new incinerator technology, rather than be subjected to hostile community opposition associated with the siting and permitting process.
Federal Legislation for Waste Minimization What does all this have to do with waste reduction and waste minimization?
In addition to playing a part in driving the cost of hazardous waste disposal to record levels throughout the United States, among its many complex and far-reaching provisions, the Hazardous and Solid Waste Amendments of 1984 contained a statutory provision that represents the legal birthplace of waste minimization. Section 3002(a)(6), regarding the preparation of biennial waste reduction reports, and Section 3002(b) of HSWA, entitled “Waste Minimiza-
124 IOURNAL OF ENVIRONMENTAL REGLILA7M)N/~lNTER 2992-92
NEW HAZARDOUS WASTE R E D U ~ I O N STRATEG~ES
Certa in generators are taking advantage of state and local waste-exchange programs.. .
tion,” require generators of hazardous waste to practice and report on waste minimization activities and sign specific certifications indicating that they are doing virtually all they can that is “economically practicable” in the way of reducing the volume or quantity and toxicity of the hazardous waste generated at their facilities. Section 3002(b) reads as follows:
(b) Waste Minimization-Effective September 1, 1985, the manifest required by subsection (a)(5) shall contain a certification by the generator that-
(1) the generator of the hazardous waste has a program in place to reduce the volume or quantity and toxicity of such waste to the degree determined by the generator to be economically practicable; and
(2) the proposed method of treatment, storage, or disposal is that practicable method currently available to the generator which minimizes the present and future threat to human health and the environment.
Section 3002(a)(6) requires submission of reports to the administrator at least once every two years identifying the quantities and nature of waste generated during the year.
In practical terms, these provisions have generally meant that generators are, at a minimum, segregating halogenated and nonhalogenated waste solvents at their facilities to increase opportunities for vendors to pursue off- site reclamation and reusehecycling. Some generators of waste oil have managed the waste to facilitate recovery processes at off-site reprocessing plants or are transporting waste with metals to appropriate facilities for recovery. Certain generators are taking advantage of state and local waste- exchange programs, by which one generator’s waste either serves as raw material at another facility’s manufacturing operation or is used to aid in the treatment of another generator’s waste stream.
Although the above examples are noble undertakings and should not be discouraged, are they truly in compliance with the letter of Section 3002 (b) of HSWA? Probably not. The operative phrase in Section 3002(b)(l) is “reduce the volume or quantity and toxicity” of the waste generated, that is, minimize or reduce waste at the source. It is specifically that type of source reduction technique that distinguishes waste minimization from waste management practices such as reclamation, reuse, recycling, or incin- eration.
Methods such as waste recovery, reuse, recycling, detoxification, treatment, and destruction technologies, which address hazardous waste after it is generated, are essentially considered waste management practices. Address- ing waste after it is generated is not enough. The new mandate is to prevent hazardous waste from being created in the first place.
IOURNAL OF ENVIRONMENTAL REGULATION/ WINTER 1991-92 125
RICHARD M . WALKA A N D ANDMANI HARRIS
Pollution Prevention Strategies Congress passed the Pollution Prevention Act of 1990, and it was from this
vantage point that EPA’s pollution prevention strategy was developed. Specifically, as presented in the February 26,1991 Federal Register, the strategy is designed to serve two purposes:
1. Provide guidance and direction for efforts to incorporate pollution prevention within EPA’s existing regulatory and nonregulatory programs; and
2. Set forth a program that will achieve specific objectives in pollution prevention within a reasonable time frame.
As part of EPA’s new pollution prevention strategy, William K. Reilly, EPA administrator, has implemented a specialized program referred to as the Industrial Toxics Project or ITP/33/50. The ITP is a volunta y program aimed at reducing total releases of seventeen high-priority chemicals to the environ- ment. The program has a national goal of achieving a 33 percent reduction of the seventeen targeted compounds by the end of 1992 and a 50 percent reduction by 1995. Again, this is a “voluntary comp1iance”’program that will utilize data from the Toxic Release Inventory (TRI) from the 1988 reporting year. There are no regulatory deadlines, no fines, no enforcement actions, no inspections, and minimal paperwork, just a corporate commitment to reduce specific chemical usage and waste generation at the source. At last count, over 600 companies across the nation have “signed up,” and the list appears to be increasing daily.2
With regard to waste reduction/pollution prevention programs, William K. Reilly sums it up quite succinctly:
SARA Title III may be one of the most successful pieces of environmental reporting requirements in recent histo y.
Pollution prevention can be the most cost-effective alternative to after- the-fact treatment of pollution. Companies can save on waste manage- ment, reduce the use of raw material . . . minimize liability. . . and relieve themselves of regulatory burdens. .
The ideas for the pollution prevention strategy and ITP described above may have evolved from another piece of recent environmental legislation. A “sleeper” in the litany of environmental statutes passed into law in the last six years, Title I11 of the Superfund Amendments and Reauthorization Act (SARA Title 111) may be one of the most successful pieces of environmental reporting requirements in recent history. It is interesting that up to this point it did not contain any statutory or regulatory requirement for facilities to reduce emissions of toxic chemicals into the atmosphere. It simply required that facilities report the types and amounts of certain chemicals used and provide an estimate of the amounts of each released. However, this “nonrequirement” to reduce has resulted in one of the most effective voluntary chemical utilization and emission reduction programs in the nation. In fact, a preliminary TRI report issued by EPA in mid-May 1991 shows that toxic releases declined
126 ~~
IOURNAL OF ENVIRONMENTAL REGULATION/ WINTER 1991-92
t
NEW HAZARDOUS WASTE REDUCTION STRATEGIES
. . . SARA Title III opened the nation‘s eyes to the billions of pounds of chemicals being released into the environment.. .
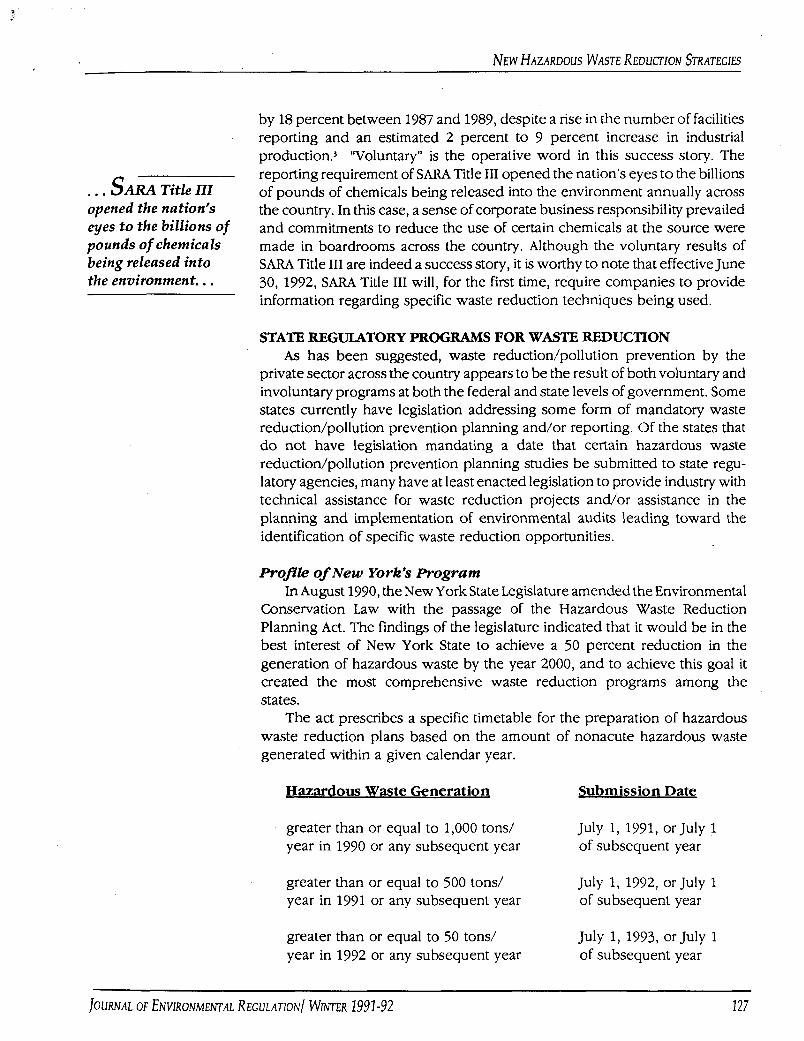
by 18 percent between 1987 and 1989, despite a rise in the number of facilities reporting and an estimated 2 percent to 9 percent increase in industrial production.3 “Voluntary” is the operative word in this success story. The reporting requirement of SARA Title I11 opened the nation’s eyes to the billions of pounds of chemicals being released into the environment annually across the country. In this case, a sense of corporate business responsibility prevailed and commitments to reduce the use of certain chemicals at the source were made in boardrooms across the country. Although the voluntary results of SARA Title I11 are indeed a success story, it is worthy to note that effective June 30, 1992, SARA Title I11 will, for the first time, require companies to provide information regarding specific waste reduction techniques being used.
STATE REGULATORY PROGRAMS FOR WASTE REDUCTION As has been suggested, waste reduction/pollution prevention by the
private sector across the country appears to be the result of both voluntary and involuntary programs at both the federal and state levels of government. Some states currently have legislation addressing some form of mandatory waste reduction/pollution prevention planning and/or reporting. Of the states that do not have legislation mandating a date that certain hazardous waste reduction/pollution prevention planning studies be submitted to state regu- latory agencies, many have at least enacted legislation to provide industry with technical assistance for waste reduction projects and/or assistance in the planning and implementation of environmental audits leading toward the identification of specific waste reduction opportunities.
Profile of New York’s Program In August 1990, the New York State Legislature amended the Environmental
Conservation Law with the passage of the Hazardous Waste Reduction Planning Act. The findings of the legislature indicated that it would be in the best interest of New York State to achieve a 50 percent reduction in the generation of hazardous waste by the year 2000, and to achieve this goal it created the most comprehensive waste reduction programs among the states.
The act prescribes a specific timetable for the preparation of hazardous waste reduction plans based on the amount of nonacute hazardous waste generated within a given calendar year.
Hazardous Waste Generation Submission Date
greater than or equal to 1,000 tons/ year in 1990 or any subsequent year
July 1, 1991, or July 1 of subsequent year
greater than or equal to 500 tons/ year in 1991 or any subsequent year
July 1, 1992, or July 1 of subsequent year
greater than or equal to 50 tons/ year in 1992 or any subsequent year
July 1, 1993, or July 1 of subsequent year
JOURNAL OF ENVIRONMENTAL REGULATION/ WINTER 1991 -92 127
RICHARD M . WALKA AND ANDJUANIHARRIS
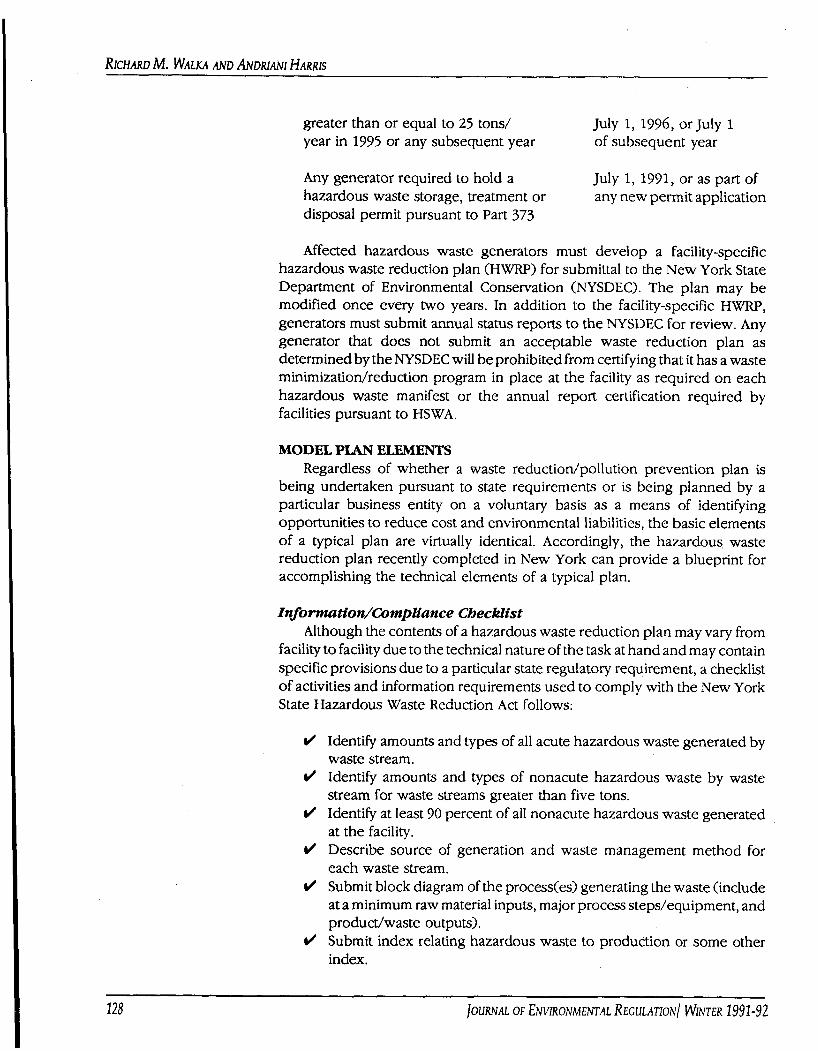
greater than or equal to 25 tons/ year in 1995 or any subsequent year
July 1, 1996, or July 1 of subsequent year
Any generator required to hold a hazardous waste storage, treatment or disposal permit pursuant to Part 373
July 1, 1991, or as part of any new permit application
Affected hazardous waste generators must develop a facility-specific hazardous waste reduction plan (HWRP) for submittal to the New York State Department of Environmental Conservation (NYSDEC). The plan may be modified once every two years. In addition to the facility-specific HWRP, generators must submit annual status reports to the NYSDEC for review. Any generator that does not submit an acceptable waste reduction plan as determined by the NYSDEC will be prohibited from certifying that it has a waste minimization/reduction program in place at the facility as required on each hazardous waste manifest or the annual report certification required by facilities pursuant to HSWA.
MODEL PLAN ELEMENTS Regardless of whether a waste reductiodpollution prevention plan is
being undertaken pursuant to state requirements or is being planned by a particular business entity on a voluntary basis as a means of identifying opportunities to reduce cost and environmental liabilities, the basic elements of a typical plan are virtually identical. Accordingly, the hazardous. waste reduction plan recently completed in New York can provide a blueprint for accomplishing the technical elements of a typical plan.
Infortnution/Compliance Checklist Although the contents of a hazardous waste reduction plan may vary from
facility to facility due to the technical nature of the task at hand and may contain specific provisions due to a particular state regulatory requirement, a checklist of activities and information requirements used to comply with the New York State Hazardous Waste Reduction Act follows:
Identify amounts and types of all acute hazardous waste generated by waste stream. Identify amounts and types of nonacute hazardous waste by waste stream for waste streams greater than five tons. Identify at least 90 percent of all nonacute hazardous waste generated at the facility. Describe source of generation and waste management method for each waste stream. Submit block diagram of the process(es) generating the waste (include at a minimum raw material inputs, major process stepdequipment, and produdwaste outputs). Submit index relating hazardous waste to production or some other index.
128 IOURNAL OF ENVIRONMENTAL REGULATION/ W N T E R 2991-92
NEW HAZARDOUS WASTE REDUCTION STRATEGIES
J
J
J
J J
J
J
J J
J
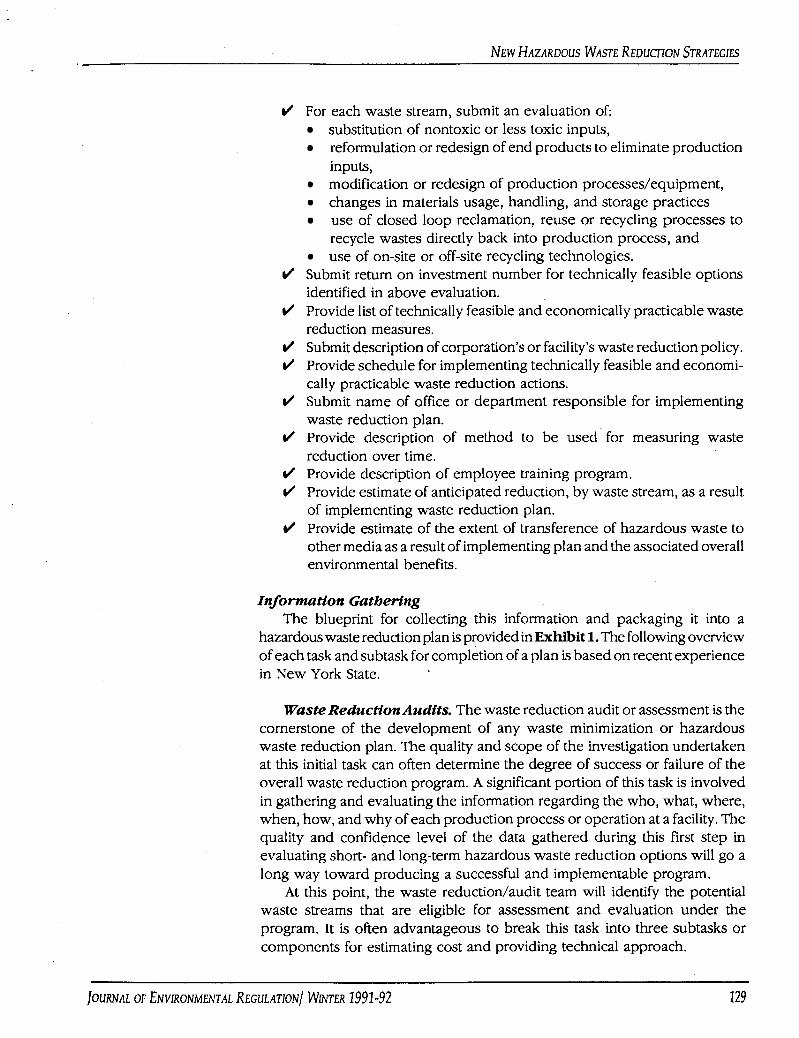
For each waste stream, submit an evaluation of: substitution of nontoxic or less toxic inputs, reformulation or redesign of end products to eliminate production inputs, modification or redesign of production processes/equipment, changes in materials usage, handling, and storage practices use of closed loop reclamation, reuse or recycling processes to recycle wastes directly back into production process, and use of on-site or off-site recycling technologies.
Submit retum on investment number for technically feasible options identified in above evaluation. Provide list of technically feasible and economically practicable waste reduction measures. Submit description of corporation’s or facility’s waste reduction policy. Provide schedule for implementing technically feasible and economi- cally practicable waste reduction actions. Submit name of office or department responsible for implementing waste reduction plan. Provide description of method to be used for measuring waste reduction over time. Provide description of employee training program. Provide estimate of anticipated reduction, by waste stream, as a result of implementing waste reduction plan. Provide estimate of the extent of transference of hazardous waste to other media as a result of implementing plan and the associated overall environmental benefits.
Information Gathering The blueprint for collecting this information and packaging it into a
hazardous waste reduction plan is provided in Exhibit 1. The following overview of each task and subtask for completion of a plan is based on recent experience in New York State.
Wuste Reductfon Audits. The waste reduction audit or assessment is the cornerstone of the development of any waste minimization or hazardous waste reduction plan. The quality and scope of the investigation undertaken at this initial task can often determine the degree of success or failure of the overall waste reduction program. A significant portion of this task is involved in gathering and evaluating the information regarding the who, what, where, when, how, and why of each production process or operation at a facility. The quality and confidence level of the data gathered during this first step in evaluating short- and long-term hazardous waste reduction options will go a long way toward producing a successful and implementable program.
At this point, the waste reductiodaudit team will identify the potential waste streams that are eligible for assessment and evaluation under the program. It is often advantageous to break this task into three subtasks or components for estimating cost and providing technical approach.
~ O U R N A L OF ENVIRONMENTAL REGULATION/ WINTER 1992-92 7 29
c
* RlCHARD M. WALKA AND ANDRIM1 HARRIS
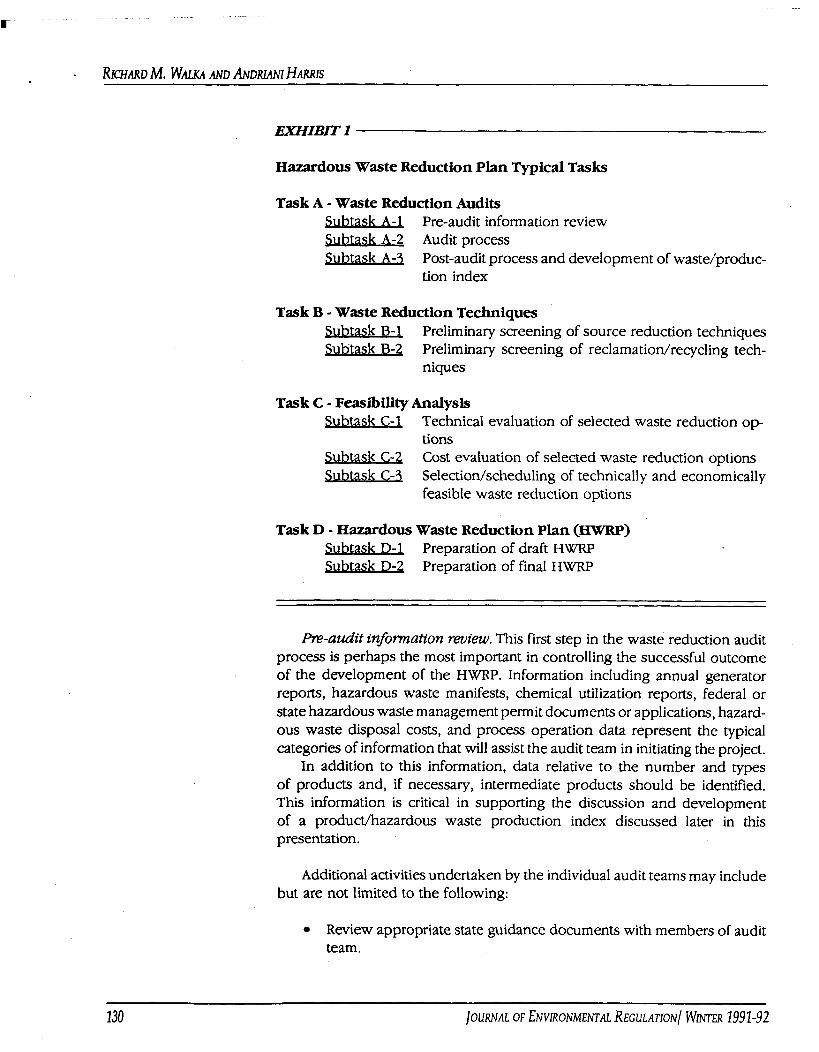
EXHIBIT 1
Hazardous Waste Reduction Plan Typical Tasks
Task A - Waste Reduction Audits Subtask A-1 Pre-audit information review Subtask A-2 Audit process Subtask A-9 Post-audit process and development of waste/produc-
tion index
Task B - Waste Reduction Techniques task B-1
sk B-Z Preliminary screening of source reduction techniques Preliminary screening of reclamation/recycling tech- niques
Task C - Feasibility Analysis Subtask C-1
Subtask C-2 Subtask C-3
Technical evaluation of selected waste reduction op- tions Cost evaluation of selected waste reduction options Selection/scheduling of technically and economically feasible waste reduction options
Task D - Hazardous Waste Reduction Plan (HWRP) Subtask D-1 m t a s k D-2
Preparation of draft HWRP Preparation of final HWRP
Pre-audit information review. This first step in the waste reduction audit process is perhaps the most important in controlling the successful outcome of the development of the HWRP. Information including annual generator reports, hazardous waste manifests, chemical utilization reports, federal or state hazardous waste management permit documents or applications, hazard- ous waste disposal costs, and process operation data represent the typical categories of information that will assist the audit team in initiating the project.
In addition to this information, data relative to the number and types of products and, if necessary, intermediate products should be identified. This information is critical in supporting the discussion and development of a productlhazardous waste production index discussed later in this presentation.
Additional activities undertaken by the individual audit teams may include but are not limited to the following:
Review appropriate state guidance documents with members of audit team.
130 IOURNAL OF ENVIRONMENTAL REGULATION/ WINTER 2991-92
NEW HAZARDOUS WASTE REDUCTION STRATEGIES E f
Review hazardous waste reduction audit program facility question- naires. Prepare copies of “clean” site plan for labeling in the field. Coordinate to schedule activities of the inspection (e.g., specific schedule, number of people involved) and review any site-specific health and safety requirements. Review existing records/manifests/waste analyses prior to on-site audit. Identify major waste streams and likely sources from manifest and record review. Identify hazardous waste generation rates on a preliminary basis by manifest and record review.
Auditprocess. This subtask addresses the initiation and completion of the actual hazardous waste reduction audit or assessment for the affected waste streams. Typically, the audit team initiates the audit process by meeting with process managers to review the operation at the facility and complete the information requirements outlined below. It is important to verify:
The type and amounts of each chemical input to the process. The type and amounts of each waste produced and where it is produced within the process. The details of each process operation leading to the preparation of a schematic of the manufacturing operation.
The seven areas typically addressed as part of the waste reduction questionnaire are:
Background information Labor requirements Equipment requirements Material usage information (including raw materials, water and energy use) Waste generation Air emissions Miscellaneous operation data (such as ongoing or unsuccessful past attempts at waste reduction)
Post-audit process and development of wastdproduction index. At the conclusion of the audit process the audit team summarizes its findings. The purpose of tabulating all pertinent data is to attempt to develop a relationship between product produced, waste generated, and the cost of disposal of each unit of waste generated.
The post-audit subtask is also important in the overall audit process in that it allows the audit team to follow up its initial investigations with plant personnel to either fill in data gaps, clarify the meaning of information gathered
JOURNAL OF ENVIRONMENTAL REGULATION/ WLVTER 1991-92 131
in the audit phase, or gather new information based on the tabulation of information referenced above, which could have relevance in selecting waste streams for detailed study.
Waste Reduction Techniques. Waste reduction techniques are identi- fied for each of the hazardous waste streams audited under Task A. We have divided this task into two subtasks that explore source reduction and recycling/ reclamation techniques.
Prelimina y screening of source eduction techniques. The source reduc- tion techniques that will be screened under this task for possible hrther technical feasibility and cost implications are:
Good operating practice. This is perhaps the easiest of all waste reduction techniques to implement at a facility. It generally involves an administrative, procedural, or organizational change rather than a technological change, and as such, usually does not involve a large investment of time, effort, or money. Good operating practice techniques typically screened include:
employee education record keeping
improved scheduling preventive maintenance
Substitution of nontoxic or less toxic input products. Technological modification. Reformation or redesign of end products to eliminate production inputs.
inventory controb'material and waste tracking material usage, handling and storage
Pelimina y screening of reclamationhecycling technologies. The recla- matiodrecycling technologies that will be screened under this task for possible further technical feasibility and cost implications are:
Closed loop reclamation Reuse On-site/off-site recycling
As is apparent from the source reduction and reclamatiodrecycle tech- niques above, a preliminary screening to assess the feasibility of the various waste reduction options is required to reduce the number of options to be more rigorously examined under Task C to a manageable level. To further reduce waste reduction options to a manageable level the following criteria may also be considered in order of priority:
Reduction of waste quantity
132 IOURNAL OF ENVIRONMENTAL REGULATION/ WNTER 1992-92
NEW HAZARDOUS WASTE REDUCTION STRATEGIES
Reduction of safety hazards concerning waste Reduction of waste treatment and/or disposal costs Reduction of input material costs Reduction of liability and insurance costs Effect on product quality Increase or decrease in operating and maintenance costs Low capital cost Ease of implementation and effect on production rate Regulatory requirements
Feasfbfltty Analysis. After the preliminary screening of waste reduction techniques and subsequent selection of possible options to implement as part of the hazardous waste reduction plan, the project team will conduct a detailed feasibility study to provide management with the information necessary to make an informed decision. To this end, we have divided this task into three subtasks that concentrate on technical feasibility, cost feasibility, and, finally, a selected waste reduction technique to implement.
Technical evaluation ofselected waste reduction techniques. The technical evaluation of waste reduction techniques determines whether a particular option will work in a specific application. It is similar to the preliminary screening conducted under Task B; however, greater detail will be required in order to ensure the success of the selected technique.
Note that many of the good operating practice techniques listed in Subtask B-1 are easily implemented and do not require a detailed technical feasibility study. A technical feasibility study will be most useful in situations in which there is a technical modification or input material change. The evaluation is typically divided into three major categories that concentrate on the following waste reduction techniques:
Equipment-Related Modification. This element of the technical feasi- bility study typically evaluates the commercial availability of equip- ment. Personnel/Procedure-Related Changes. Administrative, procedural, or organizational changes, as was stated previously, usually do not involve a large investment in time, effort, or money to produce considerable success in waste reduction. However, the equipment, related option or material-related changes often involve personnel or procedure changes that would be required to be part of a technical feasibility analysis. Material-Related Modification. The change of input materials will be evaluated as part of this technical feasibility study. The successful commercial use of any new material will be identified by evaluating case studies. A material testing program may have to be developed in order to accomplish this. Additional storage, handling, or ancillary equipment will be identified as part of the equipment-related option.
JOURNAL OF ENVIRONMENTAL REGULATION/ WINTER 1991-92 133
’ RICHARD M. ~ A L K A AND ANDRIANI HARRIS
At the conclusion of this subtask, a list of technically feasible waste reduction techniques will be compiled.
Cost evaluation of selected waste reduction techniques. After the technical feasibility has been completed, a cost evaluation is initiated that examines the following:
Capital Costs. The purchase cost of any new equipment or material will be estimated. The cost of any site preparation, engineering plans, and equipment installation will be calculated. Start-up and training costs, as well as any testing program expenses, will also be included. Any new permits that might be required for new equipment will be calculated as part of the capital cost estimate. An estimate of any salvage value is also required for any equipment to be purchased. Utility Costs. The change in utility costs will be calculated for any new equipment being purchased as part of each waste reduction technique selected. This will include the cost for the new connections as well as the unit cost incurred per time. Operating Cost. The change in operating costs will be calculated for each selected waste reduction technique and will include the cost of raw materials, labor, operating and maintenance supplies, insurance, and liability, as well as any change in revenue for an increase or decrease in production.
Once the selected waste reduction technique has been evaluated with respect to cost, the return on investment number is calculated for the technique.
Intangible benefits such as public relations and product acceptance are difficult to measure economically but should be considered in the selection of a final waste reduction technique. Other intangible benefits such as worker safety can improve employee relations and productivity. In the selection of a waste reduction technique, the intangible benefits realized could provide the inputs needed to reinforce the final decision.
Intangible beffefits such as public relations and product acceptance are difficult to measure economically.. . Selection/scheduling of technically and economically feasible waste re-
duction techniques. Once the technical feasibility and economic practicality of the selected waste reduction technique have been determined, the project team selects and schedules the identified waste reduction technique. Once the waste reduction technique has been chosen, the project will be organized into specific phases and an implementation schedule developed. At the conclusion of this subtask, an estimate of the anticipated reduction in waste generation and extent of transference of hazardous waste to other media as a result of implementing the chosen technique is typically provided.
Hazardous Waste Reduction Pkn. At the completion of the activities described above in tasks A through C, the project team undertakes the
134 __
JOURNAL OF ENVIRONMENTAL REGULATION/ k N T E R 1992-92
NEW HAZARDOUS WASTE REDUCTION STRATEGlES
preparation of a draft and final hazardous waste reduction plan. The final plan serves as the blueprint for implementing waste reduction projects at the facility and should provide the mechanism for measuring its success over the planning period .
CONCLUSION Although hazardous waste reductiodpollution prevention has been a
federal mandate since 1989, some states are now putting more teeth into the program by requiring written plans, annual status reports, and measurement of waste reduction progress against numerical goals tied into manufacturing production indices. However, regulatory requirements notwithstanding, waste reduction/pollution prevention also appears to be picking up momentum as simply a good business strategy-an important element in reducing risk to worker health and safety, minimizing liability costs, and achieving environ- mental protection. +
NOTES
1. “Environmental Investments: The Cost of a Clean Environment,” EPA-230 12 90-084, (December 19%).
2. “EPA’s 33/50 Project Expanded,” ConnTAPQuarterly, Vol. 4, No. 3 (Summer 1991); “National Pollution Prevention Strategy Outlined,” 7beHazardow Waste Consultant, Vol. 9, Issue 3 (May/ June 191). McCoy Associates. Connecticut Technical Assistant Project, Connecticut Hazardous Waste Management Services. 203-241-0777.
3. “Lautenberg Criticizes EPA’s Inaction, Proposes Additions to Toxic Release Inventory,” Hazardous MateriaLC; Control Research Institute, Vol. 7, No. 8 (August 1391).
IOURNAL OF ENVIRONMENTAL REGULATION1 W M E R 1991-92 135