Embed Size (px)
Citation preview

Project Description
5-21
Temporary Shore Protection
During the Northeast monsoon period where reclamation works cannot be carried out,
temporary shore protection (Photo 5.2) shall be placed at areas where revetments
have yet to be constructed to ensure sand is not washed away. This will be either a
temporary rock revetment or geobags.
Photo 5.2 Example of temporary shore protection /13/.
Vessels and Equipment
The principal vessels and equipment to be used for the reclamation works are set out
in Table 5.5.
Table 5.5 Vessels and equipment for reclamation work.
Item No.
Description Size or Capacity
Function
1. Two trailing suction hopper dredgers (TSHD)
20,000 m3 Sand mining at the marine borrow area and transportation and pumping at the reclamation site
2. Crane barge, flat barge, tug boat
- Handling of floating / sub-sea pipeline
Construction of revetment
3. Flat top barge and tug
- Supply of rock for revetment construction to the site from Hexatrend Quarry
4. Passenger boat - Transport of personnel and small equipment and supplies
5. Submarine pipeline, floating pipeline and onshore pipeline
- Delivery of sand from the TSHD to the reclamation by hydraulic pumping
6. Bulldozer - Spreading of sand fill from the pipeline discharge point, and forming bunds, levelling, etc
7. Long arm excavators - Construction of perimeter revetments. May be operating from reclamation area or on flat top barge.
Project Description
5-22 62801461-RPT-105
Item No.
Description Size or Capacity
Function
8. Wheel loader, backhoe
30 ton excavator
Re-handling sand fill, loading dump trucks, trimming and smoothing surface, etc
9. Dump truck 25 ton Transporting sand fill and rock for revetment construction within the reclamation area.
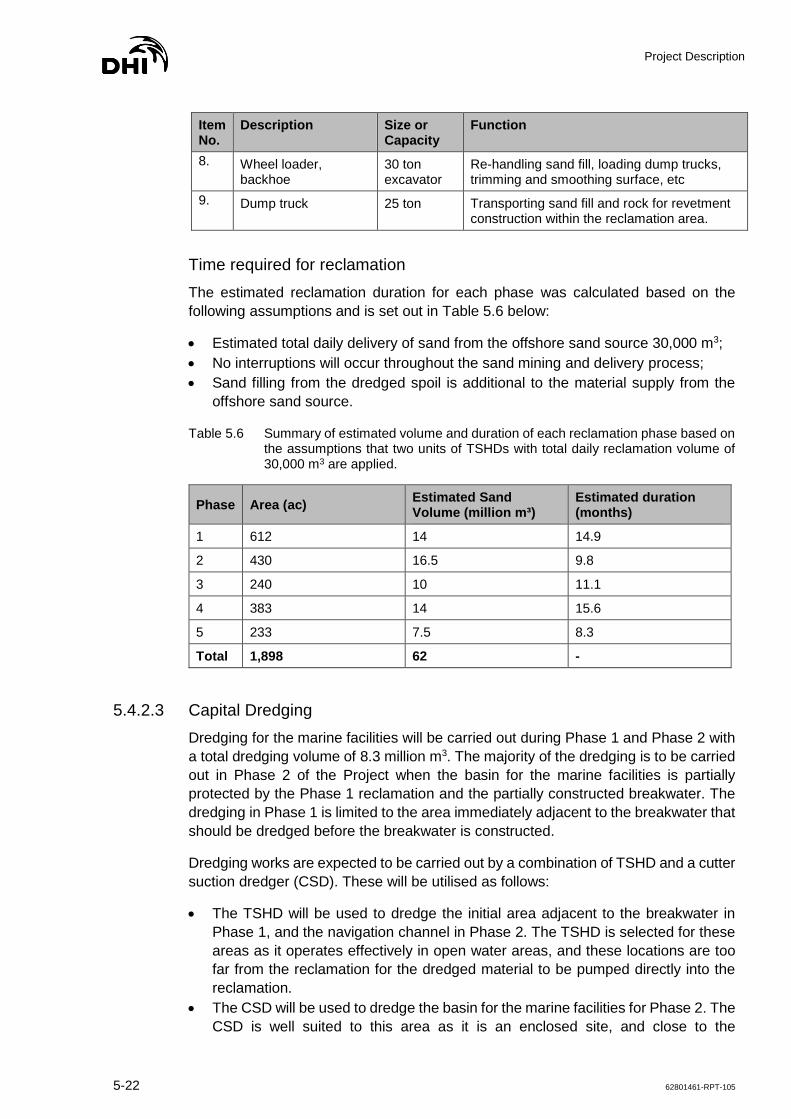
Time required for reclamation
The estimated reclamation duration for each phase was calculated based on the
following assumptions and is set out in Table 5.6 below:
• Estimated total daily delivery of sand from the offshore sand source 30,000 m3;
• No interruptions will occur throughout the sand mining and delivery process;
• Sand filling from the dredged spoil is additional to the material supply from the
offshore sand source.
Table 5.6 Summary of estimated volume and duration of each reclamation phase based on the assumptions that two units of TSHDs with total daily reclamation volume of 30,000 m3 are applied.
Phase Area (ac) Estimated Sand Volume (million m³)
Estimated duration (months)
1 612 14 14.9
2 430 16.5 9.8
3 240 10 11.1
4 383 14 15.6
5 233 7.5 8.3
Total 1,898 62 -
5.4.2.3 Capital Dredging
Dredging for the marine facilities will be carried out during Phase 1 and Phase 2 with
a total dredging volume of 8.3 million m3. The majority of the dredging is to be carried
out in Phase 2 of the Project when the basin for the marine facilities is partially
protected by the Phase 1 reclamation and the partially constructed breakwater. The
dredging in Phase 1 is limited to the area immediately adjacent to the breakwater that
should be dredged before the breakwater is constructed.
Dredging works are expected to be carried out by a combination of TSHD and a cutter
suction dredger (CSD). These will be utilised as follows:
• The TSHD will be used to dredge the initial area adjacent to the breakwater in
Phase 1, and the navigation channel in Phase 2. The TSHD is selected for these
areas as it operates effectively in open water areas, and these locations are too
far from the reclamation for the dredged material to be pumped directly into the
reclamation.
• The CSD will be used to dredge the basin for the marine facilities for Phase 2. The
CSD is well suited to this area as it is an enclosed site, and close to the

Project Description
5-23
reclamation areas so that the dredged material can be pumped directly into the
reclamation.
The estimated duration of the dredging works is approximately 1.6 months in Phase
1 and 8.1 months in Phase 2. The estimated daily production rate is 12,600 m3/day
for the TSHD, and 24,000 m3/day for the CSD.
Working hours shall be 24 hours per day seven days per week including public
holidays.
Sequence of Works
Trailer Suction Hopper Dredger
The procedure for dredging by TSHD is by lowering one or both drag heads to the
seabed and hydraulically pumping dredged material into the hopper via the suction
pipe(s). The dredging depth and position can be accurately controlled by an on-board
GPS and control systems. While dredging the TSHD will maintain speed not
exceeding approximately 2 knots.
All the dredged materials shall be pumped directly to reclamation site. The TSHD
carrying out this capital dredging work will utilise the same floating pipeline that is
being used for sand deliveries from the offshore sand source to pump the dredged
material to the reclamation. The methods used shall be as described in Section
5.4.2.2.
Cutter Suction Dredger
The CSD is a stationary dredger equipped with a cutter device (cutter head) which
excavates the soil before it is sucked up by the flow of the dredge pump(s). During
operation, the dredger moves around a spud pole by pulling and slacking on the two
fore sideline wires /14/. All the dredged materials shall be pumped directly to
reclamation site via a floating pipeline. This will be discharged into a bunded area and
the material distributed in a similar way to material being supplied from the offshore
sand source as described in Section 5.4.2.2.

Project Description
5-24 62801461-RPT-105
Figure 5.15 Typical CSD.
5.4.2.4 Breakwater Construction
The breakwater will be constructed using a combination of floating and land-based
equipment; a typical view of breakwater construction using both floating and land-
based equipment is shown in Figure 5.16. Rock for the breakwater construction will
be transported to the site by sea using a combination of flat top barges towed by tugs
and specialist marine construction vessels. The concrete armour units will be
prefabricated at the planned working area at the site and will be transported to the
breakwater using specialist off road vehicles before placing.
The general construction method for the breakwater is described in the following:
• A geotextile layer will be placed on the sea bed covering the footprint of the
breakwater. This will be transported to the site in rolls and placed on the sea bed
using a crane mounted on a flat top barge. A layer of filter rock to protect the
geotextile from the larger core and armour rock will be placed on it using either a
specialist self-propelled side dump vessel, of a clam shell crane also working from
a flat top barge.
• The core rock will be dumped into the sea up to approximately low tide level using
a combination of bottom dump split hopper bargees and self-propelled side dump
vessels.
• The below water core will be trimmed to shape using either long armed excavators
or a clam shell crane. The core material above low water level will be placed using
the same equipment.
• The underlayer rock will be placed using either long armed excavators of a clam
shell crane. The material will be supplied from the quarry on flat top barges. For
the lower slopes the long arm excavator or crane will be operating from a flat top
barge, however the upper slopes and crest may be constructed by equipment
operating from the breakwater rest. Secondary armour placing using a specialist
crane barge is illustrated in Figure 5.17.

Project Description
5-25
• The armour layer acts as the primary defence against wave action and will consist
of concrete armour units. Due to the weight of these units they will be placed either
using a crawler crane operating on the breakwater crest, or a floating crane.
Figure 5.16 Breakwater construction using a combination of floating and land-based equipment.
Figure 5.17 Placing breakwater armour rock using a specialist crane barge.

Project Description
5-26 62801461-RPT-105
5.4.2.5 Construction of Roads and Bridges
The function of the bridges is to provide access from the Phase 1 reclaimed land to
Phase 3, 4 and 5 reclaimed land. Although the exact bridge design is currently
unknown, construction of the bridges will involve typical activities such as piling of
bridge foundation, installation of precast concrete components, bridge decking and
others. Road construction will entail activities such as sub-grade works (surface
cleaning, slope protection etc.), pavement works and traffic facilities.
5.4.2.6 Construction of Piled Platforms
The construction of the five piled platforms within the channel will involve piling work.
These platforms are approximately 1 ha. Spacing interval between the piles are
anticipated to be around 10 m.
5.4.2.7 Management of Construction Activities
The project manager will have overall responsibility for the construction of the entire
facility, supported by the project team including managers for HSE & security, project
controls, field engineering and construction supervision among others. First aid
facilities will be provided at site and panel doctors will be arranged with a medical
clinic located in close proximity to the Project site. A health, safety and environment
(HSE) management plan and an emergency response plan will be implemented,
including provision of relevant training for all personnel working at the project site.
Mitigation measures to avoid and to minimise environmental impacts as described
within this EIA will be incorporated into this construction HSE management plan.
Hours of Operation
The site working hours will be 24 hours per day, 7 days per week.
Construction Workforce
The construction workforce will be recruited with the intention to maximise the use of
local labour and contractors where appropriate skills exist. If foreign labour is required
to supplement the local workforce, an official hire process will be adhered to prevent
the engagement of illegal foreign nationals at the site. The construction workforce is
estimated to be in around 500 persons. Offsite accommodation will be arranged for
workers during the construction phase.
Transportation of Equipment and Materials
Most of the heavy bulk of construction materials (e.g. gravel, sand) will be delivered
to site by barge, and hence expected construction land traffic is minimal and limited
to the transportation of workers.
5.4.3 Post-construction Stage
No post-construction activities are considered in this EIA. Following the completion of
the reclamation and dredging works, the topside development will be initiated. The

Project Description
5-27
construction and operations of the Sunrise City development is not assessed in this
EIA, apart from consideration of the conceptual land use.
5.4.4 Project Abandonment/Decommissioning
In the event of Project abandonment and site closure, construction waste materials
and machinery will be removed from the development area. Partially completed
structures, if any, shall be dismantled. Depending on the phase at which the Project
is abandoned, reclaimed land areas may remain unutilised.
The appropriate regulatory authorities including DOE and DOSH will be duly informed
and representatives from these authorities may be present to ensure proper
procedures are adhered. The necessary regulatory approvals and permits will be
obtained.
5.5 Development Schedule
The Project will be carried out over five phases (Table 5.4), with a target
commencement in the first quarter of 2020 and planned completion approximately six
years later. This schedule is based on the expected reclamation and dredging plant
outlined in sections 5.4.2.2 and 5.4.2.3, and accounts for anticipated weather
downtime during the Northeast monsoon period. For every phase, reclamation works
will be carried out followed by respective topside development works. An outline of
the Project schedule is set out in Figure 5.18.

Project Description
5-28 62801461-RPT-105
Figure 5.18 Project implementation schedule.

Existing Environment
6-1
6 Existing Environment
This section provides background information on the existing physical-chemical,
biological and human environment in the Project area and the assessment zones.
The key sensitive environmental receptors are identified and described. The
information is based on baseline surveys and secondary information from data,
literature and other reports for the area as detailed in Appendix B.
The spatial areas of focus or extent around the Project area, are variable, depending
on the environmental component in question, and have been based on the anticipated
zone of impacts identified during the scoping phase as outlined in the approved TOR.
As detailed in Chapter 2, the following assessment areas have been adopted:
• Marine physical and biological environment – 5 km radius from the Project area;
• Terrestrial physical environment – 1 km radius from the Project area; and
• Human Environment – 5 km radius from the Project area.
As a result, the following descriptions of the existing environment are focused on
these areas.
6.1 Physiographic Context
The coastal region of Terengganu is largely formed of sandy beaches (from
Quaternary geological formations) which are dynamic in nature as a result of seasonal
variations in wind, waves and currents from the Southwest and the Northeast
monsoons (Ariffin et al., 2018) /15/.
Over the period between May and September2, during the Southwest monsoon
season, the winds are south westerly and largely blow offshore or in parallel with the
coast, leading to relatively benign conditions. In contrast, the period from November
to March is dominated by the Northeast monsoon when winds are predominantly north
easterly across the South China seas. The differences in impacts on waves of these
two dominant seasons are illustrated in Figure 6.1. Note that there is not a big
difference in current speeds. Each of these physical factors is discussed in greater
detail below.
2 Note that the start and finish periods for these regional monsoons may vary considerably from year to year.

Existing Environment
6-2 62801461-RPT-105
Winds Waves Currents
NE
Mo
nso
on
SW
Mo
nso
on
Legends
Figure 6.1 A comparison of wind direction, current speed and direction, and waves in the two monsoon periods. Wind roses are monthly estimates for 10 years of CFSR wind (year 2006 to 2015), waves are examples of modelled wave fields and currents are a snapshot of predicted mean current speed over a 28-days simulation during NE monsoon (top) and SW monsoon (bottom) periods.
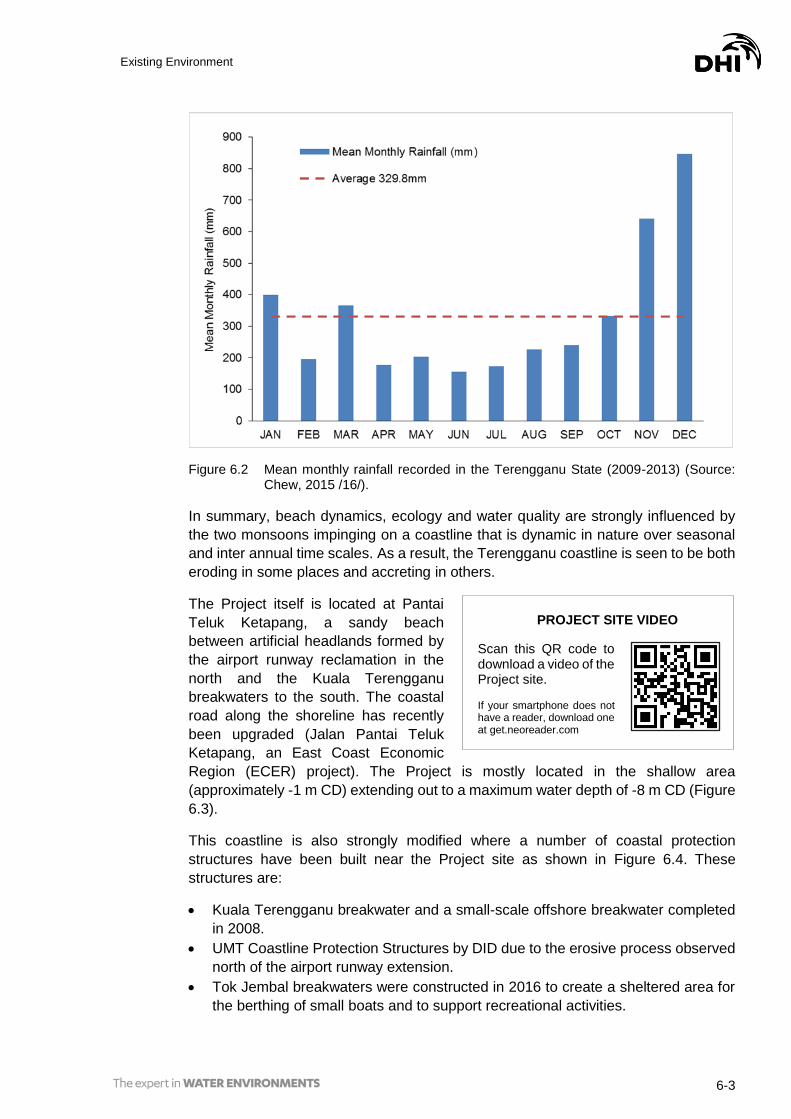
Rainfall in the region shows a strong seasonal pattern that is also a product of the
monsoons (Figure 6.2). The seasonal difference in rainfall is reflected in river outflow
and sediment resupply to the coast. Nearshore coastal waters as a consequence can
therefore be expected to be slightly lower in salinity and higher in turbidity during the
rainy part of the year and vice versa during the drier period. This is in fact reflected in
long term data analysed by Akhir et al. (2011) /15/ for the eastern Malaysian
peninsular coast.
Existing Environment
6-3
Figure 6.2 Mean monthly rainfall recorded in the Terengganu State (2009-2013) (Source: Chew, 2015 /16/).
In summary, beach dynamics, ecology and water quality are strongly influenced by
the two monsoons impinging on a coastline that is dynamic in nature over seasonal
and inter annual time scales. As a result, the Terengganu coastline is seen to be both
eroding in some places and accreting in others.
The Project itself is located at Pantai
Teluk Ketapang, a sandy beach
between artificial headlands formed by
the airport runway reclamation in the
north and the Kuala Terengganu
breakwaters to the south. The coastal
road along the shoreline has recently
been upgraded (Jalan Pantai Teluk
Ketapang, an East Coast Economic
Region (ECER) project). The Project is mostly located in the shallow area
(approximately -1 m CD) extending out to a maximum water depth of -8 m CD (Figure
6.3).
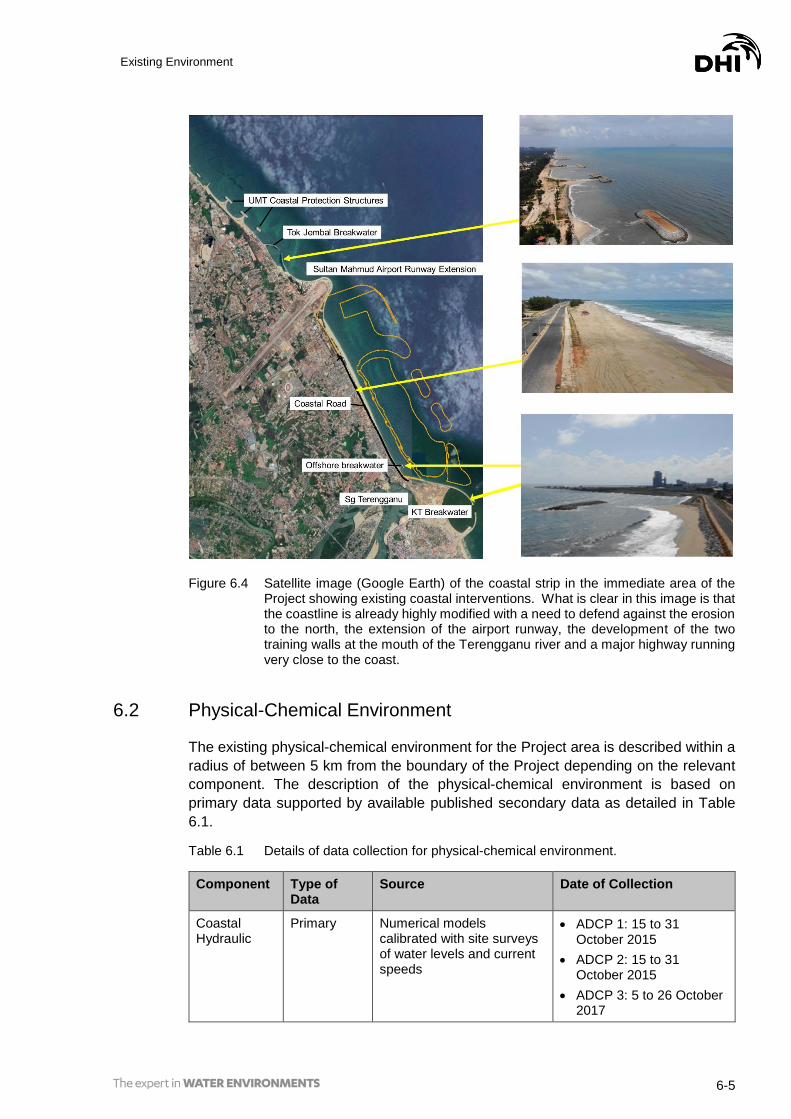
This coastline is also strongly modified where a number of coastal protection
structures have been built near the Project site as shown in Figure 6.4. These
structures are:
• Kuala Terengganu breakwater and a small-scale offshore breakwater completed
in 2008.
• UMT Coastline Protection Structures by DID due to the erosive process observed
north of the airport runway extension.
• Tok Jembal breakwaters were constructed in 2016 to create a sheltered area for
the berthing of small boats and to support recreational activities.
PROJECT SITE VIDEO
Scan this QR code to download a video of the Project site. If your smartphone does not have a reader, download one at get.neoreader.com

Existing Environment
6-4 62801461-RPT-105
• Jalan Pantai Teluk Ketapang is presently being constructed close to the Pantai
Teluk Ketapang shoreline with rock revetment proposed as a protection measure.
Figure 6.3 Bathymetry at the Project area (interpolated from bathymetric survey data October 2015 and April 2018, and navigation charts).
Existing Environment
6-5
Figure 6.4 Satellite image (Google Earth) of the coastal strip in the immediate area of the Project showing existing coastal interventions. What is clear in this image is that the coastline is already highly modified with a need to defend against the erosion to the north, the extension of the airport runway, the development of the two training walls at the mouth of the Terengganu river and a major highway running very close to the coast.
6.2 Physical-Chemical Environment
The existing physical-chemical environment for the Project area is described within a
radius of between 5 km from the boundary of the Project depending on the relevant
component. The description of the physical-chemical environment is based on
primary data supported by available published secondary data as detailed in Table
6.1.
Table 6.1 Details of data collection for physical-chemical environment.
Component Type of Data
Source Date of Collection
Coastal Hydraulic
Primary Numerical models calibrated with site surveys of water levels and current speeds
• ADCP 1: 15 to 31 October 2015
• ADCP 2: 15 to 31 October 2015
• ADCP 3: 5 to 26 October 2017

Existing Environment
6-6 62801461-RPT-105
Component Type of Data
Source Date of Collection
• ADCP 4: 5 to 25 October 2017
Bathymetry Primary Site survey • October 2015
• April 2018
Hydrology and hydrogeology
Secondary Mapping using satellite image and verified by site observations
• Base map – year 2019
• Site observations 8 April 2019 and 28 June 2019
Coastal Morphology
Imagery Satellite and published papers
Historical satellite images sourced from GoogleEarth Pro.
Water Quality
Primary and secondary
• 11 sampling stations sampled twice at three depths
• Secondary data from DOE sampling stations and FIA study.
• Neap and spring ebb tides in September and October 2017;
• Secondary data from neap and spring ebb tides on 12 March, 20 March 2019 and 29 Sept 2017
• Spring ebb: 4 October 2017
Air Quality Primary 6 sampling stations 24 to 30 October 2017
Ambient Noise
Primary 6 sampling stations
Marine Sediment
Primary Grab sample October 2017
6.2.1 Coastal Hydraulics
6.2.1.1 Water Levels
The water level regime along the Terengganu coastline is complex, being primarily
influenced by the convergence of three tidal regimes, namely:
• The South China Sea tide which propagates NE to SW;
• The Gulf of Thailand tidal system; and
• The tide propagating from the Java Sea.
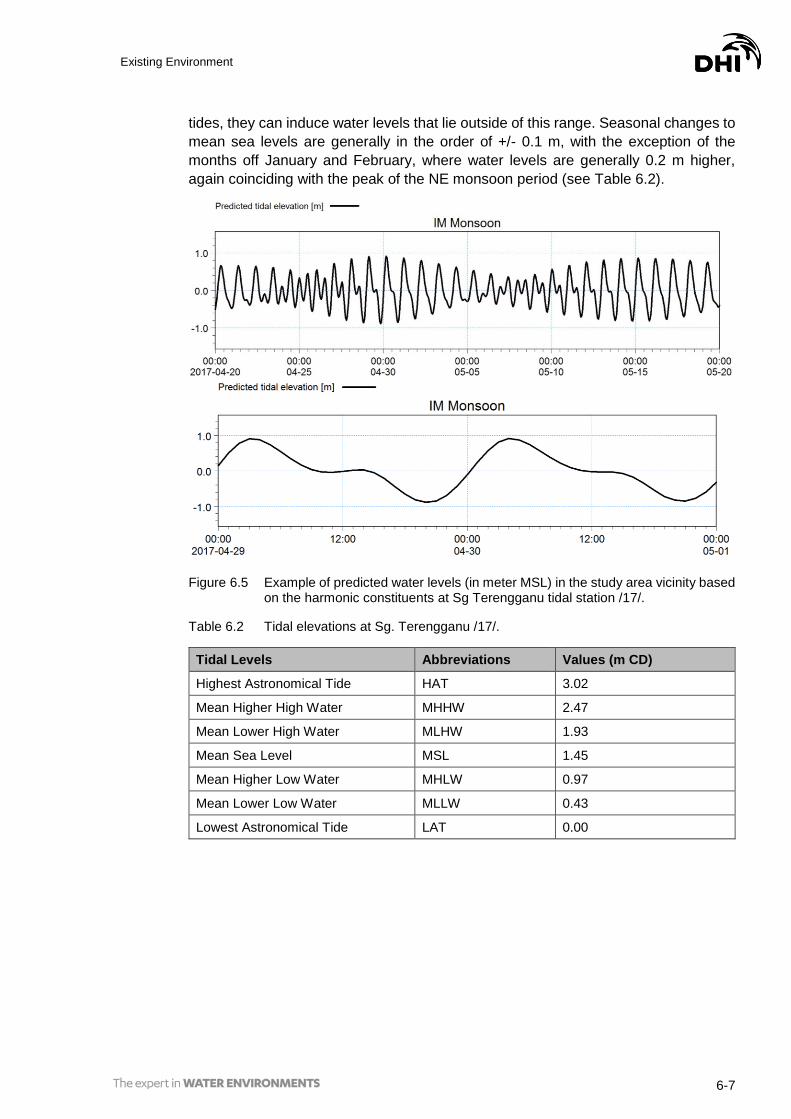
An illustration of predicted water levels in the study area based on the tidal harmonic
components derived from the Sg. Terengganu tidal station /17/ is presented in Figure
6.5. The tidal levels at the Project area corresponds to diurnal tides with one high
water and one low water in one day.
The typical spring tidal range (MHHW – MLLW) is in the order of 2.04 m and the
maximum range (difference between HAT and LAT) is 3.02 m as shown in Figure 6.5.
These values describe tidal effects produced by gravitational forces, induced primarily
by the moon and the sun, and do not include other effects as wind and barometric
pressure (induced by regional pressure fields). When these effects interact with the
Existing Environment
6-7
tides, they can induce water levels that lie outside of this range. Seasonal changes to
mean sea levels are generally in the order of +/- 0.1 m, with the exception of the
months off January and February, where water levels are generally 0.2 m higher,
again coinciding with the peak of the NE monsoon period (see Table 6.2).
Figure 6.5 Example of predicted water levels (in meter MSL) in the study area vicinity based on the harmonic constituents at Sg Terengganu tidal station /17/.
Table 6.2 Tidal elevations at Sg. Terengganu /17/.
Tidal Levels Abbreviations Values (m CD)
Highest Astronomical Tide HAT 3.02
Mean Higher High Water MHHW 2.47
Mean Lower High Water MLHW 1.93
Mean Sea Level MSL 1.45
Mean Higher Low Water MHLW 0.97
Mean Lower Low Water MLLW 0.43
Lowest Astronomical Tide LAT 0.00

Existing Environment
6-8 62801461-RPT-105
Table 6.3 Seasonal changes to mean level in the study area vicinity based on the Sg Terengganu tidal station /17/.
Month Changes to mean level (m)
Month Changes to mean level (m)
January +0.2 July -0.1
February +0.2 August -0.1
March +0.1 September -0.1
April 0.0 October 0.0
May -0.1 November +0.1
June -0.1 December +0.1
6.2.1.2 Currents
Hydraulic modelling of water levels and ocean current flows at the site using a two-
dimensional (2D) numerical model (MIKE 21 FM HD)3, showed the flow pattern in the
study area is streamlined, with currents flowing towards the south (Figure 6.6) under
tidal flood conditions and towards the north during ebb tides (Figure 6.7).
The mean and maximum currents calculated over a 28-day period for the different
seasons are shown in Figure 6.8 and Figure 6.9. They indicate similar speeds during
the monsoons, but lower speeds during inter-monsoon conditions. Modelled currents
for the existing conditions show mean current speeds up to 0.16 m/s, with maximum
current speeds reaching up to 0.4 m/s at the Project area.
3 All modelling in this report was undertaken in accordance with the Department of Irrigation and Drainage (DID) guidelines for numerical modelling.

Existing Environment
6-9
Figure 6.6 Snapshot of predicted current flow conditions during NE monsoon - spring flood tide.
Figure 6.7 Snapshot of predicted current flow conditions during NE monsoon - spring ebb tide.

Existing Environment
6-10 62801461-RPT-105
Figure 6.8 Snapshot of predicted mean current speed over 28-days simulation during NE (top), SW (middle) and inter-monsoons (bottom).

Existing Environment
6-11
Figure 6.9 Snapshot of predicted maximum current speed over 28-days simulation during NE (top), SW (middle) and inter-monsoons (bottom).

Existing Environment
6-12 62801461-RPT-105
6.2.1.3 Wave Conditions
The wave climate offshore of Kuala Terengganu is composed of locally generated
short period wind waves and longer period swell waves from the South China Sea.
The Mike 21 Spectral Wave Model was used with 10-years (2006 to 2015) of Climate
Forecast System Reanalysis (CFSR) wind data to estimate the wave propagation
processes in the study area. Results of the model were used to extract significant
wave height, wave direction and wave periods.
The correlations between the offshore and the nearshore wave conditions was
established for selected locations along the coastline of Kuala Terengganu as
illustrated in Figure 6.10. The predominant wave directions are northeast and
southeast, with the significant wave height generally less than 2 m.
Analysis of the mean and maximum wave heights during the simulation period for the
seasonal conditions indicate significantly higher waves are experienced during the
NE monsoon compared to the SW and inter-monsoon conditions as shown in Figure
6.11 and Figure 6.12.
Figure 6.10 Extraction point of wave roses at offshore of Terengganu coastline.

Existing Environment
6-13
Figure 6.11 Predicted mean significant wave height over 28-days simulation during NE (top), SW (middle) and inter-monsoons (bottom).

Existing Environment
6-14 62801461-RPT-105
Figure 6.12 Predicted maximum significant wave height over 28-days simulation during NE (top), SW (middle) and inter-monsoons (bottom).

Existing Environment
6-15
6.2.2 Coastal Morphology
As mentioned earlier, the coastal region of Terengganu is largely formed of sandy
beaches which are dynamic in nature; however these natural coastal changes have
been exacerbated by man-made changes from coastal structures as has been
discussed in detail by Ariffin et al. (2018) /15/ (Figure 6.1). While these studies have
established a strong framework for understanding the regional context for the coastal
morphology and the associated changes in erosional risk it was considered important
to look specifically at changes over time in relation to the Project site.
Figure 6.13 Results of a study identifying areas of net erosion, stability, or accretion along the Terengganu coastline. Note that the Project site south of the airport is characterised as partially accreting and further to the south is considered stable (abstracted from Ariffin et al. (2019)).
The coastal morphology and erosion risk assessment was carried out based on:
• Historical google earth images;
• Modelling works to calculate the wave induced sediment transport (littoral drift);
and
• Other information such as National Coastal Erosion Study for Malaysia 2015
(NCES 2015), Terengganu Local Plan and published papers.
The shoreline analysis has been carried out and is presented for three main areas:
• Coastline immediately north of Sultan Mahmud Airport runway extension;
• Coastline in between Sultan Mahmud Airport runway extension and KT
breakwater; and
• Coastlines immediately south of KT breakwater.
6.2.2.1 Coastline Immediately North of Sultan Mahmud Airport runway extension
As of 2008, after the extension of the airport runway, this area has experienced
significant erosion. Figure 6.14 shows the coastlines north of the airport runway
extension in 2008 where an initial deficit has led to a loss of coastline between 2008
and 2013. At its worst in 2011, the erosion caused the collapse of the coastal road
and in January 2016, large waves also wreaked havoc causing large coastal erosion.

Existing Environment
6-16 62801461-RPT-105
Protection works carried out by JPS along the UMT shore (designed and constructed
in 2016) together with the Tok Jembal breakwaters have stabilized this stretch of
coast, however, erosion still persists north of the protected area and this is referenced
in the NCES 2015 report that indicates critical erosion.
Figure 6.14 Historical satellite images, for Jul 2008, Aug 2011, Sep 2014 and Aug 2017. The green line denotes the vegetation line digitised from imagery dated Aug 2017. (Source: Google Earth Pro).
6.2.2.2 Coastline Between Sultan Mahmud Airport Runway Extension and KT Breakwater
This stretch of coast is located between the airport extension reclamation and the
Kuala Terengganu breakwaters, both of which have blocked the sediment movements
from this location to neighbour areas and therefore acting as an independent coastal
cell. Overall the area is stable, particularly the northern end, however the southern

Existing Environment
6-17
part experiences some shoreline changes over time due to the sheltering effect of the
northern KT breakwater during different monsoon seasons. As a mitigation measure
of this erosion and as part of the KT breakwaters design, an offshore detached
breakwater has been built and this has mostly stabilized this stretch of coast. The
NCES carried out by JPS in 2015 /18/ shows that the northern parts of this cell are
stable, and the southern part show shoreline changes expected to happen during the
monsoon seasons.
It should be noted that in 2018, along the southern end of this coastal area, a new
coastal road known as the Jalan Pantai Teluk Ketapang with a length of approximately
3.9 km was constructed with the objective to provide a direct connectivity and reduce
the travel time between KTCC and KT airport. Along the southern part of this new
coastal road, the setback from high water mark is less than 60 m and therefore the
road could suffer erosion during monsoon conditions. To stabilize this area and
protect the road, construction of a rock revetment and artificial sand nourishment is
presently being carried out.
Figure 6.15 Historical satellite images for Aug 2017 and Dec 2018. The blue line denotes the vegetation line digitised from imagery dated Dec 2018. (Source: Google Earth Pro).
6.2.2.3 Coastline Immediately South of KT Breakwater
Although showing some inter-annual variability, this stretch of coastline is seen to be
stable or slightly accreting since 2012 (see Figure 6.16).

Existing Environment
6-18 62801461-RPT-105
Figure 6.16 Historical satellite images Jul 2017 and Dec 2018. The blue line denotes the vegetation line digitised from imagery dated Dec 2018. (Source: Google Earth Pro).
6.2.2.4 Conclusions
A detailed assessment of the historical shoreline changes along the coastline from
Sultan Mahmud Airport runway extension to KT breakwater was undertaken that was
complemented with research works by Ariffin et al. (2019), which considered changes
from 1995 to 2016 for the region. The
analysis shows that the area north of
the airport extension has been
protected and is now stable, and the
coastal cell of the Project area is also
stable but subject to shoreline
changes during the different monsoon
conditions. The area south of KT
breakwaters consists of sandy stable
beaches. The area with critical erosion
is located north of the UMT coastline where JPS implemented coastal protection
works, this is indicated in the NCES 2015 as shown in Figure 6.17.
A summary of the present coastline status around the study area is presented in
Figure 6.18.
SHORELINE CHANGE TIMELAPSE
VIDEO
Scan this QR code to watch a timelapse of the shoreline change from 1984 – 2018. If your smartphone does not have a reader, download one at get.neoreader.com

Existing Environment
6-19
Figure 6.17 Average annual erosion from Kampung Batu Rakit to Kampung Aur, Kuala Terengganu, Terengganu. (Source: NCES 2015) – Red areas indicate critical erosion where infrastructure is at risk.

Existing Environment
6-20 62801461-RPT-105
Figure 6.18 Status of the study area coastline based on the present assessment.
6.2.3 Hydrology and Drainage
The Project is located adjacent to the trained river mouth of Sg. Terengganu, which
is the main river in the Sg. Terengganu basin originating from the upper watershed of
Kenyir Lake. The main tributaries flowing into Sg. Terengganu are Sg. Nerus, Sg.
Telemung, Sg. Berang and Sg. Tersat with a total catchment area of approximately
5,000 km2.
Monthly minimum, averaged, and maximum discharge rates for Sg. Terengganu have
been obtained from DID data from year 1960 to 2000 from a stream gauge located
roughly 35 km upstream Sg. Terengganu (Sg. Terengganu at Kg. Tanggol) as shown
in Figure 6.19.

Existing Environment
6-21
Figure 6.19 River discharge rates based on data collected from the year 1960 to 2000 at station Sg. Terengganu at Kg. Tanggol – 5130432. (Source: JPS).
Flooding occurs in the Terengganu during most years primarily during the Northeast
monsoon. In recent years, Terengganu has experienced short major rainfalls, which
caused flash floods. Among the worst hit places in recent years is Hulu Terengganu,
whereby on 1 January 2017, Sg. Nerus and Sg. Telemong recorded a significant rise
in river water levels /19/. On 30 November 2016, some areas in Kuala Terengganu
were also hit by flash floods following a 247 mm rainfall in 24 hours /20/.
Figure 6.20 shows the areas vulnerable to floods identified in the Kuala Terengganu
Local Plan 2010. Flooding areas reported by respondents to the socioeconomic
survey for the present EIA conducted in 2019 are also shown in Figure 6.20 and are
consistent with the flood prone area as reported in the Local Plan 2020.
The flooding in the hinterland of the reclamation area is mainly caused by increased
water levels in Sg. Terengganu and its tributaries that runs parallel to the shoreline
/21/.

Existing Environment
6-22 62801461-RPT-105
Figure 6.20 Flood prone areas identified in the Kuala Terengganu Local Plan 2010. It can be seen that these flood prone areas drain inland to Sg Terengganu. The airport drainage outlets are located to the north and south of the airport.
Three discharge outlets draining runoff from the airport runway are located along the
shoreline, two draining northwards away from the reclamation area and one located
on the south side of the airport runway extension draining into the reclamation area
(see Figure 6.20 and Photo 6.1). In terms of overall drainage for the airport this
discharge outlet deals with only a relatively small area of the airport.
Three soakaways4 are also located along Pantai Teluk Ketapang (Photo 6.2 and
Photo 6.3). Their locations are as per Figure 6.21. These soakaways drain the areas
hinterland of the shoreline.
4 A soakaway is a pit into which waste- or in this case, storm-water is piped so that it drains slowly out into the surrounding soil.

Existing Environment
6-23
Photo 6.1 Sultan Mahmud Airport’s drainage outlet, draining into the reclamation area.
Photo 6.2 Soakaway No. 1 located by the roadside northern shoreline of Pantai Teluk Ketapang.