Embed Size (px)
Citation preview
Temporary contracts’ transitions: the role of trainingand institutions
Sara SerraBanco de Portugal
July 2015
AbstractDespite recent reforms, labour market segmentation is still a marked feature of severalEuropean countries. This work empirically analyses transitions out of temporary contracts,by means of a discrete duration model, with a particular focus on human capital features,labour market protection and their interaction. Transitions to open-ended contracts withthe same or with a new employer are considered separately, as well as transitionsto joblessness, based on data for ten European countries taken from the EuropeanCommunity Household Panel. Firm-training significantly increases the likelihood oftransitioning to an open-ended contract with the same employer, but not in countries withmore segmented labor markets. In these countries, instead, educational attainment andlabour market flexibility are more important determinants of transitions to open-endedcontracts. Interestingly, in these countries, firm training actually mitigates the positive (andsignificant) impact of labor market flexibility on the likelihood of transitioning to an open-ended contract with the same employer. (JEL: E24, J24, J41)
Introduction
Despite recent reforms, labour market segmentation, characterized by strongdifferences between temporary and open-ended contracts, namely as regardsemployment protection, is still a marked feature of several Europeancountries.1
Acknowledgements: I thank Pedro Portugal and Francesco Franco for their comments and usefuldiscussions on the working paper on which the present article was based. I am also grateful toCarlos Robalo Marques, Isabel Horta Correia, Nuno Alves and Pedro Amaral, as well as to theparticipants in a seminar from the Economic Research Department of Banco de Portugal.The opinions expressed in this article are those of the authors and do not necessarily coincidewith those of Banco de Portugal or the Eurosystem. Any errors and omissions are the soleresponsibility of the authors.E-mail: [email protected]. According to the definition of the International Labour Organization, labour marketsegmentation consists in the division of the labour market into separate submarkets or segments,distinguished by different characteristics and behavioural rules. Segmentation may arise,inter alia, from particularities of labour market institutions, such as governing contractualarrangements.

22
A large part of the literature on this topic has focused on transitions fromtemporary to permanent jobs and on the ability of the former to serve ascareer stepping stones. In particular, a number of papers focus on firm andworker characteristics that favour the conversion of a temporary contractinto an open-ended (permanent) one (Portugal and Varejão (2009), Amuedo-Dorantes (2000), D’Addio and Rosholm (2005), etc.). Other studies havefocused instead on the impact of labour market institutions on transitionsfrom temporary to permanent (Kahn (2010), Centeno and Novo (2012)) or job-to-job mobility among permanent workers (Gielen and Tatsiramos (2012) andOrsini and Vila Nuñez (2014) among others). Less explored in the literature isthe connection between training decisions and transitions, even though labourmarket segmentation may imply that temporary workers receive less training,which can have a longer term impact on the skill level of the economy,given that these workers may become trapped in cycles of low productivityjobs, with a consequent effect on output. Even less explored in the literatureis the interaction between labour market institutions, namely employmentprotection legislation (EPL), and training decisions (Bassanini et al. (2005)suggest that there is a negative impact of EPL on temporary contracts ontraining incidence). This work tries to analyse the impact of the interactionbetween labour market regulations and training decisions on labour markettransitions for workers holding temporary contracts. This issue has relevantimplications for the definition of both labour market and training policies.
The analysis in the current work is an empirical exercise, based on a panelof survey data for European countries, the European Community HouseholdPanel (ECHP). The modelling approach is based on a semi-parametric discreteduration model with the aim of accessing how the probability of transition toother labour market states evolves over the duration of a temporary contract.This analysis is disaggregated into transitions within the same firm (intra-firm transitions) and to other firms (inter-firm transitions). This distinction oftransitions according to employer type is motivated by the fact that trainingmay play a role on the type of transition obtained. In addition, in the caseof inter-firm transitions, reasons to quit a job may be substantially differentfor temporary and permanent workers. In the case of temporary workers thismovement may result from the expectation of contract non-renewal or non-conversion. In fact, according to the data used in this study, the reasons thatlead to the end of a temporary and a permanent job are somewhat different,given that for the former the legal limit of the contract assumes substantialrelevance.
The results presented in this article show that interactions betweentraining and labour market regulations influence transitions to permanentcontracts. Moreover, the distinction between intra and inter-firm transitionsmatters as regards the relative importance of the determinants. For transitionsto a permanent job with the same employer, the characteristics of the firmappear to be the most relevant feature, while for inter-firm transitions, the

23
characteristics of the worker seem to be more relevant. Moreover, being in atraining firm insulates to some extent temporary workers from the impact ofchanges in labour market protection.2 The breakdown of results across twocountry groups shows that this latter result stems from segmented labourmarkets. In these economies, higher labour regulation flexibility increases theprobability of all types of transitions considered. However, the size of thisresponse is mitigated in some cases for employees of training firms, whichare therefore insulated to some extent from the effects of changes in labourmarket regulation. In countries with less segmented labour markets, aspectsrelated to training appear to be more relevant than institutional ones, withfirm training favouring transitions to an open-ended contract with the sameemployer, while reducing the probability of transitions to joblessness.
Data and descriptive analysis
Data
The European Community Household Survey is an harmonized longitudinalsurvey covering fifteen European Union member states (Belgium, Denmark,Germany, Greece, Spain, France, Italy, Ireland, Luxembourg, The Netherlands,Portugal, United Kingdom, Austria, Finland and Sweden) and comprisingeight waves (from 1994 to 2001) for the majority of countries. The surveyis carried out by national data collection units and coordinated by theStatistical Office of the European Union (Eurostat). The longitudinal natureand standardized methodology and questionnaire are advantages of thisdatabase, which allows for the analysis of individual transitions and cross-country comparisons. However, it has the disadvantage of being relativelyoutdated, and therefore not capturing the impact of policy changes thathave taken place in recent years. Notwithstanding, as will be argued bellow,the broad situation as regards labour market segmentation has not changeddramatically since the period of the survey. The main reason for the choiceof the database is the availability of questions regarding training incidence,duration, and nature, as well as firm training choices. However, for estimationonly part of this information could be used due to sample size limitations.
Some countries were excluded from the database due to data coverageissues (Germany, Luxembourg, UK, France and Sweden). The sample wasfurther restricted to dependent employees working more than 15 hoursper week and included in the survey for at least two consecutive years.
2. The term "training firm" is used to define a firm that offers benefits related to training to itsworkers. The exact wording of this question in the ECHP is "Does your employer provide freeor subsidised services or benefits to employees in any of the following areas?", with one of theoptions considered being education and training.

24
Employment status is consistent with the International Labour Organizationstandards. Data from the first wave of the survey could not be used, given thatinformation on the type of contract held by the worker is only available fromwave 2 onwards. Furthermore, only observations in which workers state beingin a permanent contract or in a fixed or short-term contract are considered.3
In addition, the treatment of duration prior to the beginning of the surveyrestricts the sample to those observations for which information on year andmonth of start of the current job is available. In the case of agents whichrecorded multiple transitions from a temporary contract to one of the riskstates, only the first transition is considered. Individuals which have reportedhaving permanent jobs prior to a temporary contract have also been excludedfrom estimation.
Finally, the sample is restricted by the availability of information on theregressors considered. These comprise firm characteristics, including sector ofactivity, provision of training to employees and number of employees in theproduction unit of the worker. Worker characteristics used as controls includegender, age, highest level of general or higher education completed (ISCED4
level), job satisfaction5 and attendance of education or training in the recentpast. Job and career information like duration of current job and the numberof temporary contracts held prior to the current one is also considered. Theavailable sample comprises 8947 observations and 5910 individuals after theseconditions are satisfied.
To control for the evolution of labour market protection over timeat country level, the indicator related to labour legislation included inthe International Institute for Management Development (IMD) WorldCompetitiveness Yearbook is used. IMD is an yearly assessment of countrycompetitiveness, which includes the results of an executive opinion surveyon several issues, including whether labour regulations hinder businessactivities. An increase in the indicator implies an increase in flexibility oflabour market regulation. This indicator has the advantage of having a timeseries interpretation (Antunes and Centeno (2007)) and more time variabilitythan the commonly used OECD EPL indicator. It also has a scope which is
3. The exact wording of this question is “What type of employment contract do you have inyour main job? Please indicate which of the following best describes your situation." The optionsavailable for answer are: permanent employment, fixed-term or short-term contract, casual workwith no contract and some other working arrangement.4. ISCED is the acronym for the International Standard Classification of Education, providedby the United Nations Educational, Scientific and Cultural Organization (UNESCO).5. The indicator on job satisfaction consists of an average of the evaluation of workersregarding several aspects of their job. The exact wording of the question is “How satisfied areyou with your present job or business in terms of earnings, hours of work, working conditionsetc." and the topics considered are earnings, job security, type of work, number of working hours,working time, working conditions/environment and distance to job/commuting. A highervalue implies higher satisfaction, from 1 (not satisfied) to 6 (fully satisfied).

25
broader than EPL, and relates to actual enforceability of regulations, insteadof simply legislative changes like the OECD indicator. The main drawback ofthe IMD indicator is that it does not allow for a separate analysis of the impactof labour regulations affecting temporary and permanent contracts.
The analysis is developed for the overall sample and for two countrysubgroups, in order to control to what extent results are driven by moresegmented labour markets, where temporary contracts share a relativelysimilar institutional framework. Group M (more segmented labour markets)is composed of Spain, Portugal and Italy, while group L (less segmentedlabour markets) contains the remaining countries. This partition was adoptedbecause countries in group M are among those with highest share oftemporary contracts in employment at the time of the ECHP survey, andhave maintained that status in recent years (Table 1).6 In addition, thesecountries implemented two-tier labour market reforms over the 80’s and 90’s(Boeri (2011)), maintaining however strict average levels of labour marketprotection (OECD (2013)). Table 2 shows that the relative ranking of thecountries regarding labour market regulations strictness measured by theIMD indicator has not changed substantially since the ECHP survey period.In addition, group M countries are among those in the European Union withlowest training incidence (Bassanini et al. (2005)). This evidence, along withthe one in Table 1, suggests that the fact that the ECHP data extends onlyto 2001 may not be critical for the analysis of this work, given that the mainfeatures under analysis have not changed fundamentally since then.
Descriptive analysis of the data
Table 3 shows how the employment structure described in Table 1 translatesinto temporary worker flows for the sample considered.7 About half ofthe workers change state after one year, and a large share of workersobtain a permanent contract each period, the majority of which with thesame employer. One distinctive feature is that while the share of temporaryworkers that is promoted to a permanent job with the same employer isrelatively stable across countries (ranging from about 17% to 33%), the shareof workers that transition to open-ended contracts with a new employer ismore heterogenous. In fact, the share of inter-firm transitions is lower forcountries with a higher share of temporary workers, which also show a higher
6. The temporary employment concept in the OECD data used to compute the composition ofemployment in recent years is more encompassing than the fixed-term aggregate in the ECHP.However, based on data from the two databases for 2000-2001, the employment share definedby fixed-term plus other temporary contracts in the ECHP is very comparable to the OECDaggregate, with differences of less than five percentage points.7. Because these are annual flows, some intra-anual transitions (from temporary employmentto joblessness and back to temporary employment, for example) are not accounted for.

26
1995-2001 2008-2012
Country permanent fixed-term none other temporaryemploymenta
Spain 64.1 29.7 3.8 2.4 25.7Finland 84.2 13.5 1.7 0.5 15.3Portugal 80.0 10.6 3.3 6.1 22.1Belgium 89.1 8.8 0.4 1.6 8.3Greece 76.8 8.6 14.0 0.6 11.5Italy 86.9 7.9 3.2 2.0 13.1Ireland 82.1 6.1 8.7 3.1 9.4Denmark 88.3 5.6 5.5 0.6 8.6Austria 91.7 4.9 0.4 3.0 9.2Netherlands 89.4 3.3 0.7 6.6 18.6
TABLE 1. Composition of employment by contract type
Notes:a Share in dependent employment, OECD data. Data sorted in descending order by shareof fixed-term contracts in 1995-2001.Sources: ECHP and OECD.
1995-2001 2008-2012
Italy 2.4 3.7Belgium 3.1 3.3Spain 3.4 3.4Portugal 3.9 3.9Austria 4.1 5.4Greece 4.2 3.6Netherlands 4.5 4.4Finland 4.6 5.0Ireland 5.9 5.2Denmark 7.6 8.1
TABLE 2. IMD- Labour regulations indicator
Notes: Data sorted in ascending order by 1995-2001 values. A higher value of the indicatorimplies higher perceived flexibility in the economy.Source: IMD World Competitiveness Online.
percentage of transitions into joblessness (unemployment plus inactivity).This evidence suggests that there is a margin for use of temporary contractsthat is similar across countries (possibly related to temporary labour needsfrom firms), but another one which is more variable. In addition, there is someoverlapping of countries with a low share of inter-firm transitions and withstrict labour regulations as measured by the IMD indicator.
Table 4 shows the descriptive statistics for the sample used, whichillustrate the main differences between workers that experience intra andinter-firm transitions and also transitions into joblessness. These statisticscorrespond to the sample averages of all the individual level variables usedin estimation. With the exception of age, for time-varying variables the laggedvalues were considered (see Section Transitions out of temporary employment formore details).

27
Country RemainTemporary
Intra-firmtransition
Inter-firmtransition Joblessness Observations
Spain 56.2 17.5 4.3 22.1 3917Portugal 54.2 24.8 6.6 14.5 1361Finland 45.6 16.7 8.5 29.2 945Greece 53.9 18.0 8.8 19.4 434Italy 44.1 20.2 10.3 25.4 891Belgium 51.0 26.8 12.1 10.1 298Austria 36.7 33.3 14.4 15.5 264Ireland 39.2 26.5 18.0 16.3 245Denmark 34.8 23.3 21.5 20.4 270Netherlands 39.8 17.7 25.8 16.8 322Total 51.0 20.0 8.1 20.9 8947
Observations 4562 1791 726 1868 8947
TABLE 3. Transitions from temporary jobs
Note: Data sorted in ascending order by share of transitions to a job with a new employer.Source: ECHP.
Table 4 shows that workers that undergo inter-firm transitions tend tobe younger and have higher education levels. These workers also receivedtraining in the period prior to transition in higher proportion than thosethat experienced intra-firm transitions. These features suggest that a separateanalysis of intra and inter firm transitions may be relevant. Other distinctivefeatures are that workers experiencing the first temporary contract recordedin the survey are much more likely to make a transition than those whichhad at least one previous temporary contract, and this reflects in particulartransitions to joblessness. Transitions to joblessness are made by workers witha higher average age and a lower education level than those going to otherstates. These workers are also mostly female and work in production unitsthat are on average smaller and less likely to provide training. Regarding thecomparison between country groups M and L (results available upon request),workers in the latter have on average a higher education level. The incidenceof firm-provided training is also higher in this country group.
Modelling approach
The dependent variable considered in estimation is the time elapsed since theadmission into a fixed-term contract with a given employer.8 Given the annualfrequency of the survey, a discrete duration model was adopted.
8. For estimation purposes no distinction is made between contract and job, i.e., renewals orother contractual changes are not accounted for when they do not imply a change in the type ofcontract declared in the ECHP (permanent, fixed-term, no contract or other arrangement).

28
Variable Overall Remaintemporary
Intra-firmtransition
Inter-firmtransition Joblessness
Duration in months:]0, 3[ 0.20 0.18 0.13 0.25 0.28[3, 6[ 0.15 0.14 0.10 0.15 0.20[6, 9[ 0.10 0.10 0.09 0.12 0.11[9, 12[ 0.08 0.07 0.08 0.09 0.08[12, 15[ 0.11 0.11 0.13 0.11 0.10[15, 18[ 0.08 0.08 0.09 0.06 0.06[18, 21[ 0.05 0.05 0.06 0.04 0.04[21, 24[ 0.04 0.04 0.05 0.03 0.02[24, 30[ 0.08 0.09 0.10 0.06 0.05≥ 30 0.12 0.14 0.17 0.08 0.05
First job 0.58 0.39 0.75 0.77 0.80Not first job 0.42 0.61 0.25 0.23 0.20
Age [16,30[ 0.54 0.53 0.54 0.60 0.53Age [30,45[ 0.33 0.35 0.35 0.32 0.29Age [45,65] 0.13 0.13 0.12 0.08 0.18
Firm size <20 workers 0.48 0.46 0.48 0.44 0.54Firm size 20-99 workers 0.28 0.30 0.27 0.26 0.27Firm size >99 workers 0.24 0.24 0.25 0.29 0.19
Secondary education or more 0.53 0.52 0.58 0.64 0.47Less than secondary education 0.47 0.48 0.42 0.36 0.53
Training worker 0.34 0.32 0.33 0.44 0.34No training worker 0.66 0.68 0.67 0.56 0.66
Training firm 0.24 0.24 0.30 0.31 0.18No training firm 0.76 0.76 0.70 0.69 0.82
Training worker+firm 0.15 0.14 0.18 0.21 0.11Training worker+no training firm 0.18 0.17 0.15 0.22 0.24
No training worker+training firm 0.09 0.09 0.12 0.10 0.07No training worker+no training firm 0.57 0.59 0.55 0.47 0.59
Men 0.52 0.54 0.52 0.54 0.47Women 0.48 0.46 0.48 0.46 0.53
Agriculture 0.04 0.05 0.02 0.03 0.06Industry 0.33 0.34 0.35 0.30 0.29Services 0.63 0.62 0.63 0.67 0.65
Private sector 0.73 0.72 0.77 0.73 0.71Public sector 0.27 0.28 0.23 0.27 0.29
Job satisfaction 3.88 3.85 4.00 4.01 3.77
Observations 8947 4562 1791 726 1868
TABLE 4. Descriptive statistics - Overall Sample
Note: the statistics presented are the average proportion of the sample corresponding to eachcategory, with the exception of job satisfaction, for which the average sample value is reported.Source: ECHP.

29
Each period, the length of a spell, in this case of a temporary contract, isexpressed as a random variable T , with an associated cumulative distributionfunction F (t). The elapsed time since the beginning of the spell is given by thesurvivor function S(t) = 1− F (t).
In a discrete duration setup in which data is grouped, i.e., in whichthe underlying process is inherently continuous but observed in at discretefrequency, time is aggregated into intervals of the type ]ai, aj ] where ai ∈{0, 1, ...aj−1} and aj ∈ {1, 2, ...∞}. In that case, the hazard rate correspondsto the probability that a spell ends before aj , given that it lasted up until aj−1:
h(aj) = Pr(aj−1 < T ≤ aj |T > aj−1)⇔
h(aj) = 1− S(aj)
S(aj−1).
(1)
The duration is modeled by assuming a proportional hazard model, whereh0(t) represents the baseline hazard function, λt the proportional changesimplied by different values of the covariates Xt and v is an unobservableindividual effect, assumed to be a random variable with unit mean, finitevariance and independently distributed from t and X, that only assumespositive values:
h(t,Xt|v) = h0(t)λtv. (2)
The modeling approach followed was a complementary log-log (cloglog)specification, which corresponds to the discrete time representation of aproportional hazard model with grouped data (see Jenkins (2005) for a proof).In that case, the hazard rate of the discrete process can be specified as:
h(aj ,Xt) = 1− exp[− exp(β′Xt + γj + u
)]. (3)
where γj is the log of the difference between the integrated continuoustime baseline hazard corresponding to the continuous process which is onlyobserved at discrete intervals, evaluated at the extremes of the interval]aj−1, aj ], X is the vector of (possibly) time varying covariates and u = ln(v).The baseline hazard is assumed to be constant over a given interval.
A competing risk approach is adopted that takes into account threemutually exclusive possible modes of exit from temporary employment: beingpromoted to a permanent contract with the same employer, obtaining anopen-ended contract with a new employer or joblessness (unemployment orinactivity). A latent duration variable is associated with each exit mode froma temporary job, and only the minimum of the latent failure times, if any,is observed. For simplicity, competing risks are assumed to be independent.Moreover, transitions are assumed to occur at the limits of intervals, i.e., at themoments the survey takes place, which allows the model to simplify to threesingle cause hazard models (Portugal and Varejão (2009)).

30
Estimation Results
Transitions out of temporary employment
Overall Sample. Table 5 presents the results of the estimation of the competingrisks duration model for transitions out of temporary employment. Robuststandard errors (in order to correct for potential error heteroskedasticity) arepresented in parenthesis.
One note on coefficient interpretation: in a continuous proportional hazardmodel, the exponential of the coefficients can be interpreted as hazard ratios,the relative change in the hazard rate when a covariate changes by oneunit. Given that the cloglog model corresponds to the discrete version ofa continuous proportional hazard model, the exponential of coefficients inTable 5 can be interpreted as the hazard ratio of the corresponding continuousmodel. Therefore, a positive (negative) coefficient associated with a givencovariate will imply that an increase in that covariate corresponds to a higher(lower) hazard than for the reference (omitted) category.
For the estimated models presented in this article, a non-parametricapproach was followed as regards the estimation of the baseline hazard rate,with dummies representing regular intervals of duration of the temporaryjob. These durations are measured at the beginning of intervals, thereforecorresponding to the minimum duration of the temporary job. Therefore, thelast dummy included covers minimum durations above 2.5 years. Due to legallimitations on the maximum duration of a temporary contract, closed intervalsabove that duration would lead to the exclusion of some countries from thatparameter estimation sample.
For time-varying variables (except age), lagged values were considered,not only to reduce potential regressor endogeneity issues, but also becausethat would be the only way to make models comparable by considering thecharacteristics of the departure state for all competing risks. For example, thetime frame of the question regarding training spans the whole year prior to theone of the survey, so a worker that has changed job in survey year t can reportin that survey training received either with his previous or current employer.9
In addition, the variable related to labour market flexibility (IMD indicator)is standardized across countries to facilitate the interpretation of interactioneffects.
Duration is measured using a combination of stock sampling (individualsthat are in a temporary contract when they started being observed in thesurvey) and flow sampling (individuals which enter the state of interestduring the period of the survey), to account for the fact that a large part
9. The exact question on training for survey year t is: Have you at any time since January ofyear t-1 been in vocational education or training, including any part-time or short courses?

31
VARIABLES Same employer Diferent employer JoblessnessDuration in months:[3, 6[ 0.1166 -0.1494 -0.1259*
(0.1003) (0.136) (0.0716)[6, 9[ 0.3739*** 0.0641 -0.4443***
(0.1041) (0.1485) (0.0867)[9, 12[ 0.4661*** -0.0594 -0.3885***
(0.11) (0.1682) (0.0981)[12, 15[ 0.8105*** 0.023 -0.3803***
(0.0972) (0.1554) (0.0934)[15, 18[ 0.8245*** -0.1668 -0.5726***
(0.1082) (0.1953) (0.1136)[18, 21[ 0.8404*** -0.0802 -0.6988***
(0.1207) (0.2311) (0.1352)[21, 24[ 0.9814*** -0.0497 -0.8167***
(0.1273) (0.2557) (0.1578)[24, 30[ 0.9655*** -0.0187 -0.6619***
(0.1135) (0.2071) (0.1214)≥ 30 1.1303*** 0.0702 -1.0957***
(0.1188) (0.1972) (0.1262)Not first job -0.9981*** -0.8352*** -1.3165***
(0.0623) (0.1164) (0.0726)Age [30,45[ 0.0744 -0.1477 -0.1858***
(0.0565) (0.1002) (0.0599)Age [45,65] -0.0508 -0.7493*** 0.1871**
(0.0813) (0.1716) (0.0734)Firm size 20-99 workers -0.0684 -0.075 -0.1170*
(0.0583) (0.1057) (0.0597)Firm size >99 workers -0.0506 -0.036 -0.2213***
(0.0628) (0.1135) (0.0708)Secondary education or more 0.2581*** 0.2398** -0.4864***
(0.0579) (0.1045) (0.0611)Training worker+firm 0.2361*** 0.3316** -0.5437***
(0.0838) (0.1457) (0.1023)Training worker+no training firm -0.1559** 0.2314* 0.1420**
(0.0775) (0.1211) (0.0695)No training worker+training firm 0.2769*** -0.0995 -0.2906***
(0.0829) (0.1666) (0.1046)IMD Labour market Regulations 0.3716*** 0.5968*** 0.1056
(0.0933) (0.1542) (0.1017)IMD Training worker+firm -0.3274*** -0.4309*** 0.0804
(0.0853) (0.1326) (0.1024)IMD Training worker+no training firm -0.157 -0.1361 0.0584
(0.0999) (0.1357) (0.0925)IMD No training worker+training firm -0.2424** -0.1548 -0.0877
(0.0969) (0.1488) (0.122)Men 0.0543 0.3433*** -0.2522***
(0.052) (0.0946) (0.0561)Industry 0.5451*** 0.2778 -0.2379**
(0.1588) (0.2641) (0.1163)Services 0.4418*** 0.3137 -0.1316
(0.159) (0.2577) (0.1141)Job satisfaction 0.1652*** -0.0132 -0.1845***
(0.0301) (0.0492) (0.0297)Private sector 0.5140*** 0.3343*** -0.2627***
(0.0704) (0.1111) (0.0659)Constant -3.6854*** -3.1474*** 0.7546**
(0.3635) (0.6032) (0.3581)
Observations 8,947 8,947 8,947Country dummies yes yes yesTime dummies yes yes yesρ 0.000145 0.433 0.127Log-pseudolikelihood -4078 -2277 -3972
TABLE 5. Transitions - Results for the overall sample
Notes:Robust standard errors in parentheses.*** p<0.01, ** p<0.05, * p<0.1.

32
of spells is left-censored (the temporary job has already started when theindividual enters the survey).
Results in Table 5, column 2, which refer to temporary workers who werepromoted to permanent with the same employer, show that the probabilityof intra-firm transition increases with the duration of the job, a commonresult in the literature (Portugal and Varejão (2009), Alba-Ramirez (1998) andothers), which supports the theory that a temporary job is an experience good(Jovanovic (1979)) with a screening objective. There is a peak of conversionsfor contracts that lasted more than two years and a half (this corresponds tothe legal duration limit of temporary contracts for some countries at that time,including Belgium, Denmark and Portugal (OECD (2004))). A similar result isfound for Spain by Guell and Petrongolo (2007). The fact that firms appear toexplore to some extent the legal limits of the temporary contracts suggests thatfirms take advantage of the lower (actual and potential) firing costs associatedwith this type of contracts while it is possible to retain the option value ofconverting the worker to a permanent position.
Workers that have higher formal education show a higher hazard ofpromotion to a permanent contract than their lower educated counterparts.The same is true for workers with temporary jobs in training-providingfirms, independently of whether the worker has actively taken advantageof that feature in the recent past, when compared to the reference category(employees which do not receive training and that work in firms that donot provide training to their workers). On the contrary, there is a significantnegative impact on the hazard for those workers which received training priorto transition while employed in a non-training firm.
The estimated models include regressors that control for the interactionbetween IMD and the firm-worker pairs training status. The correspondingestimated coefficients show that the positive net impact of an increase inlabour market flexibility measured by the IMD indicator is mainly relevant forworkers of non-training firms. That is, workers in training firms are somewhatinsulated from the negative impact that a strict labour market legislation willhave on transitions to a permanent contract. This is possibly related to thenature of the production process of the firm, given that a training investmentin a specific individual may imply expected productivity gains for that workerthat are more relevant for the contract conversion decision than the changesin the expected value of the job brought about by legislation changes.
Other significant coefficients signal that agricultural workers have alower hazard than their counterparts from other sectors of activity of beingpromoted to permanent with the same employer, which possibly reflects theseasonal nature of many of the jobs in agriculture. There is also a lower hazardof transitions for workers in the public sector when compared to those fromthe private sector. In addition, higher job satisfaction implies an increasedhazard of transition.

33
For inter-firm transitions (Table 5, column 3), duration dependence isnegative but not significant, and therefore there is no large difference in theprobability of leaving to obtain an open-ended with a new firm after only afew months of tenure or after two years.
As concerns human capital effects, both formal education and trainingfavour transitions to a permanent job with a new employer, independently ofwhether that training was obtained in a training firm (and thus has more likelya vocational nature) or not. However, the interaction coefficients between theIMD indicator and firm-worker training show that a change in labour marketflexibility has a low net impact on the hazard of workers that received trainingand which worked in training firms, possibly because these type of transitionsare more related to firm competition (another firm hiring a worker that hadvocational training in another firm in the same sector of activity) than tothe overall state of the labour market. Workers with all other training statustypes see the hazard associated to inter-firm transitions increase with less strictlabour market regulation.
Additionally, men have a higher probability than women of experiencinginter-firm transitions, in line with the findings by Booth et al. (1997) that jobquitting behaviour is more pronounced for this group. Older workers, on theother hand, have lower hazards than their younger counterparts, possiblybecause mobility costs increase with age (Winkelmann and Zimmermann(1998)), while benefits to hiring firms decrease, given that they have less timeto benefit from the new worker skills. Similarly to what happens for intra-firm transitions, private sector employees are also favoured in transitionsto a permanent contract with another employer vis-á-vis their public sectorcounterparts.
The view that a temporary job is an experience good is also supported bythe negative duration dependence found for transitions to joblessness (Table5, column 4), given that both the firm and the worker access the quality of thematch, and as the job progresses the probability that the match is found to bepoor decreases. Job duration and human capital determinants have an impacton transitions to joblessness that is to a large extent of symmetrical sign tothose in the model for intra-firm transitions. Namely, the hazard of transitionfrom a temporary job to joblessness declines with time, reaching the lowestpoint for durations longer than 30 months. As concerns the effects of humancapital variables, education and presence in a training firm reduce the hazardto non-employment, while having received training while working in a non-training firm increases it. However, the degree of labour market regulationstrictness does not have a significant effect on these transitions, independentlyof training status, which resonates with the unclear sign found in the literaturefor the impact of EPL on unemployment levels (see Boeri and van Ours (2013)and Blanchard and Portugal (2001), among others).
Smaller firms are more likely to originate transitions into joblessness,possibly because in these cases the end of the job is more directly connected

34
with the survival of the firm itself. The lower hazard of men into joblessnessis possibly associated with higher incidence of transitions of women intoinactivity due to family reasons. Being in the private sector implies a lowerhazard of transition into joblessness, which in addition to the previousresults regarding this regressor, indicates that private sector employees aremore likely to transition to permanent employment than their public sectorcounterparts.
It is worth mentioning that a complementary analysis (available onrequest) focusing on the overall number of temporary contracts held byworkers over the period of the sample by means of a count variable modelwas also performed. Given that some worker and firm characteristics favourtransitions to permanent employment and/or longer durations of temporarycontracts, these should consequently imply a lower count of temporarycontracts. The results of this exercise confirm some of the results of this section,namely regarding the impact of firm (like sector of activity or size) or firm-related characteristics (like job satisfaction) on transitions.
A feature which is common to the three competing destinations is thestrong and negative impact on the hazard of having had at least one previoustemporary contract. This regressor tries to control for initial conditions,limiting the sample problem of unavailability of the whole career history ofworkers. Having at least one previous temporary contract has a large negativeimpact on the hazard of leaving temporary employment, particularly troughjoblessness. This feature suggests that some workers may be trapped in asuccession of temporary employment cycles.
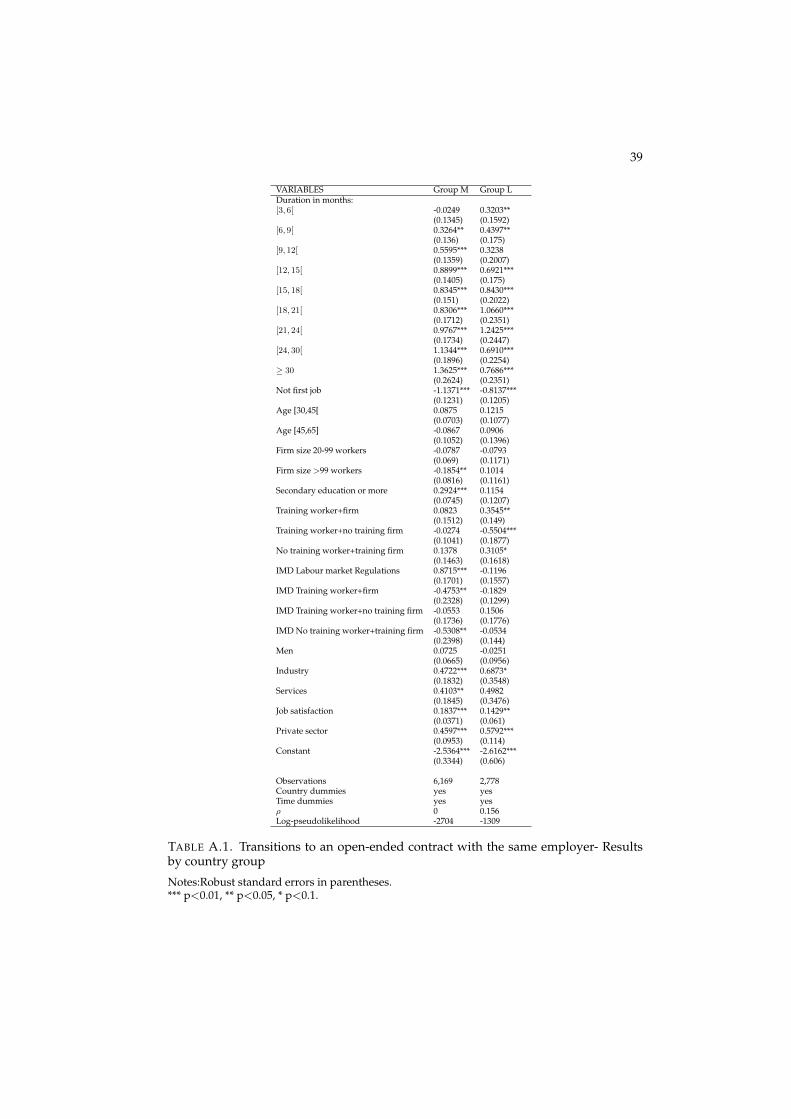
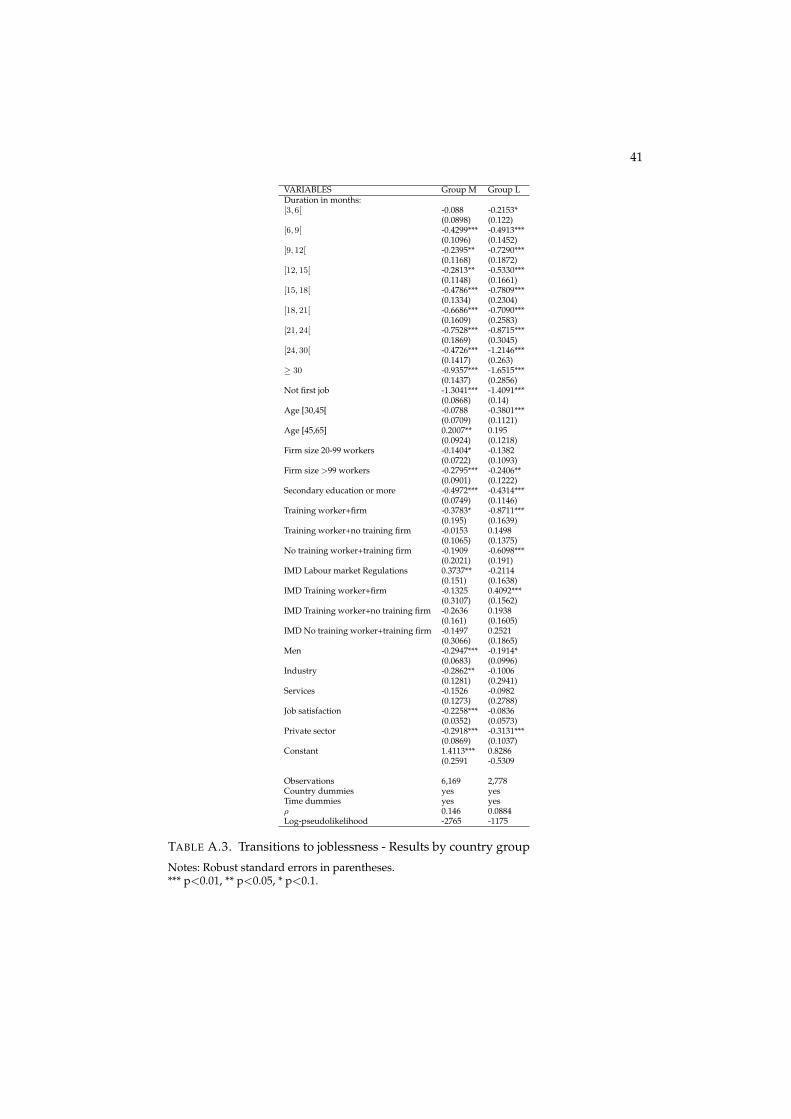
Results by country group. Tables A.1 to A.3 in the appendix show the resultsof the estimation of the competing risk models for country groups M (moresegmented) and L (less segmented). Although in many cases results arequalitatively similar for both groups, the significance or even the sign of somecoefficients differs across them. This section focuses on the most relevant ofthese differences.
In the case of workers that obtain an open-ended contract with the sameemployer (Table A.1), higher formal education has a positive impact ontransitions for both country groups, similarly to what was found for theoverall sample, but this is only significant for group M countries. This resultstems possibly from the fact that in some group M countries higher educationlevels are only attained by a relatively low share of the population. Trainingstatus appears to act trough different channels in groups M and L: beingin a training firm directly favours transitions within than firm in groupL, without a significant impact in group M, which can be related to thelow incidence of vocational training in this latter group (CEDEFOP (2010)).However, training status appears to act on group M through the effect thatthe degree of labour market regulation strictness has on transitions. As wasthe case for the whole sample, the transitions of workers in country group M

35
that are enrolled in temporary contracts in training firms are not affected somuch by changes in labour market flexility. This effect is absent from groupL results, possibly because in these countries the strictness of labour marketregulations is too low to play a relevant role in the contractual options of firms,with production process and consequently human resources policy assuminggreater relevance.
The differences across country groups regarding the impact of humancapital variables are similar for transitions to a permanent job with a newemployer (Table A.2). Inter-firm transitions are favoured by higher formaleducation in group M countries only, possibly due to the the same reasonpointed out above. In this case, however, training status has no significantimpact for any of the country groups considered separately (contrarily towhat was found for the overall sample). Institutional effects appear to playa larger role in explaining inter-firm transitions in segmented labour marketsthan individual effects. In particular, changes in the strictness of labour marketregulation are only significant for country group M (mitigated for workersin training firms). In addition, job satisfaction does not have a significanteffect on inter-firm transitions for this group of countries, while it has anegative significant impact for group L. This is in line with Gielen andTatsiramos (2012) results for job quits, suggesting that an open-ended contractobtained with a new employer may ensue a voluntary quit for group L, beingtherefore the result of low satisfaction with the previous job, while for groupM countries it may reflect the end of the temporary contract, having thereforean involuntary nature.
The higher relevance of institutional factors for group M is also present inthe case of transitions to joblessness (Table A.3), where the impact of the labourmarket regulation indicator is positive and significant. Given the finding thatlabour reallocation is larger in countries (or labour market segments) with lessstrict regulation, job-to-job transitions will be more frequent in those countries,and the survey measurement is more likely to coincide with unemploymentperiods between jobs simply because flows into and out of unemploymentwill be higher. For this type of transitions, there do not appear to be othermajor differences between the two country groups.
As was the case with the overall sample, for all country groups andtransition types there is a negative impact in the hazard associated withhaving at least one temporary job prior to the current one.
Conclusion
This work analysed transitions from temporary to permanent contracts inEuropean countries, with a special focus on human capital aspects and theirinteraction with labour market institutions. This analysis was empirical, basedon a longitudinal survey of European households (ECHP) and performed

36
trough a discrete duration model with competitive risks. A new perspectivewas adopted given that the possibility of obtaining an open-ended contractthrough a promotion with the current employer or having to change jobto obtain it were analysed separately. Results support the view that thesechannels are similar in some aspects, namely that they both benefit fromthe education of workers and from increases in labour market flexibility,as measured by the IMD. However, they also present differences, namelyregarding duration dependence, and interactions between labour marketflexibility and different aspects of training. Intra-firm transitions from atemporary to an open-ended contract are facilitated for workers enrolled intraining firms, and these transitions appear to be somewhat protected from theeffects of changes in labour market protection. On the other hand, the trainingcharacteristics of the worker and not of the firm appear to be more relevantin the case of inter-firm transitions. The breakdown of results across countrygroups indicate that in segmented labour markets institutional aspects play alarge role in transitions, rendering individual aspects in some cases a moresecondary role. In fact, in more segmented labour markets, higher labourmarket flexibility favours transitions out of temporary employment, althoughthis effect is mitigated in some cases for workers in training firms. On the otherhand, in less segmented markets, aspects related to training appear to be morerelevant than institutional ones (which are not found to be significant).
Further research would benefit from a disaggregated analysis oflabour market regulations into those affecting temporary and permanentemployment, which was not possible with the available data. This wouldallow to ascertain whether differences observed between country groups stemfrom overall higher levels of employment protection in southern Europeancountries or from the differences in protection between the two segments, i.e.,what is the importance of absolute and relative strictness of labour marketregulations, particularly EPL.

37
References
Alba-Ramirez, Alfonso (1998). “How temporary is temporary employment inSpain?” Journal of Labor Research, Springer, 19(4), 695–710.
Amuedo-Dorantes, Catalina (2000). “Work transitions into and out ofinvoluntary temporary employment in a segmented market: Evidence fromSpain.” Industrial and Labor Relations Review, Cornell University, ILR School,53(2), 309–325.
Antunes, António R. and Mário Centeno (2007). “Do labor market policiesaffect employment composition? Lessons from European countries.”Working Papers w200721, Banco de Portugal, Economics and ResearchDepartment.
Bassanini, Andrea, Alison L. Booth, Giorgio Brunello, Maria De Paola, andEdwin Leuven (2005). “Workplace Training in Europe.” IZA DiscussionPapers 1640, Institute for the Study of Labor (IZA).
Blanchard, Olivier and Pedro Portugal (2001). “What Hides Behind anUnemployment Rate: Comparing Portuguese and U.S. Labor Markets.”American Economic Review, American Economic Association, 91(1), 187–207.
Boeri, Tito (2011). “Institutional Reforms and Dualism in European LaborMarkets.” pp. 1173–1236, Elsevier.
Boeri, Tito and Jan van Ours (2013). The Economics of Imperfect Labor Markets:Second Edition, Economics Books, vol. 1. Princeton University Press.
Booth, Alison L, Marco Francesconi, and Carlos García-Serrano (1997). “JobTenure: Does History Matter?” CEPR Discussion Papers 1531, C.E.P.R.Discussion Papers.
Cameron, A. Colin and Pravin K. Trivedi (2005). Microeconometrics: Methodsand Applications. Cambridge, Cambridge University Press.
Cameron, A. Colin and Pravin K. Trivedi (2010). Microeconometrics Using Stata,Revised Edition. Stata Press books, StataCorp LP.
CEDEFOP (2010). Employeer provided vocational training in Europe. Evaluationand interpretation of the third continuing vocational training survey. 2,Publications Office of the European Union.
Centeno, Mário and Álvaro A Novo (2012). “Excess worker turnoverand fixed-term contracts: Causal evidence in a two-tier system.” LabourEconomics, Elsevier, 19(3), 320–328.
D’Addio, Anna Cristina and Michael Rosholm (2005). “Exits from temporaryjobs in Europe: A competing risks analysis.” Labour Economics, Elsevier,12(4), 449–468.
Gielen, Anne C and Konstantinos Tatsiramos (2012). “Quit behavior and therole of job protection.” Labour Economics, Elsevier, 19(4), 624–632.
Guell, Maia and Barbara Petrongolo (2007). “How binding are legal limits?Transitions from temporary to permanent work in Spain.” Labour Economics,Elsevier, 14(2), 153–183.

38
Jenkins, Stephen P (2005). “Survival analysis.” Unpublished manuscript,Institute for Social and Economic Research, University of Essex, Colchester, UK.
Jovanovic, Boyan (1979). “Job Matching and the Theory of Turnover.” Journalof Political Economy, 87(5), 972–90.
Kahn, Lawrence M. (2010). “Employment protection reforms, employmentand the incidence of temporary jobs in Europe: 1996-2001.” LabourEconomics, Elsevier, 17(1), 1–15.
OECD (2004). OECD employment outlook. Organization for EconomicCooperation and Development.
OECD (2013). “OECD EPL Database, update 2013.” http://www.oecd.org/
employment/emp/oecdindicatorsofemploymentprotection.htm.Orsini, Kristian and Sonia Vila Nuñez (2014). “The impact of the Spanish
labour market reform on the on-the-job search rate.” In ECFIN CountryFocus, 7. European Commission.
Portugal, Pedro and José Varejão (2009). “Why Do Firms Use Fixed-TermContracts?” IZA Discussion Papers 4380, Institute for the Study of Labor(IZA).
Winkelmann, Rainer and Klaus F. Zimmermann (1998). “Is job stabilitydeclining in Germany? Evidence from count data models.” Appliedeconomics, 30(11), 1413–1420.
ewpage
Appendix: Results by country group
The following tables show the results of the competing risk models presentedin Table 5, broken down across country groups M and L.
39
VARIABLES Group M Group LDuration in months:[3, 6[ -0.0249 0.3203**
(0.1345) (0.1592)[6, 9[ 0.3264** 0.4397**
(0.136) (0.175)[9, 12[ 0.5595*** 0.3238
(0.1359) (0.2007)[12, 15[ 0.8899*** 0.6921***
(0.1405) (0.175)[15, 18[ 0.8345*** 0.8430***
(0.151) (0.2022)[18, 21[ 0.8306*** 1.0660***
(0.1712) (0.2351)[21, 24[ 0.9767*** 1.2425***
(0.1734) (0.2447)[24, 30[ 1.1344*** 0.6910***
(0.1896) (0.2254)≥ 30 1.3625*** 0.7686***
(0.2624) (0.2351)Not first job -1.1371*** -0.8137***
(0.1231) (0.1205)Age [30,45[ 0.0875 0.1215
(0.0703) (0.1077)Age [45,65] -0.0867 0.0906
(0.1052) (0.1396)Firm size 20-99 workers -0.0787 -0.0793
(0.069) (0.1171)Firm size >99 workers -0.1854** 0.1014
(0.0816) (0.1161)Secondary education or more 0.2924*** 0.1154
(0.0745) (0.1207)Training worker+firm 0.0823 0.3545**
(0.1512) (0.149)Training worker+no training firm -0.0274 -0.5504***
(0.1041) (0.1877)No training worker+training firm 0.1378 0.3105*
(0.1463) (0.1618)IMD Labour market Regulations 0.8715*** -0.1196
(0.1701) (0.1557)IMD Training worker+firm -0.4753** -0.1829
(0.2328) (0.1299)IMD Training worker+no training firm -0.0553 0.1506
(0.1736) (0.1776)IMD No training worker+training firm -0.5308** -0.0534
(0.2398) (0.144)Men 0.0725 -0.0251
(0.0665) (0.0956)Industry 0.4722*** 0.6873*
(0.1832) (0.3548)Services 0.4103** 0.4982
(0.1845) (0.3476)Job satisfaction 0.1837*** 0.1429**
(0.0371) (0.061)Private sector 0.4597*** 0.5792***
(0.0953) (0.114)Constant -2.5364*** -2.6162***
(0.3344) (0.606)
Observations 6,169 2,778Country dummies yes yesTime dummies yes yesρ 0 0.156Log-pseudolikelihood -2704 -1309
TABLE A.1. Transitions to an open-ended contract with the same employer- Resultsby country group
Notes:Robust standard errors in parentheses.*** p<0.01, ** p<0.05, * p<0.1.

40
VARIABLES Group M Group LDuration in months:[3, 6[ -0.1588 -0.1603
(0.2045) (0.18)[6, 9[ 0.3078 -0.1513
(0.2088) (0.2049)[9, 12[ 0.005 -0.1345
(0.2351) (0.2402)[12, 15[ 0.3401* -0.3048
(0.2045) (0.224)[15, 18[ -0.1482 -0.1867
(0.27) (0.2847)[18, 21[ -0.0188 -0.0375
(0.3065) (0.3448)[21, 24[ -0.0946 0.0601
(0.3602) (0.3771)[24, 30[ 0.1165 -0.1775
(0.2638) (0.3035)≥ 30 0.2033 -0.1167
(0.2532) (0.2959)Not first job -0.8723*** -0.7677***
(0.1568) (0.1681)Age [30,45[ -0.0986 -0.172
(0.143) (0.1377)Age [45,65] -0.3211 -1.0154***
(0.2371) (0.2405)Firm size 20-99 workers -0.0788 -0.1173
(0.1404) (0.1565)Firm size >99 workers -0.0583 -0.0597
(0.1635) (0.1564)Secondary education or more 0.4502*** -0.1151
(0.1351) (0.1502)Training worker+firm 0.2955 0.2864
(0.2656) (0.2132)Training worker+no training firm 0.1718 0.3009
(0.1863) (0.2083)No training worker+training firm -0.0709 0.0689
(0.3172) (0.2324)IMD Labour market Regulations 0.9167*** 0.3207
(0.2551) (0.204)IMD Training worker+firm -0.6117* -0.2983*
(0.371) (0.1728)IMD Training worker+no training firm -0.1352 -0.1226
(0.2819) (0.1978)IMD No training worker+training firm 0.3953 -0.1702
(0.483) (0.1971)Men 0.2097 0.4527***
(0.1287) (0.1368)Industry 0.2251 0.2347
(0.33) (0.4336)Services 0.2849 0.23
(0.3276) (0.4099)Job satisfaction 0.067 -0.1252*
(0.0661) (0.0734)Private sector 0.3312** 0.2933**
(0.1683) (0.1462)Constant -2.6979*** -1.6212**
(0.6101) (0.7812)
Observations 6,169 2,778Country dummies yes yesTime dummies yes yesρ 0.406 0.381Log-pseudolikelihood -1254 -1003
TABLE A.2. Transitions to an open-ended contract with a new employer - Results bycountry group
Notes:Robust standard errors in parentheses.*** p<0.01, ** p<0.05, * p<0.1.
41
VARIABLES Group M Group LDuration in months:[3, 6[ -0.088 -0.2153*
(0.0898) (0.122)[6, 9[ -0.4299*** -0.4913***
(0.1096) (0.1452)[9, 12[ -0.2395** -0.7290***
(0.1168) (0.1872)[12, 15[ -0.2813** -0.5330***
(0.1148) (0.1661)[15, 18[ -0.4786*** -0.7809***
(0.1334) (0.2304)[18, 21[ -0.6686*** -0.7090***
(0.1609) (0.2583)[21, 24[ -0.7528*** -0.8715***
(0.1869) (0.3045)[24, 30[ -0.4726*** -1.2146***
(0.1417) (0.263)≥ 30 -0.9357*** -1.6515***
(0.1437) (0.2856)Not first job -1.3041*** -1.4091***
(0.0868) (0.14)Age [30,45[ -0.0788 -0.3801***
(0.0709) (0.1121)Age [45,65] 0.2007** 0.195
(0.0924) (0.1218)Firm size 20-99 workers -0.1404* -0.1382
(0.0722) (0.1093)Firm size >99 workers -0.2795*** -0.2406**
(0.0901) (0.1222)Secondary education or more -0.4972*** -0.4314***
(0.0749) (0.1146)Training worker+firm -0.3783* -0.8711***
(0.195) (0.1639)Training worker+no training firm -0.0153 0.1498
(0.1065) (0.1375)No training worker+training firm -0.1909 -0.6098***
(0.2021) (0.191)IMD Labour market Regulations 0.3737** -0.2114
(0.151) (0.1638)IMD Training worker+firm -0.1325 0.4092***
(0.3107) (0.1562)IMD Training worker+no training firm -0.2636 0.1938
(0.161) (0.1605)IMD No training worker+training firm -0.1497 0.2521
(0.3066) (0.1865)Men -0.2947*** -0.1914*
(0.0683) (0.0996)Industry -0.2862** -0.1006
(0.1281) (0.2941)Services -0.1526 -0.0982
(0.1273) (0.2788)Job satisfaction -0.2258*** -0.0836
(0.0352) (0.0573)Private sector -0.2918*** -0.3131***
(0.0869) (0.1037)Constant 1.4113*** 0.8286
(0.2591 -0.5309
Observations 6,169 2,778Country dummies yes yesTime dummies yes yesρ 0.146 0.0884Log-pseudolikelihood -2765 -1175
TABLE A.3. Transitions to joblessness - Results by country group
Notes: Robust standard errors in parentheses.*** p<0.01, ** p<0.05, * p<0.1.