Embed Size (px)
Citation preview

Temporal Scale and Degree of Consensus as Variables in Cultural Model Research
John B. Gatewood Lehigh University
Catherine M. Cameron Cedar Crest College

Preview/Outline
Conceptual background … cultural models versus cultural consensus approaches
Our Turks & Caicos study … conjoining the cultural models and cultural consensus approaches
Some findings … details, details
Stepping back … toward a typology of “cultural models”

Conceptual Background
CULTURAL MODELS Fine-grain focus on “what people know” Recognizes knowledge is integrated and generative Building composite models from diverse informants is
something non-social scientists just don’t think of doing Produces insightful findings Has intuitive appeal to potential ‘end-users’ of the information
But … Credibility of the model? – replicability, verification,
completeness, etc. Degree of sharing? – expertise gradient or sub-cultural
diversity, competing viewpoints or cognitive plurality, etc. Generalizability of findings?

CONSENSUS ANALYSIS Focus on “how knowledge is distributed” in a population Addresses the fact of intra-cultural diversity Explicit methodology (clear what has been done) Easily coupled with standard survey research; hence, data
lend themselves to standard hypothesis testing, too But …
‘Particulate’ view of knowledge isn’t plausible How to decide on the questions? Devil is in the details – e.g., must counter-balance questions if
using rating-ranking data, how many questions needed to establish accurate respondent-profiles, etc.

Conjoining cultural models and consensus analysis is a way cognitive anthropology can contribute to a better understanding of the social organization of knowledge (a.k.a., socially distributed cognition)
And, when the domain being studied is socially relevant, such research also produces findings that are useful … both to the people we study and other end-users

Our Study in the Turks & Caicos Islands Focus on residents’ (Belonger) understandings of
tourism and its impacts on their life … important to them
Cognitive ethnography…combining “cultural model” approach with“cultural consensus” approach
Two years of data collection, two phases of research
Acknowledgement. This material is based upon work supported by the National ScienceFoundation under Grant No. (BCS-0621241). Any opinions, findings, and conclusions orrecommendations expressed in this material are those of the authors and do not necessarilyreflect the views of the National Science Foundation.

Turks and Caicos Islands ??

“Beautiful by nature” – Tourist Board’s promotional motto

Phase I (summer 2006) – Interviews 30 tape-recorded ethnographic interviews
Purposive sampling … get range of variability
Extract “propositional content” from each informant’s interview
Sort, winnow, and distill ideas expressed Construct a composite cultural model of tourism from
Belongers’ perspectives Develop questionnaire based on propositional content of
the composite cultural model
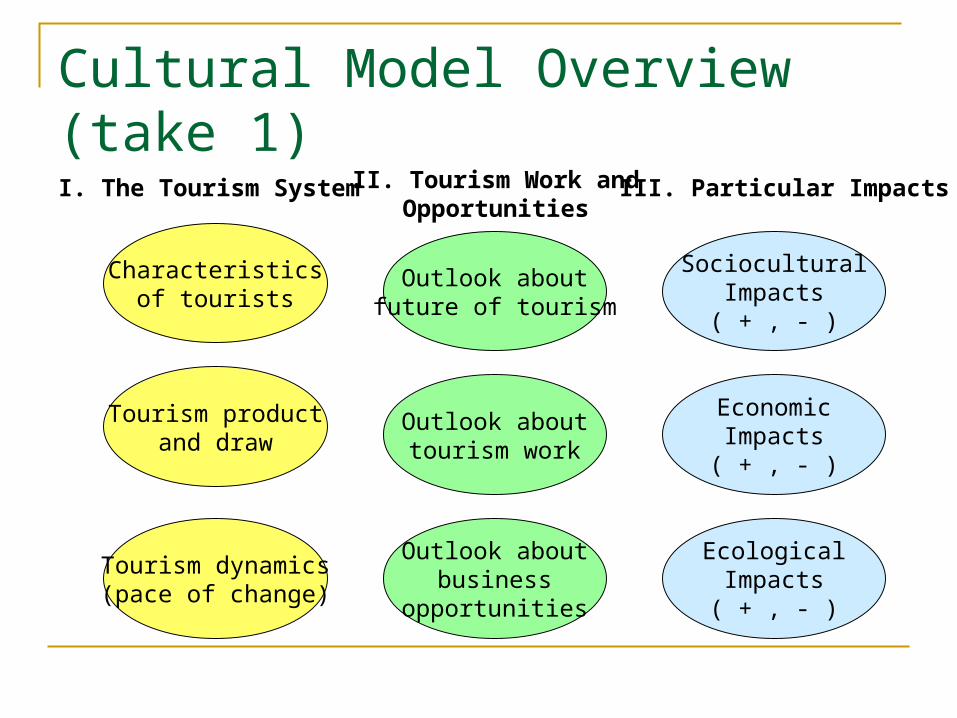
Cultural Model Overview (take 1)
Characteristicsof tourists
Tourism productand draw
Tourism dynamics(pace of change)
I. The Tourism System
Outlook aboutfuture of tourism
Outlook abouttourism work
Outlook aboutbusiness
opportunities
II. Tourism Work andOpportunities
SocioculturalImpacts( + , - )
EconomicImpacts( + , - )
EcologicalImpacts( + , - )
III. Particular Impacts
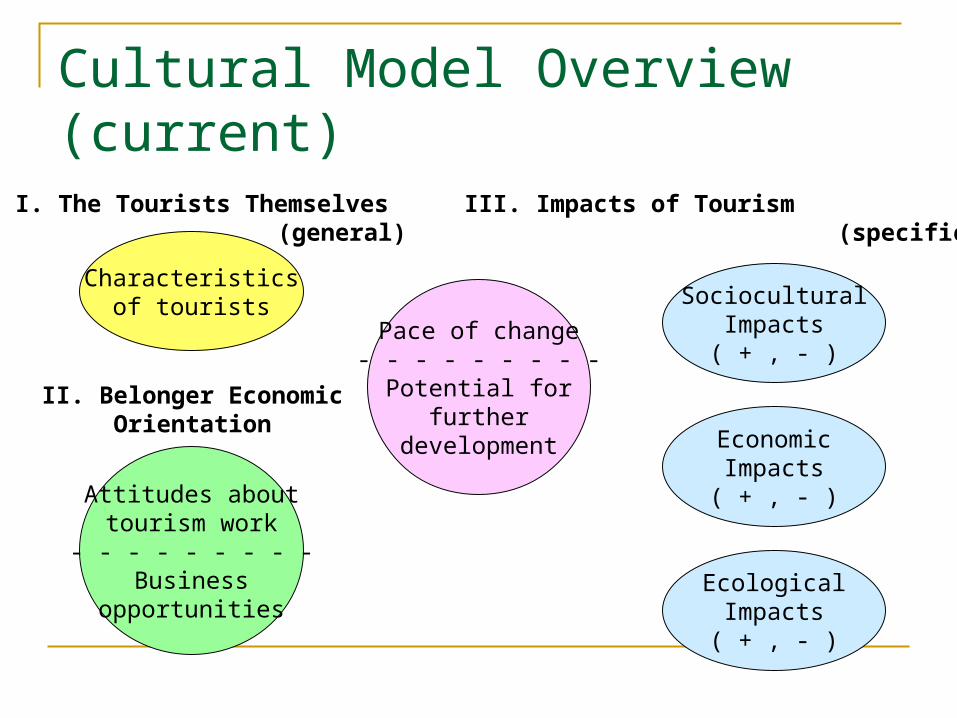
Cultural Model Overview (current)
Pace of change- - - - - - - - -Potential for
furtherdevelopment
SocioculturalImpacts( + , - )
EconomicImpacts( + , - )
EcologicalImpacts( + , - )
Characteristicsof tourists
I. The Tourists Themselves
Attitudes abouttourism work- - - - - - - - -
Businessopportunities
II. Belonger EconomicOrientation
III. Impacts of Tourism(general) (specific)

Cultural Model Details
“Most of the tourists who visit Turks and Caicos… <14 statements>.” Are wealthy and used to luxury. Are friendly and polite. Don’t usually expect any special
treatment. Are budget-minded and careful with their
money. Are curious about the islands and its
people. Are mostly loud and rude. … etc.
Characteristicsof tourists
I. The Tourists Themselves

“Most Belongers…<18 statements>.” Appreciate that tourism work is a game you
have to play. Feel that tourism work is like being a
servant. Prefer jobs in the private sector. Will only work in tourism if they can get
management jobs. See lots of opportunities for themselves in
tourism work. Prefer to leave menial jobs to immigrants. … etc.
Attitudes abouttourism work- - - - - - - - -
Businessopportunities
II. Belonger EconomicOrientation

Phase II (summer 2007) – Survey Hire and train research team
(six local RA’s, two Lehigh undergraduates) Pre-test and revise questionnaire Survey “300” randomly-selected Belongers
Stratified random sampling using voter registration lists as sampling frames
Finding the targeted respondents?? … *(final N = 277)(no street address; lousy phonebook)
ALSO survey people interviewed in Phase I(our “Special Sample”)

Finding #1: Cultural Consensus Weak cultural consensus across the whole country
exists with respect to the 119 similarly-formatted“cultural model items” in questionnaire
Random Sample (N=277) Ratio of 1st to 2nd eigenvalues = 4.515 Mean 1st factor loading = .499 9 negative loadings, or 3.2% of sample

Consensus Analysis's Factor Loadingsfor TCI Random Sample (N=277)
-0.80
-0.60
-0.40
-0.20
0.00
0.20
0.40
0.60
0.80
1.00
-0.20 -0.10 0.00 0.10 0.20 0.30 0.40 0.50 0.60 0.70 0.80 0.90
Factor 1
Fa
cto
r 2

Finding #2: Disaggregating Sample Improves Consensus … Mostly
ISLAND / ISLAND-GROUP NRatio of
EigenvaluesMean 1st Loading
Percent Negative
Providenciales( very developed )
141 4.935 .547 0%
Grand Turk, with Salt Cay( middling development )
74 5.978 .569 0%
South Caicos( little development )
22 7.245 .607 0%
North Caicos & Middle Caicos( little development )
40 2.305 .238 20%

Diversity in the Special Sample Weak cultural consensus in this group (N=29), too
Ratio of 1st to 2nd eigenvalues = 3.355 Mean 1st factor loading = .584, with 0 negative loadings
Hence, use Special Sample to investigate the second largest source of variability… (2nd factor accounts for 21.6% of variance in this respondent-by-respondent correlation matrix)
Examining the 2nd factor loadings for these 29 familiar informants, we began to see a very interpretable pattern…

Consensus Analysis: Special Sample
-0.60
-0.40
-0.20
0.00
0.20
0.40
0.60
0.80
0.20 0.30 0.40 0.50 0.60 0.70 0.80 0.90
Factor 1 Loading
Fa
cto
r 2
Lo
adin
g
Cluster 1(n=12)
Cluster 2(n=17)

JOHNSON’S HIERARCHICAL CLUSTERING (average method)
Cluster 1 Cluster 2 A A
A A A 1 A A A A A A 1 A | A A A A A A A A A A A A A A A A A 2 0 1 7 0 0 1 1 0 2 7 2 | 3 2 2 2 0 1 0 1 0 0 0 2 1 2 2 2 3 6 3 5 a 6 2 1 2 9 1 b 7 | 0 9 3 5 1 9 4 4 8 5 7 4 0 0 8 2 1------ - - - - - - - - - - - - | - - - - - - - - - - - - - - - - -0.7129 . . . . . . . XXX . . . | . . . . . . . . . . . . . . . . .0.6934 . . . . . . . XXX . . . | . . . . . . . . . . . . . . . XXX0.6613 . . . . . . . XXX . . . | . . . . . . . . . . . . . . XXXXX0.6417 . . . . . . XXXXX . . . | . . . . . . . . . . . . . . XXXXX0.6060 . . . . . . XXXXX . . . | . . . . . . . . . XXX . . . XXXXX0.6025 . . . . . XXXXXXX . . . | . . . . . . . . . XXX . . . XXXXX0.5926 . . . . . XXXXXXX . . . | . . . . . . . . . XXX . . XXXXXXX0.5754 . . . . . XXXXXXX . . . | . . . . XXX . . . XXX . . XXXXXXX0.5694 . . . . . XXXXXXX . . . | . . . . XXX . . . XXXXX . XXXXXXX0.5656 . . XXX . XXXXXXX . . . | . . . . XXX . . . XXXXX . XXXXXXX0.5420 . . XXX . XXXXXXX . . . | . . . . XXX XXX . XXXXX . XXXXXXX0.5290 . . XXX . XXXXXXX . . . | . . . . XXX XXX . XXXXX XXXXXXXXX0.5282 . . XXX . XXXXXXX . . . | . . . . XXX XXX XXXXXXX XXXXXXXXX0.5191 . . XXX . XXXXXXXXX . . | . . . . XXX XXX XXXXXXX XXXXXXXXX0.5085 . . XXX . XXXXXXXXX . . | . . . . XXX XXX XXXXXXXXXXXXXXXXX0.4899 . . XXX . XXXXXXXXX . . | . . . . XXX XXXXXXXXXXXXXXXXXXXXX0.4688 . . XXX XXXXXXXXXXX . . | . . . . XXX XXXXXXXXXXXXXXXXXXXXX0.4458 . . XXX XXXXXXXXXXX XXX | . . . . XXX XXXXXXXXXXXXXXXXXXXXX0.4440 . . XXX XXXXXXXXXXX XXX | . . XXX XXX XXXXXXXXXXXXXXXXXXXXX0.4327 . . XXX XXXXXXXXXXX XXX | . . XXX XXXXXXXXXXXXXXXXXXXXXXXXX0.4132 . XXXXX XXXXXXXXXXX XXX | . . XXX XXXXXXXXXXXXXXXXXXXXXXXXX0.3634 . XXXXX XXXXXXXXXXX XXX | . . XXXXXXXXXXXXXXXXXXXXXXXXXXXXX0.3483 . XXXXXXXXXXXXXXXXX XXX | . . XXXXXXXXXXXXXXXXXXXXXXXXXXXXX0.3380 . XXXXXXXXXXXXXXXXXXXXX | . . XXXXXXXXXXXXXXXXXXXXXXXXXXXXX0.3184 . XXXXXXXXXXXXXXXXXXXXX | . XXXXXXXXXXXXXXXXXXXXXXXXXXXXXXX0.3038 . XXXXXXXXXXXXXXXXXXXXX | XXXXXXXXXXXXXXXXXXXXXXXXXXXXXXXXX0.2818 . XXXXXXXXXXXXXXXXXXXXXXXXXXXXXXXXXXXXXXXXXXXXXXXXXXXXXXXXX0.2241 XXXXXXXXXXXXXXXXXXXXXXXXXXXXXXXXXXXXXXXXXXXXXXXXXXXXXXXXXXX

Finding #3: Subcultures Exist
Analyzing the clusters separately, consensus indicators go up sharply
Cluster 1 (n=12) Ratio of 1st to 2nd eigenvalues = 7.061 Mean 1st factor loading = .640, with no negative loadings
Cluster 2 (n=17) Ratio of 1st to 2nd eigenvalues = 9.838 Mean 1st factor loading = .653, with no negative loadings
Conclusion: there are two coherent viewpoints (different ‘answer keys’) in the Special Sample

Two Viewpoints (in Special Sample) Based on the individuals who best represent each
subcultural group (and taking into account the views expressed by them in interviews), the two viewpoints might be characterized as follows
Cluster 1: “Cautiously ambivalent” Some concern about the long-term consequences of tourism;
tourism involves a trade-off between good and bad impacts
Cluster 2: “Pro-tourism, pro-growth” Very positive about changes tourism has wrought;
pro-growth and pro-development; change is progress

Survey Items that Differentiate
Independent-samples t-tests on the 119 cultural model items in questionnaire (Cluster 1 vs. Cluster 2)…
47 items show “statistically significant” group-group differences at the unadjusted α =.05 level
Conversely, the two groups did not differ significantly on 72 items… (reason the Special Sample, as a whole, shows weak consensus)

Cluster 1 vs Cluster 2: 47 Items with "Significant" Contrasts
1.00
2.00
3.00
4.00
5.00
So
c11
Eco
n1
0S
oc1
2S
oc2
4
Pa
ce2
1S
oc1
3S
oc0
6P
ace
20
Eco
n0
7E
con
09
So
c21
So
c23
Wo
rk0
2P
ace
02
Pa
ce1
4E
nv0
5
So
c04
De
v9S
oc1
5E
nv0
9
So
c17
En
v07
En
v02
Eco
n1
1W
ork
18
En
v16
Eco
n1
6
So
c09
Ch
ar1
3E
nv1
5E
con
05
Pa
ce1
7E
nv0
1E
nv1
1D
ev1
0
En
v13
Pa
ce1
5P
ace
06
Eco
n1
3
Eco
n0
6S
oc0
2P
ace
11
De
v5
Wo
rk1
3P
ace
08
Pa
ce0
1W
ork
15
Item Name
Ite
m M
ea
n
Mean1 Mean2

Finding #4: The “Usual Suspects” Don’t Explain the Viewpoints NO difference with respect to:
Age; Sex; Education; Household income How often think about tourism; Speak with tourists Perceived overall financial benefit from tourism
(Variable = self + family + neighbors + island + country) Sources of information
Almost significant contrast (α =.057) : Cluster 1 has traveled to more parts of the world
One significant contrast (α =.033) : Cluster 2 reports more personal financial benefit from tourism
(Variable = self + family)

Extrapolating from Special Sample EMPIRICAL QUESTION:
Is there a similar “viewpoint” variation – the same sort of “subcultural” attitudinal variation – in the larger, Random Sample?
PRELIMINARY OBSERVATION:Overall, response profiles across the whole battery of 119 items are very similar between the Special Sample (as a whole) and the Random Sample … r = .938
Note: Special Sample has greater variance among items means, but very similar pattern of up’s-and-down’s

Both Samples’ Response Profiles are Very Similar Overall … (r = .938) Item Means: Random and Special Samples
1.00
2.00
3.00
4.00
5.00
1 6 11 16 21 26 31 36 41 46 51 56 61 66 71 76 81 86 91 96 101 106 111 116
The 119 Items
Ite
m M
ea
n
Random Special

Extrapolating…? – Two Approaches1. Profile Matching
Compare each Random Sample respondent with the two “subcultural” response profiles (across 47 items) from the Special Sample
Estimate proportions of “Pro-Tourism” and “Cautiously Ambivalent” groups within the Random Sample based on which profile respondents resemble
2. Thematic Indices Construct multi-item, additive indices to measure different
themes that seem to distinguish the Special Sample’s two “viewpoints”
See whether one or more of these indices correlate with the 2nd factor loadings from consensus analysis (both samples)

Profile Matching ApproachScatterplot: Respondents’ correlations with respect to the Special Sample’stwo “subcultural” response profiles
-0.60
-0.40
-0.20
0.00
0.20
0.40
0.60
0.80
1.00
-0.60 -0.40 -0.20 0.00 0.20 0.40 0.60 0.80 1.00
Correlation with Cluster 1 means
Co
rre
lati
on
wit
h C
lus
ter
2 m
ea
ns

“r2–r1” … a computed variable from information depicted in the scatterplot, where
r1: Pearson r vis-à-vis Cluster 1’s response profile
r2: Pearson r vis-à-vis Cluster 2’s response profile
Thus, Positive values respondent is more similar to the
“Pro-Tourism” (Cluster 2) viewpoint Negative values respondent is more similar to the
“Cautiously Ambivalent” (Cluster 1) viewpoint

Finding #5: The Attitudinal Gradient Found in the Special Sample also Exists in the Random Sample 206 respondents have positive values for “r2–r1”;
71 respondents have negative values Thus, the “pro-tourism” camp outnumbers the
“cautiously ambivalent” camp by about 3-to-1
And… correlation between the “r2–r1” pattern-matching variable and the 2nd consensus factor scores for the Random Sample is VERY high … r = .903 Thus, “second largest source of variation” has
something to do with this attitudinal gradient

Thematic Indices Approach
Candidate items selected from all 119 cultural model questions based on their face validity … subsequently winnowed by standard criteria of index construction using Random Sample’s data
RESULT: Six additive indices … scaled to rangefrom 1-to-5 (1=maximally negative, 3=neutral, 5=maximally positive) Social Impacts (7 items, Cronbach’s α = .780) Heritage Optimism (5 items, Cronbach’s α = .737) General Pro-Tourism Outlook (7 items, Cronbach’s α = .717) Financial Impacts (5 items, Cronbach’s α = .704) Environmental Impacts (5 items, Cronbach’s α = .673) Orientation to Tourism Work (4 items, Cronbach’s α = .636)

To our surprise (and delight), the six thematic indices could be combined to form a single, second-order index
MacroIndex … a two-stage additive index based on 33 items, Cronbach’s α = .812
Histogram of MacroIndex scores for Random Sample (mean = 3.23)
0
5
10
15
20
25
30
35
40
45
1 2 3 4 5
MacroInd Score
Nu
mb
er o
f R
esp
on
den
ts

Finding #6: MacroIndex Correlates VERY Highly with Consensus 2nd Factor Loadings MacroIndex scores are extremely highly correlated with
the 2nd factor loadings from consensus analysis… Random Sample (N=277) r = .922 Special Sample (N=29) r = .975
INTERPRETATION: MacroIndex’s 33 constituent items virtually are the
substantive issues that underlie the “second largest source of variation” among respondents
The attitudinal gradient first discovered in the Special Sample is also present (and now substantively identified) in the Random Sample

[ Methodological aside … ]
It was only by having a “Special Sample” – people we interviewed AND surveyed – that we:
became aware different viewpoints existed, were prompted to investigate how these viewpoints
are associated with distinguishable response patterns in the survey data

…“and now for something completely different” (Bullwinkle)

Varieties of “Cultural Models”
Tongan radiality (Bennardo, this session) Commitment in American marriage (Quinn 1982) Folk theory of mind (D’Andrade 1987) Home heat control (Kempton 1987) Watermen’s understanding of blue crab management
(Paolisso 2002) Employees’ understanding of credit unions (Gatewood &
Lowe 2008) Economic individualism (Strauss 1997) … etc. … IN WHAT WAYS DO THESE “CULTURAL MODELS”
DIFFER?

Toward a Typology of Cultural Models COGNITIVE PROPERTIES
Temporal scale Time to become activated Duration of activation
Inertial characteristics Time to learn / develop Time to unlearn / modify
Functional integrity Number of component parts Degree of integration among the components (e.g., all
activated at once, all activated but separately, or some components can be activated without activating others?)

COGNITIVE PROPERTIES (cont.) Generative capacity Motivational force Degree of implicitness / ease of communication
SOCIAL-DISTRIBUTIONAL PROPERTIES Degree of elaboration across individuals
E.g., components learned separately or as package,‘core’ components widely shared but variable with respect to ‘peripheral’ components, or just idiosyncratic variation?
Patterns of “sharing” across individuals E.g., uniformly and widely shared, subcultural differences,
expertise gradients, perspectival gradients, or free variation? Degree to which X is a topic of discussion

… Finale.
At some point, it might be worthwhile to expand upon D’Andrade’s (1995) ontology of cultural forms
For the time being, we would just note that: our informants, and respondents, took several minutes
to ‘get their thoughts going’ about tourism and its impacts, and
“residents’ understanding of tourism” is not a monolithic thing; rather, the component ideas are complexly distributed among people
Minimally, then, temporal scale and degree of consensus are key variables differentiating kinds of cultural models