Embed Size (px)
Citation preview

Temple Bar Investment Trust PLC
Report and Accounts 2006
Temple Bar Cover with spine:206262 Temple Bar Cover 23/2/07 19:12 Page 1
Group summary 1
Summary of results 2
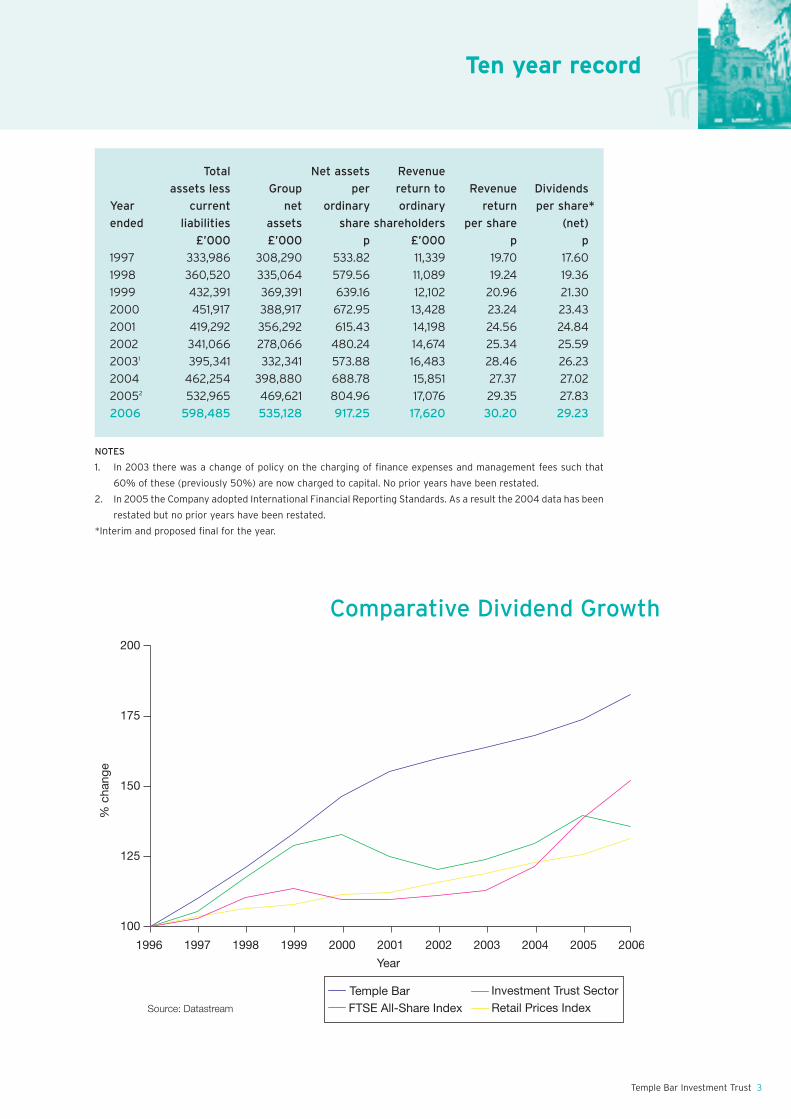
Ten year record 3
Comparative dividend growth 3
Five year summary 4
Directors 5
Management and administration 6
Chairman’s statement 7
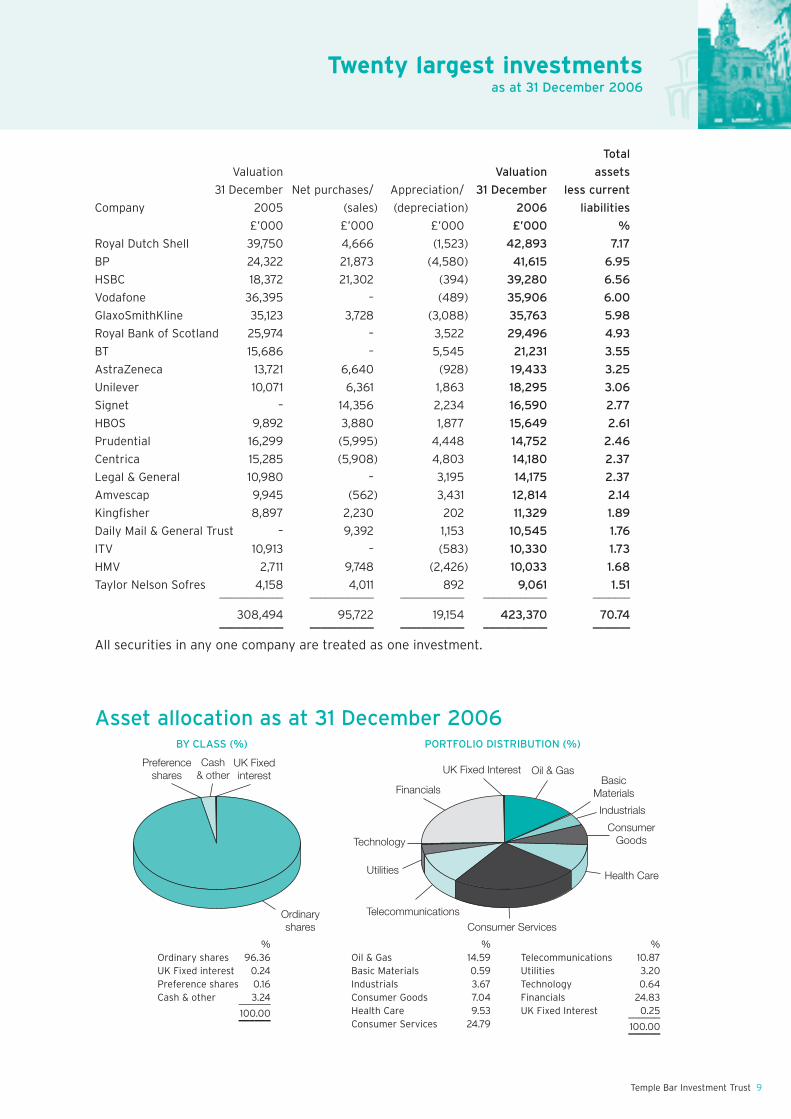
Twenty largest investments 9
Asset allocation 9
Manager’s report 10
Portfolio of investments 13
Report of the directors 16
Report on directors’ remuneration 21
Corporate governance 22
Independent auditors’ report 25
Statement of directors’ responsibilites 26
Consolidated income statement 27
Consolidated statement of changes in equity 28
Company statement of changes in equity 28
Consolidated balance sheet 29
Company balance sheet 30
Consolidated group and company cash flow statement 31
Notes to the consolidated financial statements 32
Useful information for shareholders 44
Notice of meeting 45
Temple Bar Investment Trust Savings Scheme 47
Temple Bar Investment Trust
Contents
Annual report • Final copy:Temple Bar RA 23/2/07 19:20 Page ii

Investment Objective The Company’s investment objective is to provide growth in income and capital to achieve a long term total return greater than the benchmark FTSE All-Share Index, through investment in UK securities. The Company’s policy is to invest in a broad spread of securities with typically the majority of the portfolio selected from the constituents of the FTSE 100 Index.
Benchmark Performance is measured against the FTSE All-Share Index.
Total Assets Less £598,485,000
Current Liabilities
Total Equity £535,128,000
Market Capitalisation £494,729,000
Capital Structure Ordinary shares 58,340,742 shares
5.5% Debenture Stock 2021 £38,000,000
9.875% Debenture Stock 2017 £25,000,000
Voting Structure Ordinary shares 100%.
Winding-Up Date None.
Managers’ Fees 0.35% per annum based on the value of the investments (including
cash) of the Company.
PEP/ISA Status The Company’s shares are capable of being held in an ISA and are a
qualifying investment under the Personal Equity Plan regulations.
AIC Member.
Website www.templebarinvestments.com
Group summary
Temple Bar Investment Trust 1
Group summary
Annual report • Final copy:Temple Bar RA 23/2/07 19:20 Page 1
2 Temple Bar Investment Trust
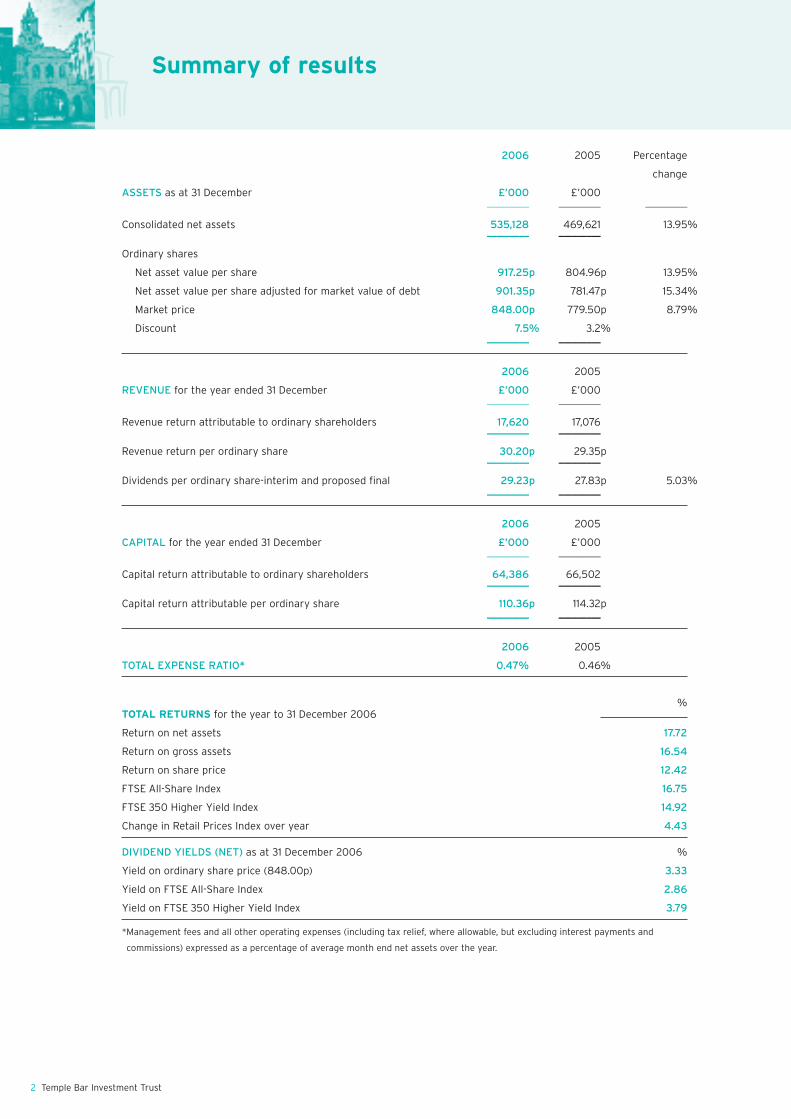
2006 2005 Percentage
change
ASSETS as at 31 December £’000 £’000––––––––– ––––––––– –––––––––
Consolidated net assets 535,128 469,621 13.95%––––––––– –––––––––
Ordinary shares
Net asset value per share 917.25p 804.96p 13.95%
Net asset value per share adjusted for market value of debt 901.35p 781.47p 15.34%
Market price 848.00p 779.50p 8.79%
Discount 7.5% 3.2%––––––––– –––––––––
2006 2005
REVENUE for the year ended 31 December £’000 £’000––––––––– –––––––––
Revenue return attributable to ordinary shareholders 17,620 17,076––––––––– –––––––––
Revenue return per ordinary share 30.20p 29.35p––––––––– –––––––––
Dividends per ordinary share-interim and proposed final 29.23p 27.83p 5.03%––––––––– –––––––––
2006 2005
CAPITAL for the year ended 31 December £’000 £’000––––––––– –––––––––
Capital return attributable to ordinary shareholders 64,386 66,502––––––––– –––––––––
Capital return attributable per ordinary share 110.36p 114.32p––––––––– –––––––––
2006 2005
TOTAL EXPENSE RATIO* 0.47% 0.46%
%TOTAL RETURNS for the year to 31 December 2006
Return on net assets 17.72
Return on gross assets 16.54
Return on share price 12.42
FTSE All-Share Index 16.75
FTSE 350 Higher Yield Index 14.92
Change in Retail Prices Index over year 4.43
DIVIDEND YIELDS (NET) as at 31 December 2006 %
Yield on ordinary share price (848.00p) 3.33
Yield on FTSE All-Share Index 2.86
Yield on FTSE 350 Higher Yield Index 3.79
*Management fees and all other operating expenses (including tax relief, where allowable, but excluding interest payments and
commissions) expressed as a percentage of average month end net assets over the year.
Summary of results
Annual report • Final copy:Temple Bar RA 23/2/07 19:20 Page 2
Temple Bar Investment Trust 3
Total Net assets Revenue
assets less Group per return to Revenue Dividends
Year current net ordinary ordinary return per share*
ended liabilities assets share shareholders per share (net)
£’000 £’000 p £’000 p p
1997 333,986 308,290 533.82 11,339 19.70 17.60
1998 360,520 335,064 579.56 11,089 19.24 19.36
1999 432,391 369,391 639.16 12,102 20.96 21.30
2000 451,917 388,917 672.95 13,428 23.24 23.43
2001 419,292 356,292 615.43 14,198 24.56 24.84
2002 341,066 278,066 480.24 14,674 25.34 25.59
20031 395,341 332,341 573.88 16,483 28.46 26.23
2004 462,254 398,880 688.78 15,851 27.37 27.02
20052 532,965 469,621 804.96 17,076 29.35 27.83
2006 598,485 535,128 917.25 17,620 30.20 29.23
NOTES
1. In 2003 there was a change of policy on the charging of finance expenses and management fees such that
60% of these (previously 50%) are now charged to capital. No prior years have been restated.
2. In 2005 the Company adopted International Financial Reporting Standards. As a result the 2004 data has been
restated but no prior years have been restated.
*Interim and proposed final for the year.
Comparative Dividend Growth
100
125
150
175
200
Ten year record
Annual report • Final copy:Temple Bar RA 23/2/07 19:20 Page 3
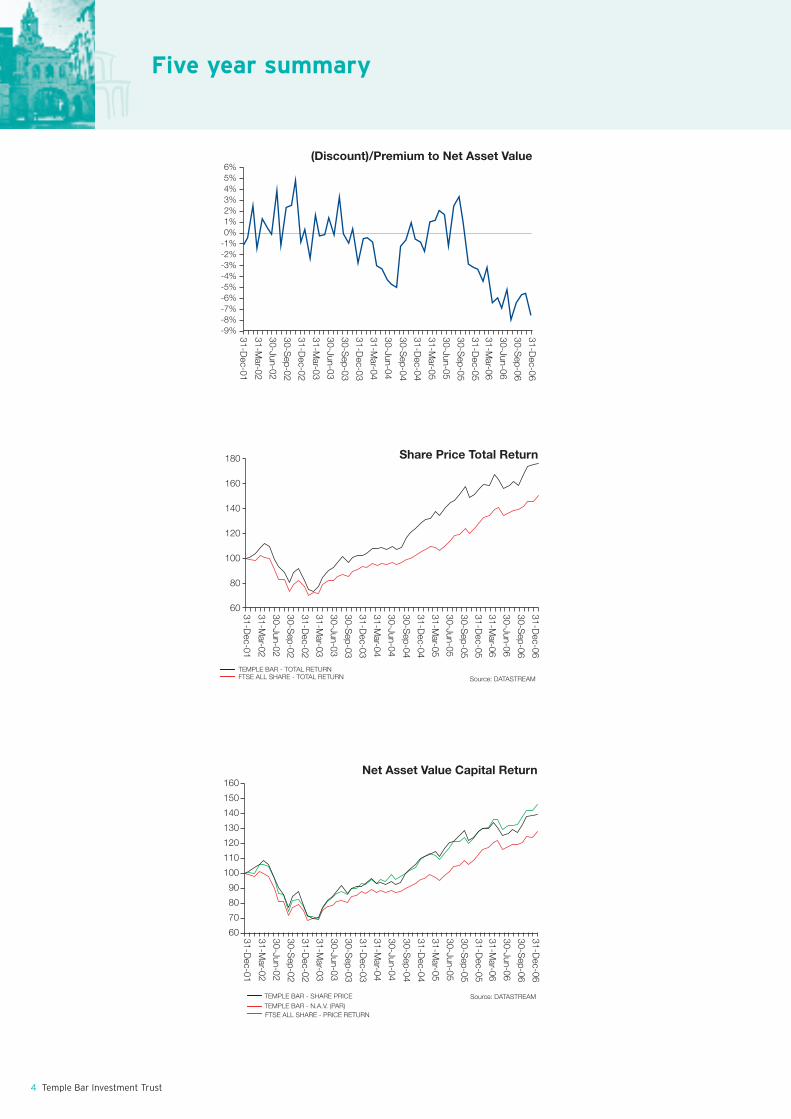
(Discount)/Premium to Net Asset Value
31-Dec-01
31-Mar-02
30-Jun-02
30-Sep-02
31-Dec-02
31-Mar-03
30-Jun-03
30-Sep-03
31-Dec-03
31-Mar-04
30-Jun-04
30-Sep-04
31-Dec-04
31-Mar-05
30-Jun-05
30-Sep-05
31-Dec-05
31-Mar-06
30-Jun-06
30-Sep-06
31-Dec-06
-9%-8%-7%-6%-5%-4%-3%-2%-1%0%1%2%3%4%5%6%
Share Price Total Return
TEMPLE BAR - TOTAL RETURNFTSE ALL SHARE - TOTAL RETURN Source: DATASTREAM
60
80
100
120
140
160
180
31-Dec-01
31-Mar-02
30-Jun-02
30-Sep-02
31-Dec-02
31-Mar-03
30-Jun-03
30-Sep-03
31-Dec-03
31-Mar-04
30-Jun-04
30-Sep-04
31-Dec-04
31-Mar-05
30-Jun-05
30-Sep-05
31-Dec-05
31-Mar-06
30-Jun-06
30-Sep-06
31-Dec-06
Net Asset Value Capital Return
TEMPLE BAR - SHARE PRICETEMPLE BAR - N.A.V. (PAR)FTSE ALL SHARE - PRICE RETURN
Source: DATASTREAM
60
70
80
90
100
110
120
130
140
150
160
31-Dec-01
31-Mar-02
30-Jun-02
30-Sep-02
31-Dec-02
31-Mar-03
30-Jun-03
30-Sep-03
31-Dec-03
31-Mar-04
30-Jun-04
30-Sep-04
31-Dec-04
31-Mar-05
30-Jun-05
30-Sep-05
31-Dec-05
31-Mar-06
30-Jun-06
30-Sep-06
31-Dec-06
Five year summary
4 Temple Bar Investment Trust
Annual report • Final copy:Temple Bar RA 23/2/07 19:20 Page 4

Directors
JOHN REEVE*, Chairman, aged 62, wasappointed a director in 1992. He was formerlyexecutive chairman of the Willis Group, groupmanaging director of Sun Life Assurance Societyand a member of the boards of the Association ofBritish Insurers and the International InsuranceSociety. He is currently Chairman of Alea GroupHoldings (Bermuda) Limited and a director of anumber of other companies.
GARY J ALLEN*†, aged 62, was appointed adirector in 2001. He has over 35 years’ experiencein engineering and is former chairman of IMI PLC.His other directorships include The London StockExchange and N V Bekaert SA.
RICHARD W JEWSON*, aged 62, was appointeda director in 2001. He first worked in the timberand building material supply industry, becomingmanaging director of Jewson the buildersmerchants for twelve years from 1974, and thenmanaging director and chairman of its parentcompany Meyer International PLC from which heretired in 1993. He is currently chairman of PFI Infrastructure PLC and Archant Limited, and anon-executive director of Grafton Group PLC andClean Energy Brazil PLC.
JUNE F de MOLLER*, aged 59, was appointed adirector in 2005. She is a non-executive directorof Derwent London PLC, Archant Limited and a
former managing director of CarltonCommunications PLC. She was previously a non-executive director of J Sainsbury PLC, CooksonGroup PLC and BT PLC.
MARTIN R RILEY*, aged 63, was appointed adirector in 2004. He has over 35 years’ experiencein stockbroking and fund management in the Cityand is a former director of Henderson CrosthwaiteLtd, Guinness Mahon & Co Ltd and Barlows PLC. Heis currently chairman of SR Europe InvestmentTrust PLC and Howard Investment Company Ltd anda director of Bonfield Asset Management Ltd andvarious private investment companies.
FIELD L J WALTON*, aged 66, was appointed adirector in 1983. He started his career inengineering management and moved to the Cityas an analyst with Cazenove in 1971. Subsequentlyhe held a number of positions in fundmanagement. He is currently a consultant toMacArthur & Co. Limited, a former chairman ofBiofuels Corporation PLC and a non-executivedirector of a number of engineering and trustcompanies. He is also a director of Harrods GroupTrustees Ltd.
*Independent non-executive director and member of the audit
committee and nomination committee.
†Chairman of the audit committee and Senior Independent
Director.
from left to right; June de Moller, Gary Allen, John Reeve, Martin Riley, Field Walton, Richard Jewson
Temple Bar Investment Trust 5
Annual report • Final copy:Temple Bar RA 23/2/07 19:20 Page 5
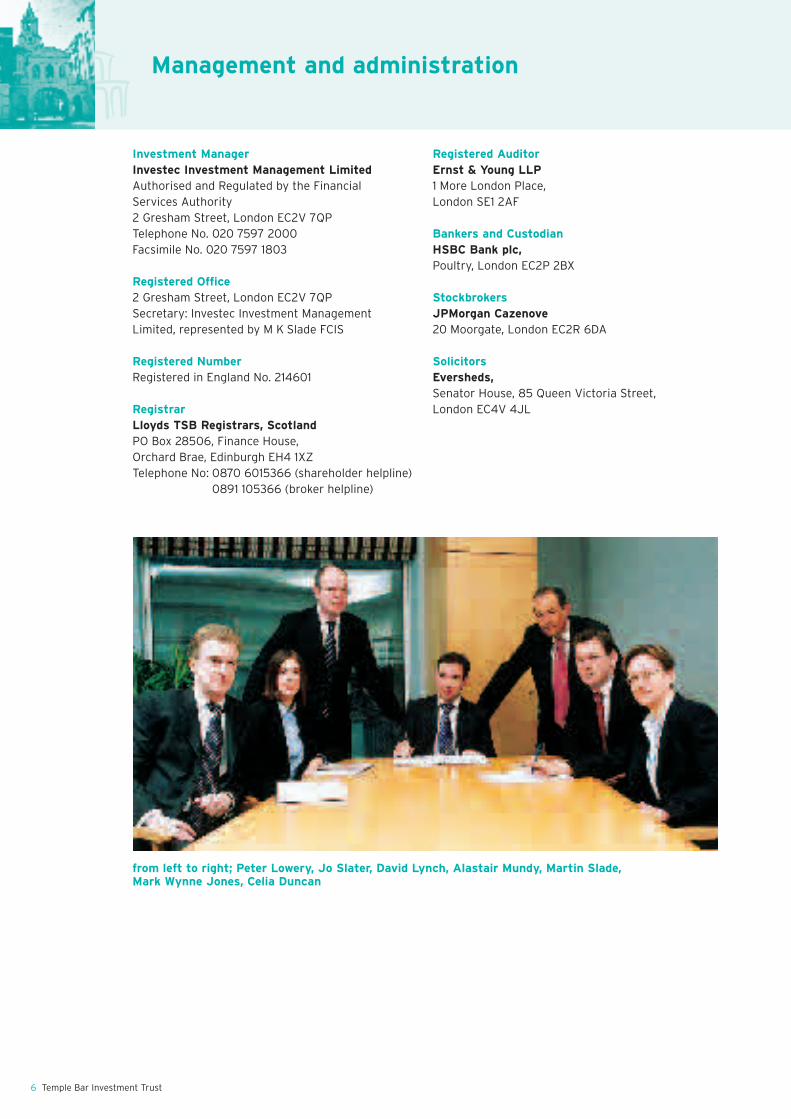
Investment ManagerInvestec Investment Management LimitedAuthorised and Regulated by the Financial Services Authority2 Gresham Street, London EC2V 7QPTelephone No. 020 7597 2000Facsimile No. 020 7597 1803
Registered Office2 Gresham Street, London EC2V 7QPSecretary: Investec Investment ManagementLimited, represented by M K Slade FCIS
Registered NumberRegistered in England No. 214601
RegistrarLloyds TSB Registrars, ScotlandPO Box 28506, Finance House, Orchard Brae, Edinburgh EH4 1XZTelephone No: 0870 6015366 (shareholder helpline)
0891 105366 (broker helpline)
Registered AuditorErnst & Young LLP1 More London Place, London SE1 2AF
Bankers and CustodianHSBC Bank plc, Poultry, London EC2P 2BX
StockbrokersJPMorgan Cazenove20 Moorgate, London EC2R 6DA
SolicitorsEversheds, Senator House, 85 Queen Victoria Street, London EC4V 4JL
from left to right; Peter Lowery, Jo Slater, David Lynch, Alastair Mundy, Martin Slade, Mark Wynne Jones, Celia Duncan
Management and administration
6 Temple Bar Investment Trust
Annual report • Final copy:Temple Bar RA 23/2/07 19:20 Page 6

The total return on thenet assets of TempleBar during 2006 was17.7%, which compareswith a total return forthe FTSE All-ShareIndex of 16.8%. Thereturn achieved is acombination ofunderlying portfolioperformance and theeffect of the capitalgearing of the Trust.
While it is always pleasant to report positively onshort-term performance, the Board is primarilyfocused on longer time periods. The five year trackrecord, over which the fund manager is principallyjudged, demonstrates sustained positiveperformance.
The Board is recommending a final dividend of 19.88p,to produce a total increase for the year of 5.0%. Thisdividend will be payable on 30 March 2007 toshareholders on the register as at 16 March 2007.This is the 23rd consecutive year that the dividendhas been increased. The revenue reserve, which, afteradjusting for the proposed final dividend for 2006,represents 84.2% of the 2006 dividend, shouldprovide shareholders with additional comfortregarding the security of the dividend.
Post-tax revenue earnings increased by 3.2%. Theproposed dividend was more than covered by netearnings generated on the portfolio during the year.The level of capital gearing, 11.9% at year end, againcontributed positively to performance during theperiod.
The price of Temple Bar shares traded at a smalldiscount to their underlying asset value throughoutthe year, once again supported by the steady demandcreated within the Company’s Savings Scheme. TheBoard has encouraged the Manager to maintain aregular dialogue with our larger shareholders andinvestment intermediaries.
StrategyAt the Board’s strategy review this year, inconjunction with the Manager, the strategy behind
the Temple Bar portfolio was assessed against boththe latest market developments and shareholders’expectations. Investment restrictions on theManager were also reviewed.
Overall, the conclusion of this discussion was thatmajor changes were not warranted but that therelaxation of selective constraints would provide theManager with greater flexibility and increase thepotential for out-performance of both ourbenchmark, the FTSE All-Share Index, and our peergroup, without a significant increase in long-termrisk. Inter alia, it was decided that the fund managershould have the authority to invest up to 50% ofthe portfolio in stocks outside the FTSE 100 (against30% previously) and that the Board would considerrequests to extend the non-FTSE 100 componentbeyond this point.
To reflect this greater flexibility, the Board hasagreed a new investment policy with the Manager,which is included on page 1 of these Report andAccounts.
The fund manager has no immediate plans to makeuse of this increased flexibility; as he details in hisreport, he currently sees greater value in the largeststocks in the market.
The Board also decided to ask the Manager tosecure an overdraft facility of £25m, to consider theuse of options as part of an overall hedgingstrategy, in particular market conditions, and to beaware of the potential for investing in ‘specialsituations’, such as high yield debt, in line with hiscontrarian principles. It was further felt that theManager should have greater flexibility with regardto balancing potential revenue and capital growthopportunities and it was agreed, therefore, that inany one year, up to 7.5% of the revenue reservecould be used to fund the dividend, if necessary.
OutlookThe bull market is now over four years old and overthat time some dramatic returns have beenachieved. The FTSE 100 has more than doubled(after reinvesting income) and the FTSE 250 (the250 largest stocks in the UK market after the
Chairman’s statement
Temple Bar Investment Trust 7
Annual report • Final copy:Temple Bar RA 23/2/07 19:20 Page 7

FTSE 100) has risen by over 200%. Corporateprofit margins are generally high, which manywould regard as unsustainable, and thevaluations of most companies are well above thelows they reached during the bear market.
The Manager believes that much of the valuethat remains in the market is to be foundamongst the largest companies as these offer animpressive combination of low valuations, strongbalance sheets, a greater security of earningsand better prospects for dividend growth. As aresult of this view, the portfolio is moreconcentrated than has been the normhistorically.
Any interruption to the earnings momentum thathas driven the market in the last few years islikely to increase volatility and thus provide anenhanced number of contrarian opportunities forour Manager to investigate. Currently, ourManager prefers to hold a portfolio more biasedtowards security than risk.
Annual General MeetingThe AGM will be held on Monday 26 March at theManagers’ office in London. In addition to theformal business of the meeting, the Managerswill make a presentation to shareholdersreviewing the past year and commenting on theoutlook. I look forward to welcoming as many ofyou as possible. Shareholders who are unable toattend the meeting are encouraged to use theirproxy votes.
John Reeve20 February 2007
Chairman’s statement continued
8 Temple Bar Investment Trust
Annual report • Final copy:Temple Bar RA 23/2/07 19:20 Page 8
UK Fixedinterest
Cash& other
Preferenceshares
Ordinaryshares
Twenty largest investmentsas at 31 December 2006
Total
Valuation Valuation assets
31 December Net purchases/ Appreciation/ 31 December less current
Company 2005 (sales) (depreciation) 2006 liabilities
£’000 £’000 £’000 £’000 %
Royal Dutch Shell 39,750 4,666 (1,523) 42,893 7.17
BP 24,322 21,873 (4,580) 41,615 6.95
HSBC 18,372 21,302 (394) 39,280 6.56
Vodafone 36,395 – (489) 35,906 6.00
GlaxoSmithKline 35,123 3,728 (3,088) 35,763 5.98
Royal Bank of Scotland 25,974 – 3,522 29,496 4.93
BT 15,686 – 5,545 21,231 3.55
AstraZeneca 13,721 6,640 (928) 19,433 3.25
Unilever 10,071 6,361 1,863 18,295 3.06
Signet – 14,356 2,234 16,590 2.77
HBOS 9,892 3,880 1,877 15,649 2.61
Prudential 16,299 (5,995) 4,448 14,752 2.46
Centrica 15,285 (5,908) 4,803 14,180 2.37
Legal & General 10,980 – 3,195 14,175 2.37
Amvescap 9,945 (562) 3,431 12,814 2.14
Kingfisher 8,897 2,230 202 11,329 1.89
Daily Mail & General Trust – 9,392 1,153 10,545 1.76
ITV 10,913 – (583) 10,330 1.73
HMV 2,711 9,748 (2,426) 10,033 1.68
Taylor Nelson Sofres 4,158 4,011 892 9,061 1.51–––––––––––– –––––––––––– –––––––––––– –––––––––––– –––––––
308,494 95,722 19,154 423,370 70.74–––––––––––– –––––––––––– –––––––––––– –––––––––––– –––––––
All securities in any one company are treated as one investment.
Asset allocation as at 31 December 2006BY CLASS (%) PORTFOLIO DISTRIBUTION (%)
%Ordinary shares 96.36UK Fixed interest 0.24Preference shares 0.16Cash & other 3.24
––––––100.00––––––
%Oil & Gas 14.59Basic Materials 0.59Industrials 3.67Consumer Goods 7.04Health Care 9.53Consumer Services 24.79
%Telecommunications 10.87Utilities 3.20Technology 0.64Financials 24.83UK Fixed Interest 0.25
––––––100.00––––––
Oil & GasBasic
Materials
Industrials
ConsumerGoods
Health Care
Consumer ServicesTelecommunications
Utilities
Technology
Financials
UK Fixed Interest
Temple Bar Investment Trust 9
Annual report • Final copy:Temple Bar RA 23/2/07 19:20 Page 9
In 2006, the UK equity market delivered
investors a fourth successive year of gains. The
prevalent themes of the last few years remained
in place: a belief that valuations were low, good
growth of profits and dividends and a high level
of merger and acquisition activity. Although
inflationary fears started to pick up, together
with the long-anticipated slowdown in US
economic growth, investor sentiment remained
positive.
The rise in the UK market from the low point of
March 2003 until the correction of Spring 2006
was the longest recorded uptrend without a 10%
pullback. Somewhat paradoxically the 10% fall in
the FTSE 100 was immediately labelled as
‘healthy’ and provided the bulls with the
justification for a strong recovery. They argued
that in late 2005 and early 2006 the market had
become less sensitive to risk and needed the
correction to remove the froth before it could
reach new highs. However, although the UK
market did hit these new highs later in the year,
it was not evident that the setback had
encouraged investors to become more risk
averse. In fact, it seemed that the exact opposite
had occurred – medium-sized equities continued
to outperform their larger peers; emerging
market equities recovered faster than developed
markets; spreads on high yield bonds relative to
government bond yields narrowed to multi-year
lows.
The performance of the portfolio over the year
may be viewed as two distinct parts: under-
performance relative to the market in the first
part being countered by out-performance in the
second part. In the first part, ending in April, the
market favoured stocks with a ‘story’: preferably
one stretching well into the future. In particular,
many investors continued to be attracted by
stories of a new paradigm in the commodity
markets. We thought the future in these areas
was less clear cut and that the expected
profitability and ratings attached to them by the
market were too high. The spring sell-off brought
a reversal in the Mining sector and, although the
overall market ended the year higher, the larger
miners such as Rio Tinto and BHP Billiton
recovered little of their lost ground over the
remainder of the year. Our nil exposure to this
sector contributed significantly to our improved
performance during the market fall.
10 Temple Bar Investment Trust
Manager’s report
The fall appeared to refocus investors on their
other target – ‘medium-sized’ equities, although
this description is not clear cut. Certainly, the
groupings used by most market commentators to
determine size: FTSE 100 (the largest 100
companies by market capitalization), FTSE 250
(the next 250 companies – hence mid caps) and
the FTSE Small Cap (the remaining 350 or so
companies in the FTSE All-Share Index) are too
rigid. Currently, instead, medium-sized seems to
be shorthand for the bid potential of any
company.
The shorthand may be simplistic, but it seems
justifiable when related to investor behaviour. A
number of ‘medium-sized’ companies have
received bids in the last few years, and the
pattern could well continue. With bidders often
motivated by the combination of potential cost
cutting opportunities, increased leverage and
fairly cheap funding, the potential for bids has
played on the twin emotions of fear and greed
that investors have always found hardest to
control. Their fear of missing out on a bid, having
held a stock for some time, and the greed for
receiving a bid, skewed supply and demand of
these stocks, leading, in our opinion, to a number
of them now trading at rich valuations.
PERFORMANCE ATTRIBUTION ANALYSIS
The following illustrates the factors that have
contributed to the Company’s performance in the
year to 31 December 2006:
Attribution Analysis %
Total return of FTSE All-Share Index 16.75
Relative return from the portfolio 0.30––––––––
Performance on total assets 17.05
Income distributed to shareholders* (3.33)
Expenses* (0.51)
Finance costs* (0.92)––––––––
12.29
Impact of gearing on portfolio 1.66––––––––
Change in net asset value
per ordinary share 13.95––––––––
* as percentage of opening NAV
High valuations, while not necessarily an
obstruction to higher prices, undoubtedly
increase the risk to an investor (assuming that
Annual report • Final copy:Temple Bar RA 23/2/07 19:20 Page 10
value of their Russian assets. The largest
pharmaceutical companies, GlaxoSmithKline and
AstraZeneca provided little encouragement
about the development of new drugs; and the
largest banks, HSBC and Royal Bank of Scotland,
suffered minor profit downgrades as the first
signs of a US consumer slowdown diminished the
quality of their loan books.
These stocks have now reached such low
valuations that we believe a great deal of
negative news is already included in their prices.
In fact, we can find few stocks elsewhere in the
market offering such a good combination of
secure earnings, balance sheet strength, dividend
growth and valuation support. Therefore, during
the year, we increased our holdings of all, except
Royal Bank of Scotland. These companies could
be involved in merger, and possibly de-merger,
activity in the future – and this is clearly not
discounted in their existing valuations. As a
result of these attractions, a significant part of
the portfolio is represented by a relatively small
number of holdings. While this might displease
advocates of investment diversification, we
believe that when building a portfolio it is of
primary importance to focus on finding cheap
stocks, rather than targeting a specific number of
holdings. While through the cycle we would
expect to have a greater number of holdings of
medium-sized companies, their valuations
currently preclude this and we are content with
an increased focus on the largest companies.
Another theme to note in the portfolio is the
sizeable position in the Media and General Retail
sectors. Many of these holdings have been
affected by rapid changes in consumer behaviour
that have occurred, or in some instances are
expected to occur, as a result of the increasing
usage of the internet. For example, HMV and
Woolworths have been affected by severe price
deflation in the CD and DVD market and Trinity
Mirror and ITV have suffered as advertising has
moved away from some traditional markets.
BSkyB and EMI have been volatile while investors
attempt to clarify whether they will retain their
large market positions, or whether customers will
find it easier and cheaper to access these
companies’ products in alternative ways.
However, we believe it is important to bear in
mind some positive prospects for these
the fundamentals of the company are
unchanged). Currently, investors appear happy to
accept the risk, believing that they are
underwritten by bidders, particularly private
equity buyers ready to pounce if prices fall. This
may be true to some extent but, historically,
private equity managers have avoided paying
high prices without good reason.
Given this background, it is no surprise that the
biggest contributors to the portfolio’s relative
performance during the year came mainly from
medium-sized companies: Cable & Wireless,
easyJet, N Brown, ICAP (all FTSE 250
constituents) and Centrica, Amvescap,
Legal & General and BT (FTSE 100 constituents
but still within biting distance of private equity).
As always, there were stocks whose performance
disappointed such as HMV, GlaxoSmithKline and
Royal Dutch Shell. However, in general, the
portfolio benefited from the absence of any
stocks which were significant negative
contributors to performance. It is important to
stress that this will not always be the case. As
contrarian investors, we are always seeking to
buy stocks that are significantly out of favour but
have the potential to exhibit strong share price
performance. With hindsight, we can see that
while some stocks are indeed out of favour but
cheap, others are out of favour but expensive.
History shows that the majority of stocks mean
revert, ie what goes down comes back up and
vice versa, in terms of both profitability and
share price, and our analysis aims to put the
odds on success further in our favour. However,
any portfolio will include some losers – those that
don’t mean revert in our holding period – and
sometimes no amount of analysis will protect a
fund from this.
Last year we highlighted the apparently
attractive valuations of many FTSE 100
companies which had clearly under-performed
the broader market for a number of years.
Generally, these companies, and in particular
many of the largest ones, disappointed again in
2006. As noted above, the market’s focus on
potential bid stocks offered little sustenance to
the market’s giants, and the newsflow from these
companies offered little to excite investors. In the
Oil sector, BP was affected by safety issues, and
Royal Dutch Shell and BP by concerns over the
Temple Bar Investment Trust 11
Annual report • Final copy:Temple Bar RA 23/2/07 19:21 Page 11
12 Temple Bar Investment Trust
and, particularly, the high quality customer
service associated with a familiar and well
regarded chain of physical high street stores.
Simultaneously, management promoted internet
sales to attract or retain price conscious
customers. Investors warmed to this strategy and
despite a disappointing Christmas trading
statement, the shares stand significantly higher
than the level at which we purchased them.
We purchased our holding in Jessops when the
shares were out of favour, and most
commentators believed the company to be in
structural decline. The market often exaggerates
a company’s problems, but we know that
outcomes are often far more positive than seem
likely when the panic is at its peak.
One possible reading of events in 2006 is that
investors took the Spring correction as a
warning, and subsequently increased the
protection element in their portfolios. However,
rather like driver self-confidence induced by seat
belts and air bags, it is possible that the
correction encouraged greater acceptance of
risk. Clearly, risk is reduced if protection is
precisely aligned with the constituent parts of
the portfolio. However, the science is undermined
by the capricious nature of asset markets, where
an imperfect hedge may provide far less
protection than expected in a severe market sell-
off, and could result in risky assets being
liquidated. In turbulent markets, this alone could
create downward momentum.
These factors of portfolio construction tend
currently to focus us on lowly rated liquid stocks
and strong balance sheets. Of course, if our
opinion hardens, we could easily increase the
level of liquidity on the portfolio, or buy some
protection. However, while market conditions
allow us to purchase a sufficient number of
stocks with the characteristics we desire, we are
happy to be almost fully invested.
Alastair Mundy
Investec Investment Management Limited
20 February 2007
companies. The swift take-up of broadband
internet has surprised many commentators, and
company managements have often been caught
without a strategic response. Although the
internet has encouraged new competition, much
of which did not exist even ten years ago, the
strengths of the incumbent companies should
not be under-stated.
In most cases, the incumbents are now
establishing, or have already established, equally
dominant positions on the internet. For example,
in the past few months, HMV’s Waterstone’s has
launched its own website, while most of the
largest UK recruitment websites are now owned
by traditional media companies, successfully
defending their positions.
It is always difficult to disentangle a structural
theme from a cyclical theme. The weakness of
sales in HMV and Woolworths may be as much a
reflection of poor music and indifferent film
releases – a cyclical effect – as of a structural
move to the internet.
Some of the changes may be faddish. For
example, companies may have been encouraged
to move their advertising away from traditional
media towards the internet; however, as the
power of internet advertising is untested, some
move back to the traditional formats is, at least,
possible.
Many incumbent companies have unassailable
content or brands. As a case in point EMI’s back
catalogue of music, and ITV’s archive of classic
programmes, are unique and, in fact, will
probably respond positively to new delivery
channels.
Finally, and perhaps most importantly, the
weakened share prices of these companies
already discount very unattractive scenarios.
Wider appreciation of any of the positives listed
above could significantly affect valuations.
Our holding in Jessops, the camera retailer,
provides a good case study. In 2005, investors
were concerned that a large percentage of
camera sales was likely to migrate from shops to
the internet; and, indeed, the company’s
operating performance suggested this was
already happening. As a result, the shares halved
from their peak. However, management quickly
assessed the gravity of the problem and
implemented a strategy utilising the advantages
Manager’s report continued
Annual report • Final copy:Temple Bar RA 23/2/07 19:21 Page 12

Temple Bar Investment Trust 13
Portfolio of investments
Valuation of FTSE All-holding as at Share Index31 December Percentage of 31 December
2006 Portfolio 2006£’000 % %
OIL & GAS
Oil & Gas 14.59 14.47BP 41,615Royal Dutch Shell (‘B’ shares) 42,893
––––––––––– –––––––––––14.59 14.47
––––––––––– –––––––––––
BASIC MATERIALS
Chemicals 0.59 0.58Scapa 397Yule Catto 3,026
Basic Resources – 6.67––––––––––– –––––––––––
0.59 7.25––––––––––– –––––––––––
INDUSTRIALS
Construction & Materials 0.93 0.67Heywood Williams 5,380
Industrial Goods & Services 2.74 6.78Alpha Airports 1,450Invensys 3,409Qinetiq 1,526St Ives 5,900TDG 3,567
––––––––––– –––––––––––3.67 7.45
––––––––––– –––––––––––
CONSUMER GOODS
Automobiles & Parts – 0.12Food & Beverage 5.21 4.82
Britvic 6,225Unilever 18,295UNIQ 5,638
Personal & Household Goods 1.83 4.71Alba 1,036British American Tobacco 5,879SSL International 3,697
––––––––––– –––––––––––7.04 9.65
––––––––––– –––––––––––
HEALTH CARE
Health Care 9.53 7.30AstraZeneca 19,433GlaxoSmithKline 35,763
––––––––––– –––––––––––9.53 7.30
––––––––––– –––––––––––
Annual report • Final copy:Temple Bar RA 23/2/07 19:21 Page 13
14 Temple Bar Investment Trust
Portfolio of investments continued
Valuation of FTSE All-holding as at Share Index31 December Percentage of 31 December
2006 Portfolio 2006£’000 % %
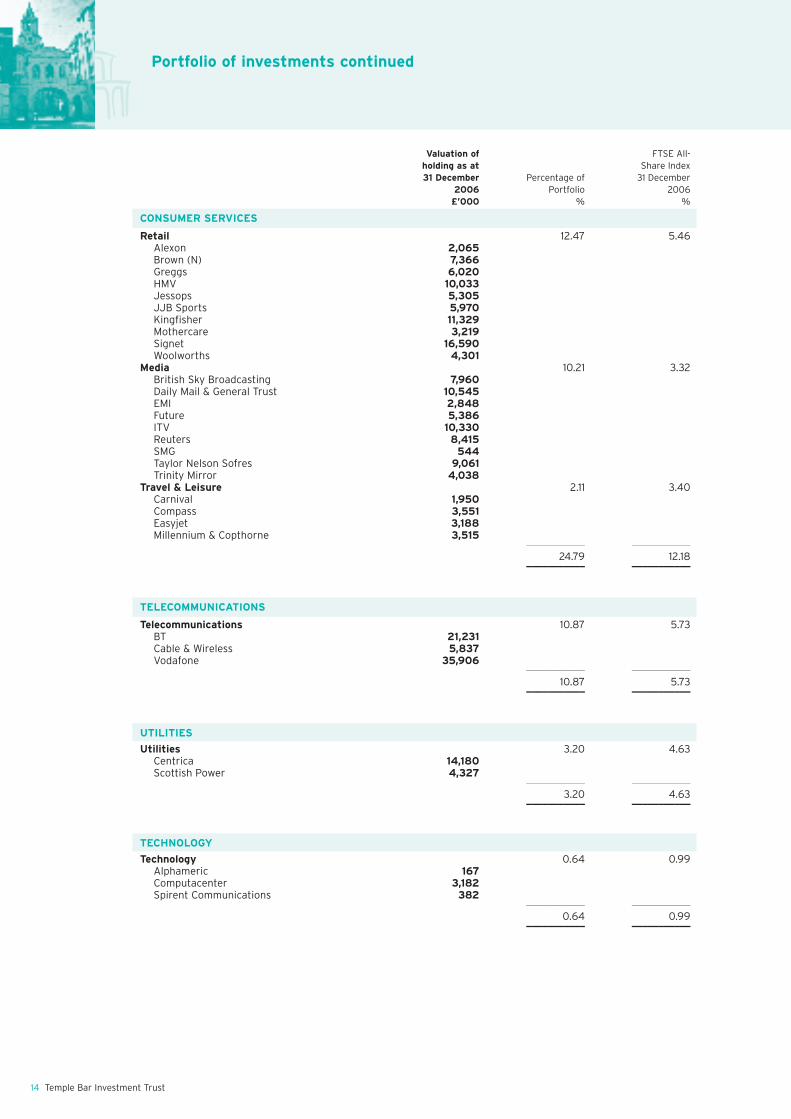
CONSUMER SERVICES
Retail 12.47 5.46Alexon 2,065Brown (N) 7,366Greggs 6,020HMV 10,033Jessops 5,305JJB Sports 5,970Kingfisher 11,329Mothercare 3,219Signet 16,590Woolworths 4,301
Media 10.21 3.32British Sky Broadcasting 7,960Daily Mail & General Trust 10,545EMI 2,848Future 5,386ITV 10,330Reuters 8,415SMG 544Taylor Nelson Sofres 9,061Trinity Mirror 4,038
Travel & Leisure 2.11 3.40Carnival 1,950Compass 3,551Easyjet 3,188Millennium & Copthorne 3,515
––––––––––– –––––––––––24.79 12.18
––––––––––– –––––––––––
TELECOMMUNICATIONS
Telecommunications 10.87 5.73BT 21,231Cable & Wireless 5,837Vodafone 35,906
––––––––––– –––––––––––10.87 5.73
––––––––––– –––––––––––
UTILITIES
Utilities 3.20 4.63Centrica 14,180Scottish Power 4,327
––––––––––– –––––––––––3.20 4.63
––––––––––– –––––––––––
TECHNOLOGY
Technology 0.64 0.99Alphameric 167Computacenter 3,182Spirent Communications 382
––––––––––– –––––––––––0.64 0.99
––––––––––– –––––––––––
Annual report • Final copy:Temple Bar RA 23/2/07 19:21 Page 14

Temple Bar Investment Trust 15
Valuation of FTSE All-holding as at Share Index31 December Percentage of 31 December
2006 Portfolio 2006£’000 % %
FINANCIALS
Banks 14.58 17.59HBOS 14,716HBOS (9.25% non cum pref shares) 933HSBC 39,280Royal Bank of Scotland 29,496
Insurance 7.08 4.80Friends Provident 4,837Highway Insurance 1,009Legal & General 14,175Prudential 14,752Resolution 508Standard Life 5,720
Financial Services 3.17 7.96Amvescap 12,814Framlington Innovative Growth Trust 1,556Wichford 3,969
––––––––––– –––––––––––24.83 30.35
––––––––––– –––––––––––
UK FIXED INTEREST
BAA 11.75% 2016 1,470 ––––––––––– ––––––––––– –––––––––––
TOTAL BONDS 1,470 0.25 –––––––––––– ––––––––––– –––––––––––
––––––––––– ––––––––––– –––––––––––TOTAL VALUATION OF PORTFOLIO 579,105 100.00 100.00
––––––––––– ––––––––––– –––––––––––
All investments are ordinary shares unless otherwise stated.
––––––––––– ––––––––––– –––––––––––TOTAL EQUITIES 577,635 99.75 100.00
––––––––––– ––––––––––– –––––––––––
Annual report • Final copy:Temple Bar RA 23/2/07 19:21 Page 15

16 Temple Bar Investment Trust
Report of the directors
The directors present their report and accountsfor the year ended 31 December 2006.
BUSINESS REVIEW
Introduction
This business review forms part of the Directors’Report. Its function is to provide a balanced andcomprehensive review of the Company’sperformance and development during the yearand its position at the year end. The review alsocovers the principal risks and uncertainties facedby the Company and sets out key performanceindicators used to measure, monitor and managethe Company’s business.
Business of the Company
The Company carries on business as aninvestment trust and was approved by HMRevenue & Customs as an investment trust inaccordance with Section 842 of the Income &Corporation Taxes Act 1988 for the year ended 31December 2005. In the opinion of the directorsthe Company has subsequently conducted itsaffairs so that it should continue to qualify.
The Company’s principal business activity ofinvestment management is sub-contracted toInvestec Investment Management Limited (‘IIM’)under the ultimate supervision of the board ofdirectors. The Company has one active whollyowned subsidiary company, whose principalactivity is investment dealing and one dormantsubsidiary.
A review of the business is given in theChairman’s statement and the Manager’s report.The results of the Group are shown on page 27.
Investment Objective and Policies
The Company’s investment objective is to providegrowth in income and capital to achieve a longterm total return greater than the benchmarkFTSE All-Share Index, through investment in UKsecurities. The Company’s policy is to invest in abroad spread of securities with typically themajority of the portfolio selected from theconstituents of the FTSE 100 Index.
Investment Approach
The investment approach of our Manager ispremised on a contrarian view on the timing ofbuy and sell decisions, buying the shares ofcompanies when sentiment towards them is at ornear its worst, and selling them as fundamentalprofit improvement and/or re-evaluation of theirlong-term prospects takes place.
The belief is that repeated investor behaviour in
driving down the prices of ‘out-of-favour’companies to below their fair value will offerinvestment opportunities provided a typicalemotional response to both good and bad newscan be avoided. This will allow the Company topurchase shares at significant discounts to theirfair value and sell them as they become morefully valued, principally as a result of predictablepatterns in human psychology.
The Manager’s process is designed to produce‘best ideas’ to drive active fund managementwithin a rigorous control framework. Theframework begins through narrowing down theuniverse of stocks by passing those companieswith a market capitalisation above £100mthrough a screening process which highlights the weakest performing stocks. This isolatesopportunities with attractive sentimentcharacteristics which are then in turn scrutinisedin greater detail to identify investmentopportunities.
The process is very much bottom-up, and canresult in large sector positions being taken ifenough stocks of sufficient interest are foundwithin one sector. However, top down riskanalysis is undertaken to identify potentialconcentration of risk and to factor thisawareness into portfolio construction. Theportfolio comprises stocks which have beenpurchased for different reasons and at differenttimes. In general, because of the bottom-upapproach to stockpicking, each of these reasonsis independent of the other and the portfolio,therefore, is not excessively vulnerable to longer-term macro trends. Cash is a residual of theprocess and normally will not exceed 5% of theportfolio value.
The approach to stock selection and portfolioconstruction is driven by four core beliefs:
1. Markets overreact to news on the upside and
the downside. The Manager aims to be
sceptical of the crowd and aware of investor
psychology, which often causes overvaluation
of those stocks that are deemed to have good
prospects and an undervaluation of those
which are out of favour.
2. There are few companies which sustain below
normal profits over the longer term. Weaker
companies tend to leave an industry, thus
improving the balance of supply and demand,
are bid for or management is changed.
Similarly, there are few companies which can
sustain supernormal profits over the longer
Annual report • Final copy:Temple Bar RA 23/2/07 19:21 Page 16
Temple Bar Investment Trust 17
term. Such profits tend to be competed or
regulated away.
3. Fundamental valuation is the key determinant
of stock prices over the long-term. In other
words ‘cheap’ stocks will outperform
‘expensive’ stocks.
4. Diversification is an important control.
Particular companies or sectors can be out of
favour for a considerable time.
Performance
In the year to 31 December 2006 the net asset
value total return of the Company increased by
17.72% compared with the total return by the
Company’s benchmark index of 16.75%. The
investment manager’s report on pages 10 to 12
includes a review of developments during the
year together with information on investment
activity within the Company’s portfolio.
Key Performance Indicators
The key performance indicators (‘KPIs’) used todetermine the progress and performance of theCompany over time and which are comparable tothose reported by other investment trusts are setout below:-
– Net asset value total return relative to the FTSE
All-Share Index
– Performance attribution
– Discount on net asset value
– Earnings and dividends per share
– Total expense ratio
While some elements of performance againstKPIs are beyond management control theyprovide measures of the Company’s absolute andrelative performance and are, therefore,monitored by the board on a regular basis.
Net Asset Value Total Return
In reviewing the performance of the assets of theCompany’s portfolio the Board monitors the netasset value in relation to the FTSE All-ShareIndex. During the year the net asset value totalreturn of the Company rose by 17.72% comparedwith a rise of 16.75% by the FTSE All-Share Index.
Performance Attribution
The purpose of performance attribution analysis
is to assess how the Company achieved its
performance relative to its benchmark index.
Details of the attribution analysis for the year
ended 31 December 2006 are given in the
investment manager’s report on page 10.
Discount on Net Asset Value
The Board monitors the premium/discount atwhich the Company’s shares trade in relation tothe assets. During the year the shares traded atan average discount to NAV of 3.5%. The Boardand Manager closely monitor both movements inthe Company’s share price and significantdealings in the shares. In order to avoidsubstantial overhangs or shortages of shares inthe market the Board asks shareholders toapprove resolutions each year which allow forthe buy back of shares and their issuance whichcan assist in the management of the discount.Regular demand generated by monthlyinvestment in the Savings Scheme and the use ofmarketing and promotional activity also assist inkeeping the discount at an acceptable level.
Earnings and Dividend Per Share
It remains the directors’ intention to distributeover time by way of dividends substantially all ofthe Company’s net revenue income afterexpenses and taxation. The Manager aims tomaximise total returns from the portfolio andattaches great importance to dividends inachieving total return. The portfolio will typicallyprovide a yield premium to the market. The finaldividend recommended for the year is 19.88p perordinary share which brings the total for the yearto 29.23p per ordinary share, an increase of5.03%. This increase exceeds the RPI inflation of4.43% by a comfortable margin and is the 23rdconsecutive year in which the Company hasincreased the overall level of its dividendpayment.
Total Expense Ratio (TER)
The TER is an expression of the Company’smanagement fees and all other operatingexpenses (including tax relief where allowablebut excluding interest payments) as a percentageof average month end net assets over the year.The TER for the year ended 31 December 2006was 0.47% (2005 0.46%). The Board reviewseach year a comparison of the Company’s TERwith those of its peers. At the present time theCompany has one of the lowest TERs in theincome and growth sector of investment trustcompanies.
Annual report • Final copy:Temple Bar RA 23/2/07 19:21 Page 17

18 Temple Bar Investment Trust
Report of the directors continued
Principal Risks and Uncertaintities
The principal risks facing the Company fall underthe general categories of strategy, operationaland management risks. With the assistance ofthe Manager the Board has drawn up a riskmatrix which identifies the key risks to theCompany under these broad headings. The Boardreviews and agrees policies, which have remainedunchanged since the beginning of the accountingperiod, for managing these risks as summarisedbelow.
Investment Strategy
An inappropriate investment strategy on matterssuch as asset allocation or the level of gearingmay lead to underperformance against theCompany’s benchmark index or peer companies,resulting in the Company’s shares trading on awider discount. The Board manages such risks bydiversification of investments through itsinvestment restrictions and guidelines, which aremonitored and reported on by the Manager. TheManager provides the directors with regular andaccurate management information includingabsolute and relative performance data,attribution analysis, revenue estimates, liquidityreports, risk profile and shareholder analysis. TheBoard monitors the implementation and resultsof the investment process with the investmentManager, who attends Board meetings.Periodically the Board holds a separate meetingdevoted to strategy.
Income Risk – Dividends
Generating the necessary level of income fromportfolio investments to meet the Company’sexpenses and to provide adequate reserves fromwhich to base a sustainable programme ofincreasing dividend payments to shareholders issubject to the risk that income generation frominvestments fails to meet the level required. TheBoard monitors this risk through the receipt ofdetailed income reports and forecasts which areconsidered at each meeting. As at 31 December2006 the Company had distributable revenuereserves of £25,071,000 before declaration ofthe final dividend for 2006.
Share Price Risk
The Company’s share price and discount to netasset value are monitored by the Manager and isconsidered by the Board at each meeting. Someshort term influences over the discount may beexercised by the use of share repurchases atacceptable prices; however, market sentiment is
beyond the absolute control of the managementand Board.
Accounting Legal & Regulatory
In order to qualify as an investment trust theCompany must comply with Section 842 of theIncome & Corporation Taxes Act 1988. Were theCompany to breach Section 842 it might loseinvestment trust status and, as a consequence,gains within the Company’s portfolio would besubject to capital gains tax. The Section 842qualification criteria are, therefore, monitored bythe Board at each meeting.
The Company must also comply with theprovisions of the Companies Acts and, since itsshares are listed on the London Stock Exchange,the UKLA Listing Rules. A breach of theCompanies Acts could result in the Companybeing fined or subject to criminal proceedings.Breach of the UKLA Listing Rules could result inthe Company’s shares being suspended fromListing which in turn would breach Section 842.The Board relies on the services of its companysecretary, Investec Investment ManagementLimited, and its professional advisers to ensurecompliance with the Companies Acts and theUKLA Listing Rules.
Corporate Governance and Shareholder
Relations
Details of the Company’s compliance withcorporate governance best practice includinginformation on relations with shareholders, areset out in the corporate governance report onpages 22 to 24.
Control Systems Risk
Disruption to, or failure of, IIM’s accounting,dealing or payments systems or the custodian’srecords could prevent accurate reporting andmonitoring of the Company’s financial position.Details of how the Board monitors the servicesprovided by IIM and its associates and the keyelements designed to provide effective internalcontrol are included within the internal controlsection of the corporate governance report onpages 22 to 24.
Other Risks
Other risks to which the Company is exposed andwhich form part of the market risks referred toabove are included in note 22 to the financialstatements together with summaries of thepolicies for managing these risks. Thesecomprise; market price risk, interest rate risk,liquidity risk and counterparty risk.
Annual report • Final copy:Temple Bar RA 23/2/07 19:21 Page 18
Temple Bar Investment Trust 19
The Board confirms that there is an ongoingprocess for identifying, evaluating and managingstrategic business and operational risks. Thisprocess is regularly reviewed by the Board inaccordance with the Turnbull guidance oninternal controls.
ORDINARY DIVIDENDS
An interim dividend of 9.35p per ordinary sharewas paid on 29 September 2006 (2005: 8.90p)and the directors are recommending a finaldividend of 19.88p per ordinary share (2005:18.93p), a total for the year of 29.23p (2005:27.83p). Subject to shareholders’ approval, thefinal dividend will be paid on 30 March 2007 toshareholders on the register on 16 March 2007.
PERSONAL EQUITY PLANS/ISAs
The Company has conducted its investment policy so
as to remain a qualifying investment trust under the
ISA and Personal Equity Plan regulations. It is the
intention of the Board to continue to satisfy these
regulations.
SHARE CAPITAL
There were no ordinary shares allotted during the
year.
DIRECTORS
The directors of the Company during the yearwere as stated below and their interests in theordinary share capital of the Company are asfollows. Each of the directors held officethroughout the year.
31 December 1 January
2006 2006
G J Allen 1,369 1,333
J F de Moller 1,211 –
R W Jewson 3,113 2,645
J Reeve 30,550 28,372
M R Riley 15,000 –
F L J Walton 6,724 6,724
All the above interests are beneficial. None of thedirectors had at any date any interest in either ofthe Company’s debenture stocks.
On 13 February 2007 Mr J Reeve acquired afurther 112 ordinary shares in the Companythrough his regular monthly saving in an ISA. On22 January 2007 Mr R W Jewson and Mrs J F deMoller acquired a further 29 and 58 ordinaryshares respectively in the Company through theirregular monthly savings in the Temple BarInvestment Trust Savings Scheme. No otherchanges in the interests shown above occurredbetween 31 December 2006 and 20 February2007.
No other person was a director during any partof the year.
The directors retiring by rotation and/or incompliance with the provisions of the AIC Codeare Mr J Reeve, Mr F L J Walton and Mr G JAllen. Each of these directors being eligible, theBoard recommends their re-election. In makingthese recommendations the Board has carefullyreviewed the composition of the Board as awhole and borne in mind the need for a properbalance of skills and experience. The Board doesnot believe that length of service per se detractsfrom the independence of a director, particularlyin relation to an investment trust, and on thatbasis considers that the directors standing for re-election are independent. It is confirmed that,following formal evaluation, the performance ofeach director continues to be effective and eachcontinues to demonstrate commitment to the role.
There were no contracts subsisting during or atthe end of the year in which a director of theCompany is or was interested and which are orwere significant in relation to the Company’sbusiness. No director has a service contract withthe Company.
PAYMENT OF SUPPLIERS
The Company’s policy is to obtain the bestpossible terms of payment from suppliers for allforms of business. All terms agreed withsuppliers have been complied with during theyear. There were no trade creditors at the yearend.
SUBSTANTIAL SHAREHOLDERS
As at 20 February 2007 the following companyhad indicated an interest in 3% or more of theissued ordinary shares of the Company.
%
Legal & General Group plc 3.41
MANAGEMENT CONTRACT
The Company has a management agreementwith Investec Investment Management Limited(‘IIM’) for the provision of investmentmanagement, secretarial, accounting andadministrative services to the Company and itssubsidiaries. The agreement is subject to oneyear’s notice of termination by either party.
IIM receives an investment management fee of0.35% per annum, payable quarterly, based onthe value of the investments (including cash) ofthe Company. Investments in funds managed bythe Investec Group are wholly excluded from thischarge. 60% (2005: 60%) of the investment
Annual report • Final copy:Temple Bar RA 23/2/07 19:21 Page 19
20 Temple Bar Investment Trust
Report of the directors continued
management fee payable to IIM is charged by theCompany to capital and the remaining 40%(2005: 40%) to the revenue account on the basisof the expected long term division of returns.
The investment management fee charged for theyear ended 31 December 2006 amounted to£1,960,000 (2005: £1,711,000) excluding valueadded tax.
IIM’s performance under the contract and thecontract terms are reviewed at least annually.This covers, inter alia, the performance of theManager, their management processes,investment style, resources and risk controls. Asnoted in the Chairman’s Statement, the recentperformance of the Company has been good,having outperformed its benchmark index over 5and 10 year periods. In the opinion of thedirectors the continued appointment of theinvestment Manager on the terms set out aboveis in the best interests of shareholders.
DONATIONS
No political or charitable donations were madeduring the year (2005: Nil).
DISCLOSURE OF INFORMATION TOAUDITORS
The directors are not aware of any relevantinformation of which the auditors are unawareand have taken all the steps that they ought tohave taken as directors in order to makethemselves aware of any relevant auditinformation and to establish that the Company’sauditors are aware of that information.
AUDITORS
A resolution to re-appoint Ernst & Young LLP as
auditors to the Company will be proposed at the
Annual General Meeting on 26 March 2007.
RENEWAL OF AUTHORITY TO ALLOTSHARES AND DISAPPLICATION OFPRE-EMPTION RIGHTS
It is proposed that the directors be authorised toallot up to £725,000 of relevant securities in theCompany (equivalent to 2,900,000 ordinaryshares of 25p each, representing 4.97% of itsordinary shares in issue).
When shares are to be allotted for cash, Section89(1) of the Companies Act 1985 requires suchnew shares to be offered first to existingshareholders in proportion to their existingholdings of ordinary shares. However, in certaincircumstances, it is beneficial to allot shares forcash otherwise than pro rata to existingshareholders and the ordinary shareholders canby special resolution waive their pre-emptionrights. Therefore, a special resolution will be
proposed at the Annual General Meeting which, ifpassed, will give the directors the power to allotfor cash equity securities up to an aggregatenominal amount of £725,000 (equivalent to2,900,000 ordinary shares of 25p each or 4.97%of the Company’s existing issued ordinary sharecapital), as if Section 89(1) does not apply.
The directors intend to use this authority to issuenew shares to participants in the Temple BarInvestment Trust Savings Scheme or to otherprospective purchasers whenever they believe itmay be advantageous to shareholders to do so.Any such issues would only be made at pricesgreater than net asset value, as adjusted for themarket value of the Company’s debt, and,therefore, would increase the assets underlyingeach share. The issue proceeds would be availablefor investment in line with the Company’sinvestment policy.
No issues of shares will be made which wouldalter the control of the Company without theprior approval of shareholders in generalmeeting.
The appropriate resolutions are set out in thenotice of meeting on page 45.
DIRECTORS’ AUTHORITY TO PURCHASETHE COMPANY’S OWN SHARES
The directors consider it desirable to give theCompany the opportunity to buy back shares incircumstances where the shares may be boughtfor a price which is below the net asset value pershare of the Company. The purchase of ordinaryshares is intended to reduce the discount atwhich ordinary shares trade in the marketthrough the Company becoming a new source ofdemand for ordinary shares. The rules of the UKListing Authority provide that the maximum pricewhich can be paid by the Company is 5% abovethe average of the market value of the ordinaryshares for the five business days before thepurchase is made.
The Company is not intending to make suchpurchases at present and will only exercise thepower after careful consideration and incircumstances where, in the light of prevailingmarket conditions, it is satisfied that it is in theinterests of the Company to do so. It is expectedthat any shares bought back pursuant to thisauthority will be cancelled rather than being heldin Treasury. The appropriate resolution is set outin the notice of meeting on page 45.
By order of the Board of DirectorsM K SladeFor Investec Investment Management LimitedSecretary20 February 2007
Annual report • Final copy:Temple Bar RA 23/2/07 19:21 Page 20

Temple Bar Investment Trust 21
Report on directors’ remuneration
This report is submitted in accordance with theDirectors’ Remuneration Report Regulations2002 in respect of the year ended 31 December2006. An ordinary resolution will be proposed atthe Annual General Meeting to approve thisreport, but the directors’ remuneration is notconditional upon the resolution being passed.
The Company does not have any executivedirectors and, as permitted under the ListingRules, has not, therefore, established aremuneration committee. Remuneration of non-executive directors is viewed as a decision of theBoard, subject to any shareholder approvalswhich may be necessary. In effect, therefore, theBoard as a whole fulfils the function of aremuneration committee. The Company’s Articlesof Association state that the Board shalldetermine the rate at which directors shall bepaid, provided that the aggregate of all such feesshall not exceed £150,000 per annum. This doesnot include any sums paid to directors that arenot classed as remuneration, e.g. expensereimbursements. The limit on the aggregateamount of directors’ fees paid is subject to theapproval of shareholders by an ordinaryresolution.
POLICY ON DIRECTORS’ REMUNERATION
The level of directors’ fees is determined withreference to a review of the remuneration paid tothe directors of a range of other investmenttrusts, comparable in terms of both size andinvestment characteristics. The Manager of theCompany compiles such analysis as part of themanagement and secretarial services provided tothe Company. No other external advice is takenin considering such fees. It is expected that thelevel of directors’ fees will continue to beassessed on this basis in forthcoming years.
Following the most recent review the Boardconcluded that the remuneration be increased to£25,750 p.a. for the Chairman and £17,500 p.a.for the other directors with effect from 1 January2007 to reflect the level of work andresponsibility involved. In addition, the Chairmanof the Audit Committee, currently Mr Allen, willreceive an annual remuneration of £19,500.
PERFORMANCE GRAPH
The directors consider that the most appropriatemeasure of the Company’s performance is itsshare price total return compared with the totalreturn on the FTSE All-Share Index. A graphillustrating this relative performance over a fiveyear period is shown below.
DIRECTORS’ EMOLUMENTS
The fee level for directors is shown below. Thereis no performance related fee. There is a formalletter of appointment for each director.
Directors are initially appointed until thefollowing Annual General Meeting when, underthe Company’s Articles of Association, it isrequired that they are offered for re-election byshareholders. Thereafter, a director’s continuingappointment is subject to re-election byshareholders on retirement by rotation or inaccordance with the AIC Code.
Audited
2006 2005
Director £ £
John Reeve 25,000 21,000
Gary Allen 19,000 14,000
June de Moller 17,000 8,500
John Hudson N/A 3,500
Richard Jewson 17,000 14,000
Martin Riley 17,000 14,000
Field Walton 17,000 14,000
Mr Walton’s remuneration is paid to FieldCorporate Services.
The fees disclosed above exclude employersnational insurance contributions and VAT whereapplicable.
No director received any pension contributions(2005: Nil).
By order of the Board of Directors
M K Slade
For Investec Investment Management Limited
Secretary
20 February 2007
Share Price Total Return
2002 2003 2004 2005 2006TEMPLE BAR - TOTAL RETURNFTSE ALL SHARE - TOTAL RETURN Source: DATASTREAM
60
80
100
120
140
160
180
Annual report • Final copy:Temple Bar RA 23/2/07 19:21 Page 21
22 Temple Bar Investment Trust
Corporate governance
APPLICATION OF AIC CODE PRINCIPLES
The Board attaches great importance to ensuring
that the Company operates to high ethical and
compliance standards. In addition, the Board
seeks to observe the principles set out in the AIC
Code of Corporate Governance, established
specifically for investment trust companies and
endorsed by the Financial Reporting Council in
February 2006. By following the Code, the
Company continues to meet its obligations in
relation to the FRC’s Combined Code on
Corporate Governance.
The Code provides a guide to best practice in
certain areas of governance where the specific
characteristics of investment trusts suggest that
alternative approaches to those set out in the
Combined Code may be preferable.
COMPLIANCE WITH THE PRINCIPLES OF THEAIC CODE OF CORPORATE GOVERNANCE
Operation of the Board
Each of the directors is independent of anyassociation with the management companywhich might interfere with the exercise ofindependent judgement. There is a formalschedule of matters to be specifically approvedby the Board and individual directors may seekindependent advice at the expense of theCompany within certain limits. The Board hasdelegated the investment management, withinclearly defined parameters and dealing limits,and the administration of the business toInvestec Investment Management Limited (‘IIM’).The Board makes all strategic decisions, reviewsthe performance of the Company at Boardmeetings and sets the objectives for theManagers. The directors have a range of businessand financial skills or experience relevant to thedirection of the Company. Mr G J Allen is theSenior Independent Director.
The Company Secretary is responsible to theBoard, inter alia, for ensuring that Boardprocedures are followed and for compliance withapplicable rules and regulations including the AICCode. Appointment or removal of the nominatedrepresentative of the Corporate CompanySecretary (‘the Company Secretary’) is a matterfor the Board as a whole.
The content and presentation of Board paperscirculated before each meeting contain sufficientinformation on the financial condition of theCompany. Key representatives of IIM attend eachBoard meeting enabling directors to probe on
matters of concern or seek clarification oncertain issues.
There were seven Board meetings, two auditcommittee meetings and two nominationcommittee meetings held during the year and theattendance by the directors was as follows:
Number of meetings attended
Audit Nomination
Board Committee Committee
John Reeve 7 2 2
Gary Allen 5 2 –
June de Moller 7 2 2
Richard Jewson 5 1 2
Martin Riley 7 2 2
Field Walton 7 2 2
Independence of the Directors
Each of the directors is independent of anyassociation with the management company andhas no other relationships or circumstanceswhich might be perceived to interfere with theexercise of independent judgement. Two of thesix directors (Mr Reeve and Mr Walton) haveserved on the Board for more than nine yearsfrom the date of their first election, but given thenature of the Company as an investment trustand the strongly independent mindset of theindividuals involved, the Board is firmly of theview that all of the directors can be consideredto be independent. In arriving at this conclusionthe Board makes a clear distinction between theactivities of an investment trust and aconventional trading company. An investmenttrust has no employees or executive directors,the only significant relationship being with themanagement company. In overseeing thisrelationship it is the view of the Board that longservice aids the understanding, judgement,objectivity and independence of the directorsand in no way detracts from any of thesequalities.
Re-election of directors
Directors are subject to re-election byshareholders at the first AGM following theirappointment and, thereafter, are subject toretirement by rotation at intervals of no morethan three years. In addition, the appointment ofeach director is reviewed by other members ofthe Board every year. Directors are not,therefore, subject to automatic reappointment.Non-executive directors are not appointed for
Annual report • Final copy:Temple Bar RA 23/2/07 19:21 Page 22
Temple Bar Investment Trust 23
specified terms. Because of the nature of aninvestment trust the Board believes that thecontribution and independence of a director isnot diminished by long service and, conversely,that a more detailed knowledge of the Companyand its business has a beneficial impact.
The directors due to stand for re-election at theforthcoming AGM are Mr Allen, Mr Reeve andMr Walton. The Board has carefully consideredthe position of each of these directors andbelieves it would be appropriate for them to beproposed for re-election. Each of the directorscontinues to be effective and to display anundiminished enthusiasm and commitment to therole.
Chairman
The Chairman has no relationships that maycreate a conflict of interest between his interestand those of shareholders. He has never been anemployee or an adviser to the Manager nor doeshe serve on the boards of other investmenttrusts managed by the same Manager.
He is also non-executive chairman of one otherquoted company and a director of a number ofother companies. He does not have a full timeexecutive role in any organisation and the Boardis satisfied that he has sufficient time availableto discharge fully his responsibility as Chairmanof the Company.
Audit Committee
The audit committee is a formally constitutedcommittee of the Board with defined terms ofreference which are available for inspection atthe AGM and can be inspected at the RegisteredOffice of the Company. It normally meets twiceyearly and among its specific responsibilities area review of the audit plan for the year, the reviewof the Company’s annual and half yearly results,together with associated documentation, and thereview of the internal and financial controlsapplicable to the management company. All ofthe directors are members of the auditcommittee and the Chairman is Mr Allen. Theauditors, who the Board has identified as beingindependent, are invited to attend the auditcommittee meeting at which the annual accountsare considered and any other meetings that thecommittee deem necessary.
Nomination Committee
A nomination committee has been established tooversee a formal review procedure governing theappointment of new directors and to evaluate the
overall composition of the Board from time totime, taking into account the existing balance ofskills and knowledge.
The committee is also responsible for assessingthe individual performance of directors and formaking recommendations as to whether theyshould remain in office. This committee is chairedby Mr Reeve.
Upon appointment to the Board each directorreceives relevant background information on theCompany together with a summary of the dutiesand responsibilities of directors. When a directoris appointed an induction meeting is arranged bythe Manager covering details about theCompany, its Manager, legal responsibilities,investment processes and investment trustindustry matters. Directors have also taken partin various training specific to non-executivedirectors, including courses and conferences runby the AIC.
Remuneration Committee
As all the directors are fully independent of themanagement company, the board as a wholefulfils the function of a remuneration committee.
Board/Audit Committee/Nomination
Committee/Director ongoing evaluation
On an annual basis the Board formally reviews itsperformance, together with that of the audit andnomination committees and the effectivenessand contribution of the individual directors,including the Chairman, within the context ofservice on those bodies. The review encompassesan assessment of how cohesively these bodieswork as a whole as well as the performance ofthe individuals within them. On the basis of thesereviews the Board has concluded that it has aproper balance of skills and is operatingeffectively.
Relations with Shareholders
Shareholder relations are given high priority byboth the Board and the Manager. The principalmedium by which the Company communicateswith shareholders is through the interim andannual reports. The information containedtherein is supplemented by regular NAVannouncements and by a monthly factsheetavailable on the Company’s website.
The Board largely delegates responsibility forcommunication with shareholders to themanagement company and, through feedback,expects to be able to develop an understanding
Annual report • Final copy:Temple Bar RA 23/2/07 19:21 Page 23

24 Temple Bar Investment Trust
Corporate governance continued
of their views. The current shareholdingconstituency of the Company is such that thereis only one major shareholder. All members ofthe Board are willing to meet with shareholdersat any time for the purpose of discussing mattersin relation to the operation and prospects of theCompany.
The Board welcomes investors to attend the AGMand encourages questions and discussion onissues of concern or areas of uncertainty. Inaddition, special arrangements have beenestablished to allow Temple Bar Savings Schemeinvestors to participate fully at Annual GeneralMeetings. A separate resolution will be proposedat the AGM in respect of each substantiallyseparate issue. Following the formal AGMproceedings the Manager makes a presentationto the meeting outlining the key investmentissues that face the Company.
Accountability, Internal Controls and Audit
The Board pays careful attention to ensuring thatall documents released by the Group and theCompany, including the Annual Report, present afair and accurate assessment of the Group andthe Company’s position and prospects.
After making enquiries, the directors have areasonable expectation that the Group and theCompany has adequate resources to continue inoperational existence for the foreseeable future,including recourse to a £25 million overdraftfacility with HSBC Bank. Accordingly, thedirectors continue to adopt the going concernbasis in preparing the accounts.
The directors are responsible for the Group andthe Company’s system of internal control and forreviewing its effectiveness. In order to facilitatethe control process the Board has requested theManagers to confirm annually that they haveconducted the Group and the Company’s affairsin compliance with the legal and regulatoryobligations which apply to the Group and theCompany and to report on the systems andprocedures within Investec which are applicableto the management of Temple Bar’s affairs. TheBoard meets on seven scheduled occasions ineach year and at each meeting receivessufficient financial and statistical information toenable it to monitor adequately the investmentperformance and status of the business.
The Board has also established a series ofinvestment parameters, which are reviewedannually, designed to limit the risk inherent inmanaging a portfolio of investments. Thesafeguarding of assets is entrusted to an
independent reputable custodian with whom theholdings are regularly reconciled.
The effectiveness of the overall system ofinternal control is reviewed on an annual basis bythe Board. Such a system can provide onlyreasonable and not absolute assurance againstmaterial misstatement or loss. The Boardbelieves that there is a robust framework ofinternal controls in place to meet therequirements of the AIC Code.
The Board receives reports from its advisers oninternal control matters and does not believethat there is scope or necessity for an internalaudit function in addition to that employed bythe Manager. This matter is subject to periodicreview. Based on the foregoing the Group andthe Company has a continuing process foridentifying, evaluating and managing the risks itfaces. This process has been in place for thereporting period and to the date of this reportand is regularly reviewed by the Board inaccordance with the requirements of the‘Internal Control Guidance for Directors on theCombined Code’ (the ‘Turnbull Guidance’) and theCombined Code.
Socially Responsible Investment
The Board believes that its primary duty is to actin the best financial interests of the Companyand its shareholders. While the Board takesaccount of the ethical stance of investeecompanies on matters such as the environmentor society as a whole, the ultimate objective is todeliver superior investment returns forshareholders.
Exercise of Voting Rights
The Managers have been instructed to vote onbehalf of the Company in accordance withrecommendations put forward by the NationalAssociation of Pension Funds (NAPF). Should theManagers wish to vote in a different way to therecommendation of the NAPF this requires thespecific approval of the Board.
Annual report • Final copy:Temple Bar RA 23/2/07 19:21 Page 24
Temple Bar Investment Trust 25
Independent Auditors’ Reportto the members of Temple Bar Investment Trust PLC
We have audited the group and company financialstatements (the ‘financial statements’) of Temple BarInvestment Trust PLC for the year ended 31 December 2006 which comprise the ConsolidatedIncome Statement, the Consolidated and CompanyBalance Sheets, the Consolidated and Company CashFlow Statement, the Consolidated and CompanyStatement of Changes in Shareholders’ Equity and therelated notes 1 to 22. These financial statements havebeen prepared under the accounting policies set outtherein. We have also audited the information in theDirectors’ Remuneration Report that is described ashaving been audited.
This report is made solely to the Company's members,as a body, in accordance with Section 235 of theCompanies Act 1985. Our audit work has beenundertaken so that we might state to the Company'smembers those matters we are required to state tothem in an auditors’ report and for no other purpose.To the fullest extent permitted by law, we do not acceptor assume responsibility to anyone other than theCompany and the Company's members as a body, forour audit work, for this report, or for the opinions wehave formed.
Respective responsibilities of directors and auditorsThe directors’ responsibilities for preparing the AnnualReport, the Directors’ Remuneration Report and thefinancial statements in accordance with applicableUnited Kingdom law and International FinancialReporting Standards (IFRS) as adopted by theEuropean Union are set out in the Statement ofDirectors’ Responsibilities.
Our responsibility is to audit the financial statementsand the part of the Directors’ Remuneration Report tobe audited in accordance with relevant legal andregulatory requirements and International Standardson Auditing (UK and Ireland).
We report to you our opinion as to whether thefinancial statements give a true and fair view andwhether the financial statements and the part of theDirectors’ Remuneration Report to be audited havebeen properly prepared in accordance with theCompanies Act 1985 and, as regards the group financialinformation, Article 4 of the IAS Regulation. We alsoreport to you whether in our opinion the informationgiven in the directors' report is consistent with thefinancial statements.
In addition we report to you if, in our opinion, thecompany has not kept proper accounting records, if wehave not received all the information and explanationswe require for our audit, or if information specified bylaw regarding directors’ remuneration and othertransactions are not disclosed.
We review whether the Corporate GovernanceStatement reflects the Company’s compliance with thenine provisions of the Combined Code specified for ourreview by the Listing Rules of the Financial ServicesAuthority, and we report if it does not. We are notrequired to consider whether the Board’s statementson internal control cover all risks and controls, or forman opinion on the effectiveness of the group’scorporate governance procedures or its risk andcontrol procedures.
We read other information contained in the AnnualReport and consider whether it is consistent with theaudited financial statements. The other informationcomprises the Summary of results, Ten year record,Comparative dividend growth, Five year summary,Chairman’s Statement, Twenty largest investments,Asset allocation, Manager’s report, Portfolio ofinvestments, Report of the Directors, unaudited part ofthe Report on Directors’ remuneration, Corporategovernance, Useful information for shareholders andNotice of meeting. We consider the implications for our report if we become aware of any apparentmisstatements or material inconsistencies with thefinancial statements. Our responsibilities do not extendto any other information.
Basis of audit opinionWe conducted our audit in accordance withInternational Standards on Auditing (UK and Ireland)issued by the Auditing Practices Board. An auditincludes examination, on a test basis, of evidencerelevant to the amounts and disclosures in the financialstatements and the part of the Directors’ RemunerationReport to be audited. It also includes an assessment ofthe significant estimates and judgments made by thedirectors in the preparation of the financial statements,and of whether the accounting policies are appropriateto the group’s and Company’s circumstances,consistently applied and adequately disclosed.
We planned and performed our audit so as to obtain allthe information and explanations which we considerednecessary in order to provide us with sufficientevidence to give reasonable assurance that thefinancial statements and the part of the Directors’Remuneration Report to be audited are free frommaterial misstatement, whether caused by fraud orother irregularity or error. In forming our opinion wealso evaluated the overall adequacy of the presentationof information in the financial statements and the partof the Directors’ Remuneration Report to be audited.
OpinionIn our opinion:
• the group financial statements give a true and fairview, in accordance with IFRS as adopted by theEuropean Union, of the state of the group’s affairsas at 31 December 2006 and of its profit for theyear then ended;
• the Company financial statements give a true andfair view, in accordance with IFRS as adopted bythe European Union as applied in accordance withthe provisions of the Companies Act 1985, of thestate of the Company’s affairs as at 31 December2006;
• the financial statements and the part of theDirectors’ Remuneration Report to be audited havebeen properly prepared in accordance with theCompanies Act 1985 and Article 4 of the IASRegulation; and
• the information given in the Report of the Directorsis consistent with the financial statements.
Ernst & Young LLPRegistered AuditorLondon20 February 2007
Annual report • Final copy:Temple Bar RA 23/2/07 19:21 Page 25
26 Temple Bar Investment Trust
Statement of directors’ responsibilities in respect of the accounts
The directors are responsible for preparing the
Annual Report and the financial statements in
accordance with applicable United Kingdom law
and those International Financial Reporting
Standards as adopted by the European Union.
The directors are required to prepare financial
statements for each financial year which present
fairly the financial position of the Company and
of the Group and the financial performance and
cash flows of the Company and of the Group for
that period. In preparing those financial
statements, the directors are required to:
• select suitable accounting policies and then
apply them consistently;
• present information, including accounting
policies, in a manner that provides relevant,
reliable, comparable and understandable
information;
• provide additional disclosures when
compliance with the specific requirements
in lFRS is insufficient to enable users to
understand the impact of particular
transactions, other events and conditions
on the entity’s financial position and
financial performance; and
• state that the Company has complied with
IFRS, subject to any material departures
disclosed and explained in the financial
statements.
The directors are responsible for keeping proper
accounting records which disclose with
reasonable accuracy at any time the financial
position of the Company and of the Group and
enable them to ensure that the financial
statements comply with the Companies Act 1985
and Article 4 of the lAS Regulation. They are also
responsible for safeguarding the assets of the
Company and hence for taking reasonable steps
for the prevention and detection of fraud and
other irregularities.
The financial statements are published on the
www.templebarinvestments.com website, which is
a website maintained by the Company’s
Investment Manager, Investec Investment
Management Limited (IIM). The maintenance and
integrity of the website maintained by IIM or any
of its subsidiaries is, so far as it relates to the
Company, the responsibility of IIM. The work
carried out by the auditors does not involve
consideration of the maintenance and integrity of
this website and accordingly, the auditors accept
no responsibility for any changes that have
occurred to the financial statements since they
were initially presented on the website. Visitors
to the website need to be aware that legislation
in the United Kingdom governing the preparation
and dissemination of the financial statements
may differ from legislation in their jurisdiction.
Annual report • Final copy:Temple Bar RA 23/2/07 19:21 Page 26
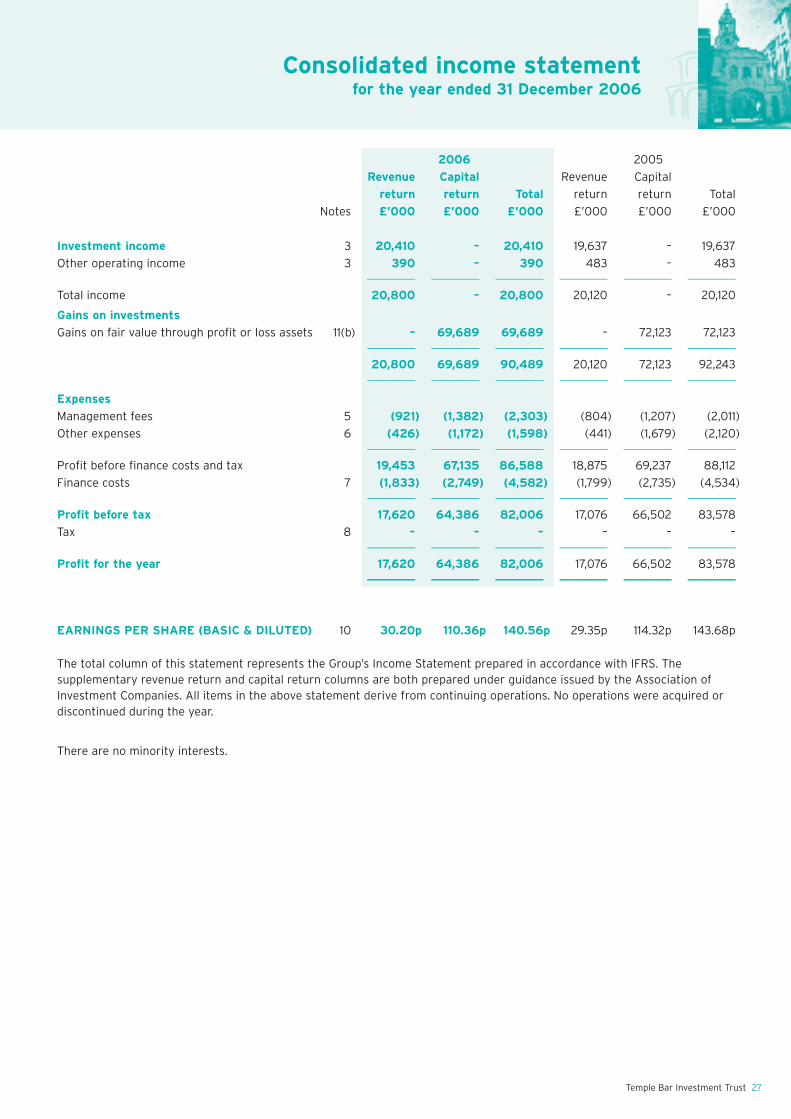
Temple Bar Investment Trust 27
Consolidated income statementfor the year ended 31 December 2006
2006 2005
Revenue Capital Revenue Capital
return return Total return return Total
Notes £’000 £’000 £’000 £’000 £’000 £’000
Investment income 3 20,410 – 20,410 19,637 – 19,637
Other operating income 3 390 – 390 483 – 483––––––––– ––––––––– ––––––––– ––––––––– ––––––––– –––––––––
Total income 20,800 – 20,800 20,120 – 20,120
Gains on investments
Gains on fair value through profit or loss assets 11(b) – 69,689 69,689 – 72,123 72,123––––––––– ––––––––– ––––––––– ––––––––– ––––––––– –––––––––
20,800 69,689 90,489 20,120 72,123 92,243––––––––– ––––––––– ––––––––– ––––––––– ––––––––– –––––––––
Expenses
Management fees 5 (921) (1,382) (2,303) (804) (1,207) (2,011)
Other expenses 6 (426) (1,172) (1,598) (441) (1,679) (2,120)––––––––– ––––––––– ––––––––– ––––––––– ––––––––– –––––––––
Profit before finance costs and tax 19,453 67,135 86,588 18,875 69,237 88,112
Finance costs 7 (1,833) (2,749) (4,582) (1,799) (2,735) (4,534)––––––––– ––––––––– ––––––––– ––––––––– ––––––––– –––––––––
Profit before tax 17,620 64,386 82,006 17,076 66,502 83,578
Tax 8 – – – – – –––––––––– ––––––––– ––––––––– ––––––––– ––––––––– –––––––––
Profit for the year 17,620 64,386 82,006 17,076 66,502 83,578––––––––– ––––––––– ––––––––– ––––––––– ––––––––– –––––––––
EARNINGS PER SHARE (BASIC & DILUTED) 10 30.20p 110.36p 140.56p 29.35p 114.32p 143.68p
The total column of this statement represents the Group’s Income Statement prepared in accordance with IFRS. Thesupplementary revenue return and capital return columns are both prepared under guidance issued by the Association ofInvestment Companies. All items in the above statement derive from continuing operations. No operations were acquired ordiscontinued during the year.
There are no minority interests.
Annual report • Final copy:Temple Bar RA 23/2/07 19:21 Page 27
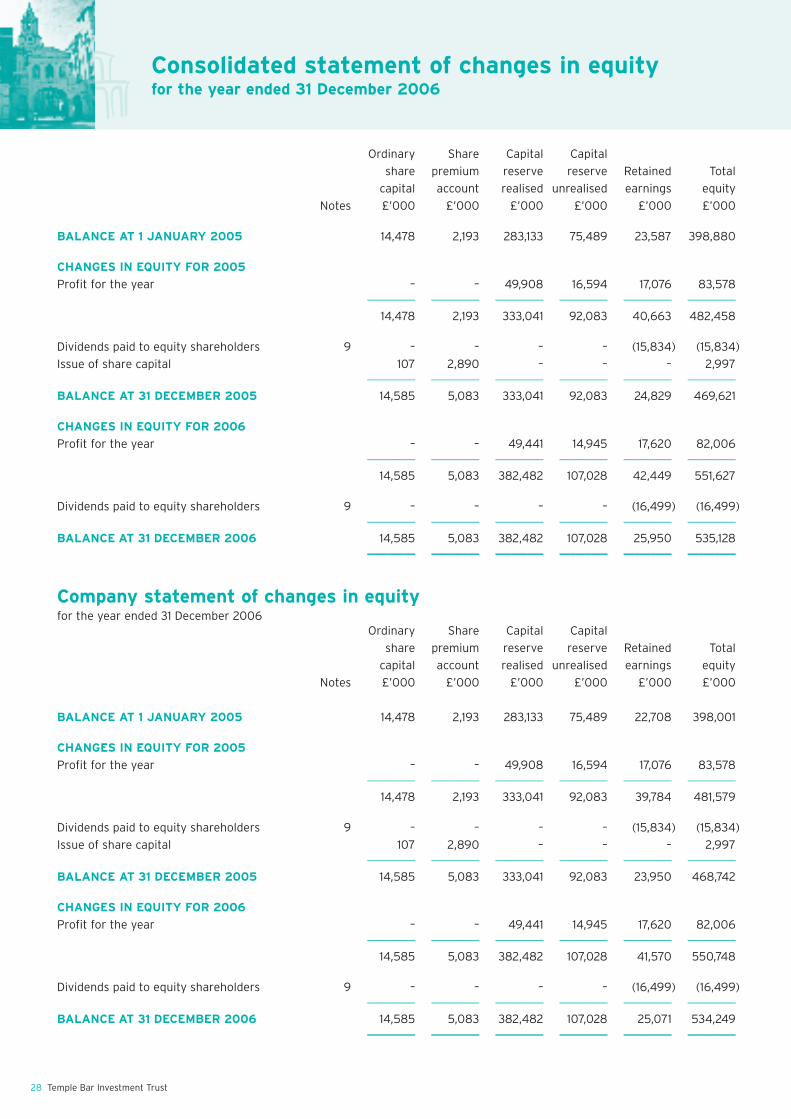
28 Temple Bar Investment Trust
Consolidated statement of changes in equityfor the year ended 31 December 2006
Company statement of changes in equityfor the year ended 31 December 2006
Ordinary Share Capital Capital
share premium reserve reserve Retained Total
capital account realised unrealised earnings equity
Notes £’000 £’000 £’000 £’000 £’000 £’000
BALANCE AT 1 JANUARY 2005 14,478 2,193 283,133 75,489 23,587 398,880
CHANGES IN EQUITY FOR 2005
Profit for the year – – 49,908 16,594 17,076 83,578––––––––– ––––––––– ––––––––– ––––––––– ––––––––– –––––––––
14,478 2,193 333,041 92,083 40,663 482,458
Dividends paid to equity shareholders 9 – – – – (15,834) (15,834)
Issue of share capital 107 2,890 – – – 2,997––––––––– ––––––––– ––––––––– ––––––––– ––––––––– –––––––––
BALANCE AT 31 DECEMBER 2005 14,585 5,083 333,041 92,083 24,829 469,621
CHANGES IN EQUITY FOR 2006
Profit for the year – – 49,441 14,945 17,620 82,006––––––––– ––––––––– ––––––––– ––––––––– ––––––––– –––––––––
14,585 5,083 382,482 107,028 42,449 551,627
Dividends paid to equity shareholders 9 – – – – (16,499) (16,499)––––––––– ––––––––– ––––––––– ––––––––– ––––––––– –––––––––
BALANCE AT 31 DECEMBER 2006 14,585 5,083 382,482 107,028 25,950 535,128––––––––– ––––––––– ––––––––– ––––––––– ––––––––– –––––––––
Ordinary Share Capital Capital
share premium reserve reserve Retained Total
capital account realised unrealised earnings equity
Notes £’000 £’000 £’000 £’000 £’000 £’000
BALANCE AT 1 JANUARY 2005 14,478 2,193 283,133 75,489 22,708 398,001
CHANGES IN EQUITY FOR 2005
Profit for the year – – 49,908 16,594 17,076 83,578––––––––– ––––––––– ––––––––– ––––––––– ––––––––– –––––––––
14,478 2,193 333,041 92,083 39,784 481,579
Dividends paid to equity shareholders 9 – – – – (15,834) (15,834)
Issue of share capital 107 2,890 – – – 2,997––––––––– ––––––––– ––––––––– ––––––––– ––––––––– –––––––––
BALANCE AT 31 DECEMBER 2005 14,585 5,083 333,041 92,083 23,950 468,742
CHANGES IN EQUITY FOR 2006
Profit for the year – – 49,441 14,945 17,620 82,006––––––––– ––––––––– ––––––––– ––––––––– ––––––––– –––––––––
14,585 5,083 382,482 107,028 41,570 550,748
Dividends paid to equity shareholders 9 – – – – (16,499) (16,499)––––––––– ––––––––– ––––––––– ––––––––– ––––––––– –––––––––
BALANCE AT 31 DECEMBER 2006 14,585 5,083 382,482 107,028 25,071 534,249––––––––– ––––––––– ––––––––– ––––––––– ––––––––– –––––––––
Annual report • Final copy:Temple Bar RA 23/2/07 19:21 Page 28
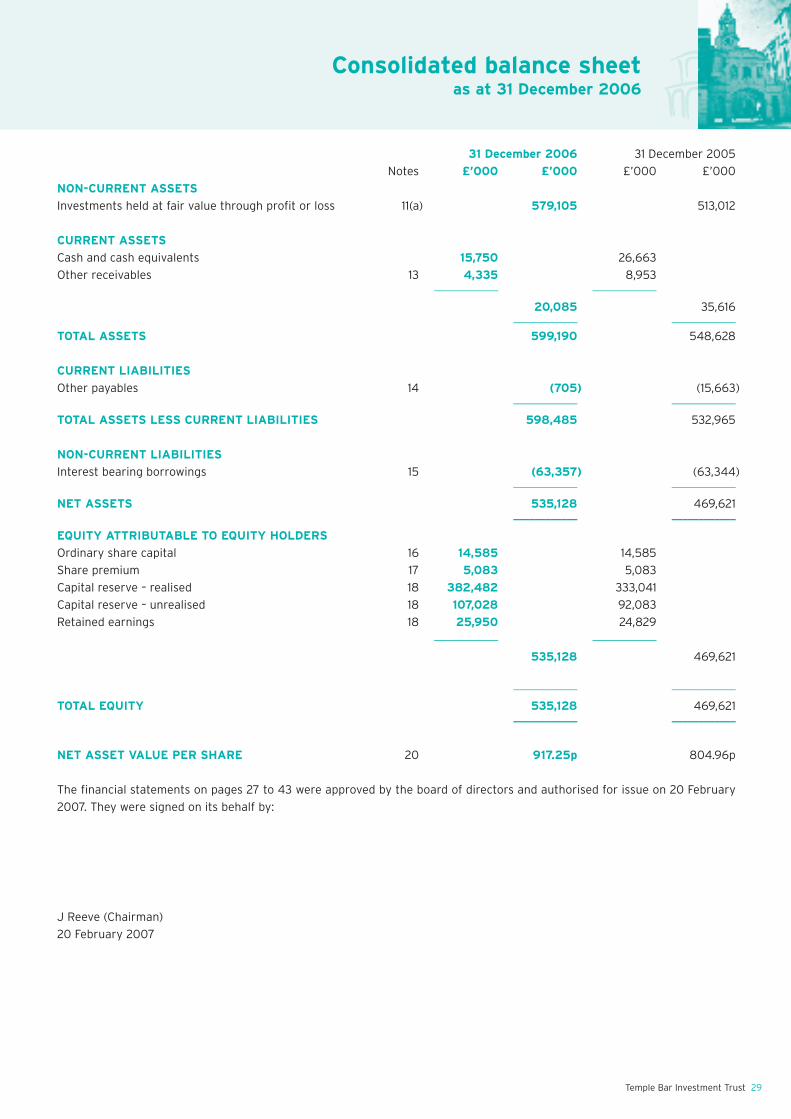
Temple Bar Investment Trust 29
31 December 2006 31 December 2005
Notes £’000 £’000 £’000 £’000
NON-CURRENT ASSETS
Investments held at fair value through profit or loss 11(a) 579,105 513,012
CURRENT ASSETS
Cash and cash equivalents 15,750 26,663
Other receivables 13 4,335 8,953–––––––––––– ––––––––––––
20,085 35,616–––––––––––– ––––––––––––
TOTAL ASSETS 599,190 548,628
CURRENT LIABILITIES
Other payables 14 (705) (15,663)–––––––––––– ––––––––––––
TOTAL ASSETS LESS CURRENT LIABILITIES 598,485 532,965
NON-CURRENT LIABILITIES
Interest bearing borrowings 15 (63,357) (63,344)–––––––––––– ––––––––––––
NET ASSETS 535,128 469,621–––––––––––– ––––––––––––
EQUITY ATTRIBUTABLE TO EQUITY HOLDERS
Ordinary share capital 16 14,585 14,585
Share premium 17 5,083 5,083
Capital reserve – realised 18 382,482 333,041
Capital reserve – unrealised 18 107,028 92,083
Retained earnings 18 25,950 24,829
–––––––––––– ––––––––––––
535,128 469,621
–––––––––––– ––––––––––––
TOTAL EQUITY 535,128 469,621–––––––––––– ––––––––––––
NET ASSET VALUE PER SHARE 20 917.25p 804.96p
The financial statements on pages 27 to 43 were approved by the board of directors and authorised for issue on 20 February
2007. They were signed on its behalf by:
J Reeve (Chairman)
20 February 2007
Consolidated balance sheetas at 31 December 2006
Annual report • Final copy:Temple Bar RA 23/2/07 19:21 Page 29
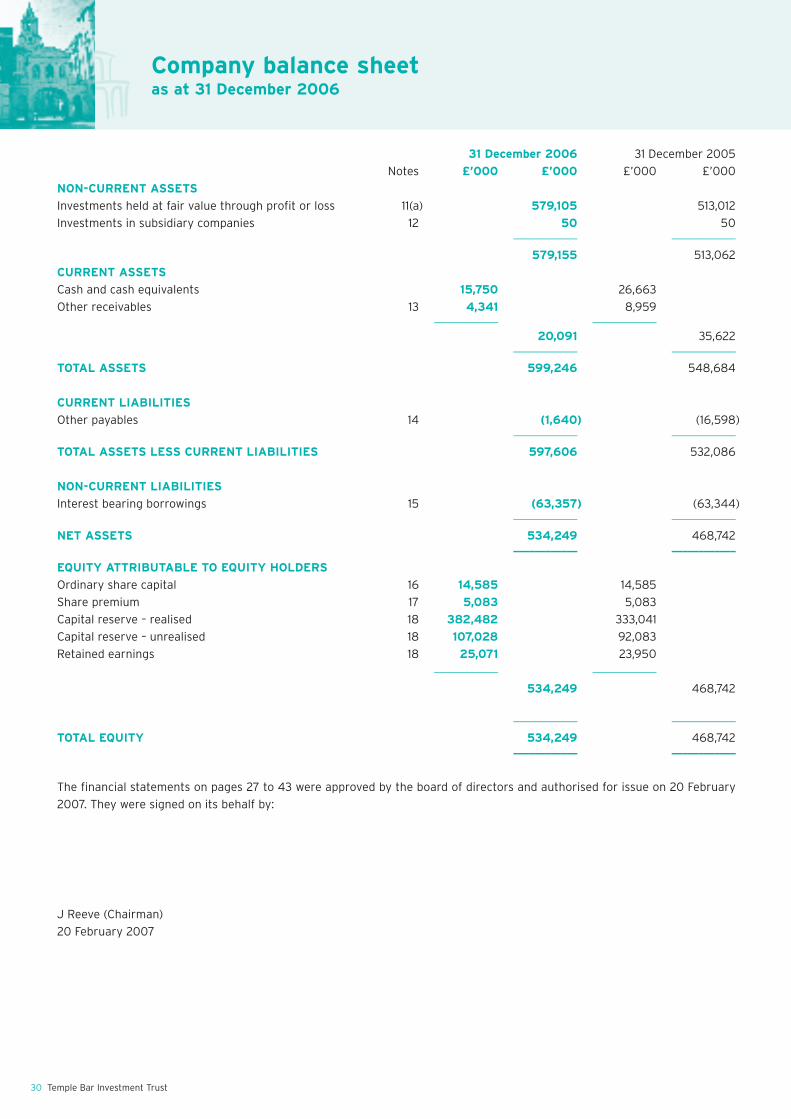
Company balance sheetas at 31 December 2006
31 December 2006 31 December 2005
Notes £’000 £’000 £’000 £’000
NON-CURRENT ASSETS
Investments held at fair value through profit or loss 11(a) 579,105 513,012
Investments in subsidiary companies 12 50 50–––––––––––– ––––––––––––
579,155 513,062
CURRENT ASSETS
Cash and cash equivalents 15,750 26,663
Other receivables 13 4,341 8,959–––––––––––– ––––––––––––
20,091 35,622–––––––––––– ––––––––––––
TOTAL ASSETS 599,246 548,684
CURRENT LIABILITIES
Other payables 14 (1,640) (16,598)–––––––––––– ––––––––––––
TOTAL ASSETS LESS CURRENT LIABILITIES 597,606 532,086
NON-CURRENT LIABILITIES
Interest bearing borrowings 15 (63,357) (63,344)–––––––––––– ––––––––––––
NET ASSETS 534,249 468,742–––––––––––– ––––––––––––
EQUITY ATTRIBUTABLE TO EQUITY HOLDERS
Ordinary share capital 16 14,585 14,585
Share premium 17 5,083 5,083
Capital reserve – realised 18 382,482 333,041
Capital reserve – unrealised 18 107,028 92,083
Retained earnings 18 25,071 23,950
–––––––––––– ––––––––––––
534,249 468,742
–––––––––––– ––––––––––––
TOTAL EQUITY 534,249 468,742–––––––––––– ––––––––––––
The financial statements on pages 27 to 43 were approved by the board of directors and authorised for issue on 20 February
2007. They were signed on its behalf by:
J Reeve (Chairman)
20 February 2007
30 Temple Bar Investment Trust
Annual report • Final copy:Temple Bar RA 23/2/07 19:21 Page 30
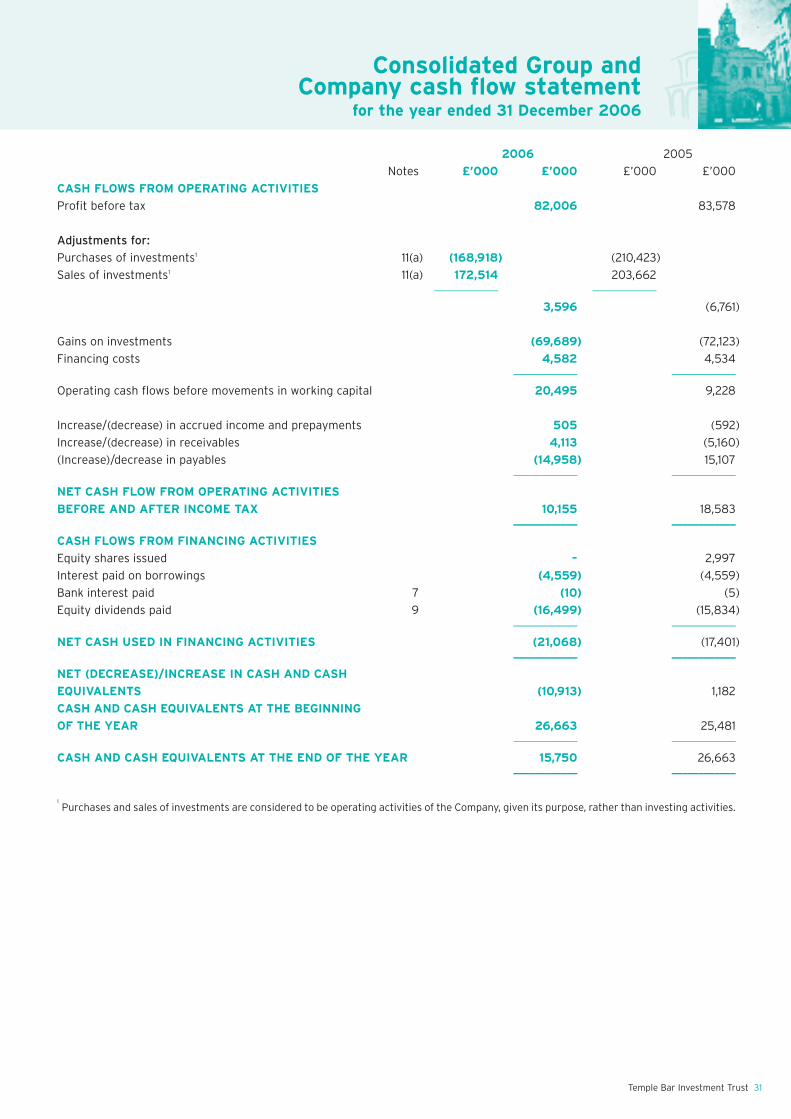
2006 2005
Notes £’000 £’000 £’000 £’000
CASH FLOWS FROM OPERATING ACTIVITIES
Profit before tax 82,006 83,578
Adjustments for:
Purchases of investments1 11(a) (168,918) (210,423)
Sales of investments1 11(a) 172,514 203,662–––––––––––– ––––––––––––
3,596 (6,761)
Gains on investments (69,689) (72,123)
Financing costs 4,582 4,534–––––––––––– ––––––––––––
Operating cash flows before movements in working capital 20,495 9,228
Increase/(decrease) in accrued income and prepayments 505 (592)
Increase/(decrease) in receivables 4,113 (5,160)
(Increase)/decrease in payables (14,958) 15,107–––––––––––– ––––––––––––
NET CASH FLOW FROM OPERATING ACTIVITIES
BEFORE AND AFTER INCOME TAX 10,155 18,583–––––––––––– ––––––––––––
CASH FLOWS FROM FINANCING ACTIVITIES
Equity shares issued – 2,997
Interest paid on borrowings (4,559) (4,559)
Bank interest paid 7 (10) (5)
Equity dividends paid 9 (16,499) (15,834)–––––––––––– ––––––––––––
NET CASH USED IN FINANCING ACTIVITIES (21,068) (17,401)–––––––––––– ––––––––––––
NET (DECREASE)/INCREASE IN CASH AND CASH
EQUIVALENTS (10,913) 1,182
CASH AND CASH EQUIVALENTS AT THE BEGINNING
OF THE YEAR 26,663 25,481–––––––––––– ––––––––––––
CASH AND CASH EQUIVALENTS AT THE END OF THE YEAR 15,750 26,663–––––––––––– ––––––––––––
1
Purchases and sales of investments are considered to be operating activities of the Company, given its purpose, rather than investing activities.
Temple Bar Investment Trust 31
Consolidated Group and Company cash flow statement
for the year ended 31 December 2006
Annual report • Final copy:Temple Bar RA 23/2/07 19:21 Page 31
32 Temple Bar Investment Trust
Notes to the Consolidated Financial Statements
1 SIGNIFICANT ACCOUNTING POLICIES
Basis of accounting
The financial statements of the Group and the Company have been prepared in accordance with
International Financial Reporting Standards (‘IFRS’), which comprise standards and interpretations
approved by the International Accounting Standards Board (‘IASB’), and International Accounting
Standards and Standing Interpretations Committee interpretations approved by the International
Accounting Standards Committee (‘IASC’) that remain in effect, and to the extent that they have been
adopted by the European Union.
The principal accounting policies adopted by the Group and the Company are set out below. Where
presentational guidance set out in the Statement of Recommended Practice (“SORP”) for investment
trusts issued by the Association of Investment Companies (“AIC”) in January 2003 (revised December
2005) is consistent with the requirements of IFRS, the directors have sought to prepare the financial
statements on a basis compliant with the recommendations of the SORP.
All values are rounded to the nearest thousand pounds unless otherwise indicated.
Basis of consolidation
The consolidated financial statements incorporate the financial statements of the Company and entities
controlled by the Company (its subsidiaries) made up to 31 December each year. Control is achieved
where the Company has the power to govern the financial and operating policies of an investee entity so
as to obtain benefits from its activities. All intra-group transactions, balances, income and expenses are
eliminated on consolidation.
Presentation of income statement
In order better to reflect the activities of an investment trust company and in accordance with guidance
issued by the AIC, supplementary information which analyses the income statement between items of a
revenue and capital nature has been presented alongside the income statement. In accordance with the
Company’s status as a UK investment company under Section 266 of the Companies Act 1985, net
capital returns may not be distributed by way of dividend. Additionally, the net revenue is the measure
the directors believe appropriate in assessing the Group’s compliance with certain requirements set out
in Section 842 of the Income and Corporation Taxes Act 1988.
Income
Dividend income from investments is recognised when the shareholders’ rights to receive payment has
been established, normally the ex-dividend date.
Where the Group has elected to receive its dividends in the form of additional shares rather than cash,
the amount of cash dividend foregone is recognised as income. Any excess in the value of shares
received over the amount of cash dividend foregone is recognised as a gain in the income statement.
Interest income is accrued on a time basis, by reference to the principal outstanding and at the effective
interest rate applicable, which is the rate that exactly discounts estimated future cash receipts through
the expected life of the financial asset to that asset’s net carrying amount.
Foreign currency translation
These financial statements are prepared in Sterling because that is the currency of the primary
economic environment in which the Group and the Company operates.
Transactions involving foreign currencies are converted at the exchange rate ruling at the date of the
transaction. Foreign currency monetary assets and liabilities are translated into Sterling at the exchange
rate ruling on the balance sheet date. Foreign exchange differences arising on translation are recognised
in the income statement.
Annual report • Final copy:Temple Bar RA 23/2/07 19:21 Page 32

Temple Bar Investment Trust 33
1 SIGNIFICANT ACCOUNTING POLICIES (continued)
Expenses
All expenses are accounted for on the accruals basis. In respect of the analysis between revenue and
capital items presented within the income statement, all expenses have been presented as revenue
items except as follows:
� Transaction costs which are incurred on the purchases or sales of investments designated as fair
value through profit or loss are expensed to capital in the income statement.
� Expenses are split and presented partly as capital items where a connection with the maintenance or
enhancement of the value of the investments held can be demonstrated, and accordingly the
investment management fee and finance costs have been allocated 40% to revenue and 60% to
capital, in order to reflect the directors’ long-term view of the nature of the expected investment
returns of the Company.
Management charge
In accordance with the expected long term division of returns, 40% (2005: 40%) of the investment
management fee for the year is charged to revenue and the other 60% (2005: 60%) is charged to
capital, net of incremental corporation tax relief and inclusive of any related irrecoverable value added
tax. Investments in funds managed by the Investec Group are wholly excluded from this charge.
Taxation
The tax expenses represent the sum of the tax currently payable and deferred tax. The tax currently
payable is based on the taxable profit for the year. The taxable profit differs from profit before tax as
reported in the income statement because it excludes items of income or expense that are taxable or
deductible in other years and it further excludes items that are never taxable or deductible. The Group
and Company’s liability for current tax is calculated using tax rates that have been or are substantively
enacted by the balance sheet date.
In line with the recommendations of the SORP, the allocation method used to calculate tax relief on
expenses presented against capital returns in the supplementary information in the income statement is
the ‘marginal basis’. Under this basis, if taxable income is capable of being entirely offset by expenses in
the revenue column of the income statement, then no tax relief is transferred to the capital return
column.
Deferred tax is the tax expected to be payable or recoverable on differences between the carrying
amounts of assets and liabilities in the financial statements and the corresponding tax bases used in the
computation of taxable profit, and is accounted for using the balance sheet liability method. Deferred
tax liabilities are recognised for all taxable temporary differences and deferred tax assets are recognised
to the extent that it is probable that taxable profits will be available against which deductible temporary
differences can be utilised.
Deferred tax is calculated at the tax rates that are expected to apply in the period when the liability is
settled or the asset is realised. Deferred tax is charged or credited in the revenue return column of the
income statement, except when it relates to items charged or credited directly to equity, in which case
the deferred tax is also dealt with in equity.
Investment trusts which have approval under Section 842 of the Income and Corporation Taxes Act
1988 are not liable for taxation on capital gains.
Annual report • Final copy:Temple Bar RA 23/2/07 19:21 Page 33
34 Temple Bar Investment Trust
Notes to the consolidated financial statements continued
1 SIGNIFICANT ACCOUNTING POLICIES (continued)
Financial instruments
Financial assets and financial liabilities are recognised on the Group’s and Company’s balance sheet
when the Group or Company becomes a party to the contractual provisions of the instrument. The
Group or Company shall offset financial assets and financial liabilities if the Group or Company has a
legally enforceable right to set off the recognised amounts and interests and intends to settle on a net
basis. Financial assets and liabilities are derecognised when the Group or Company settles its obligations
relating to the instrument.
Other receivables
Other receivables do not carry any interest, are short-term in nature and are accordingly stated at their
nominal value as reduced by appropriate allowances for estimated irrecoverable amounts.
Investments
Investments held at fair value through profit or loss are initially recognised at fair value, being the
consideration given and excluding transaction or other dealing costs associated with the investment.
After initial recognition, investments, which are designated as at fair value through profit or loss, are
measured at fair value. Gains or losses on investments designated as at fair value through profit or loss
are included in net profit or loss as a capital item, and transaction costs on acquisition or disposal of
investments are expensed. For investments that are actively traded in organised financial markets, fair
value is determined by reference to stock exchange quoted market bid prices at the close of business on
the balance sheet date.
All purchases and sales of investments are recognised on the trade date i.e. the date that the Group
commits to purchase or sell an asset.
Financial liabilities and equity instruments
Financial liabilities and equity instruments are classified according to the substance of the contractual
arrangements entered into. An equity instrument is any contract that evidences a residual interest in the
assets of the Group after deducting all of its liabilities.
Interest bearing borrowings
Interest bearing borrowings, being the debenture stocks issued by the Company, are initially recognised
at cost, being the proceeds received net of issue cost associated with the borrowings. After initial
recognition, interest bearing borrowings are subsequently measured at amortised cost using the
effective interest method.
Other payables
Other payables are non interest bearing and are stated at their nominal value.
Equity dividends payable
Equity dividends payable are recognised when the shareholders’ right to receive payment is established.
Annual report • Final copy:Temple Bar RA 23/2/07 19:21 Page 34
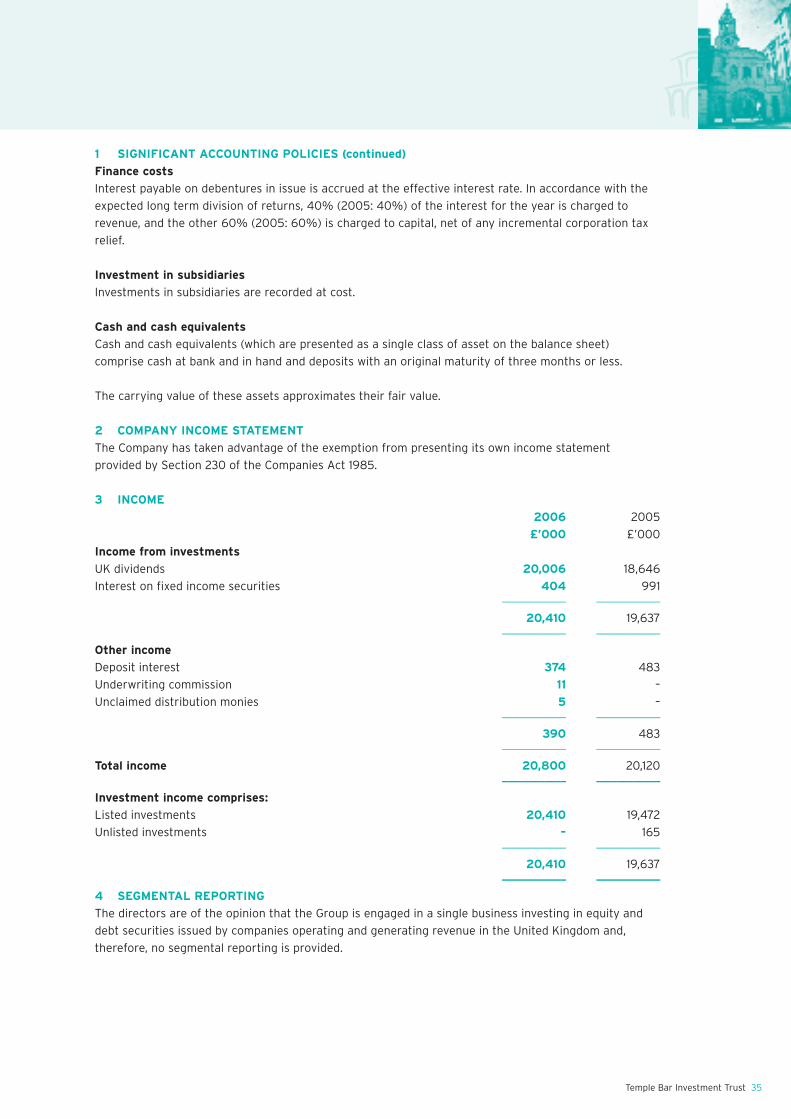
Temple Bar Investment Trust 35
1 SIGNIFICANT ACCOUNTING POLICIES (continued)
Finance costs
Interest payable on debentures in issue is accrued at the effective interest rate. In accordance with the
expected long term division of returns, 40% (2005: 40%) of the interest for the year is charged to
revenue, and the other 60% (2005: 60%) is charged to capital, net of any incremental corporation tax
relief.
Investment in subsidiaries
Investments in subsidiaries are recorded at cost.
Cash and cash equivalents
Cash and cash equivalents (which are presented as a single class of asset on the balance sheet)
comprise cash at bank and in hand and deposits with an original maturity of three months or less.
The carrying value of these assets approximates their fair value.
2 COMPANY INCOME STATEMENT
The Company has taken advantage of the exemption from presenting its own income statement
provided by Section 230 of the Companies Act 1985.
3 INCOME
2006 2005
£’000 £’000
Income from investments
UK dividends 20,006 18,646
Interest on fixed income securities 404 991–––––––––––– ––––––––––––
20,410 19,637–––––––––––– ––––––––––––
Other income
Deposit interest 374 483
Underwriting commission 11 –
Unclaimed distribution monies 5 ––––––––––––– ––––––––––––
390 483–––––––––––– ––––––––––––
Total income 20,800 20,120–––––––––––– ––––––––––––
Investment income comprises:
Listed investments 20,410 19,472
Unlisted investments – 165–––––––––––– ––––––––––––
20,410 19,637–––––––––––– ––––––––––––
4 SEGMENTAL REPORTING
The directors are of the opinion that the Group is engaged in a single business investing in equity and
debt securities issued by companies operating and generating revenue in the United Kingdom and,
therefore, no segmental reporting is provided.
Annual report • Final copy:Temple Bar RA 23/2/07 19:21 Page 35

36 Temple Bar Investment Trust
Notes to the consolidated financial statements continued
5 INVESTMENT MANAGEMENT FEE
2006 2005
Revenue Capital Total Revenue Capital Total
Return Return Return Return Return Return
£’000 £’000 £’000 £’000 £’000 £’000
Investment management fee 784 1,176 1,960 684 1,027 1,711
Irrecoverable VAT thereon 137 206 343 120 180 300–––––––– –––––––– –––––––– –––––––– –––––––– ––––––––
921 1,382 2,303 804 1,207 2,011–––––––– –––––––– –––––––– –––––––– –––––––– ––––––––
As at 31 December 2006 an amount of £613,000 (2005: £534,000) was payable to the Manager in
relation to the Management fees for the quarter ended 31 December 2006.
Details of the terms of the investment management agreement are provided on page 19.
6 OTHER EXPENSES
2006 2005
Revenue Capital Total Revenue Capital Total
Return Return Return Return Return Return
£’000 £’000 £’000 £’000 £’000 £’000Transaction costs on fair value
through profit or loss assets – 1,172 1,172 – 1,679 1,679Directors’ fees (see report on directors'
remuneration on page 21) 112 – 112 89 – 89Registrars fees 88 – 88 82 – 82AIC membership costs 46 – 46 49 – 49Advertising & marketing costs 35 – 35 37 – 37Printing & postage 41 – 41 54 – 54Directors’ liability insurance 24 – 24 30 – 30Auditor’s remuneration – annual audit 20 – 20 20 – 20Other fees to auditors – IFRS conversion – – – 16 – 16Stock Exchange fees 9 – 9 8 – 8Safe custody fees 9 – 9 7 – 7Other expenses 42 – 42 49 – 49
––––––––– ––––––––– ––––––––– ––––––––– ––––––––– –––––––––
426 1,172 1,598 441 1,679 2,120––––––––– ––––––––– ––––––––– ––––––––– ––––––––– –––––––––
All expenses are inclusive of VAT where applicable.
Transaction costs on fair value through profit or loss assets represent such costs incurred on both the
purchase and sale of those assets.
Annual report • Final copy:Temple Bar RA 23/2/07 19:21 Page 36

Temple Bar Investment Trust 37
7 FINANCE COSTS
2006 2005
Revenue Capital Total Revenue Capital Total
Return Return Return Return Return Return
£’000 £’000 £’000 £’000 £’000 £’000
Interest on borrowings
97⁄8% debenture stock 2017 988 1,481 2,469 988 1,481 2,469
5.5% debenture stock 2021 841 1,262 2,103 806 1,254 2,060–––––––– –––––––– –––––––– –––––––– –––––––– ––––––––
1,829 2,743 4,572 1,794 2,735 4,529–––––––– –––––––– –––––––– –––––––– –––––––– ––––––––
Bank interest
Bank overdrafts 4 6 10 5 – 5–––––––– –––––––– –––––––– –––––––– –––––––– ––––––––
Total finance costs 1,833 2,749 4,582 1,799 2,735 4,534–––––––– –––––––– –––––––– –––––––– –––––––– ––––––––
The amortisation of the debenture issue costs is calculated using the effective interest method.
8 TAXATION
(a) There is no corporation tax payable (2005: nil).
(b) The charge for the year can be reconciled to the profit per the income statement as follows:
2006 2005
Revenue Capital Total Revenue Capital Total
Return Return Return Return Return Return
£’000 £’000 £’000 £’000 £’000 £’000
Profit before taxation 17,620 64,386 82,006 17,076 66,502 83,578––––––––– ––––––––– ––––––––– ––––––––– ––––––––– –––––––––
Tax at UK corporation tax rateof 30% (2005: 30%) 5,286 19,316 24,602 5,123 19,951 25,074
Tax effects of:Non taxable gains on investments
net of transaction costs1 – (20,556) (20,556) – (21,134) (21,134)Income not chargeable to tax:
UK dividends1 (6,003) – (6,003) (5,595) – (5,595)Movement in excess management
expenses2 717 1,240 1,957 472 1,183 1,655––––––––– ––––––––– ––––––––– ––––––––– ––––––––– –––––––––
Tax expense for the year – – – – – –––––––––– ––––––––– ––––––––– ––––––––– ––––––––– –––––––––
1 Investment trusts are not subject to corporation tax on this item.2 The Company has not recognised a deferred tax asset of £11,690,000 (2005: £9,232,000) arising as a
result of having unutilised management expenses since, under current tax legislation, it is unlikely that
the Company will obtain any benefit for the asset.
Annual report • Final copy:Temple Bar RA 23/2/07 19:21 Page 37
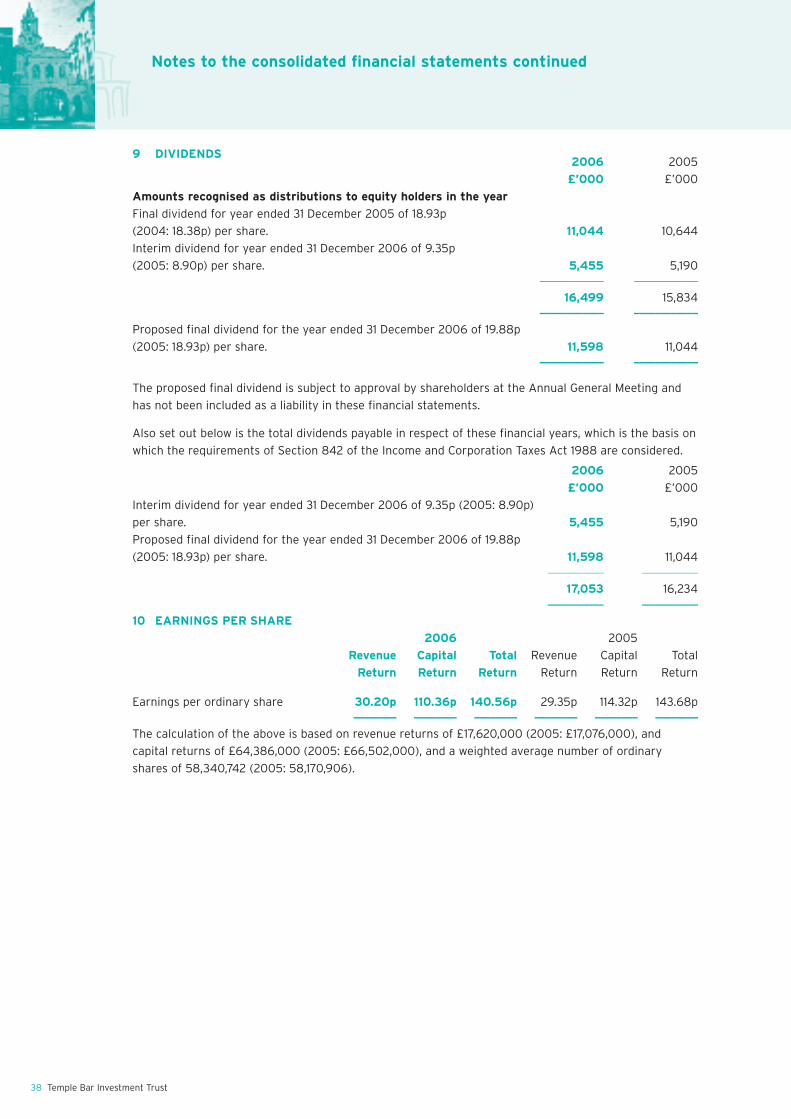
38 Temple Bar Investment Trust
Notes to the consolidated financial statements continued
9 DIVIDENDS2006 2005
£’000 £’000
Amounts recognised as distributions to equity holders in the year
Final dividend for year ended 31 December 2005 of 18.93p
(2004: 18.38p) per share. 11,044 10,644
Interim dividend for year ended 31 December 2006 of 9.35p
(2005: 8.90p) per share. 5,455 5,190–––––––––––– ––––––––––––
16,499 15,834–––––––––––– ––––––––––––
Proposed final dividend for the year ended 31 December 2006 of 19.88p
(2005: 18.93p) per share. 11,598 11,044–––––––––––– ––––––––––––
The proposed final dividend is subject to approval by shareholders at the Annual General Meeting and
has not been included as a liability in these financial statements.
Also set out below is the total dividends payable in respect of these financial years, which is the basis on
which the requirements of Section 842 of the Income and Corporation Taxes Act 1988 are considered.
2006 2005
£’000 £’000
Interim dividend for year ended 31 December 2006 of 9.35p (2005: 8.90p)
per share. 5,455 5,190
Proposed final dividend for the year ended 31 December 2006 of 19.88p
(2005: 18.93p) per share. 11,598 11,044–––––––––––– ––––––––––––
17,053 16,234–––––––––––– ––––––––––––
10 EARNINGS PER SHARE
2006 2005
Revenue Capital Total Revenue Capital Total
Return Return Return Return Return Return
Earnings per ordinary share 30.20p 110.36p 140.56p 29.35p 114.32p 143.68p–––––––– –––––––– –––––––– –––––––– –––––––– ––––––––
The calculation of the above is based on revenue returns of £17,620,000 (2005: £17,076,000), and
capital returns of £64,386,000 (2005: £66,502,000), and a weighted average number of ordinary
shares of 58,340,742 (2005: 58,170,906).
Annual report • Final copy:Temple Bar RA 23/2/07 19:21 Page 38
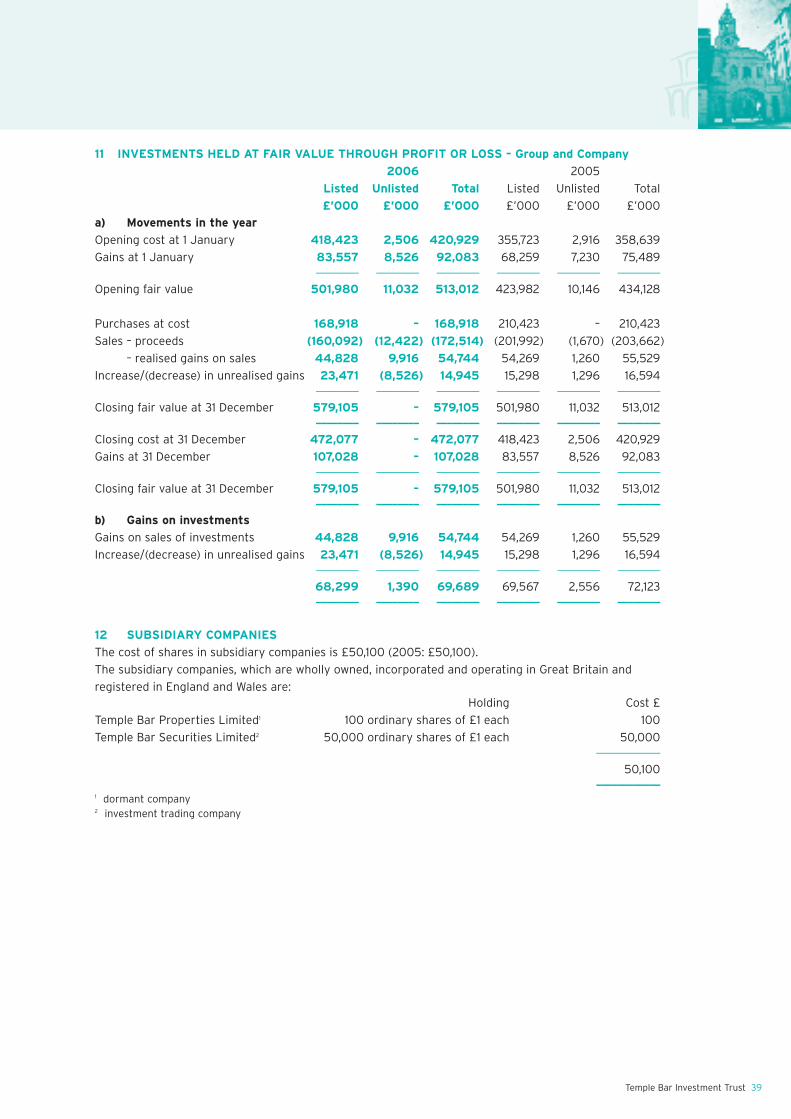
Temple Bar Investment Trust 39
11 INVESTMENTS HELD AT FAIR VALUE THROUGH PROFIT OR LOSS – Group and Company
2006 2005
Listed Unlisted Total Listed Unlisted Total
£’000 £’000 £’000 £’000 £’000 £’000
a) Movements in the year
Opening cost at 1 January 418,423 2,506 420,929 355,723 2,916 358,639
Gains at 1 January 83,557 8,526 92,083 68,259 7,230 75,489–––––––– –––––––– –––––––– –––––––– –––––––– ––––––––
Opening fair value 501,980 11,032 513,012 423,982 10,146 434,128
Purchases at cost 168,918 – 168,918 210,423 – 210,423
Sales – proceeds (160,092) (12,422) (172,514) (201,992) (1,670) (203,662)
– realised gains on sales 44,828 9,916 54,744 54,269 1,260 55,529
Increase/(decrease) in unrealised gains 23,471 (8,526) 14,945 15,298 1,296 16,594–––––––– –––––––– –––––––– –––––––– –––––––– ––––––––
Closing fair value at 31 December 579,105 – 579,105 501,980 11,032 513,012–––––––– –––––––– –––––––– –––––––– –––––––– ––––––––
Closing cost at 31 December 472,077 – 472,077 418,423 2,506 420,929
Gains at 31 December 107,028 – 107,028 83,557 8,526 92,083–––––––– –––––––– –––––––– –––––––– –––––––– ––––––––
Closing fair value at 31 December 579,105 – 579,105 501,980 11,032 513,012–––––––– –––––––– –––––––– –––––––– –––––––– ––––––––
b) Gains on investments
Gains on sales of investments 44,828 9,916 54,744 54,269 1,260 55,529
Increase/(decrease) in unrealised gains 23,471 (8,526) 14,945 15,298 1,296 16,594–––––––– –––––––– –––––––– –––––––– –––––––– ––––––––
68,299 1,390 69,689 69,567 2,556 72,123–––––––– –––––––– –––––––– –––––––– –––––––– ––––––––
12 SUBSIDIARY COMPANIES
The cost of shares in subsidiary companies is £50,100 (2005: £50,100).
The subsidiary companies, which are wholly owned, incorporated and operating in Great Britain and
registered in England and Wales are:Holding Cost £
Temple Bar Properties Limited1 100 ordinary shares of £1 each 100
Temple Bar Securities Limited2 50,000 ordinary shares of £1 each 50,000––––––––––––
50,100––––––––––––
1 dormant company2 investment trading company
Annual report • Final copy:Temple Bar RA 23/2/07 19:21 Page 39
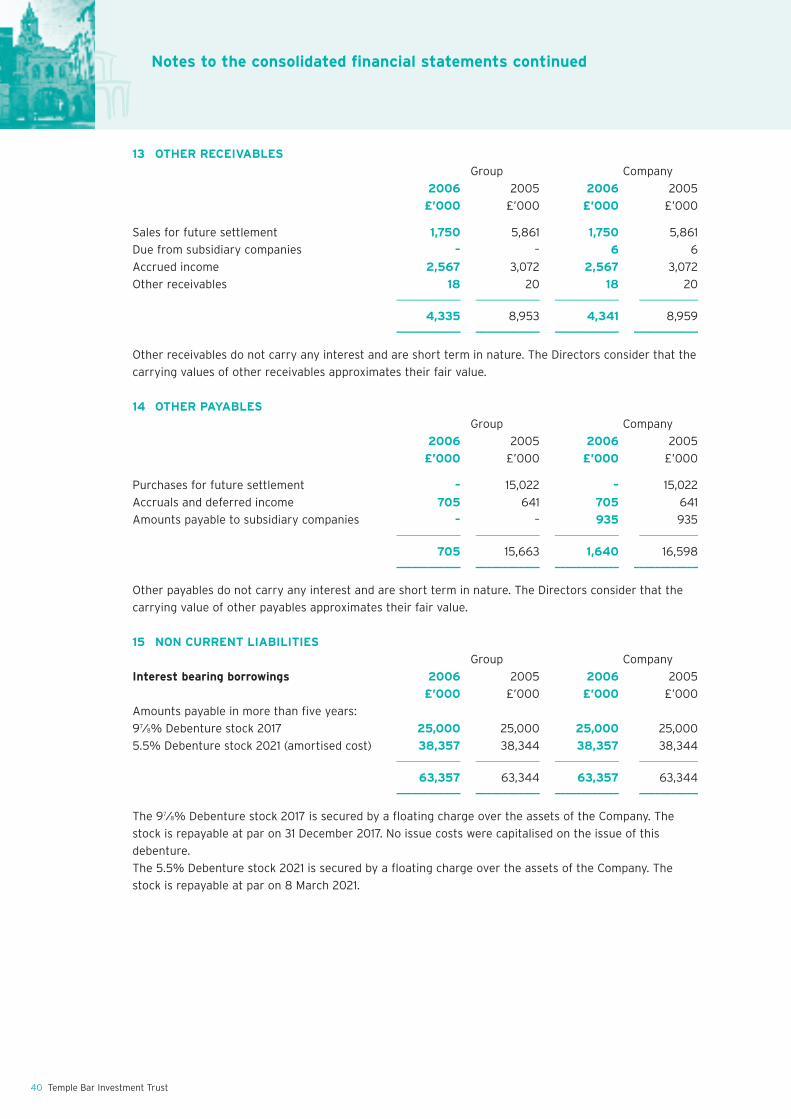
40 Temple Bar Investment Trust
Notes to the consolidated financial statements continued
13 OTHER RECEIVABLES
Group Company
2006 2005 2006 2005
£’000 £’000 £’000 £’000
Sales for future settlement 1,750 5,861 1,750 5,861
Due from subsidiary companies – – 6 6
Accrued income 2,567 3,072 2,567 3,072
Other receivables 18 20 18 20–––––––––––– –––––––––––– –––––––––––– –––––––––––
4,335 8,953 4,341 8,959–––––––––––– –––––––––––– –––––––––––– ––––––––––––
Other receivables do not carry any interest and are short term in nature. The Directors consider that the
carrying values of other receivables approximates their fair value.
14 OTHER PAYABLES
Group Company
2006 2005 2006 2005
£’000 £’000 £’000 £’000
Purchases for future settlement – 15,022 – 15,022
Accruals and deferred income 705 641 705 641
Amounts payable to subsidiary companies – – 935 935–––––––––––– –––––––––––– –––––––––––– –––––––––––
705 15,663 1,640 16,598–––––––––––– –––––––––––– –––––––––––– ––––––––––––
Other payables do not carry any interest and are short term in nature. The Directors consider that the
carrying value of other payables approximates their fair value.
15 NON CURRENT LIABILITIES
Group Company
Interest bearing borrowings 2006 2005 2006 2005
£’000 £’000 £’000 £’000
Amounts payable in more than five years:
97⁄8% Debenture stock 2017 25,000 25,000 25,000 25,000
5.5% Debenture stock 2021 (amortised cost) 38,357 38,344 38,357 38,344–––––––––––– –––––––––––– –––––––––––– –––––––––––
63,357 63,344 63,357 63,344–––––––––––– –––––––––––– –––––––––––– –––––––––––
The 97⁄8% Debenture stock 2017 is secured by a floating charge over the assets of the Company. The
stock is repayable at par on 31 December 2017. No issue costs were capitalised on the issue of this
debenture.
The 5.5% Debenture stock 2021 is secured by a floating charge over the assets of the Company. The
stock is repayable at par on 8 March 2021.
Annual report • Final copy:Temple Bar RA 23/2/07 19:21 Page 40
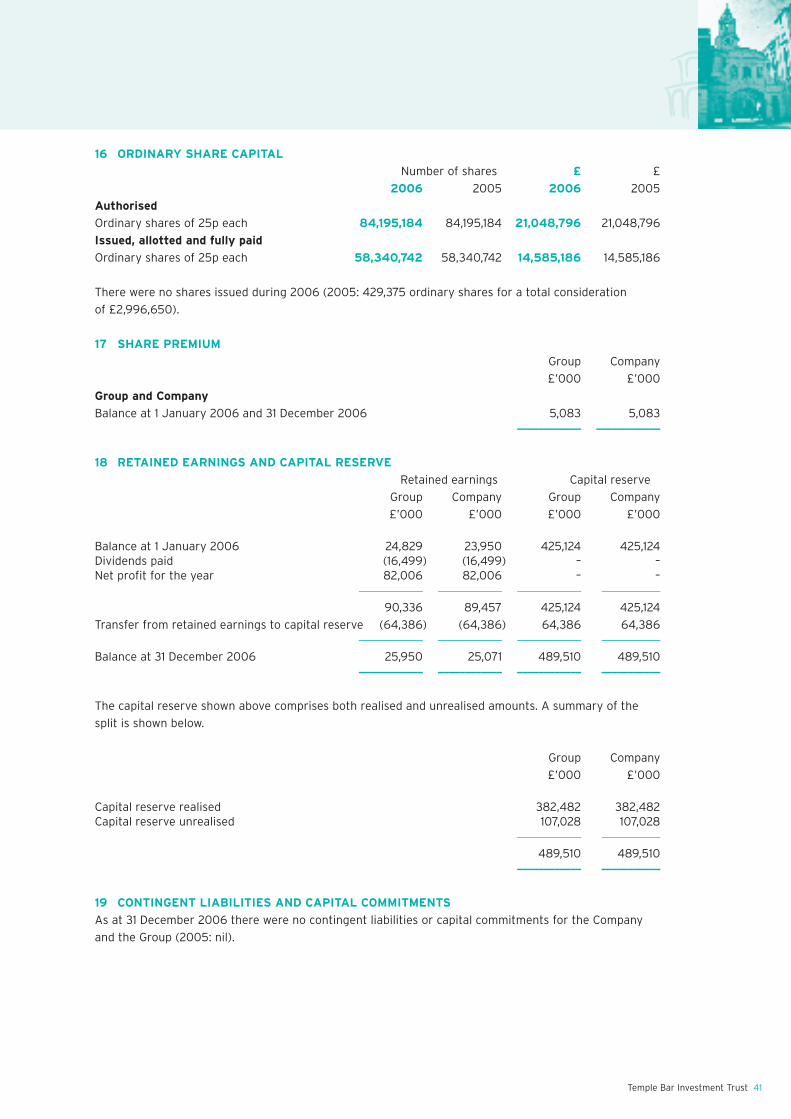
16 ORDINARY SHARE CAPITAL
Number of shares £ £
2006 2005 2006 2005
Authorised
Ordinary shares of 25p each 84,195,184 84,195,184 21,048,796 21,048,796
Issued, allotted and fully paid
Ordinary shares of 25p each 58,340,742 58,340,742 14,585,186 14,585,186
There were no shares issued during 2006 (2005: 429,375 ordinary shares for a total consideration
of £2,996,650).
17 SHARE PREMIUM
Group Company
£’000 £’000
Group and Company
Balance at 1 January 2006 and 31 December 2006 5,083 5,083–––––––––––– ––––––––––––
18 RETAINED EARNINGS AND CAPITAL RESERVE
Retained earnings Capital reserve
Group Company Group Company
£’000 £’000 £’000 £’000
Balance at 1 January 2006 24,829 23,950 425,124 425,124Dividends paid (16,499) (16,499) – –Net profit for the year 82,006 82,006 – –
–––––––––––– –––––––––––– –––––––––––– –––––––––––
90,336 89,457 425,124 425,124
Transfer from retained earnings to capital reserve (64,386) (64,386) 64,386 64,386–––––––––––– –––––––––––– –––––––––––– –––––––––––
Balance at 31 December 2006 25,950 25,071 489,510 489,510–––––––––––– –––––––––––– –––––––––––– –––––––––––
The capital reserve shown above comprises both realised and unrealised amounts. A summary of the
split is shown below.
Group Company
£’000 £’000
Capital reserve realised 382,482 382,482Capital reserve unrealised 107,028 107,028
–––––––––––– –––––––––––
489,510 489,510–––––––––––– –––––––––––
19 CONTINGENT LIABILITIES AND CAPITAL COMMITMENTS
As at 31 December 2006 there were no contingent liabilities or capital commitments for the Company
and the Group (2005: nil).
Temple Bar Investment Trust 41
Annual report • Final copy:Temple Bar RA 23/2/07 19:21 Page 41
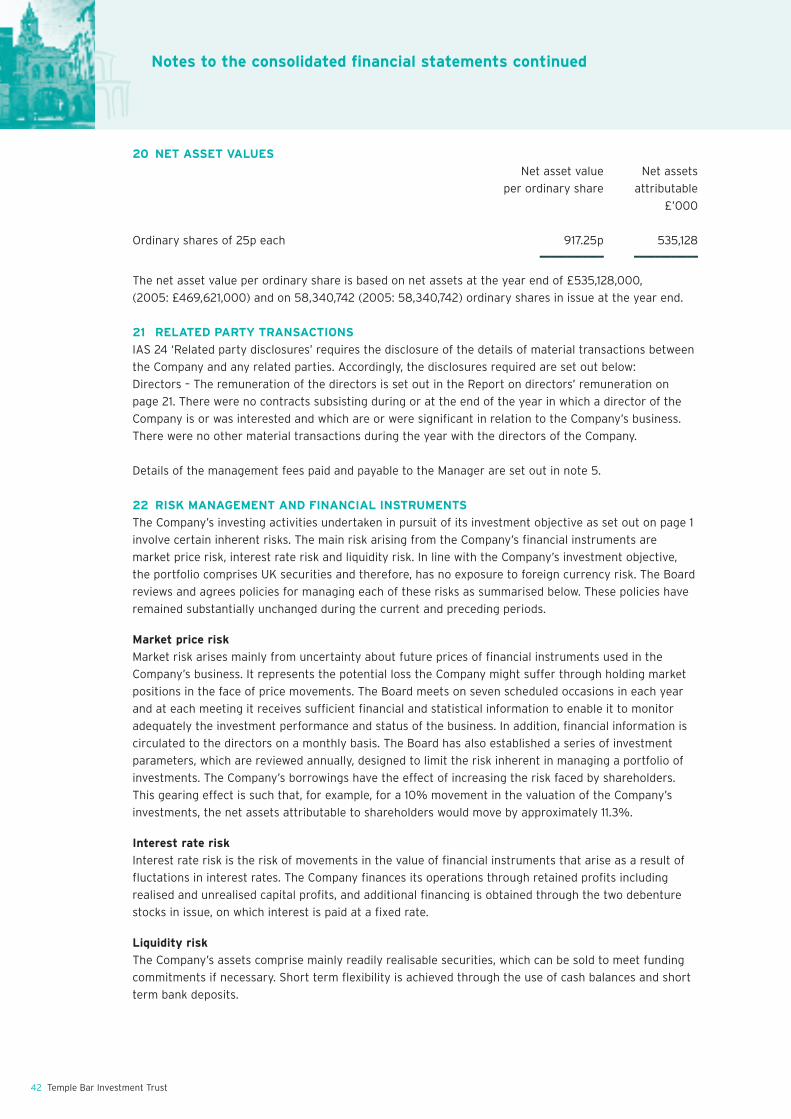
42 Temple Bar Investment Trust
20 NET ASSET VALUES
Net asset value Net assets
per ordinary share attributable
£’000
Ordinary shares of 25p each 917.25p 535,128–––––––––––– –––––––––––––––––––––––– ––––––––––––
The net asset value per ordinary share is based on net assets at the year end of £535,128,000,
(2005: £469,621,000) and on 58,340,742 (2005: 58,340,742) ordinary shares in issue at the year end.
21 RELATED PARTY TRANSACTIONS
IAS 24 ‘Related party disclosures’ requires the disclosure of the details of material transactions between
the Company and any related parties. Accordingly, the disclosures required are set out below:
Directors – The remuneration of the directors is set out in the Report on directors’ remuneration on
page 21. There were no contracts subsisting during or at the end of the year in which a director of the
Company is or was interested and which are or were significant in relation to the Company’s business.
There were no other material transactions during the year with the directors of the Company.
Details of the management fees paid and payable to the Manager are set out in note 5.
22 RISK MANAGEMENT AND FINANCIAL INSTRUMENTS
The Company’s investing activities undertaken in pursuit of its investment objective as set out on page 1
involve certain inherent risks. The main risk arising from the Company’s financial instruments are
market price risk, interest rate risk and liquidity risk. In line with the Company’s investment objective,
the portfolio comprises UK securities and therefore, has no exposure to foreign currency risk. The Board
reviews and agrees policies for managing each of these risks as summarised below. These policies have
remained substantially unchanged during the current and preceding periods.
Market price risk
Market risk arises mainly from uncertainty about future prices of financial instruments used in the
Company’s business. It represents the potential loss the Company might suffer through holding market
positions in the face of price movements. The Board meets on seven scheduled occasions in each year
and at each meeting it receives sufficient financial and statistical information to enable it to monitor
adequately the investment performance and status of the business. In addition, financial information is
circulated to the directors on a monthly basis. The Board has also established a series of investment
parameters, which are reviewed annually, designed to limit the risk inherent in managing a portfolio of
investments. The Company’s borrowings have the effect of increasing the risk faced by shareholders.
This gearing effect is such that, for example, for a 10% movement in the valuation of the Company’s
investments, the net assets attributable to shareholders would move by approximately 11.3%.
Interest rate risk
Interest rate risk is the risk of movements in the value of financial instruments that arise as a result of
fluctations in interest rates. The Company finances its operations through retained profits including
realised and unrealised capital profits, and additional financing is obtained through the two debenture
stocks in issue, on which interest is paid at a fixed rate.
Liquidity risk
The Company’s assets comprise mainly readily realisable securities, which can be sold to meet funding
commitments if necessary. Short term flexibility is achieved through the use of cash balances and short
term bank deposits.
Notes to the consolidated financial statements continued
Annual report • Final copy:Temple Bar RA 23/2/07 19:21 Page 42
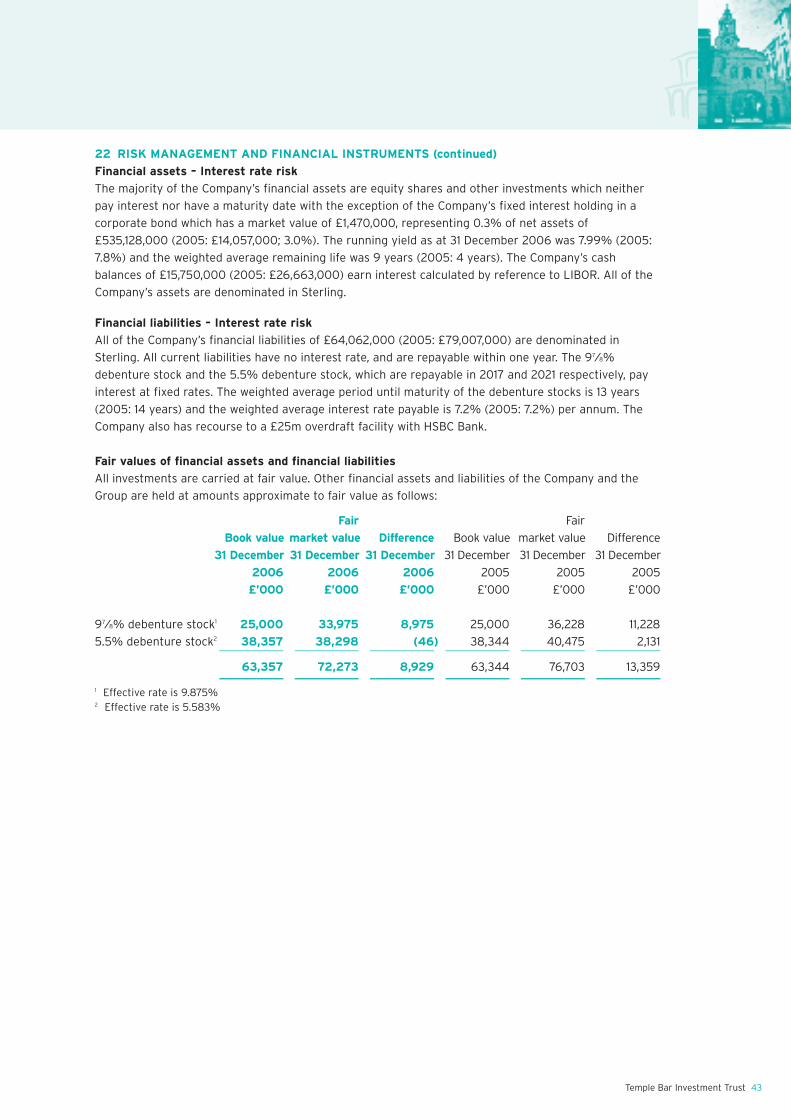
Temple Bar Investment Trust 43
22 RISK MANAGEMENT AND FINANCIAL INSTRUMENTS (continued)
Financial assets – Interest rate risk
The majority of the Company’s financial assets are equity shares and other investments which neither
pay interest nor have a maturity date with the exception of the Company’s fixed interest holding in a
corporate bond which has a market value of £1,470,000, representing 0.3% of net assets of
£535,128,000 (2005: £14,057,000; 3.0%). The running yield as at 31 December 2006 was 7.99% (2005:
7.8%) and the weighted average remaining life was 9 years (2005: 4 years). The Company’s cash
balances of £15,750,000 (2005: £26,663,000) earn interest calculated by reference to LIBOR. All of the
Company’s assets are denominated in Sterling.
Financial liabilities – Interest rate risk
All of the Company’s financial liabilities of £64,062,000 (2005: £79,007,000) are denominated in
Sterling. All current liabilities have no interest rate, and are repayable within one year. The 97⁄8%
debenture stock and the 5.5% debenture stock, which are repayable in 2017 and 2021 respectively, pay
interest at fixed rates. The weighted average period until maturity of the debenture stocks is 13 years
(2005: 14 years) and the weighted average interest rate payable is 7.2% (2005: 7.2%) per annum. The
Company also has recourse to a £25m overdraft facility with HSBC Bank.
Fair values of financial assets and financial liabilities
All investments are carried at fair value. Other financial assets and liabilities of the Company and the
Group are held at amounts approximate to fair value as follows:
Fair Fair
Book value market value Difference Book value market value Difference
31 December 31 December 31 December 31 December 31 December 31 December
2006 2006 2006 2005 2005 2005
£’000 £’000 £’000 £’000 £’000 £’000
97⁄8% debenture stock1 25,000 33,975 8,975 25,000 36,228 11,228
5.5% debenture stock2 38,357 38,298 (46) 38,344 40,475 2,131–––––––––––– –––––––––––– –––––––––––– –––––––––––– –––––––––––– ––––––––––––
63,357 72,273 8,929 63,344 76,703 13,359–––––––––––– –––––––––––– –––––––––––– –––––––––––– –––––––––––– ––––––––––––
1 Effective rate is 9.875%2 Effective rate is 5.583%
Annual report • Final copy:Temple Bar RA 23/2/07 19:21 Page 43

44 Temple Bar Investment Trust
Useful Information for Shareholders
ANNUAL GENERAL MEETING
The Annual General Meeting will be held at 2 Gresham Street, London EC2V 7QP (see map on page 46),
on 26 March 2007 at 11.00 a.m.
FINANCIAL CALENDAR
The financial calendar for 2007 is set out below:
Ordinary shares
Final dividend, 2006 – payable 30 March 2007
Final dividend, 2004 – ex-dividend 14 March 2007
Final dividend, 2004 – record date 16 March 2007
Interim dividend, 2007 28 September 2007
Final dividend, 2007 End of March 2008
97⁄8% Debenture Stock 2017
Interest payments 30 June and 31 December
5.5% Debenture Stock 2021
Interest payments 8 March and 8 September
PAYMENT OF DIVIDENDS
Cash dividends will be sent by cheque to the first-named shareholder on the Register at his or her
registered address together with a tax voucher. At shareholders’ request, dividends may instead be paid
direct into the shareholder’s bank account through the Bankers’ Automated Clearing System (BACS).
This may be arranged by contacting the Company’s Registrar on 0870 601 5366.
PRICE AND PERFORMANCE INFORMATION
The Company’s ordinary shares and debenture stocks are traded on the London Stock Exchange. The
market price of the ordinary shares is shown daily in the Financial Times, other leading newspapers and
on the Company’s website.
SHARE REGISTER ENQUIRIES
The Company’s Registrar, Lloyds TSB Registrars, maintains the share register. In the event of queries
regarding your holding, please contact the Registrar on 0870 601 5366. Changes of name or address
must be notified in writing to the Registrar.
SEDOL CODES FOR ORDINARY SHARES AND DEBENTURE STOCKS
Ordinary shares – 0882532
97⁄8% Debenture Stock 2017 – 0882640
5.5% Debenture Stock 2021 – 0530529
TEMPLE BAR INVESTMENT TRUST SAVINGS SCHEME
Details of the Temple Bar Savings Scheme are set out on page 47 of this report. This enables individuals
to buy shares in the Company in a straightforward and accessible way.
ASSOCIATION OF INVESTMENT COMPANIES
The Company is a member of the Association of Investment Companies, which produces monthly
publications of detailed information on the majority of investment trusts. The Association of Investment
Companies can be contacted by telephone on 020 7282 5555.
TEMPLE BAR WEBSITE
The Company’s own website can be found at www.templebarinvestments.com and includes useful
background information on the Company together with helpful downloads of published documentation
such as previous Annual Reports and Savings Scheme application forms.
Annual report • Final copy:Temple Bar RA 23/2/07 19:21 Page 44
Temple Bar Investment Trust 45
NOTICE OF MEETING:
NOTICE IS HEREBY GIVEN that the eighty first Annual General Meeting of Temple Bar Investment Trust PLC
will be held at 11.00 a.m. on Monday 26 March 2007 at 2 Gresham Street, London EC2V 7QP for the following
purposes:
ORDINARY BUSINESS:
1. to approve the group accounts for the year ended 31 December 2006 together with the reports
of the directors and auditors thereon,
2. to approve the report on directors’ remuneration for the year ended 31 December 2006,
3. to declare a final dividend of 19.88p per ordinary share,
4. to re-elect Mr G J Allen as a director,
5. to re-elect Mr F L J Walton as a director,
6. to re-elect Mr J Reeve as a director,
7. to re-appoint the auditors and to authorise the directors to determine their remuneration.
SPECIAL BUSINESS:
To consider and, if thought fit, pass the following resolutions:
ORDINARY RESOLUTION:
8. That the directors be and are hereby generally and unconditionally authorised in accordance
with Section 80 of the Companies Act 1985 to allot relevant securities (as defined by the said
section) up to an aggregate maximum nominal amount of £725,000 provided that:
(i) the authority granted shall expire five years from the date upon which this resolution is
passed but may be revoked or varied by the Company in general meeting and may be
renewed by the Company in general meeting for a further period not exceeding five
years; and
(ii) the said authority shall allow and enable the directors to make an offer or agreement
before the expiry of that authority which would or might require relevant securities to
be allotted after such expiry and the directors may allot relevant securities in
pursuance of any such offer or agreement as if that authority had not expired.
SPECIAL RESOLUTIONS:
9. That the directors be and they are hereby empowered pursuant to Section 95 of the Companies
Act 1985 to allot equity securities (as defined in Section 94 of that Act) for cash, in accordance
with the authority conferred on them by this meeting to allot relevant securities (as defined in
Section 80 of that Act), as if Section 89(1) of that Act did not apply to the allotment, provided
that the power conferred by this resolution shall be limited to:
(i) the allotment of equity securities in connection with a rights issue in favour of ordinary
shareholders where the equity securities respectively attributable to the interests of all
ordinary shareholders are proportionate to the respective numbers of ordinary shares
held by them on the record date of such allotment (but subject to such exclusions or
other arrangements as the directors may deem necessary or expedient in relation to
fractional entitlements or legal problems under the law of or the requirements of any
recognised regulatory body or any stock exchange in any territory); and
(ii) the allotment (otherwise than pursuant to sub paragraph (i) above) of equity securities
up to an aggregate nominal value not exceeding £725,000; and
shall expire five years from the date upon which this resolution is passed save that the Company
may make an offer or agreement before this power has expired, which would or might require
equity securities to be allotted after such expiry and the directors may allot equity securities in
pursuance of such offer or agreement as if the authority conferred hereby had not expired.
10. That the Company generally be and is hereby authorised for the purpose of Section 166 of the
Companies Act 1985 to make market purchases (as defined in Section 163 of the Act) of ordinary
shares of 25p each in the capital of the Company (‘ordinary shares’) provided that:
(i) the maximum number of ordinary shares hereby authorised to be purchased is 8,745,277
being 14.99 per cent of the issued share capital of the Company as at the date of the
passing of this resolution;
Notice of Meeting
Annual report • Final copy:Temple Bar RA 23/2/07 19:21 Page 45

46 Temple Bar Investment Trust
Notice of meeting continued
(ii) the minimum price which may be paid for such shares is 25p per share;
(iii) the maximum price (exclusive of expenses payable by the Company) which may be paid
for such shares shall be 5% above the average of the market value of the share
quotations taken from the London Stock Exchange Daily Official List for the five business
days before the purchase is made;
(iv) the authority hereby conferred shall (unless previously renewed or revoked) expire at the
end of the Annual General Meeting of the Company in 2008, or, if earlier, the date falling
fifteen months from the date of this resolution;
(v) the Company may make a contract to purchase its own shares under the authority hereby
conferred prior to the expiry of such authority which will or may be executed wholly or
partly after the expiry of such authority, and may make a purchase of its own shares in
pursuance of any such contract.
Dated this 20th day of February, 2007 By order of the Board of Directors
M K Slade
For Investec Investment
Management Limited
Secretary
2 Gresham Street
London EC2V 7QP
NOTES
1. A member entitled to attend and vote is entitled to appoint a proxy to attend the meeting and, on a poll, to vote instead of him. A proxy need
not be a member of the Company. A form of proxy is enclosed.
2. Instruments of proxy should be sent to Lloyds TSB Registrars, The Causeway, Worthing BN99 6EF so as to arrive no later than 48 hours before
the time appointed for the meeting.
Completion and return of the form of proxy will not preclude shareholders from attending and voting at the meeting in person should they wish to
do so.
3. Members who hold ordinary shares in the Company in uncertificated form must have been entered on the Company’s register of members by
6.00 p.m. on 24 March 2007 in order to be able to attend and vote at the meeting. Such members may only vote at the meeting in respect of
ordinary shares held at the time.
4. The Register of Directors’ Interests kept by the Company in accordance with Section 325 of the Companies Act 1985 will be open for inspection
at the meeting.
5. None of the directors has a service contract with the Company.
6. Only holders of ordinary shares or their proxies are entitled to attend and vote at the meeting.
LONDON WALL
GRESHAM STREET
CHEAPSIDE
NEWGATE STREET
ST PAULS
ST M
AR
TIN
’S L
E G
RA
ND
WO
OD
ST
RE
ET
NO
BL
E S
T
FO
ST
ER
LA
St Bart’sHospital
St Paul’sCathedral
Museumof London
ANGEL ST.
MONTAGUE ST.
KING
EDW
ARD
ST.
Shown is a plan of the
location of Investec
Investment Management
Limited, 2 Gresham Street,
London EC2V 7QP where the
Annual General Meeting will
be held on Monday 26 March
2007 at 11.00 a.m.
Annual report • Final copy:Temple Bar RA 23/2/07 19:21 Page 46
Temple Bar Investment Trust 47
Temple Bar offers an inexpensive way of investing in your Company.
The Temple Bar Investment Trust Savings Scheme offers:
� monthly savings from as little as £50 a month
� a daily dealing facility for lump sum investments or sales
� income reinvestment
If you would like to receive information about the Savings Scheme, call the Investor Services Department
on 020 7597 1800 or visit our website www.templebarinvestments.com. Alternatively please write to:
Investor Services Department
Investec Investment Management Limited
2 Gresham Street
London EC2V 7QP
Past performance will not necessarily be repeated. You are not certain to make a profit; you may lose
money and any income is not fixed – it can go up or down. Tax benefits detailed are those currently
applicable and will vary from one investor to another and may change in the future. The government’s
0.5% stamp duty is payable on all share purchases. Shares will be purchased at Temple Bar’s buying price
and will be sold at Temple Bar’s selling price. Phone calls may be recorded to confirm your instructions.
The above information has been issued by Investec Asset Management Limited, authorised and regulated
by the Financial Services Authority, and the investment adviser to Investec Investment Management
Limited, investment managers of Temple Bar Investment Trust PLC.
A member of the Association of Investment Companies
Temple Bar Investment Trust Savings Scheme
Annual report • Final copy:Temple Bar RA 23/2/07 19:21 Page 47

48 Temple Bar Investment Trust
Annual report • Final copy:Temple Bar RA 23/2/07 19:21 Page 48

Annual report • Final copy:Temple Bar RA 23/2/07 19:21 Page 49

Temple Bar Investment Trust PLC
Report and Accounts 2006
Temple Bar Cover with spine:206262 Temple Bar Cover 23/2/07 19:12 Page 1