Embed Size (px)
Citation preview
arX
iv:2
010.
1548
3v1
[ph
ysic
s.ch
em-p
h] 2
9 O
ct 2
020
Modeling ionic reactions at interstellar
temperatures: the case of NH−2 + H2 ⇐⇒ NH3
+ H−
F. A. Gianturco,∗,† E. Yurtsever,‡ M. Satta,¶ and R. Wester†
†Institut fur Ionenphysik und Angewandte Physik Universitatet Innsbruck, Technikerstr.
25/3, A-6020 Innsbruck, Austria
‡Department of Chemistry, Koc University, Rumelifeneriyolu, Sariyer, TR-34450, Istanbul,
Turkey
¶CNR-ISMN and Department of Chemistry, The University of Rome Sapienza, P.le A.
Moro 5, 00185 Rome, Italy
E-mail: [email protected]
Abstract
We present in this paper the main structural features and enthalpy details for the
energy profiles of the title reactions, both for the exothermic (forward) path to NH3
formation and for the endothermic (reverse) reaction to NH−2 formation. Both systems
have relevance for the nitrogen chemistry in the interstellar medium (ISM). They are
also helpful to document the possible role of H− in molecular clouds at temperatures
well below room temperature. The structural calculations are carried out using ab initio
methods and are further employed to obtain the reaction rates down to the interstellar
temperatures detected in earlier experiments. The reaction rates are obtained from the
computed Minimum Energy Path (MEP) using the Variational Transition State Theory
(VTST) approach. The results indicate very good accord with the experiments at room
1
temperature, while the measured low temperature data down to 8 K are well described
once we analyse in detail the physics of the reactions and modify accordingly the VTST
approach. This is done by employing a T-dependent scaling, from room temperature
conditions down to the lower ISM temperatures, which acknowledges the non-canonical
behavior of the fast, barrierless exothermic reaction. This feature was also suggested
in the earlier work discussed below in our main text. The physical reasons for the
experimental behavior, and the need for improving on the VTST method when used
away from room temperatures, are discussed in detail.
Introduction
The observation of molecules which belong to the Nitrogen-bearing species has regularly
been carried out in the interstellar medium (ISM) ever since the discovery of ammonia, the
first polyatomic interstellar species, by Cheung et al1. Nitrogen-containing molecular species
are also considered to be useful probes of the physics and chemistry of the ISM since they
allow to perform its analysis over a broad range of conditions. Inversion lines of ammonia
have been serving as probes of local equilibrium temperatures in molecular clouds2,3 and
rotational lines of diazenylium (NH+2 ) and its deuterated isotopologue, ND+
2 , also allow to
be tested at much higher densities (n ∼ 105 cm−3)4,5 . In the diffuse ISM, for instance,
the CN absorption lines are those which allowed the first estimate of the Cosmic Microwave
Background (CMB) temperature a few years back6. Owing to its sensitivity to Zeeman
splitting and to its hyperfine structure, CN is also a powerful tool for measuring the line-of-
sight magnetic field intensity in dense regions7.
The correct evaluation of the reservoir of nitrogen in molecular clouds is still controversial,
but it is expected to be gaseous, either in atomic or molecular forms. Atomic nitrogen in the
diffuse ISM is observed through absorption lines in the UV8. Searches for the N2 molecule in
interstellar space have been failing until its first detection in the far-ultraviolet by Knauth et
al.9 in absorption against the background star HD 124314. The derived column density of N2,
2
4.6× 1013 cm−2, is several orders of magnitude lower than that of atomic nitrogen, therefore
indicating that nitrogen is mainly in atomic form. In terms of another N-bearing species, it
was found that the total visual extinction for NH was 1.5 mag, equivalent to 2.8×1021 cm−2,
leading to abundances, with respect to hydrogen nuclei, of 7.2×10⁻⁵ and 1.6×10⁻⁸ for atomic
and molecular nitrogen, respectively10. The column density of N2 was found to be about one
order of magnitude higher than the predictions of Li et al.11 for translucent clouds, including
the rates for the photo-dissociation of N2. Strong discrepancies between observations and
predictions suggest that nitrogen chemistry in such diffuse/translucent environments remains
poorly understood.
In dense molecular clouds, where hydrogen is molecular, the situation is even worse,
because atomic neutral N and molecular N2 are not observable directly. In such clouds,
N2H+, a direct chemical product of N2, has been observed by Womack et al.11 and Maret
et al.12, who concluded that atomic N is most likely the dominant reservoir of nitrogen. In
addition, in pre-stellar cores with gas densities ∼105 cm−3, Hily-Blant et al13 derived an
upper limit on the gas-phase abundance of atomic nitrogen which suggested that nitrogen
may be predominantly hidden in ices which are fixed on the coating dust grains. More
recently, Daranlot et al.14 have found that gaseous nitrogen is mostly atomic in dense clouds,
while the dominant reservoir of nitrogen is in the form of ammonia ices at the surface of dust
grains. Nevertheless, as stressed by these authors, the predicted amount of icy ammonia is
larger than observations in dark clouds and much larger than what is detected in comets.
Thus, one can safely consider that the reservoir of gaseous (and solid) nitrogen in dark clouds
still remains an open issue.
Another fundamental question involves the path along which ammonia is formed in dense
clouds. Le Bourlot15 suggested that the gas-phase synthesis through the N++H2 reaction,
followed by H abstractions and dissociative recombination reactions, was efficient enough
to reproduce the observed amounts. Very recently, however, Dislaire et al.16 have revisited
the experimental data available for the N+ + H2 reaction and produced a new rate which
3
is significantly lower and falls below the critical value inferred by Herbst et al17 to explain
the observed abundances of ammonia. The efficiency of the gas-phase synthesis of ammonia
in comparison with the hydrogenation of atomic nitrogen on the surfaces of grains however
remains an open question (see e. g. Refs.18–21). Observational constraints on the amount
of ammonia locked into ices coating dust grains are difficult and infrequent, because the
N-H vibrational feature at 2.95 µm is heavily obscured by the 3 µm deep water-ice bands.
However, observations of NH3 ices in young star formation regions indicate that an abundance
of 5% relative to water seems a reasonable value22. Perhaps related to the ammonia issue is
a new constraint based on the abundance ratios of nitrogen hydrides NH:NH2:NH3 towards
the Class 0 protostar IRAS 16293-2422, obtained with the HIFI (Heterodyne Instrument for
the Far-Infrared) instrument located on board the Herschel satellite in the framework of the
CHESS key programme23. The absorption lines arising from the low-lying rotational levels
of these hydrides lead to abundance ratios NH:NH2:NH3=5:1:300. These abundance ratios
could not be confirmed by calculations in dark regions at a temperature of 10 K and a gas
density of 104/cm3 24. Finally, one should note that Herschel/HIFI observations of the ortho
and para forms of ammonia indicate an ortho-to-para ratio of ∼ 0.7 that could not be found
nor explained with the standard nitrogen chemistry25.
The present paper is devoted to the fate of nitrogen in yet another molecular form: i.e.
to aspects of the ionic chemistry of a specific molecular anion, NH−2 , which can react in the
ISM with one of its most abundant molecules, i.e. with H2. Thus, NH−2 will be considered in
our study for reactions at low temperatures with the environmental H2, while we shall also
discuss the related example of H− reacting with ammonia, a case of a slightly endothermic
reverse reaction from the former exothermic one . To simplify the labelling in our present
discussion,the title reactions will be named in the present study as the Forward Reaction
(FR) and the Reverse Reaction(RR) paths, in the order given by eq. (1) below.
Different examples of reactions involving H− have been studied earlier by us in the con-
text of clarifying its role in the formation of anionic carbonitriles26. Searches for NH+ and
4
NH−2 are, however, difficult not only due to their expected very low abundances, but also
because their strongest transitions lie at frequencies that are generally inaccessible to ground-
based telescopes. With the launch of Herschel27,28 and its sensitive Heterodyne Instrument
for the Far-Infrared (HIFI), which was designed to perform high-resolution observations at
frequencies 480-1250 and 1410-1910 GHz, searches for the fundamental rotational transi-
tions of NH+ and NH−2 became possible. Previous searches for the latter cation, also using
the Herschel-HIFI, had resulted in average upper limits of the NH+ abundance relative to
molecular hydrogen at 4 K to be 10−10, and N(NH+)/N(NH) to be around 4−7%29.
A recent search which has also included NH−2
30 concluded that the NH−2 anion has very
low abundances in all models, not supporting an earlier tentative detection in SgrB2(M).
Given their simulated low abundances, that work therefore suggests that this species will
be very difficult to detect in interstellar space in spite of its expected important role for the
Nitrogen chemistry in several environments.This was confirmed by recent terahertz spec-
troscopy experiments, which provided the first precise transition frequencies for the funda-
mental rotational transitions in para- and ortho-NH−2
31.
We will specifically focus the present study on the investigation, from computational first
principles, of the molecular mechanisms which can descibe the reaction given by eq. (1)
below, specifically analyzing its exothermic flow which is producing ammonia, and called
here the ’forward’ reaction (FR), and also its slightly endothermic ’reverse’ reaction (RR)
which produces the NH−2 molecule:
NH−2 +H2 ⇋ NH3 +H− (1)
The above process has been experimentally studied earlier at room temperature in both
directions32. It has also been studied later in an ion trap experiment, but this time both
at room temperature and then further down to much lower temperatures in order to reach
conditions similar to those of interest for the ISM environments, by Otto et al.33. The latter
work33 focussed on the exothermic channel for the NH−2 +H2 partners, a reaction path which
5
we shall be discussing in detail in the present paper.
In the following Section we will present the computational aspects which give us the
various structural details of reactions 1, while in Section III we will employ a model treat-
ment of the the reaction rates which is known to be particularly effective when exothermic,
barrierless reactions are studied at room temperature. We will further show a T-dependent
scaling of specific molecular indeces in the latter method to extend its usage down to the
observed low temperatures of Otto et al33. Our present conclusions will then be discussed
in Section IV.
Ab initio analysis of the reaction features
Calculations were carried out using a variety of post-Hartree-Fock ab initio methods. One
level of analysis employed the basis set choice of the CCSD(T)/aug-cc-pVTZ//MP2/aug-cc-
pVTZ. The geometry and energy optimizations were done using the MP2 approach, while all
single point energies are calculated by using the CCSD(T) approach employed in the GAUS-
SIAN 09 code34. The zero-point-energy (ZPE) corrections were included in all calculations
done with both sets of methods. The same set of calculations were also carried out using
the Density Functional Theory (DFT) and employing the B3LYP/6-311++G** expansion
level, as outlined in the Gaussian set of codes34.
A pictorial view of the various steps along the reaction, viewing the mechanisms which
play a role for the present systems are shown in figure 1, where the overall qualitative
energy changes are marked by the computed values which are given in detail by table 1.
It is interesting to note that the structural features reported in the table are qualitatively
similar to those already reported in the earlier work33 and clearly confirm the following
flow of structures when following the reaction from reagents to products along the Forward
Reaction (FR) of the exothermic process:
1. The exothermicity of the NH−2 reaction with H2 varies from the earlier value33 of 140
6
Figure 1: A schematic view of the reaction (adapted from33). The energy values are fromCCSD(T) calculations while those in parentheses are from DFT results.
meV, given in brackets by the 1st left column, to the present post-HF value of 129 meV
and to the 167 meV from the DFT calculations. The difference between this last value
and the earlier ones can be attributed to the known property of the DFT calculations
to overestimate energy gaps of reactions. It is also important to note here that the
differences shown by the latter calculations are additionally linked to the fact that
the CCSD(T) calculations come from single-point optimization while the DFT results
follow the multidimentional optimizations along the Minimum Energy Path (MEP)
which we shall be explaiing later in this Section.
2. The location of the minimum structure in the entrance channel of the FR process
(Min1) is below the reference energy of the entrance channel, at an energy of -192 meV
from DFT and -101 meV from CCSD(T): the earlier value from33 was of -100 meV.
This particular minimum structure has an Hessian with a single negative eigenvalue so
it is strictly only a minimum within a saddle point configuration. Its structure will be
further discussed below.
7
Table 1: Computed energy values and outlined geometries of the Transition State (TS), ofthe local minimum on the entrance channel (Min1) and of the secondary minimum on theexit channel (Min2). Each column indicates the results from either of the computationalmethods employed. The values given in brackets in the first column are those from33. Thenet charges found on the reactive hydrogen atom in the entrance and exit channels, and atthe geometries of the intermediate configurations, are given in the last set of columns on theright-hand-side.
Energy a (meV) RH−H (Å ) RN−H (Å ) Mulliken charge on Hpost-HF(b) DFT(c) post-HF(b) DFT(c) post-HF(b) DFT(c) post-HF(b) DFT(c)
NH−2 +H2 0.000 0.000 0.737 0.744 10 10 0.000 0.000
Min1 -101 (-100) -192 0.761 0.755 2.185 2.064 -0.273 -0.238TS -25 (-50) -173 0.926 0.795 1.475 1.931 -0.121 -0.310
Min2 -457 (-410) -560 1.818 1.819 1.041 1.046 -0.959 -0.902NH3+H− -129 (-140) -167 10 10 1.013 1.015 -1.000 -1.000
(a)Differences with respect to the energy of NH−2 + H2
(b)CCSD(T)/aug-cc-pVTZ//MP2/aug-cc-pVTZ(c)B3LYP/6-311++g**
3. The transition state (TS) is located above the Min1 structure. The post-HF result
gives a barrier to the latter of 76 meV (XXX not 167 meV XXX), while the DFT
calculations yields only 19 meV. These values have been calculated along the MEP
path with steps of 0.005 Angstrom and quadratic control of convergence in the DFT
procedure. In Ref.33, a value of 50 meV was computed.
4. A second minimum (Min2) is located at the lowest energy point along the MEP, toward
the exothermic products of the FR: it corresponds to the H− bound to the NH3 molecule
and now moving toward the final products of the Forward process. Both types of
present calculations locate it as a true minimum (no negative Hessian eigenvalues).
The CCSD(T) results are closer to the earlier calculations of33: -457 meV vs -410
meV, while the DFT results are nearly 100 meV lower: -560 meV. From a qualitative
standpoint, however, all calculations indicate similar orders of magnitude for the depth
of this minimum structure.
The potential energy curves for the reaction obtained with various methods and basis set
choices are plotted in figure 2 to better illustrate the quality of the post-HF calculations. A
8
0.6 0.7 0.8 0.9 1.0 1.1
RH-H (Å)
-400
-300
-200
-100
0
Ene
rgy
(meV
)
MP2/avdzMP2/avtzMP2/avqzCC/avtzCC/avqz
Figure 2: Computational variations of the MEP reaction profile as a function of the basisset expansions from double-zed (dz) to quadruple zed (qz) and using either MP2 or CCSDlevels of calculations34
more detailed presentation in the entrance channel region of the forward reaction, i.e. around
the H-H distances of the Min1 configuration, are shown in figure 3 for the same variations of
basis set selection. In general, we find the CCSD results to be more reliable for the location
of optimized minima structures than the MP2 choice, where sometime the minima run below
the asymptotic value. Thus, the CCSD results are shown in the table 1 in comparison with
the DFT results and will be used in the following calculations for the reaction rates and
minima structures along the reaction path.
We can make the following comments about the data shown in these figures, linking them
to the numerical values for the charge migration along the reaction flow, as reported in the
previous Table:
1. The initial minimum structure which appears at the entrance channel of the exothermic
9
0.5 1.0 1.5 2.0 2.5 3.0 3.5 4.0
RH-H (Å)
-700
-600
-500
-400
-300
-200
-100
0
100
200
Ene
rgy
(meV
)MP2/avdzMP2/avtzMP2/avqzCC/avtzCC/avqz
Figure 3: Computed energy variations along the MEP in the region of the reagents for theexothermic reaction. The Min1 and TS regions are reported. See main text for furthercomments.
FR process is clearly describing, in both sets of calculations, a resonant complex where
the H2 molecule is attached to the NH−2 reagent while some of its negative charge is
now moved onto the H-atom from the excess electron of the π∗ MO located on the
N-atom ( see structures in figure 5 ). Thus, the DFT results indicate more clearly
a charge transfer direction nearly perpendicular to the molecular plane, which is the
orientation of the excess electron MO as shown by our earlier study35. The geometries
reported by both sets of calculations are also very similar.
2. The structure of the Transition State (TS) indicates in both calculations that the
complex formed still identifies the two molecular partners as H2 and NH−2 , although
the diatomic bond is now more stretched and the hydrogenic partner is getting closer to
the anionic partner: it could be qualitatively considered as an ’earlier’ transition state.
10
0 1 2 3 4 5 6-500
-400
-300
-200
-100
0MP2
0.6 0.8 1 1.2 1.4 1.6 1.8 2
-600
-400
-200
0
Ene
rgy
(meV
)
B3LYP
0.6 0.8 1 1.2 1.4 1.6 1.8 2
RH-H (Å)
-600
-400
-200
0
CCSD
Figure 4: Comparison between the computed MEP profiles . The top panel shows thefuller range of H-H distances obtained using the MP2 approach, while the lower two panelscompare the CCSD(T) results(bottom panel) with the DFT results ( middle panel) in anenlarged view of the region near the inner minimum Min1 and the small barrier to the TSwhen going out to exothermic products.
Most of the charge from the excess electron still resides on the polyatomic partner
anion while the complex reaches the very small barrier leading to that TS structure.
3. The deepest, true minimum of the present system is clearly seen, at the bottom of
figure 4, to finally form the NH3 partner within the complex, while the residual H−
atom is now carrying most of the excess negative charge from the reacting partner,
11
Figure 5: Pictorial comparison between the significant structural details of the complex ofreactants formed early on along the entrance channel, top panel, followed by the TransitionState (TS) structures ( middle panel) and by the true minimum complex formed in the regionof the reaction toward the products ( bottom panel). See main text for further details.
thus producing the H− anion: the N-H distances are now those of the final ammonia
molecule that describes the neutral molecular product.
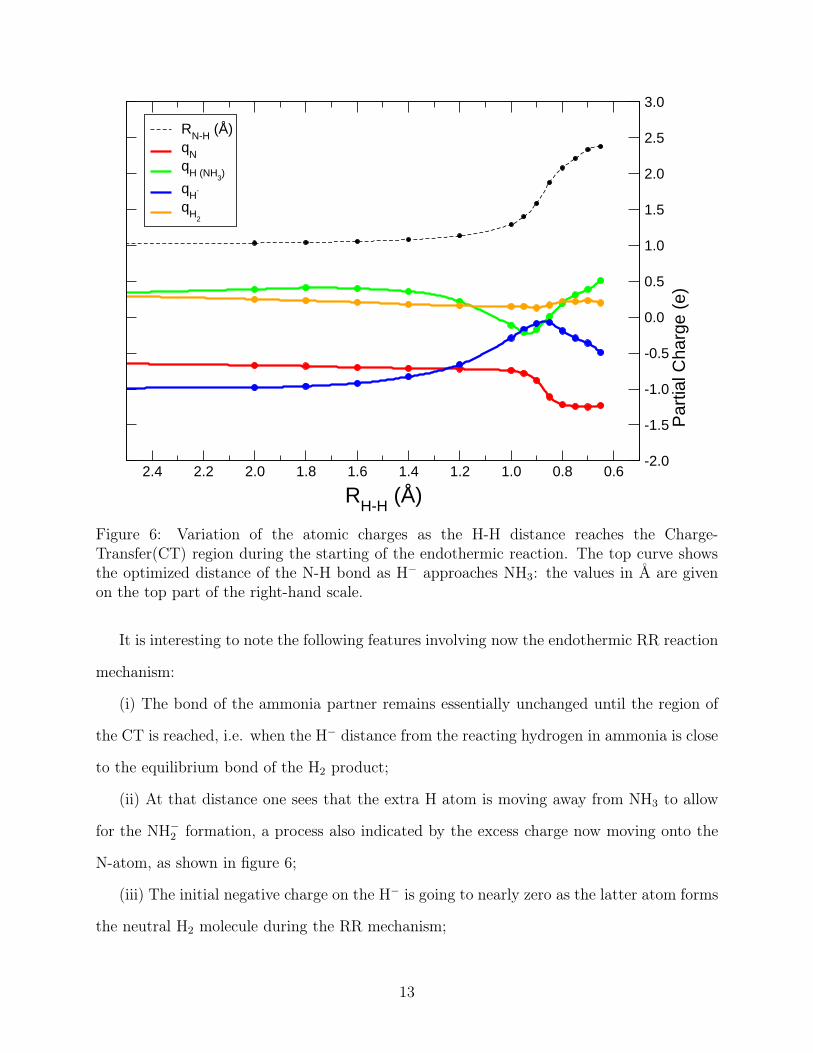
That the present reaction electronically involves a step where the charge-transfer (CT)
physically occurs, from the NH−2 partner to the H− product, when the reacting molecules
are close to the Min2 complex formation could also be gathered from the variations of the
Mulliken charges on the various participating atoms as the reaction flows to products for the
endothermic Reverse Reaction (RR), as shown by figure 6. Such changes are also confirmed
by the data pictorially presented by figure 5, where we also depict the changes induced in
the N-H bond of the ammonia molecule as H− approaches and forms the new H2 bond .
12
0.60.81.01.21.41.61.82.02.22.4
RH-H (Å)
-2.0
-1.5
-1.0
-0.5
0.0
0.5
1.0
1.5
2.0
2.5
3.0
Par
tial C
harg
e (e
)
RN-H (Å)qNqH (NH3)
qH-
qH2
Figure 6: Variation of the atomic charges as the H-H distance reaches the Charge-Transfer(CT) region during the starting of the endothermic reaction. The top curve showsthe optimized distance of the N-H bond as H− approaches NH3: the values in Å are givenon the top part of the right-hand scale.
It is interesting to note the following features involving now the endothermic RR reaction
mechanism:
(i) The bond of the ammonia partner remains essentially unchanged until the region of
the CT is reached, i.e. when the H− distance from the reacting hydrogen in ammonia is close
to the equilibrium bond of the H2 product;
(ii) At that distance one sees that the extra H atom is moving away from NH3 to allow
for the NH−2 formation, a process also indicated by the excess charge now moving onto the
N-atom, as shown in figure 6;
(iii) The initial negative charge on the H− is going to nearly zero as the latter atom forms
the neutral H2 molecule during the RR mechanism;
13
(iv) With the same token, we also see in that figure 6 that the H2 reaction partner for
the FR mechanism remains always without any excess electron charge on it, since the one
on H− directly moves onto the N-atom of the final NH−2 product.
0.6 0.8 1 1.2 1.4 1.6 1.8 2
RH-H (Å)
1.0
1.2
1.4
1.6
1.8
2.0
2.2
2.4
2.6
RN
-H (
Å)
Figure 7: Computed variations of the N-H distances as the H−- approaches the NH3 partner(from right to left) in the endothermic reaction.
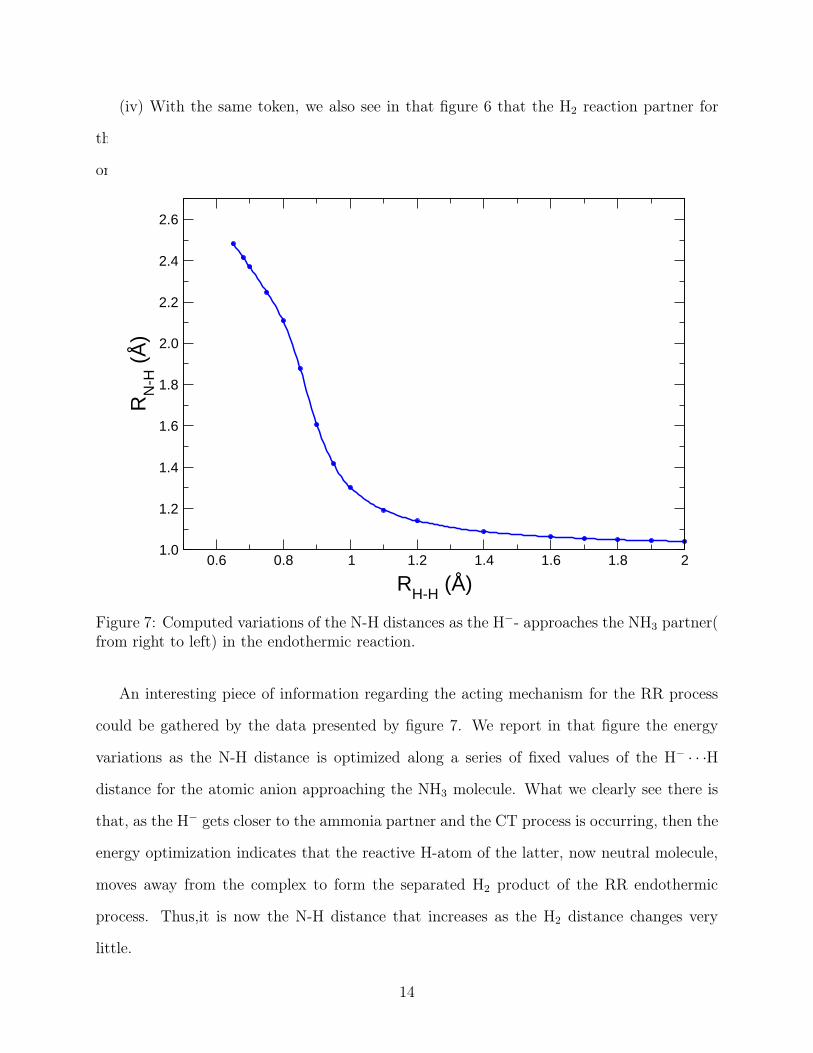
An interesting piece of information regarding the acting mechanism for the RR process
could be gathered by the data presented by figure 7. We report in that figure the energy
variations as the N-H distance is optimized along a series of fixed values of the H− · · ·H
distance for the atomic anion approaching the NH3 molecule. What we clearly see there is
that, as the H− gets closer to the ammonia partner and the CT process is occurring, then the
energy optimization indicates that the reactive H-atom of the latter, now neutral molecule,
moves away from the complex to form the separated H2 product of the RR endothermic
process. Thus,it is now the N-H distance that increases as the H2 distance changes very
little.
14
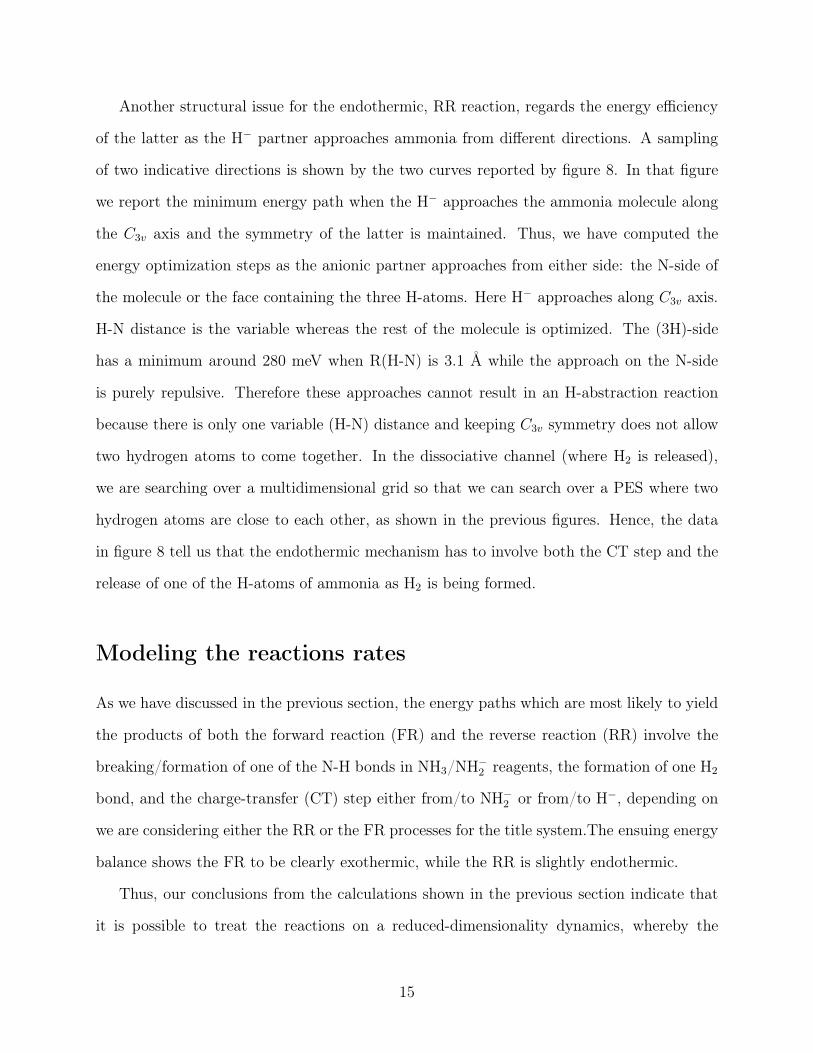
Another structural issue for the endothermic, RR reaction, regards the energy efficiency
of the latter as the H− partner approaches ammonia from different directions. A sampling
of two indicative directions is shown by the two curves reported by figure 8. In that figure
we report the minimum energy path when the H− approaches the ammonia molecule along
the C3v axis and the symmetry of the latter is maintained. Thus, we have computed the
energy optimization steps as the anionic partner approaches from either side: the N-side of
the molecule or the face containing the three H-atoms. Here H− approaches along C3v axis.
H-N distance is the variable whereas the rest of the molecule is optimized. The (3H)-side
has a minimum around 280 meV when R(H-N) is 3.1 Å while the approach on the N-side
is purely repulsive. Therefore these approaches cannot result in an H-abstraction reaction
because there is only one variable (H-N) distance and keeping C3v symmetry does not allow
two hydrogen atoms to come together. In the dissociative channel (where H2 is released),
we are searching over a multidimensional grid so that we can search over a PES where two
hydrogen atoms are close to each other, as shown in the previous figures. Hence, the data
in figure 8 tell us that the endothermic mechanism has to involve both the CT step and the
release of one of the H-atoms of ammonia as H2 is being formed.
Modeling the reactions rates
As we have discussed in the previous section, the energy paths which are most likely to yield
the products of both the forward reaction (FR) and the reverse reaction (RR) involve the
breaking/formation of one of the N-H bonds in NH3/NH−2 reagents, the formation of one H2
bond, and the charge-transfer (CT) step either from/to NH−2 or from/to H−, depending on
we are considering either the RR or the FR processes for the title system.The ensuing energy
balance shows the FR to be clearly exothermic, while the RR is slightly endothermic.
Thus, our conclusions from the calculations shown in the previous section indicate that
it is possible to treat the reactions on a reduced-dimensionality dynamics, whereby the
15
0 2 4 6 8 10 12 14 16 18 20
RH-H (Å)
-200
0
200
400
600
800
Ene
rgy
(meV
)H3 sideN side
Figure 8: Computed energy paths for the H− approach on either the N-side of the NH3
partner or on the center of the (3H) face of the umbrella structure in NH3. See main textfor further details.
computed minimum energy path (MEP) is obtained by involving chiefly two degrees of
freedom along an essentially collinear, or nearly collinear, reaction progress. A pictorial view
of such path is shown by the data in figure 9, where we clearly see that the exothermic, FR
mechanism proceeds from the upper right of the figure down to the lower left of it. The
endothermic RR mechanism obviously follows the opposite path.
To help understand pictorially the special features of the present exothermic channel, a
different view of the same MEP is presented by figure 10. Here figure 10 indicates even more
clearly the marked exothermicity of the FR process and the absence of any intermediate
barrier when following the NH3-forming reaction path. We shall further analyse below the
consequences of this specific behaviour of that reaction by using the Variational Transition
State Theory (VTST) which we have employed before36 and which was already discussed in
16
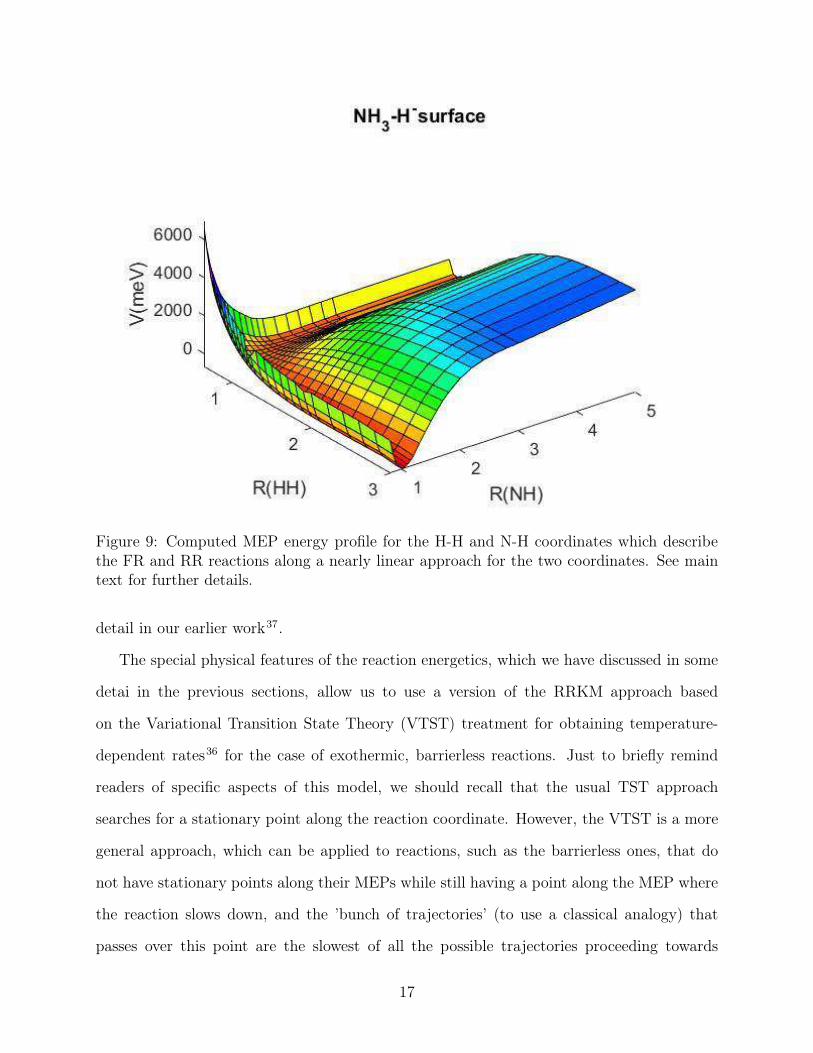
Figure 9: Computed MEP energy profile for the H-H and N-H coordinates which describethe FR and RR reactions along a nearly linear approach for the two coordinates. See maintext for further details.
detail in our earlier work37.
The special physical features of the reaction energetics, which we have discussed in some
detai in the previous sections, allow us to use a version of the RRKM approach based
on the Variational Transition State Theory (VTST) treatment for obtaining temperature-
dependent rates36 for the case of exothermic, barrierless reactions. Just to briefly remind
readers of specific aspects of this model, we should recall that the usual TST approach
searches for a stationary point along the reaction coordinate. However, the VTST is a more
general approach, which can be applied to reactions, such as the barrierless ones, that do
not have stationary points along their MEPs while still having a point along the MEP where
the reaction slows down, and the ’bunch of trajectories’ (to use a classical analogy) that
passes over this point are the slowest of all the possible trajectories proceeding towards
17
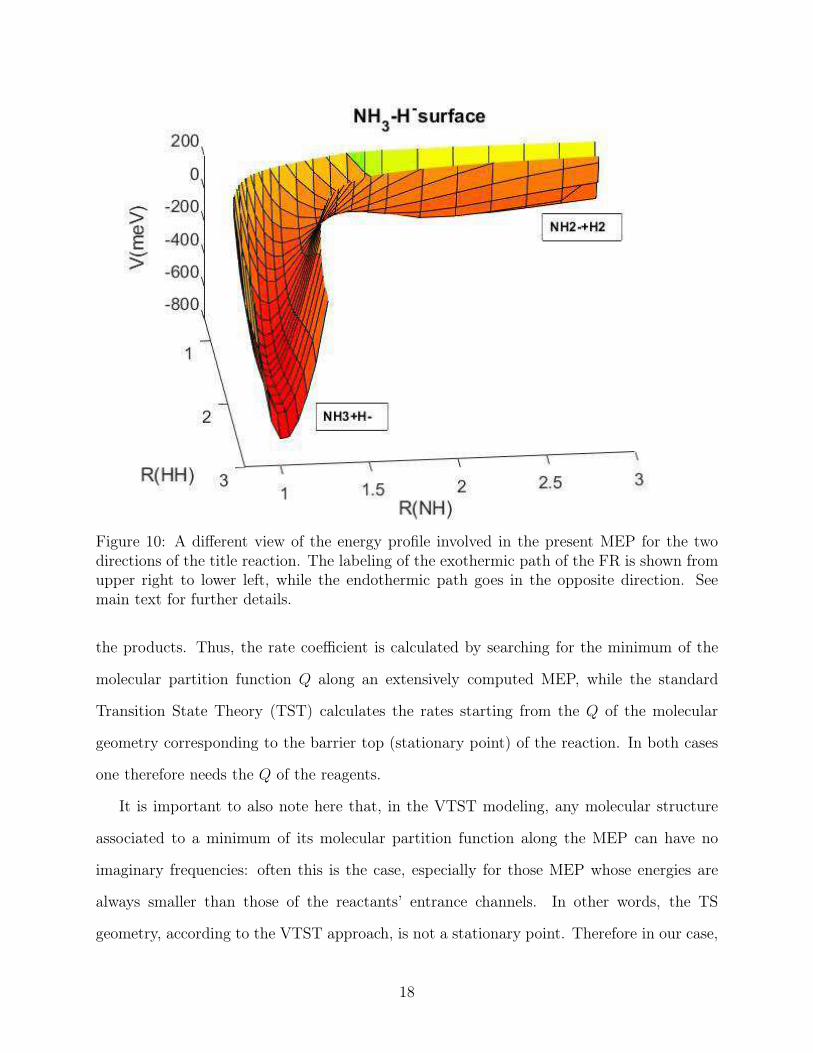
Figure 10: A different view of the energy profile involved in the present MEP for the twodirections of the title reaction. The labeling of the exothermic path of the FR is shown fromupper right to lower left, while the endothermic path goes in the opposite direction. Seemain text for further details.
the products. Thus, the rate coefficient is calculated by searching for the minimum of the
molecular partition function Q along an extensively computed MEP, while the standard
Transition State Theory (TST) calculates the rates starting from the Q of the molecular
geometry corresponding to the barrier top (stationary point) of the reaction. In both cases
one therefore needs the Q of the reagents.
It is important to also note here that, in the VTST modeling, any molecular structure
associated to a minimum of its molecular partition function along the MEP can have no
imaginary frequencies: often this is the case, especially for those MEP whose energies are
always smaller than those of the reactants’ entrance channels. In other words, the TS
geometry, according to the VTST approach, is not a stationary point. Therefore in our case,
18
where we study the exothermic FR mechanism for the reaction: NH−2 +H2 → NH3 + H−, the
minimum of the Qs along the MEP is slightly shifted with respect to the barrier top that
leads the system towards the products region. At this point all the frequencies are positive
even if the MEP has a negative curvature in that reaction coordinate region. This can be
explained because in the calculation of the MEP all the coordinates, except the reaction
coordinate, are simultaneously optimized. On the contrary, in the frequency calculations for
the TST model, each element of the second derivative matrix is obtained by fixing all the
coordinates except those corresponding to the normal mode of that element.
This distinction provides a marked difference with respect to the standard transition state
theory applied to reactions with a barrier, where the bottleneck of the ’reaction trajectories’
is always located exactly at the top of the barrier and there, almost always, at least one
of the frequencies is imaginary. But even in that case one can calculate the ZPE since the
normal mode corresponding to the imaginary frequency is neglected there, and therefore
also its molecular partition function. This is the reason why in the usual TST the Q has a
minimum for the molecular geometry corresponding to the barrier top. This is the difference
between VTST and TST: in the former modeling one searches for the minima of the Qs that
develop all along the MEP set of structures and includes all the residual degrees of freedom.
We have recapped the VTST method above to show that it basically assumes the for-
mation of a transition-state complex all along the exothermic energy path from reactants to
products and it further controls the efficiency of product formation via the relative energetics
between the partition functions of that complex and those of the initial reagents. Further-
more, one assumes a strong-coupling approximation whereby the degrees of freedom within
the evolving TS complex are strongly coupled among themselves, but, due to the ususually
low pressure conditions in experiments and in the ISM, there is no coupling with the sur-
rounding thermal bath provided by the other molecules in the ambient gas. One should be
reminded that the collision frequencies with the other molecules would be much larger than
microseconds, while the intramolecular vibrational redistribution (IVR) time scales with the
19
non-reacting degrees of freedom would be of the order of 0.1 ps. This time scales needs to
be compared with the time spent at the TS within the MEP during the reaction: this may
vary from about 150 fs at 300K to about 350 fs at 10K.
From the above, it follows that, depending on temperature, the crossing of the MEP
during the reaction will occur on a shorter time-scale than that of the characteristic in-
tramolecular vibrational rearrangements. This means that, once the TS area is reached by
the reagents along the exothermic MEP, the reactants are in microcanonical equilibrium
with their non-reactive surroundings and also with the reactive coordinate and its kinetic
and potential energy content. Under room temperature conditions the TS reactive degree
of freedom can then efficiently release its energy gained during the exothermic process to
the relative kinetic energy of the products while avoiding to transfer energy to the other
non-reactive modes. That such assumption could in fact break down as the temperature of
the reactive process becomes much smaller than room temperature will be discussed in the
following.
The complex partition function, Q‡TS, can then be obtained as the product of the Qs
for the conserved mode partition functions within that complex, Q‡cons, times the Qs of the
translational mode:
Q‡TS(T ) = Q‡
cons(T )Q‡trans(T ) (2)
Within the VTST the activation energy is zero and therefore the standard exponent of
the Arrhenius equation is equal to unity. This now means that it will be the pre-exponential
factor of the rate formulation by that equation which becomes the only significant part
which needs evaluation to obtain the reaction rates K(T ). The latter quantity can now be
obtained as the ratio between the relevant Qs of the TS complex and those of the reagents,
as a function of the reaction temperatures:
20
K(T ) =kBT
h
Q[(NH−2 ) · · · (H2)]
Q[NH−2 ]Q[H2]
(3)
Here kB is the Boltzmann constant and h is the Plank’s constant. The Qs of the reaction
complex are variationally minimized along all the optimized geometries of the MEP. After
the variational minimization we therefore obtain at each temperature the TS geometries at
the lowest possible energy along the MEP paths and within the VTST model (see e. g.36).
In other words, the model assumes that the extra energy acquired by the reactive degree
of freedom of the TS, as it descends exothermically along the MEP towards the products,
is efficiently transferred into the relative kinetic energy of the products, so that at each
temperature value the reaction rate can progress within a peudo-canonical equilibrium within
the complex. It is interesting to note at this point that the rate coefficient as obtained from
the above equation is, at the lowest temperatures, linked to the behaviour of the vibrational
part of the Qs for that specific TS geometry since all other degrees of freedom are now
"frozen" to their lowest values in order to satisfy to the equilibrium condition required
by implementing the VTST treatment of the rates. As we descend to increasingly lower
temperatures, however, the TS’s Qs relate directly to the zero-point energy (ZPE) values of
the modes under consideration since Qvib(at low T) can be written as: e−EZPE/kBT . Thus the
overall rates at low-T would be linked with the features of the corresponding ZPE energy
values within the Qs:
K(lowT ) ∝ Te−E
TSZPE
+EReactsZPE
KBT ∝ Te−∆ZPE
KBT (4)
In the present reactions we have that EreactsZPE = E
NH−
2
ZPE + EH2
ZPE. The quantity ∆ZPE
thus defines the energy differences between the EZPE of the reactants and those of the TS
complex. It therefore controls the slope of the reaction rate K (at low temperature) which
is defined by the above equation: a large value of that difference causes a greater decrease
of K(T ) as T decreases. The ZPE values of our present MEPs depend on: (i) the H-H-N
21
vibrations at the TS geometries and: (ii) the intramolecular vibrational frequencies within
the remaining atoms in the reactants (in our case NH−2 and H2). We shall further discuss
this point below when analyzing the low-T behavior of our calculated rates.
For the exothermic reaction, the FR reaction, we evaluated the minima of the partition
functions Qs of the TS complex along the computed MEP configurations from reactants
to products. For this reaction we find that this minimum is practically coincident with
the location of the pseudo-TS along the path. However, when we did the calculations for
the endothermic RR process, that minimum is located in the region of the MEP which
is very close to the final products, as discussed earlier in Section II. Thus, we find that
the reaction bottleneck for the FR mechanism is located just before the ’downhill’ path to
products which brings the MEP to its absolute minimum. On the other hand, for the RR
that minimum of the TS would be located at the MEP minimum as requested by the VTST
model. When applying eq. (3) to obtain the rates for the two reactions we obtain directly
the rate of the exothermic FR process, while for the endothermic path, the RR process, we
still have to multiply the l.h.s. ratio by exp(−H/kBT ) where H is the reaction enthalpy of
the endothermic process, as discussed in Section II. This additional factor provides the main
difference of behavior between the FR and RR mechanisms at the low temperatures of the
ISM environment, as we shall further discuss below.
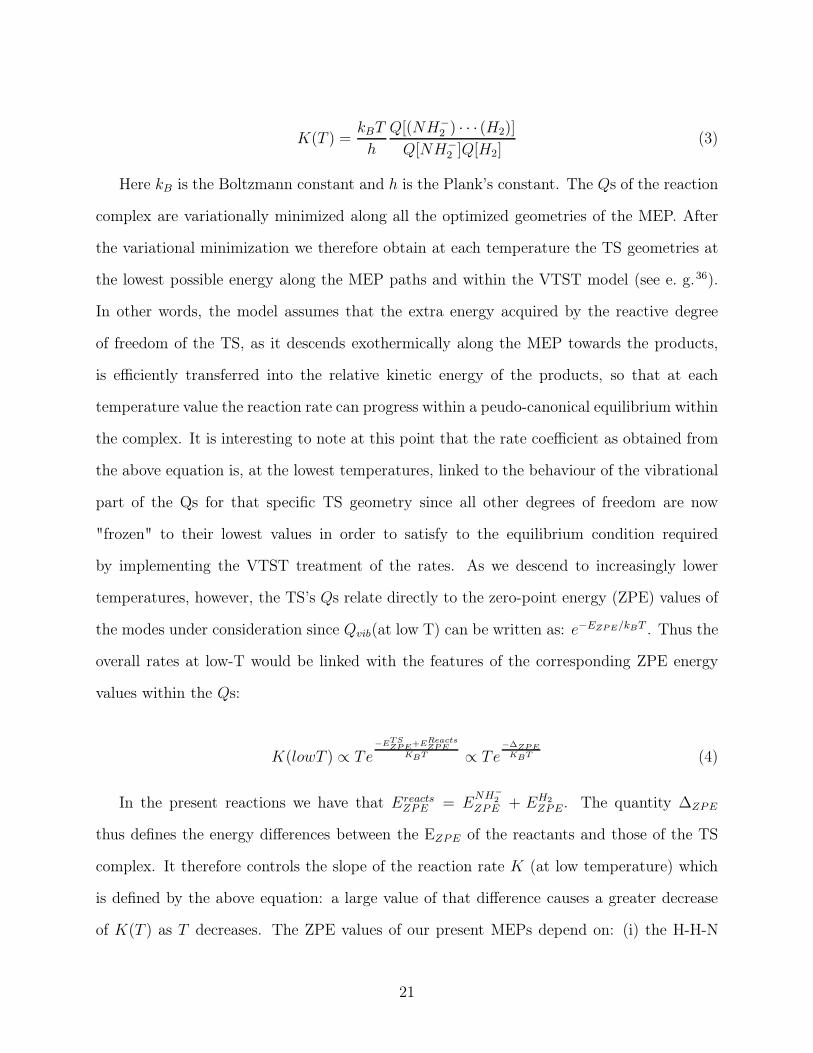
We report in the next figure 11 the behavior of both rates for the two directions of the
title reaction. The three panels of that figure indicate the temperature dependence of the
rates within different ranges of T. We can easily see that the two existing measurements at
room temperature reported in the upper panel agree very well with the present calculations
for both the FR and the RR mechanism. It therefore follows that the VTST approach,
using the present ab initio calculations, works realistically in describing this reaction in the
temperature region of the laboratory experiments. At the same time, when comparing with
the other existing experiments which were carried out below room temperature, and down
to about 8 K, we now see that the computed FR rates decrease rapidly with T, while the
22
Figure 11: Computed VTST rates for the exothermic (black) and endothermic (blue) paths ofthe title reactions. The experimental points are from: (*) (Otto et al.)33 and (#) (Bohme)32.See main text for further details.
experimental rates increase with decreasing T.
To try to better understand the possible physical origins of these differences, we should
begin to note first that the standard, textbook VTST approach includes the molecular ro-
tations through the approximate formula:
Qrot(T ) =1
s
(
kBT
hc
)31
2
(
π
A× B × C
)
(5)
Here, s identifies the multiplicity and A, B, C are the rotational constants of the TS and
23
of the individual molecular reactants. This rather strong approximation presumes that the
temperature of interest be: T >> hcX/kB , where X is the largest of the rotational constants.
We have done the calculations at room temperature using both the above simplification
and the exact quantum approach, finding only marginal differences in the calculated rates.
However, the use of the above equation becomes a limitation of the standard VTST treatment
once one moves to low temperatures. For instance, in the present case, for NH−2 the value of
T should be >> 32.89 K, while in the case of H2 should be >> 86.87 K. We therefore see
that the standard VTST approach would be valid at room temperatures but starts to fail as
the temperature is lowered down to T < 200 K.
If we now look at the evaluation of the present rates at low-T as given by eq. 4 we see
that the large values of the ∆ZPE between the geometry of the TS and that of the reagents
is the chief cause for the rapid dropping of K(T) as the temperature decreases. We have
therefore attemped to improve on the a VTST approach by devising a scaling of such ∆ZPE
values beween 300 K and 8 K, using the room-temperature agreement as a reference value.
Let us therefore write the above quantity in a temperature–dependent form
∆ZPE =⇒(τ + T )
300K∆ZPE, (6)
where τ is a fitting parameter, which we give the value of 5.3 K. We have also replaced
the approximate formulation of eq. 3 for H2 with its quantum formulation of the their
rotational partition functions38. The calculations indicated by eq. 3 are now done again
with the replacement of the fixed-value ∆ZPE with its T-dependent behaviour from eq. 6.
The results are shown in the Figure 12 below.
It is interesting to note in that figure how the FR exothermic reaction now yields rates
which agree splendidly with the experiments down to the lowest measured temperatures
provided by experiments. It indicates that the T-dependent modification of the standard
VTST at low-T is essential to recover a computed behaviour that correctly describes the
involved physics.
24
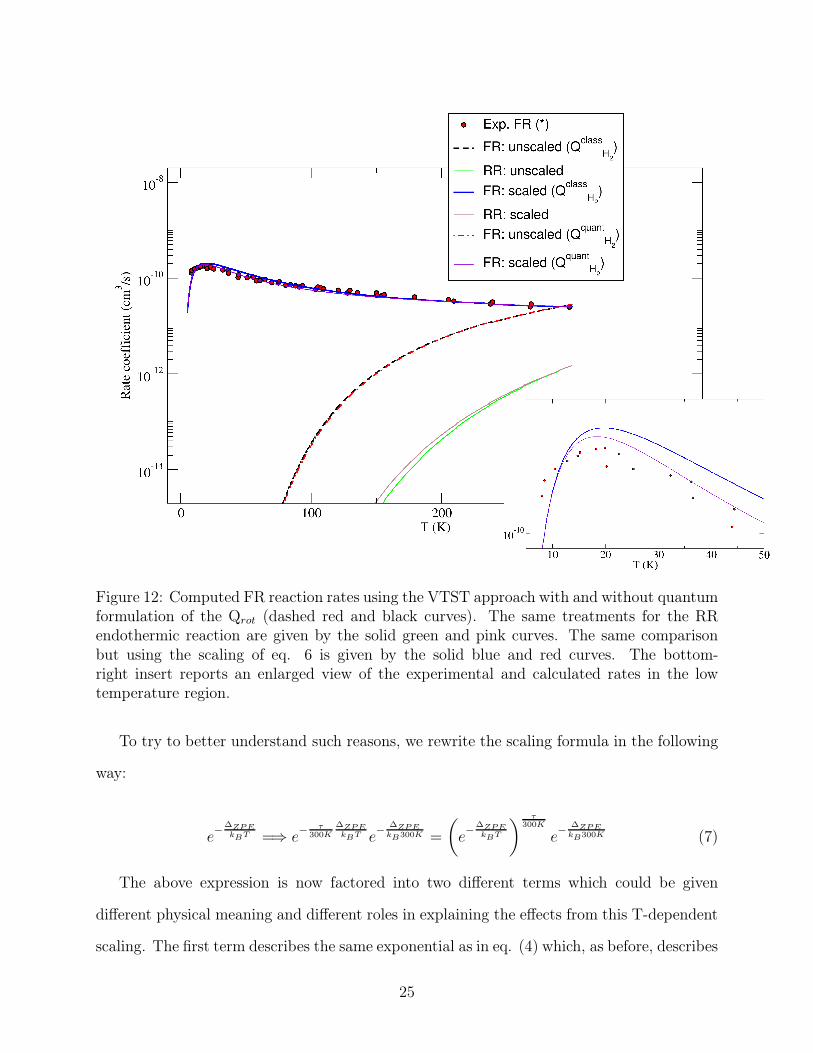
Figure 12: Computed FR reaction rates using the VTST approach with and without quantumformulation of the Qrot (dashed red and black curves). The same treatments for the RRendothermic reaction are given by the solid green and pink curves. The same comparisonbut using the scaling of eq. 6 is given by the solid blue and red curves. The bottom-right insert reports an enlarged view of the experimental and calculated rates in the lowtemperature region.
To try to better understand such reasons, we rewrite the scaling formula in the following
way:
e−
∆ZPE
kBT =⇒ e− τ
300K
∆ZPE
kBT e−
∆ZPE
kB300K =
(
e−
∆ZPE
kBT
)τ
300K
e−
∆ZPE
kB300K (7)
The above expression is now factored into two different terms which could be given
different physical meaning and different roles in explaining the effects from this T-dependent
scaling. The first term describes the same exponential as in eq. (4) which, as before, describes
25
the low-T behavior of the rates, but is now modified by the presence of an exponentially
reducing factor of (τ/300K). The second term reports the same unchanged term as employed
earlier in eq. (4), but now kept fixed at the reaction’s room temperature of 300 K.
If we consider these two terms to describe (as a classical analogy) the total ’trajectory
flux’ during reaction, then we could say that the second term gives the correct reaction flux of
trajectories at room temperatures, where the TS state, which is beginning to run ’downhill’
towards the products, correctly manages at the higher T values to rapidly cross the reactive
region of the MEP and therefore to efficiently transfer towards the products the excess energy
it has gained during the exothermic run along the MEP, thereby following the variational
lowest energy path discussed earlier. The surrounding bath comprises the residual vibrational
modes of the reacting NH−2 and the H2 vibrations. On the other hand, the first term of eq.
(7) is markedly reduced from its unscaled form by the introduction of the (τ/300K) factor: it
describes a small portion of the trajectories (the larger portion being given by (1-τ/300K)=
0.98%) which manages, as T decreases, to transfer the reaction enthalphy to the relative
kinetic energy of the prodcuts without heating the non reactive modes when going below
room temperature, while the larger portion of the trajectories (second term of eq. (7)) is
such that the MEP crossing is so slow that within the complex there is enough time to, at
least partially, transfer the excess reaction energy to the non-reactive modes.
Thus, for exothermic reactions which are investigated well below room temperatures, the
TS structure is not efficiently keeping its thermal balance during the slow MEP crossing
of the reaction region, and therefore the VTST model fails at such low temperatures. Our
scaling procedure is thus correcting for this failure by reducing the flux contributing to
obtaining the final VTST rates to only that number which manages to keep the required
pseudo-canonical equilibrium of the VTST treatment, as the temperature goes increasingly
below room temperature.
Such scaling correction only holds for the exothermic reactions with small or no barrier
and at low temperatures. It is not sufficiently corrected for the endothermic channel, where
26
200 220 240 260 280 300
10-12
10-10
10-8
Exp. FR (#)Exp. RR (#)Exp. FR (*)FR: scaledRR: scaledFR: unscaledRR: unscaled
30 60 90 120 150 18010-30
10-25
10-20
10-15
10-10
Rat
e co
effic
ient
(cm
3 /s)
0 5 10 15 20 25 30T (K)
10-200
10-160
10-120
10-80
10-40
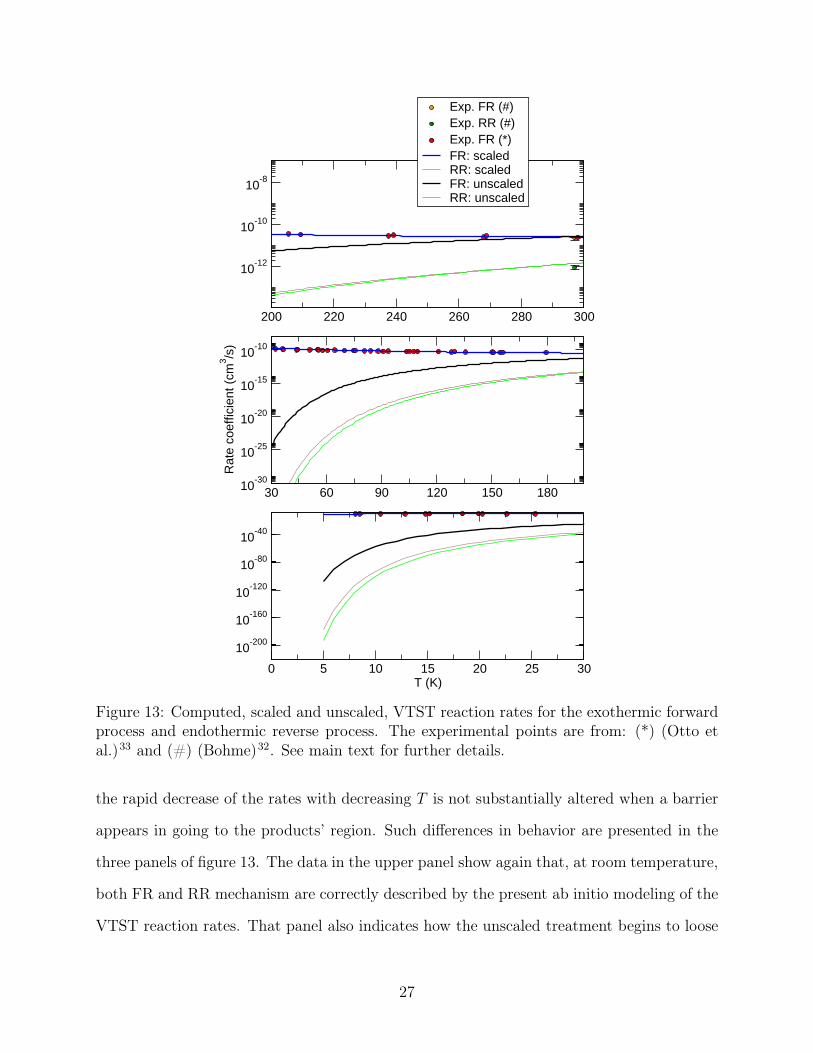
Figure 13: Computed, scaled and unscaled, VTST reaction rates for the exothermic forwardprocess and endothermic reverse process. The experimental points are from: (*) (Otto etal.)33 and (#) (Bohme)32. See main text for further details.
the rapid decrease of the rates with decreasing T is not substantially altered when a barrier
appears in going to the products’ region. Such differences in behavior are presented in the
three panels of figure 13. The data in the upper panel show again that, at room temperature,
both FR and RR mechanism are correctly described by the present ab initio modeling of the
VTST reaction rates. That panel also indicates how the unscaled treatment begins to loose
27
agreement with experiments (only available for the exothermic path) when T becomes lower
than about 250 K. The next two panels further show how dramatically the standard VTST
reaction rates decrease with T and markedly depart from the available experimental data for
the FR mechanism, clearly reaching strongly unphysical values in the bottom panel. On the
other hand, we see that the empirical reduction of the number of trajectories which maintain
the VTST conditions allows now the computed rates to agree very well with experiments
down to the lowest available temperature. We should also note here that the same scaling,
when applied to the endothermic reaction, does not manage to increase their values as T
decreases. Whether experiments in that thermal region will indicate this behaviour to be
the correct, still remains to be verified by possible new measurements for the endothermic
reaction.
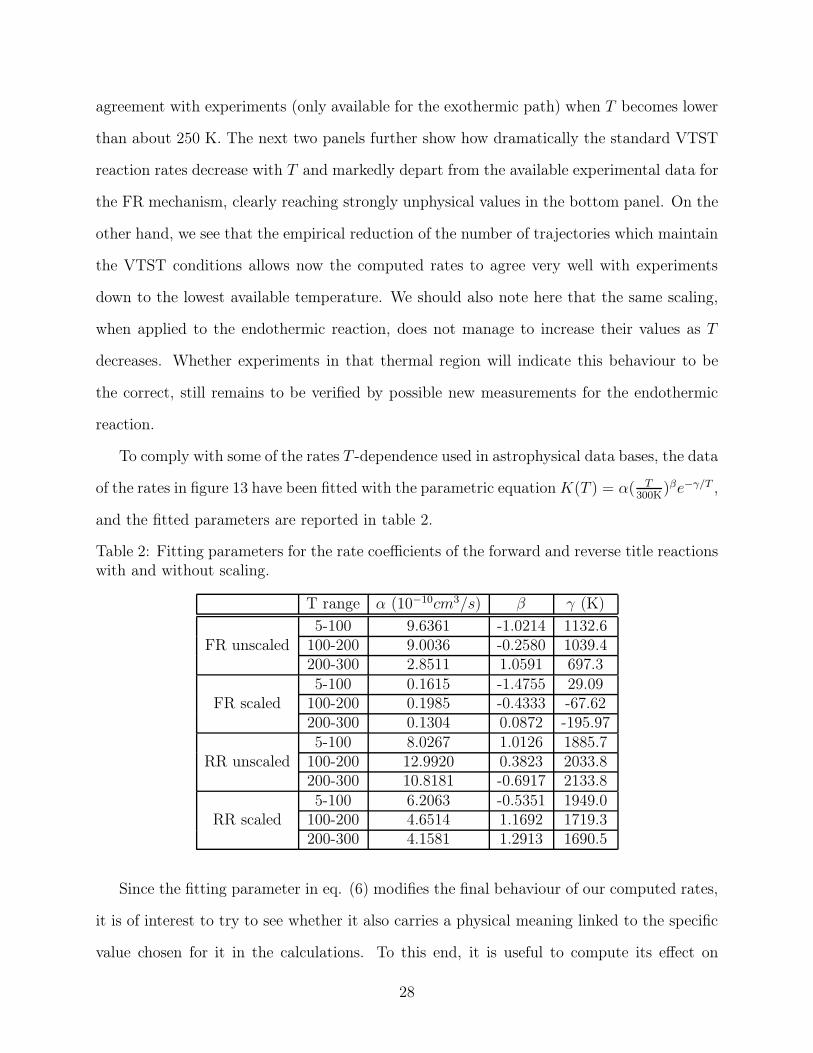
To comply with some of the rates T -dependence used in astrophysical data bases, the data
of the rates in figure 13 have been fitted with the parametric equation K(T ) = α( T300K
)βe−γ/T ,
and the fitted parameters are reported in table 2.
Table 2: Fitting parameters for the rate coefficients of the forward and reverse title reactionswith and without scaling.
T range α (10−10cm3/s) β γ (K)
FR unscaled5-100 9.6361 -1.0214 1132.6
100-200 9.0036 -0.2580 1039.4200-300 2.8511 1.0591 697.3
FR scaled5-100 0.1615 -1.4755 29.09
100-200 0.1985 -0.4333 -67.62200-300 0.1304 0.0872 -195.97
RR unscaled5-100 8.0267 1.0126 1885.7
100-200 12.9920 0.3823 2033.8200-300 10.8181 -0.6917 2133.8
RR scaled5-100 6.2063 -0.5351 1949.0
100-200 4.6514 1.1692 1719.3200-300 4.1581 1.2913 1690.5
Since the fitting parameter in eq. (6) modifies the final behaviour of our computed rates,
it is of interest to try to see whether it also carries a physical meaning linked to the specific
value chosen for it in the calculations. To this end, it is useful to compute its effect on
28
0 50 100 150 200 250 300T (K)
10-12
10-11
10-10
10-9
10-8
Rat
e co
effic
ient
(cm
3 /s)
Exp.Unscaledτ=3.0τ=4.0τ=5.0τ=5.3τ=6.0τ=7.0τ=8.0τ=9.0τ=10.0τ=15.0τ=20.0
Figure 14: Effect on the computed rates of changing the parameter τ over an ample range ofvalues. The dots refer to the experimental points from: (*)(Otto et al.)33 and (#) (Bohme)32.See main text for further details.
the computed rates when that parameter is made to vary over a large range of values. The
results of our computations are shown by figure 14 where the values of the parameter in eq.
(6) vary from 3.0 to 20.0, showing that the accord with the experimental data only exists
for parameter’s values around 5.0.
It is tempting to go further in our understanding of the role of the τ parameter by linking
it to a sort of effective temperature, Teff , and to the ∆ZPE quantity computed via eq. (4):
exp
[
−
(
τ + T
300K×
∆ZPE
KT
)]
= exp
(
−∆ZPE
KTeff
)
(8)
where we define:
Teff =300K× T
(τ + T )(9)
We can try to better understand the meaning of Teff by plotting its variation with the
29
0 10 20 30 40 50T (K)
50
100
150
200
250T
eff (
K)
τ=5.0τ=10.0τ=15.0τ=20.0
Figure 15: Computed behaviour of the Teff parameter as a function of the physical tem-perature for a selected set of τ values within the range of interest in the present study. Seemain text for further details.
physical temperature of the reaction bath for a different choice of the parameter τ as given
by the range shown in figure 15. We see that in the low temperature range the Teff indicates
that the reactive system partially heats the non-reactive modes for the reasons discussed
before (i.e. the TS spends more time along the MEP). Hence the Teff value has to be higher
than the actual physical temperature of the thermal bath formed by the reagent molecules.
As one moves to higher temperatures, however, we see that Teff essentially coincides with
the physical temperature of the reaction as the reaction progress correctly follows the MEP
trajectory and the process reaches a pseudo-canonical situation, matching its energy with
the Boltzmann’s value at room temperatures.
The results gathered by the numerical test of figure 15 indicate therefore that the pa-
rameter τ of eq. (6) basically controls the degree of IVR reached by the reactive system:
small values of the parameters go with an efficient energy exchanges between reactive and
30
non-reactive modes, which is typical of the lower temperatures for the present exothermic re-
action. On the other hand, larger τ values are associated with an inefficient energy exchange
of the reactants with the non-reactive modes (i.e. with the residual degrees of freedom of the
reagents), a feature associated here with the near-thermal temperatures where the agreement
of our calculations with the experiments do not require the scaling implied by introducing
the parameter τ in eq. (6). Thus, an efficient energy dissipation of the excess reaction energy
with the non-reactive modes (associated with a choice of a smallish value of τ < 5 K) forces
the computed rates to grow as the temperature decreases: the actual TS from the VTST
approach has to remain ’hot’ while the non-reactive modes heat with decreasing tempera-
ture. As the temperature increases and becomes closer to the thermal values, then the Teff
reaches the room temperature so that it forces the computed rates to decrease with the T of
the reagents since now the molecular partion functions of the reagents are at their maximum
value while the Q of the TS increases very slowly. Finally, the presence of only a partial
IVR effects of the TS is described by the intermediate range of τ values: 5K < τ ≤ 8K.
The computed rates first increase with temperature as the latter decreases from the thermal
value, but then begin to decrease with T down to the lower values which are shown by figure
14. It follows the experimental behaviour, thus indicating that at the lowest temperatures
accessed by the experiments the TS of the exothermic reaction only partially manages to be
accessed by the very cold reagents, thereby reducing the probability that the reaction would
occur, in agreement with what the experiments have shown.
Present conclusions
The work presented in the sections above has analyzed several computational aspects of the
title reaction, which is of potential interest for the chemical network of N-containing species
in molecular clouds and circumstellar envelopes. We have computed both the exothermic
reaction from the NH−2 + H2 reagents, which we have called the FR reaction path, and the
31
slightly endothermic reaction from the NH3 + H− as reagents, which we have called the
RR reaction path. Through an analysis of its ab initio features, we have characterized two
different regions of intermediate structures before the actual formation of a transition state,
the latter being below the reference energy of the reagents for the exothermic process and
only slightly above the reagents for the RR mechanism. One of the intermediate structures,
labelled Min1 in our work, is a sort of pseudo-minimum associated with the H2 molecular
partner bound to the NH2 molecule, on which most of the excess charge of the anionic
complex still resides. The second minimum structure, labelled here the Min2 complex, turns
out to be a true minimum and describes a structure located in the product region for the FR
path: the excess charge has now moved almost entirely onto one of the H atoms, forming a
complex between H− and the NH3, nearly neutral, molecule.
The existence of an embedded transition state structure along a barrierless path for the
exothermic reaction allowed us to model the latter by using the VTST approach, already
employed earlier to study ionic reactions in the ISM environments26,37. The current calcula-
tions show very good agreement between our VTST rates and the existing experimental data
at room temperature, reported by ref.32. However, once we extended the VTST approach to
lower temperatures down to about 8 K, the calculations produced much smaller rates than
those given by the experiment of Otto et al.33. The VTST-modelled rates, which are treated
as following the MEP when going down to sub-thermal conditions, are too rapidly decreasing
with the lowering of the reaction temperature. We then suggested a temperature-dependent
scaling procedure which links the room temperature rates to their experimental values but
increases the efficiency of the TS energy dissipation process into the non-reactive degrees of
freedom as T decreases. We thus found that, with such a scaling, we can reproduce very
accurately the experimental rates for the FR exothermic reaction down to the lowest mea-
sured T values around 8 K. The slightly endothermic RR process, however, is not greatly
modified by the present scaling and still indicates a rapid decrease of the endothermic rates
down to very low temperatures. No experimental data are available for the RR process for
32
comparison with our computed results.
In conclusion, we have shown that it is possible to modify in the low-T regimes the VTST
approach and carry out rate calculations for barrierless, exothermic reactions by introducing
a temperature-dependent factor defined in eqs. (6) and (9) as the factor τ , within the
reagents’ ZPE parameters. This parameter is further shown to regulate the efficiency of the
low-T energy dissipation of the TS structures within the increasingly colder reagents which
contain the non-reactive degrees of freedom that are coupled with the TS during the reactive
encounters as the physical temperature goes down well below room temperature. The role
of this parameter also explains why, as T becomes smaller, the experimental and computed
rates resume behaving as decreasing with temperature. Our analytic fitting of the final rates
provides here realistic extimates for the FR reaction rates at low temperatures. Our new
data could then be directly employed when modeling the evolution of the title molecules
within larger astrophysical chemical networks involving nitrogen-containing species1. At the
same time, the present study also provides a fairly detailed structural description of the
reaction paths and of the energetics involved when going from reagents to products along
both the reactions of the title systems.
Acknowledgments
F.A.G. and R.W. acknowledge the support by the Austrian Science Fund (FWF), Project
No. 29558-N36.
References
(1) Cheung, A. C.; Rank, D. M.; Townes, C. H.; Thornton, D. D.; Welch, W. J. Phys. Rev.
Lett. 1968, 21, 1701.
(2) Ho, P. T. P.; Townes, C. H. Annu. Rev. Astron. Astrophys. 1983, 21, 239.
33
(3) Maret, S.; Faure, A.; Scifoni, E.; Wiesenfeld, L. MNRAS 2009, 399, 425.
(4) Pagani, L.; Bacmann, A.; Cabrit, S.; Vastel, C. A&A 2007, 467, 179.
(5) Crapsi, A.; Caselli, P.; Walmsley, M. C.; Tafalla, M. A&A 2007, 470, 221.
(6) Thaddeus, P. Annu. Rev. Astron. Astrophys. 1972, 10, 305.
(7) Crutcher, R. M. Annu. Rev. Astron. Astrophys. 2012, 50, 29.
(8) Nieva, M.-F.; Przybilla, N. A&A 2012, 539, A143.
(9) Knauth, D. C.; Andersson, B.-G.; McCandliss, S. R.; Warren Moos, H. Nature 2004,
429, 636.
(10) Li, X.; Heays, A. N.; Visser, R.; et al., A&A 2013, 555, A14.
(11) Womack, M.; Ziurys, L. M.; Wyckoff, S. Astrophys. J. 1992, 393, 188.
(12) Maret, S.; Bergin, E. A.; Lada, C. J. Nature 2006, 442, 425.
(13) Hily-Blant, P.; Walmsley, M.; Pineau des Forêts, G.; Flower, D. A&A 2010, 513, A41.
(14) Daranlot, J.; Hincelin, U.; Bergeat, A.; et al., Proc. Nat. Ac. Sci. 2012, 109, 10233.
(15) Le Bourlot, J. A&A 1991, 242, 235.
(16) Dislaire, V.; Hily-Blant, P.; Faure, A.; et al., A&A 2012, 537, A20.
(17) Herbst, E.; Defrees, D. J.; McLean, A. D. Astrophys. J. 1987, 321, 898.
(18) Tielens, A. G. G. M.; Hagen, W. A&A 1982, 114, 245.
(19) D’ Hendecourt, L. B.; Allamandola, L. J.; Greenberg, J. M. A&A 1985, 152, 130.
(20) Charnley, S. B.; Rodgers, S. D. Astrophys. J. 2002, 569, L133.
34
(21) Hidaka, H.; Watanabe, M.; Kouchi, A.; Watanabe, N. Phys. Chem. Chem. Phys. 2011,
13, 15798.
(22) Bottinelli, S.; Boogert, A. C. A.; Bouwman, J.; et al., Astrophys. J. 2010, 718, 1100.
(23) Ceccarelli, C.; Bacmann, A.; Boogert, A.; et al., A&A 2010, 521, L22.
(24) Hily-Blant, P.; Maret, S.; Bacmann, A.; et al., A&A 2010, 521, L52.
(25) Persson, C. M.; De Luca, M.; Mookerjea, B.; et al., A&A 2012, 543, A145.
(26) Satta, M.; Gianturco, F. A.; Carelli, F.; Wester, R. Astrophys. J. 2015, 799, 228.
(27) Pilbratt, G.; Riedinger, J. R.; Passvogel, T.; et al., A&A 2010, 518, L1.
(28) Roelfsema, P. R.; Helmich, F. P.; Teyssier, D.; et al., A&A 2012, 537, A17.
(29) Persson, C. M.; De Luca, M.; Mookerjea, B.; et al., A&A 2012, 543, A145(Paper II).
(30) C.M. Persson, G. H. e. a., M. Hajigholi A&A 2014, 567, A130.
(31) Lakhmanskaya, O.; Simpson, M.; Murauer, S.; Markus, N.; Enders, E.; Kokoouline, V.;
Wester, R. Phys. Rev. Lett. 2018, 120, 253003–1.
(32) Bohme, D. K. Int. J. Mass Spectrom. 2000, 200, 97.
(33) Otto, R.; Mikosch, J.; Trippel, S.; Weidemueller, M.; Wester, R. Phys. Rev. Lett. 2008,
101, 063201.
(34) Frisch, M. J. et al. Gaussian 09, Revision D.01 2016,
(35) Hernandez Vera, M.; Yurtsever, E.; Wester, R.; Gianturco, F. A. J. Chem. Phys. 2018,
148, 184305.
(36) Fernandez-Ramos, A.; Miller, J. A.; Klippenstein, S. J.; Truhlar, D. J. Chem. Rev.
2006, 106, 4518.
35

(37) Gianturco, F. A.; Satta, M.; Yurtsever, E.; Wester, R. Astrophys. J. 2017, 850, 42.
(38) Popovas, A.; Jorgensen, U. G. A&A 2016, 595, A131.
36