Embed Size (px)
Citation preview

`
QAS/14.598
Supplement 8
WHO Vaccine
Temperature mapping of storage areas
Technical supplement to
WHO Technical Report Series, No. 961, 2011
Annex 9: Model guidance for the storage and transport of time and
temperature–sensitive pharmaceutical products
August 2014
© World Health Organization 2014
WHO Press, World Health Organization, 20 Avenue Appia, 1211 Geneva 27, Switzerland (tel.: +41 22 791 3264; fax: +41 22 791 4857; e-mail: [email protected]). Requests for permission to reproduce or translate WHO publications – whether for sale or for noncommercial distribution – should be addressed to WHO Press, at the above address (fax: +41 22 791 4806; e-
mail: [email protected]).
The designations employed and the presentation of the material in this publication do not imply the expression of any opinion whatsoever on the part of the World Health Organization concerning the legal status of any country, territory, city or area or of its authorities, or concerning the delimitation of its frontiers or boundaries. Dotted lines on maps represent
approximate border lines for which there may not yet be full agreement.
The mention of specific companies or of certain manufacturers’ products does not imply that they are endorsed or recommended by the World Health Organization in preference to others of a similar nature that are not mentioned. Errors
and omissions excepted, the names of proprietary products are distinguished by initial capital letters.
All reasonable precautions have been taken by the World Health Organization to verify the information contained in this publication. However, the published material is being distributed without warranty of any kind, either expressed or

`
implied. The responsibility for the interpretation and use of the material lies with the reader. In no event shall the World Health Organization be liable for damages arising from its use. The named authors alone are responsible for the views
expressed in this publication.

Technical Supplement: Temperature mapping of storage areas 1
Acknowledgments
The author of this document is Jean Bédard, President & Chief Executive Officer, Infitrak
Inc.

Technical Supplement: Temperature mapping of storage areas 2
Contents
Acknowledgments ................................................................................................................................ 1
Contents ................................................................................................................................................... 2
Abbreviations ........................................................................................................................................ 3
Glossary ................................................................................................................................................... 4
1. Introduction .................................................................................................................................. 6
1.1 Requirements ...................................................................................................................................... 6
1.2 Objectives.............................................................................................................................................. 7
1.3 Target readership .............................................................................................................................. 7
2. Guidance ......................................................................................................................................... 8
2.1 Associated materials and equipment ........................................................................................ 8
2.2 The mapping protocol ..................................................................................................................... 9
2.2.1 Approval page and change control history: .............................................................................. 9
2.2.2 Acronyms and glossary:................................................................................................................... 10
2.2.3 Description and rationale .............................................................................................................. 10
2.2.4 Scope: ....................................................................................................................................................... 10
2.2.5 Objectives: .............................................................................................................................................. 10
2.2.6 Methodology ......................................................................................................................................... 11
2.2.7 Mapping report template ............................................................................................................... 15
2.3 Conducting the mapping exercise ............................................................................................ 15
2.4 Analyzing the data and preparing the mapping report ................................................... 16
2.4.1 Preliminary analysis ......................................................................................................................... 16
2.4.2 Minimum and maximum temperatures and hot and cold spots .................................. 16
2.4.3 Mean temperatures ........................................................................................................................... 17
2.4.4 Interpreting the results and making recommendations .................................................. 18
2.4.5 Report auditing ................................................................................................................................... 19
2.5 Implementing the mapping report recommendations .................................................... 19
References.................................................................................................................................................... 20
Annex 1 – Test data sheets .............................................................................................................. 21
A1.1 Test data sheet: temperature data logger locations ........................................................ 21
A1.2 Test data sheet: temperature distribution ........................................................................... 22
A1.3 Test data sheet: temperature distribution ........................................................................... 23
Revision history .................................................................................................................................. 24

Technical Supplement: Temperature mapping of storage areas 3
Abbreviations
3PL Third Party Logistics (provider)
CAPA Corrective and Preventive Action (procedures)
EDLM Electronic Data Logging Monitor
GMP Good Manufacturing Practice
IQ Installation Qualification
NIST National Institute of Standards and Technology (US)
SLA Service Level Agreement
SOP Standard Operating Procedure
EDLM Electronic Data Logging Monitor
TTSPP Time and Temperature-Sensitive Pharmaceutical Product

Technical Supplement: Temperature mapping of storage areas 4
Glossary
Component: Any major piece, part or assembly of the main equipment or sub-equipment
that does not have its own power supply and could not operate as a standalone unit
(valves, switches, etc.).
Controller: A device that interprets a mechanical, digital or analogue signal, generated by
a sensor, to control an equipment or component.
Deviation: For IQ: Any discrepancy between the installation specifications and the actual
(as found) installation. For OQ: Any discrepancy between the protocol and the actual
performed test, test function methodology, testing equipment, testing material etc.
Electronic Data Logging Monitor (EDLM): A small portable device that measures and
stores temperature at pre-determined time intervals by means of an electronic sensor.
They have programmable alarm capabilities, integrated displays, and can create reports
and graphs which may be permanently stored, shared and analysed via proprietary
hardware, software, desktop application or through hosted databases.
Installation qualification (IQ): The process of obtaining and documenting evidence that
the premises, equipment and supporting systems have been provided and installed in
compliance with their design specifications.
Instrument: A device that interprets a mechanical, digital or analogue signal generated by
a sensor, and converts it into engineering units (°C, % RH, mA, etc.) through scaling.
Key Operating Parameters: parameters that must be maintained in order to process or
produce products with consistent quality attributes and those that may have an impact on
the proper operation of the equipment.
Main equipment: Major equipment to be qualified.
Mapping: Documented measurement of the temperature and/or relative humidity
distribution within a storage area, including identification of hot and cold spots.
Operational qualification (OQ): The process of obtaining and documenting evidence,
under controlled conditions, that the premises, equipment and supporting systems
operate in accordance with their design specifications.
Performance qualification (PQ): The process of obtaining and documenting evidence
that the premises, equipment and supporting systems, as connected together, will
consistently perform in accordance with the approved process method and specifications.
Pharmaceutical product: Any product intended for human use or veterinary product
intended for administration to food producing animals, presented in its finished dosage
form, that is subject to control by pharmaceutical legislation in either the exporting or the
importing state and includes products for which a prescription is required, products
which may be sold to patients without a prescription, biologicals and vaccines. Medical
devices are not included1.
Refrigeration equipment: The term ‘refrigeration’ or ‘refrigeration equipment’ means
any equipment whose purpose is to lower air and product temperatures and/or to control
relative humidity.
1 Definition from WHO/QAS/08.252 Rev 1 Sept 2009. Proposal for revision of WHO good distribution practices for pharmaceutical products – Draft for comments.

Technical Supplement: Temperature mapping of storage areas 5
Sensor: A mechanical device (pressure switch, bimetal temperature switch, etc.), or a
digital or analogue transducer (limit switch, pressure sensor, temperature sensor, etc.)
that generates a mechanical or electrical signal to an instrument or a controller in order to
be interpreted.
Service Level Agreement (SLA): A service level agreement or contract is a negotiated
agreement between the customer and service provider that defines the common
understanding about materials or service quality specifications, responsibilities,
guarantees and communication mechanisms. It can either be legally binding, or an
information agreement. The SLA may also specify the target and minimum level
performance, operation or other service attributes2.
Standard Operating Procedure (SOP): A set of instructions having the force of a
directive, covering those features of operations that lend themselves to a definite or
standardized procedure without loss of effectiveness. Standard operating policies and
procedures can be effective catalysts to drive performance improvement and improve
organizational results.
Storage temperature: The temperature range listed on the TTSPP label, and within the
regulatory filings, for long-term storage.
Temperature-controlled: Includes any environment in which the temperature is actively
or passively controlled at a level different from that of the surrounding environment
within precise pre-defined limits.
Time and temperature sensitive pharmaceutical product (TTSPP): Any
pharmaceutical good or product which, when not stored or transported within pre-
defined environmental conditions and/or within pre-defined time limits, is degraded to
the extent that it no longer performs as originally intended.
Validation: Documented testing performed under highly controlled conditions,
demonstrating that processes, methods, and systems consistently produce results meeting
pre-determined acceptance criteria.3
2 Definition from IATA. 2013/2014 Perishable Cargo Regulations (ePCR) & Temperature Control Regulations (eTCR) 3 PDA Technical Report No. 39: Guidance for Temperature Controlled Medicinal Products: Maintaining the Quality of Temperature-Sensitive Medicinal Products through the Transportation Environment, 2007.

Technical Supplement: Temperature mapping of storage areas 6
1. Introduction
This technical supplement has been written to amplify the recommendations given in
Section 4.7 of WHO Technical Report Series No. 961, 2011, Annex 9: Model guidance for the
storage and transport of time- and temperature-sensitive pharmaceutical products4. The
purpose of a temperature mapping study is to document and control the temperature
distribution within a storage area.
This document describes how to carry out a systematic mapping procedure in any cold
room, freezer rooms or other temperature-controlled store. It does not cover mapping of
small scale cold chain equipment such as refrigerators of freezers. Generally speaking,
these products are independently tested and prequalified for the storage of TTSPPs,
although it is still important that the equipment is correctly installed and operated5.
The following Technical Supplements are also relevant:
Checking the accuracy of temperature control and monitoring devices.
Qualification of temperature-controlled road vehicles.
Qualification of temperature-controlled storage areas.
Temperature and humidity monitoring systems for transport operations.
1.1 Requirements
All new temperature-controlled storage areas must be temperature-mapped as part of a
fully documented verification process, before the installation is commissioned and handed
over by the installer. Until this has been done, it is not safe to store TTSPPs in such areas.
The temperature mapping procedures should:
Demonstrate the air temperature profile throughout the storage area, when empty
and in a normal loaded condition;
Define zones which should not be used for storage of TTSPPs (for example areas in
close proximity to cooling coils, cold air streams or heat sources); and
If required, demonstrate the time taken for temperatures to exceed the designated
limits in the event of power failure.
Depending upon the routine monitoring strategy, subsequent mapping exercises may also
be required on a periodic basis – for example, every three years – in order to demonstrate
continuing compliance. In situations where multiple fixed monitors provide continuous
data, a periodic re-evaluation which assesses all aspects of system performance since
initial mapping may instead be appropriate. In addition mapping should be carried out
whenever significant modifications are made to the store. Examples include changes in the
pattern of use that may increase loading or affect air circulation, or changes to the
refrigeration equipment, such as an alteration to the set point. Finally a re-mapping
exercise may be justified whenever an analysis of temperature and/or humidity
monitoring records show unexplained variability outside normal operating limits.
All mapping exercises should be fully documented in order to demonstrate compliance to
management, clients and the regulatory authorities.
4 http://apps.who.int/medicinedocs/documents/s18683en/s18683en.pdf 5 See for example: http://apps.who.int/immunization_standards/vaccine_quality/pqs_catalogue/
Technical Supplement: Temperature mapping of storage areas 7
1.2 Objectives
The objective of the Technical Supplement is to provide clear guidance on how to conduct
a temperature mapping study in a temperature-controlled storage area. This guidance
applies to any space designed for long-term or short-term storage of TTSPPs or other
temperature-sensitive products.
1.3 Target readership
This document is relevant to wholesalers, warehouse operators, distributors, dispatchers
and 3PLs who store and distribute TTSPPs. The specific target audience within these
organizations includes those who have direct responsibility for quality management, for
example, Quality Assurance (QA) Managers and Operations Managers.

Technical Supplement: Temperature mapping of storage areas 8
2. Guidance
A temperature mapping exercise is required for any space allocated for the storage and
handling of products with a specified labelled storage temperature. This includes freezer
rooms, cold rooms, temperature-controlled storage areas, quarantine areas and receiving
and loading bays. It may also include laboratories. The permitted temperature ranges in
these areas will vary – for example: -25.0°C to -10.0°C, 2.0°C to 8.0°C, 15.0°C to 25.0°C, etc.
Temperature mapping may also need to be carried out in spaces without active
temperature control.
A mapping study establishes the temperature distribution within the zone being mapped
and it locates hot and cold spots. The collected data provides an essential source of
information to ensure that all TTSPPs are correctly stored within their labelled
temperature range(s). Mapping may also be used to identify zones where remedial action
needs to be taken; for example by altering existing air distribution to eliminate hot and
cold spots, or by retro-fitting new air distribution equipment to reduce temperature
stratification in high-bay warehouses6 .
A temperature mapping exercise involves a four stage process, as follows:
a. Prepare a mapping protocol.
b. Carry out the mapping exercise.
c. Prepare a mapping report.
d. Implement the recommendations by carrying out the remedial and other actions
identified in the mapping report. A follow-up mapping exercise may then be
needed to verify the effectiveness of the remedial actions.
2.1 Associated materials and equipment
A mapping operation requires a sufficient number of Electronic Data Logging Monitors
(EDLMs) to ensure that the temperature distribution in the space to be mapped is
adequately characterized. In addition, suitable computer equipment and software is
needed to store and analyse the data. The selected EDLMs must:
Be technically suitable for the specific mapping task and for the intended operating
environment;
Provide a reliable and continuous reliable record of time-temperature data;
Have an appropriate temperature range so that all anticipated temperature
extremes can be recorded (e.g. from -30°C to +60°C)
Have a user-programmable data sampling period, allowing time intervals to be set
in the range from one minute to 15 minutes (maximum) and with sufficient
memory for the intended length of the study and the chosen recording interval;
Have a NIST- traceable 3-point calibration certificate with a guaranteed error of no
more than ± 0.5°C at each calibration point.
Allow the recorded time-temperature data to be downloaded to a computer
system for subsequent analysis;
6 High bay pallet racking stores are particularly susceptible to temperature stratification. It is essential that such stores are comprehensively mapped over their full working height.
Technical Supplement: Temperature mapping of storage areas 9
Have data storage and analytical software that complies with applicable regulatory
requirements (for example: 21 CFR part 11)7,8,9.
2.2 The mapping protocol
A detailed and comprehensive protocol should be prepared, reviewed and approved
before the mapping exercise begins. A well-designed protocol will help ensure that the
mapping study is correctly carried out. With suitable adjustments or options to cover the
full range of temperature regimes, a standard protocol can be used to map any storage
area in the facility.
The mapping protocol should contain the following sections:
a. Approval page and change control history.
b. Acronyms and glossary.
c. Description and rationale.
d. Scope
e. Objectives.
f. Methodology
g. Mapping report template.
h. Annexes as needed, including templates for the mapping report
The content of each of these sections is detailed below.
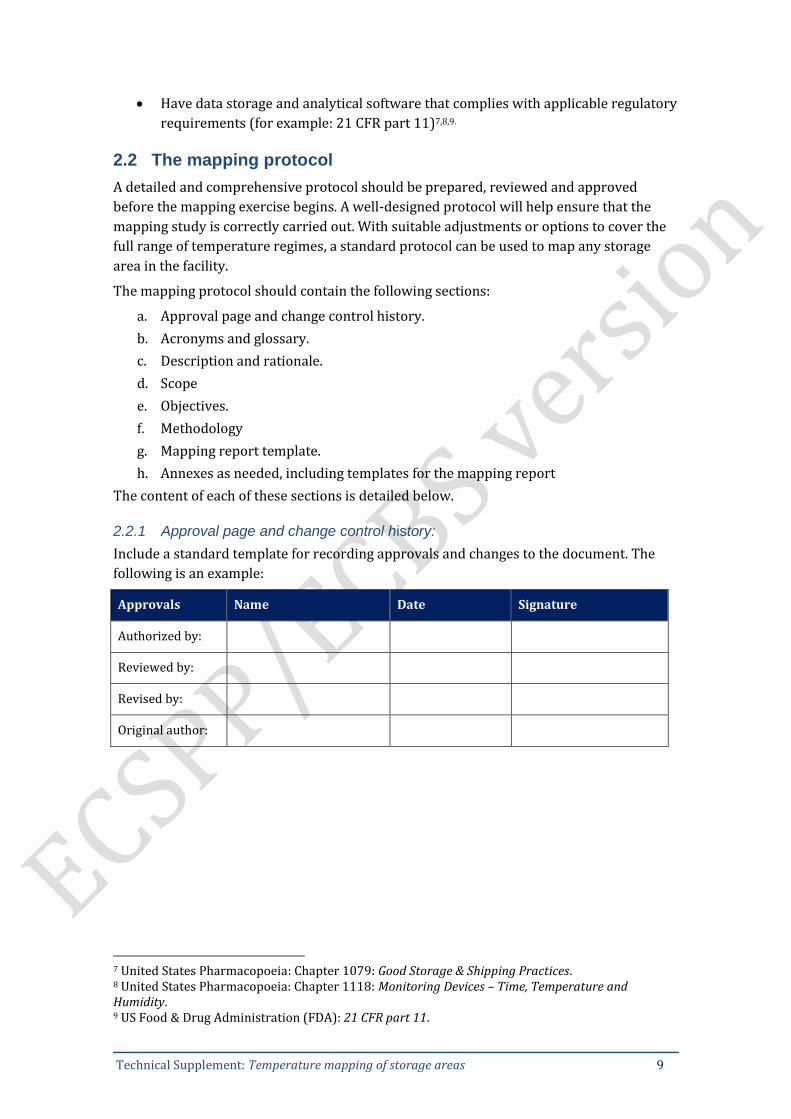
2.2.1 Approval page and change control history:
Include a standard template for recording approvals and changes to the document. The
following is an example:
Approvals Name Date Signature
Authorized by:
Reviewed by:
Revised by:
Original author:
7 United States Pharmacopoeia: Chapter 1079: Good Storage & Shipping Practices. 8 United States Pharmacopoeia: Chapter 1118: Monitoring Devices – Time, Temperature and Humidity. 9 US Food & Drug Administration (FDA): 21 CFR part 11.

Technical Supplement: Temperature mapping of storage areas 10
Version history
No Date Description of change Reason for change
1 Original
2
3
4
5
If the protocol has been prepared by a qualified third-party, it should be authorized by the
responsible person within the commissioning organization.
2.2.2 Acronyms and glossary:
Define the acronyms and technical terms used in the protocol.
2.2.3 Description and rationale
Describe the installation to be mapped and outline the reasons for carrying out the
exercise.
2.2.4 Scope:
Clearly define the scope and purpose of the mapping study. The fundamental purpose is to
identify temperature deviations affecting the chosen storage area(s) at the time the study
is being conducted, so that remedial action can be taken.
Depending upon the circumstances, a temperature mapping study may be carried out in
an empty storage area – for example during Operational Qualification of a new cold room –
or in a storage area where TTSPPs are already being kept – for example after alterations
have been carried out in an existing cold room. See Technical Supplement: Qualification of
temperature-controlled storage areas.
If storage areas are affected by seasonal temperature variations, at least two temperature
mapping studies may need to be carried out in each area in order to observe the effect of
seasonal variation. Typically, one should be carried out during the warmest season and
one during the coldest season because this will represent the worst-case scenario. This
will establish whether the mapped area is able to maintain stable temperatures
throughout the year. Typically, two season mapping is not necessary for cold rooms and
freezer rooms.
The results of the two studies can be compared so that systematic seasonally-related
issues can be identified. These seasonal effects need to be separated out from any other
site-specific issues arising at the times when the comparative studies are carried out.
2.2.5 Objectives:
Clearly define the detailed objectives of the study, as follows:
Mapping temperature variations within the selected storage areas. Typically these
areas include freezer rooms, cold rooms and warehouses. Packing areas, loading
bays and other areas in which temperature sensitive products are stored, or are

Technical Supplement: Temperature mapping of storage areas 11
temporarily held when in transit may also be mapped and monitored, although
temperatures in these areas are likely to fluctuate when doors are opened.
Measuring temperature variations at each location within the chose area, by day of
the week, and time of day.
Documenting high and low temperature fluctuations caused by the environmental
control systems operating at the time of the study – for example, heating, cooling
and ventilation.
Identifying potential airflow issues that may be the cause of temperature
variations.
Recommending where TTSPS can safely be stored in the mapped area and where
they must not be stored. These recommendations should take account of any
temperature deviations identified during the study as well as the approved
temperature range(s) for the products being stored in the area.
Identifying the best places to locate temperature sensors, for routine monitoring,
in circumstances in which a monitoring system is installed. If a monitoring is
already installed, identify the best places to re-locate temperature sensors (if
necessary).
Making recommendations for any remedial actions needed to overcome the
problems identified in the study.
2.2.6 Methodology
The following steps outline the methodology for conducting a temperature mapping study.
It is important to note that Steps 1 to 5 must be completed before the mapping protocol
can finally be approved.
STEP 1 – select EDLMs: Select the type of EDLM to be used. Choose a device that has
sufficient memory for the intended duration of the study and the selected recording
interval. As noted in Section 1.4, all loggers must have a NIST- traceable 3-point calibration
completed and valid (within the current year), and have an error of no more than ± 0.5°C
at each calibration point. Valid calibration certificates for each of the data loggers used in
the study must be included in the mapping report. Some EDLMs with built-in batteries and
a limited life are not designed to be re-calibrated; otherwise calibration should be done
annually.
Calibration temperature points used for the calibration of EDLMs should cover the
required temperature range for each of the areas being studied. In general there should be
one calibration point below the low end of the range, one calibration point in the middle of
the range, and one calibration point above the high end of the range.
To ensure consistency, use only one type of device per mapping study. Provide a link to
the manufacturer’s user instructions so that those responsible for programming and
reading the devices understand how to perform these actions correctly.
It may be appropriate to include an EDLM device that is able to monitor door openings,
programmed so that the readings on the temperature monitoring devices can be aligned
with door opening times.
STEP 2 – designate the mapping team: Identify and list the team members. Record their
signatures and initials so that signed records can be traced back to the person who
Technical Supplement: Temperature mapping of storage areas 12
prepared the document. Ensure that all team members receive the training needed to
perform their assigned tasks.
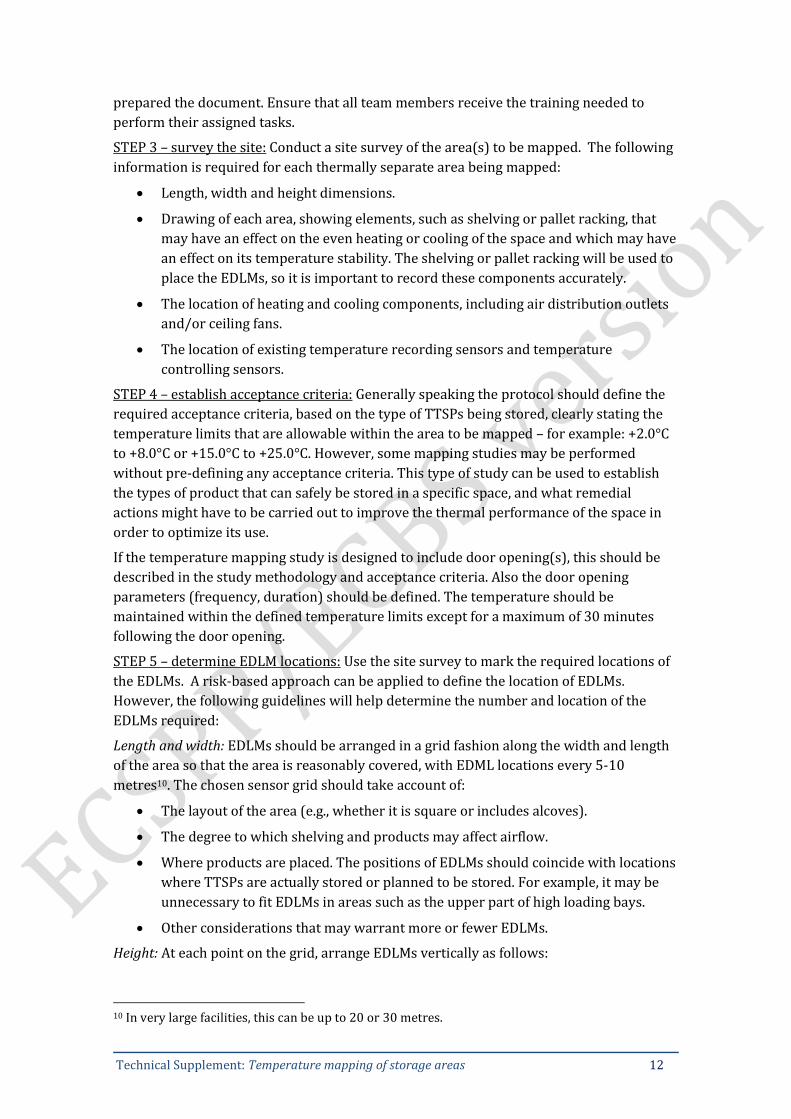
STEP 3 – survey the site: Conduct a site survey of the area(s) to be mapped. The following
information is required for each thermally separate area being mapped:
Length, width and height dimensions.
Drawing of each area, showing elements, such as shelving or pallet racking, that
may have an effect on the even heating or cooling of the space and which may have
an effect on its temperature stability. The shelving or pallet racking will be used to
place the EDLMs, so it is important to record these components accurately.
The location of heating and cooling components, including air distribution outlets
and/or ceiling fans.
The location of existing temperature recording sensors and temperature
controlling sensors.
STEP 4 – establish acceptance criteria: Generally speaking the protocol should define the
required acceptance criteria, based on the type of TTSPs being stored, clearly stating the
temperature limits that are allowable within the area to be mapped – for example: +2.0°C
to +8.0°C or +15.0°C to +25.0°C. However, some mapping studies may be performed
without pre-defining any acceptance criteria. This type of study can be used to establish
the types of product that can safely be stored in a specific space, and what remedial
actions might have to be carried out to improve the thermal performance of the space in
order to optimize its use.
If the temperature mapping study is designed to include door opening(s), this should be
described in the study methodology and acceptance criteria. Also the door opening
parameters (frequency, duration) should be defined. The temperature should be
maintained within the defined temperature limits except for a maximum of 30 minutes
following the door opening.
STEP 5 – determine EDLM locations: Use the site survey to mark the required locations of
the EDLMs. A risk-based approach can be applied to define the location of EDLMs.
However, the following guidelines will help determine the number and location of the
EDLMs required:
Length and width: EDLMs should be arranged in a grid fashion along the width and length
of the area so that the area is reasonably covered, with EDML locations every 5-10
metres10. The chosen sensor grid should take account of:
The layout of the area (e.g., whether it is square or includes alcoves).
The degree to which shelving and products may affect airflow.
Where products are placed. The positions of EDLMs should coincide with locations
where TTSPs are actually stored or planned to be stored. For example, it may be
unnecessary to fit EDLMs in areas such as the upper part of high loading bays.
Other considerations that may warrant more or fewer EDLMs.
Height: At each point on the grid, arrange EDLMs vertically as follows:
10 In very large facilities, this can be up to 20 or 30 metres.

Technical Supplement: Temperature mapping of storage areas 13
If the ceiling height is 3.6 metres or less, position EDLMs directly above one
another at high medium and low level (e.g. one EDLM at floor level, 1.2 metres and
one EDLM at 3.0 metres.
If the ceiling height is greater than 3.6 metres, EDLMs can be arranged in vertical
arrays at the bottom, middle (multiple) and top of the space. For instance, for a
storage area six metres in height, EDMLs can be positioned in each grid location
heights of 0.3 metres, 1.8 metres, 3.6 metres and 5.4 metres.
Give each logger location a unique ID. It may be helpful to use a generic floor plan or
diagram to decide where each logger should be positioned – see Figures 1 and 2. Figure 1
shows part of a pallet racking cold room with and adjoining temperature-controlled
packing area. Figure 2 shows a small walk-in cold room with products stored on shelves –
the shelves (on which the EDLMs should be placed) have been omitted for clarity. The. If
products are also stored on pallets in the centre of the room, additional EDLMs should be
placed in this location.
Figure 1 – Typical location of data loggers in a pallet racking storage area
Figure 2 – Typical location of data loggers in a walk-in cold room

Technical Supplement: Temperature mapping of storage areas 14
STEP 6 – record EDLM, monitoring sensors and thermostat locations: Record the EDLM
locations on a temperature data logger location table - see example in Annex 1.1. Also
record the location identification and set point for each thermostat in the storage area -
see example in Annex 1.2.
STEP 7 – label and program the EDLMs: Label each EDLM with a unique ID, taken from the
temperature data logger location table. Enter the manufacturer’s serial number on the
temperature data logger location table (Annex 1.1). Recording the serial number ensures
that the device can be traced to its calibration certificate. Program each device, ensuring
that the recording interval is the same – typically this should be set between one and 15
minutes. Set the same start time for all units. This is essential; otherwise the downloaded
readings from the individual devices cannot be time-correlated. Make sure that the start
time setting gives you enough time to fix all the units in position before recording begins.
STEP 8 – fix EDLMs in position: Fix the EDLMs in position. Make sure that each one is
placed exactly as shown on the temperature data logger location table and drawing.
Position and fasten the devices so that they cannot be damaged or displaced during the
course of routine store operations. Ensure that sufficient time is allowed for the EDLMs to
be conditioned to the ambient temperature before the mapping exercise begins.
STEP 9 – conduct the mapping exercise: There is no formal time limit for a mapping study.
Typically, for warehouses and other ambient storage areas, it should be run for a
minimum of seven consecutive days – including five working days and two weekend days.
For temperature-controlled equipment which is not critically affected by diurnal or
seasonal variations in ambient temperature (e.g. freezer rooms and cold rooms), the
mapping study should be run for between 24 and 72 hours, or more if justified. If the room
is fitted with duplicate refrigeration units – with or without automatic changeover – it is

Technical Supplement: Temperature mapping of storage areas 15
essential to map temperatures over a period that includes the operation of both units
running separately; preferably for a similar time period. The temperature distribution in
the room may vary depending upon which system is running11.
At the end of the study, collect the EDLMs and double-check their serial numbers and
locations against the installation notes.
STEP 10 – download and consolidate the data: Download the EDLM readings and
consolidate the data for the study analysis described in Section 2.4.
2.2.7 Mapping report template
The mapping report should include the following sections:
a. Introduction: a description of the objectives of the mapping study.
b. Summary: a summary and discussion of the results organized in the sequence set
out in the mapping protocol, including a summary of deviations (if any).
c. Conclusions and recommendations: a general conclusion for all verifications and
observations indicating the acceptability of the equipment for operation.
Recommendations and remarks can be incorporated as well.
d. Report annexes: The report annexes should contain the following:
− The site survey, showing EDLM locations.
− The raw data, presented using the appropriate test data sheet format - see
Annex 1.
− Spreadsheet data and related temperature graphs for every EDLM used in the
mapping exercise.
− Raw results of the data analysis, including hot and cold spots.
− Key documents and notes prepared during the mapping exercise, together with
any other supporting material.
− Deviation reports, including Corrective and Preventive Actions (CAPA) forms, if
required. This may include a recommendation for partial or total re-mapping.
− Calibration certificates for all EDLMs used.
2.3 Conducting the mapping exercise
Conduct the mapping exercise in accordance with the protocol. Ensure that all relevant
personnel in the store are fully briefed so as to avoid inadvertent disruption or
deactivation of the EDLMs. At the end of the study period, collect all the devices, deactivate
them, and download the data for analysis.
If the mapping exercise does not include automatic logging of door openings, an access log
should be kept during the study so that any temperature excursions caused by personnel
movement can easily be identified. Power outages should similarly be recorded.
11 Duplicate units are sometimes set up so that one system runs most of the time and the other only cuts in at a higher temperature. This ensures that the second unit runs infrequently and therefore reduces the chances of a simultaneous breakdown.

Technical Supplement: Temperature mapping of storage areas 16
2.4 Analyzing the data and preparing the mapping report
The mapping report should follow the general framework outlined in Section 2.2.7. The
following sub-sections outline the data analysis process that precedes the writing of the
report.
2.4.1 Preliminary analysis
Analyse the overall temperature stability of the study area and identify the variations that
occur. Compare the measured temperatures against the acceptance criteria. The analysis
of the overall temperature stability should consider factors such as:
The ability of the environmental control systems to maintain temperatures within
the acceptance criteria limits (if any).
The overall temperature stability of the area being monitored, and the range in
fluctuations it experiences over the study period.
The analysis of temperature variations should consider factors such as:
Variations experienced by individual EDLMs.
Temperature variations along vertical and horizontal planes, depending on the size
of the area, and distribution of EDLMs.
Temperature variations in locations close to heating and cooling components, as
compared to those farthest away from these units
2.4.2 Minimum and maximum temperatures and hot and cold spots
A mapping study measures temperature fluctuations. From these data, the analyst can
identify the minimum and maximum temperatures that occur in the mapped area during
the study period.
Minimum temperature refers to the lowest temperature value recorded in the mapped
space over the study period; maximum temperature refers to the highest value recorded
during the same period. Either or both of these temperatures may be outside the specified
acceptance criteria for the store. Annex 1.3 shows a standard form that can be used to
record these data, together with the mean values discussed in Section 2.4.4.
A cold spot refers to the lowest temperature value(s) recorded in the space over the study
period, but with these lowest temperature value(s) remaining within the specified
temperature range (e.g. cold spots identified between +15.0°C to +17.5°C in a room with a
specified temperature range +15.0°C to +25.0°C).
A hot spot refers to the highest temperature value(s) recorded in the studied area over the
study period, but with these highest temperature value(s) remaining within the specified
temperature range (e.g. hot spots identified between +23.0°C to +25.0°C in a room with a
specified temperature range +15.0°C to +25.0°C).
The purpose of determining hot and cold spots is to identify the locations where the
monitoring system sensors should preferentially be located. Hot and cold spots need to be
determined seasonally as they may be significantly different in summer and in winter.
Note: It is also important to look at the overall high and low trends rather than just the
highest and lowest temperatures. Average values can be useful to help confirm true hot
and cold spots.

Technical Supplement: Temperature mapping of storage areas 17
2.4.3 Mean temperatures
Arithmetic mean temperatures can be applied to each of the separate areas being
monitored over the study period. These mean temperature measurements can be useful in
storage areas where the temperature fluctuates with time in a repetitive pattern (e.g.
sinusoidal fluctuation, periodic peak occurrence…) and where the temperature also varies
depending upon the data logger location.
The use of mean temperatures enables the analyst to determine a mean temperature for a
given EDLM location over the study period. These figures can then be compared between
all the EDLM locations within the space. This enables the analyst to identify the locations
where the mean temperatures are consistently lower or higher, an exercise which cannot
be achieved simply by comparing individual data points.
In Figure 1, the minimum and maximum temperatures have been calculated from the data
points for two locations (EDLM-1 and EDLM-2). The plot shows that the EDLM-2 location
is clearly cooler on average, although there are clearly times when the two locations
experience similar low and high temperatures.
Despite the usefulness of mean figures, it is essential not to disregard the actual
temperature data; these figures reveal the occurrence of temperatures that are outside the
specified storage temperature range.

Technical Supplement: Temperature mapping of storage areas 18
Figure 3 – Use of mean temperatures
2.4.4 Interpreting the results and making recommendations
This section outlines how to interpret the results, and how to use these results to support
the report’s recommendations:
Document the internal temperature variations observed within the space, taking
account of the EDLM reading errors specified by the device manufacturer.
Use the data analysis to assess the overall temperature stability of the mapped
space in relation to the stated acceptance criteria (if any).

Technical Supplement: Temperature mapping of storage areas 19
Assess the overall thermal stability of the space during the study period with
specific reference to the high and low temperatures experienced12.
List the factors that explain the observed temperature variations. For example, the
location of the heating and cooling components and doors.
Assess consistent and inconsistent temperature variations, and fluctuations, within
the space in terms of their potential impact on product storage.
Based on the observed temperature fluctuations of mapped locations within the
space, make recommendations about the optimum storage locations for highly
sensitive products, and those that are less sensitive.
Based on the observed temperature fluctuations of mapped locations within the
space, make recommendations on the optimum location of the temperature
sensor(s) used for routine temperature monitoring and the control sensors used to
activate the heating and cooling systems.
2.4.5 Report auditing
The report content, including data sheets, results, spreadsheets and graphs should be
audited and peer-reviewed by a competent independent person. The reviewer should
confirm, approve and sign the major reported test and verification results and the
recommendations arising from these results. If the report has been prepared by a qualified
third-party, it should be approved by the person who commissioned the study.
2.5 Implementing the mapping report recommendations
The final outcome and purpose of a mapping exercise is the implementation of the report
recommendations. A detailed discussion of implementation is outside the scope of this
document, but it could include any of the following outcomes:
A drawing or diagram showing where TTSPPs can safely be stored in the space
that has been mapped. It is possible that there may be some zoning involved. For
example, products which are not affected by freezing could be allocated to parts of
a cold room where the mapping study has shown some freezing risk.
Allocation of pallet bays to specific categories of TTSPP on the warehouse
management system in order to control where stocks are positioned.
Re-positioning of temperature monitoring sensors and/or environmental control
sensors.
Adjustment of air outlets to reduce temperature stratification and/or minimize
cold and hot spots.
Upgrading of mechanical systems to improve temperature control and
performance.
A decision to use the space for other purposes because it is unsuitable for storage
of TTSPPs.
12 Thermal stability will be affected by three main factors: the external ambient temperature; the type of building construction and the performance of the heating/cooling system. The first two factors are less significant for freezer rooms and cold rooms built inside an existing structure.

Technical Supplement: Temperature mapping of storage areas 20
References
Health Canada (HPFB Inspectorate): Guide 0069: Guidelines for temperature
Control of Drug Products during Storage and Transportation. October 17, 2005.
http://www.rxcritical.ca/pdf/Guide-0069.pdf
IATA. 2013/2014 Perishable Cargo Regulations (ePCR) & Temperature Control Regulations (eTCR) http://www.iata.org/publications/Pages/temperature-control-regulations.aspx
PDA Technical Report No. 39: Guidance for Temperature Controlled Medicinal Products: Maintaining the Quality of Temperature-Sensitive Medicinal Products through the Transportation Environment. Parenteral Drug Association. 2007. https://store.pda.org/ProductCatalog/Product.aspx?ID=1270
United States Pharmaceopaedia: Chapter 1079: Good Storage & Shipping Practices.
https://mc.usp.org/sites/default/files/documents/GeneralChapterPDFs/c1079%
20USP36.pdf
United States Pharmaceopaedia: Chapter 1118: Monitoring Devices – Time,
Temperature and Humidity.
http://www.pharmacopeia.cn/v29240/usp29nf24s0_c1118.html
US Food and Drug Administration. Title 21--Food and Drugs. Chapter I--Food and
Drug administration Department of Health and Human Services. Subchapter A—
General. Part 11 Electronic Records; Electronic Signatures 21 CFR Part 11
http://www.accessdata.fda.gov/scripts/cdrh/cfdocs/cfcfr/cfrsearch.cfm?cfrpart=
11.
WHO Technical Report Series No. 961, 2011, Annex 9: Model guidance for the
storage and transport of time- and temperature-sensitive pharmaceutical
http://apps.who.int/medicinedocs/documents/s18683en/s18683en.pdf

Technical Supplement: Temperature mapping of storage areas 21
Annex 1 – Test data sheets
The following sections show examples of the type of data collection forms used in a
mapping exercise.
A1.1 Test data sheet: temperature data logger locations
Data logger
ID number
Data logger
serial number
ID number
on schema
Mounting ht
(metres) Description / Comments
DL-001 1 0.3
DL-002 2 2.8
DL-003 3 5.4
DL-004 4 0.3
DL-005 5 2.8
DL-006 6 5.4
DL-007 7 0.3
DL-008 8 2.8
DL-009 9 5.4
DL-010 10 0.3
DL-011 11 2.8
DL-012 12 5.4
DL-013 13 0.3
DL-014 14 2.8
DL-015 15 5.4
DL-016 16 0.3
DL-017 17 2.8
DL-018 18 5.4
DL-019 19 0.3
DL-020 20 2.8
DL-021 21 5.4
DL-022 22 0.3
DL-023 23 2.8
DL-024 24 5.4

Technical Supplement: Temperature mapping of storage areas 22
A1.2 Test data sheet: temperature distribution
Thermostat Information
Location Set point Comment
Near entrance door #1 20C Locked
Near loading dock #4 20C Locked

Technical Supplement: Temperature mapping of storage areas 23
A1.3 Test data sheet: temperature distribution
Data logger
ID number
Min. temp.
Recorded
(°C)
Max temp.
Recorded
(°C)
Mean
temp.
(°C)
Within range?
Yes No Inspected by Date
DL-001 18.6 22.4 20.5 JB
DL-002
DL-003
DL-004
DL-005
DL-006
DL-007
DL-008
DL-009
DL-010
DL-011
DL-012
DL-013
DL-014
DL-015
DL-016
DL-017
DL-018
DL-019
DL-020
DL-021
DL-022
DL-023
DL-024
Mapping period starts at (date/hour):
Mapping period ends at (date/hour):
Checked by: Date:

Technical Supplement: Temperature mapping of storage areas 24
Revision history
Date Change summary Reason for change Approved