Embed Size (px)
Citation preview

1
Temperature independent removal of iron in a passive mine water treatment system
Robert S Hedin*
Hedin Environmental
195 Castle Shannon Blvd
Pittsburgh, PA 15228 USA
412 571 2204
Abstract
The Marchand water treatment system was constructed in Pennsylvania in 2006 to treat a
7 m3/min flow of alkaline coal mine drainage containing 72 mg/L Fe
2+. The passive system
removes Fe through a natural oxidation/hydrolysis/settling process that does not require any
energy or chemical inputs. Over the last six years the system has consistently decreased Fe to
less than 3 mg/L. Little seasonality in treatment effectiveness is observed despite Arrhenius-
based calculations indicating that Fe2+
oxidation rates should vary by 5-10 times between warm
and cold seasons. The kinetic penalty is offset by an inverse relationship between pH and water
temperature that increases Fe oxidation rates in treatment ponds in cold weather. Variation in pH
is most likely caused by variable degassing of CO2. CO2 fugacity was inversely related to water
temperature, which is counter to solubility expectations. The proposed explanation is that
water/atmosphere gas exchange is faster during cold weather due to density-driven mixing of the
ponds. In addition to year-round effective treatment, the passive system produced a clean iron
oxide solid that can be recovered and marketed. The combination of reliable year-round passive
treatment and solids recovery makes this treatment technology potentially self-sustaining.
TOC/Abstract Art

2
Introduction
Underground mining of coal commonly results in the release of metal-contaminated waters.
These polluted flows persist for decades after mine closure and in the absence of treatment cause
major environmental damage. The conventional treatment for mine drainage involves chemical
and mechanical technologies that have high energy, reagent, manpower and sludge management
costs (1). An alternative approach for Fe-contaminated waters is passive treatment where iron is
removed by natural oxidation, settling and biological processes while flow is transferred through
the system by gravity (1,2,3). The sludge produced by the passive process is clean iron
oxyhydroxide which can be recovered and utilized for pigmentary, ion exchange, and
remediation purposes (4,5,6).
The total long-term cost of the passive approach is less than conventional chemical and energy-
intensive technologies (7,8). Despite cost savings, the coal mining and reclamation industries
have been slow to adopt passive treatment partly because of concerns about its reliability in
meeting stringent effluent criteria, particularly in cold climates. Conventional wisdom based on
Arrhenius calculations suggests that a 20o C temperature range, as occurs commonly in temperate
climates, should cause the kinetics of important chemical reactions to vary by 5-10 times
between cold and warm seasons. This variation would make passive treatment unfeasible where
year-round effectiveness is required.
This paper presents six years of monitoring data from one of the largest passive treatment
systems constructed to date for contaminated coal mine drainage. The system is in temperate
Pennsylvania where air temperatures vary widely, yet no seasonal variation in treatment
effectiveness exists. Several unexpected correlates with temperature are described that explain
the robust capabilities of this treatment technology.
Background
The most common passive method for treating Fe-contaminated mine water is an aerobic
approach where ferrous iron is removed through oxidation (A), hydrolysis (B) and settling (C).
Fe2+
+ ¼O2 + H+ Fe
3+ + ½ H2O (A)
Fe3+
+ 2H2O FeOOH(s) + 3H+ (B)
FeOOH (suspended solid) FeOOH (settled solid) (C)
d(Fe2+
)/d(t) = k1 [Fe2+
] [O2] / [H]2 (D)
d(Fe2+
)/d(t) = k2[FeOOH] [Fe2+
] [O2] / [H] (E)
H+ + HCO3
- H2O + CO2 (F)
HCO3- CO2(g) + OH
- (G)
At pH values between 3 and 9, Fe3+
hydrolysis is rapid and Fe2+
oxidation is the limiting
chemical step (9,10). Oxidation occurs by homogeneous (D) and heterogenous (E) mechanisms
(11,12,13). The rate constant for the homogeneous reaction, k1, is approximately 5.0 X 10⁻¹⁵
mole/sec at 25oC (EA of 23 kcal/mol K) and doubles/halves with a 5
oC change in temperature
(11,12,14). The rate constant for the heterogeneous reaction, k2, is approximately 3.1 X 10⁻⁸
mole/sec at 25oC (EA of 18 kcal/mol K) and doubles/halves with a 6
oC change in temperature

3
(12,15). The rates of both abiotic mechanisms are negatively related to H+ and slow
considerably when pH is less than 5 (12,14).
Fe3+
hydrolysis is a proton-producing reaction than can result in pH less than 5 in unbuffered
waters. For these low-pH waters, iron chemistry is controlled by microbial activity (10,16,17).
When there is sufficient buffering, the acidic aspect of iron removal is neutralized (reaction F)
and pH is maintained in the circumneutral range where abiotic iron oxidation is favored. Mine
waters containing bicarbonate typically have high concentrations of CO2, which increases pH
through exsolution (reaction G). These discharges are commonly referred to as “net alkaline”
because the capacity for acid neutralization exceeds the latent acidity released when reduced
metals oxidize and hydrolyze. Net alkaline discharges are particularly suitable for aerobic
passive treatment. Many mine drainages from flooded underground coal mines around the world
are net alkaline solutions with pH 6-7 and elevated concentrations of Fe (1,2,18,)
Marchand Mine Passive Treatment System
The Marchand passive treatment system was installed in 2006 to treat a large Fe-contaminated
discharge from a flooded underground coal mine that had polluted the receiving stream
(Sewickley Creek) for 60 years. The system design follows US Bureau of Mine protocols for
passive treatment (2) where primary treatment occurs in open-water ponds that collect the bulk
of the Fe as iron oxyhydroxide solids and secondary treatment occurs in constructed wetlands
where settling, filtration and plant uptake remove residual Fe (3). The treatment system (Figure
1) consists of six serially-connected oxidation ponds that have a total surface area of 21,192 m2,
a maximum depth of 1.3 m, and an empty volume of 24,673 m3. The ponds are lined with
geotextile fabric that prevents direct contact with underlying soils and maintains the purity of the
iron solids. The liner and water depths limit growth by emergent plants and the ponds retained an
open water condition during this study. Water enters and exits each pond in 15 m long troughs
that are intended to lessen preferential flow patterns and provide aeration through a 15 cm
elevation drop. The ponds are followed by a shallow constructed wetland with a surface area of
23,424 m2, water depth of 10 – 50 cm, and an empty volume of 7,059 m
3. The wetland was
constructed with the best available soil (obtained onsite) and planted with a mix of emergent
plant species. The planting scheme had mixed success. The vegetation in the wetland has varied
between open water, partial cover with emergent plants (Typha spp., Carex spp., Leersia
oryzoides), and dense growth of the submerged alga Chara vulgaris.
Materials and Methods
The system has been sampled approximately monthly since its construction. The sampling has
been unbalanced. The final effluent was sampled 96 times, the system influent was sampled 66
times, and the ponds were sampled 23 times. Water samples were collected from the influent
trough in each pond and from the final wetland discharge channel (Figure 1). Measurements
were made in the field of pH, temperature, conductivity, dissolved oxygen, and alkalinity. Raw
and acidified samples were collected for laboratory measurements of pH, alkalinity, acidity,
conductivity, Fe, Al, Mn, sulfate and total suspended solids. These parameters are commonly
used to evaluate compliance with regulatory and environmental targets in coal mining regions in
the US. Routine laboratory analyses were conducted between in 2007 by the Pennsylvania

4
Department of Environmental Protection Bureau of Laboratories and since 2007 by G&C Coal
Analysis Lab Inc. (PA DEP Certification #33-325). Samples were not routinely filtered before
acidification, so the results represent total concentrations. On 14 occasions an extra sample was
collected at each station and filtered (0.22 um) before acidification and measurement of metals.
In April 2008 samples were collected by Dr. Rosemary Capo and students from the University
Of Pittsburgh Department Of Geology of Planetary Science and analyzed for a wider range of
parameters so that a complete cation/anion balance could be obtained. All three labs utilize
standard APHA and EPA methods (19,20).
CO2 fugacity and saturation indices were calculated using The Geochemist’s Workbench®
(Aqueous Solutions LLC). Dissolved Fe was assumed to approximate ferrous iron because ferric
iron is sparingly soluble at circumneutral pH conditions existing at all sampling stations (14).
Flow was calculated from velocity measurements made at the influent to the first pond. Samples
of solids in the treatment system were collected by hand, dried at 105oC to constant weight and
analyzed for elemental composition by Activation Laboratories Ltd. (Ontario CA) by lithium
metaborate/tetraborate fusion ICP (major elements) and infrared (C and S).
Results
Table 1 shows the detailed chemistry of system influent and final effluent on April 24, 2008.
The mine water has an alkaline sodium-sulfate geochemistry which is typical of discharges from
flooded underground coal mines in western Pennsylvania. The only metal of environmental
concern is Fe. The influent has low dissolved oxygen and very high CO2. The influent was in
equilibrium with siderite and undersaturated with respect to other carbonate and sulfate minerals.
The major effects of the system on water chemistry were decreases in Fe and bicarbonate
(HCO3-) which were stoichiometricly consistent with the neutralization of acidity produced by Fe
oxidation and hydrolysis. The final effluent had elevated nitrate which may be consequence of
organic degradation of algal biomass generated the previous summer. Nitrate was not detected
in water samples collected from the ponds (not shown).
The influent flow rate ranged between 4.8 m3/min and 9.4 m
3/min and averaged 7.1 m
3/min
(Figure 2a, Table 2). The influent Fetot
concentration ranged between 54 mg/L and 89 mg/L and
averaged 72 mg/L (Figure 2b and Table 2). The system decreased Fe concentrations to an
average 1 mg/L. Of 96 measurements of Fe in the final effluent, only 4 were higher than 3 mg/L
and the highest measurement was 6.0 mg/L. Table 3 shows effluent standards commonly used
for permitted coal mine sites in Pennsylvania. The final effluent has consistently satisfied these
criteria. Pennsylvania has special effluent standards for passive treatment systems that require
90% removal of Fe and a net alkaline final effluent (26). The Marchand system satisfied these
standards as well.
After six years of operation, the system had retained approximately 1,613 tonnes of Fe, of which
1,354 tonnes were contained in the ponds (calculations based on days of operation, flow rate and
changes in concentrations of Fetot
). Solids collected in the ponds are predominantly Fe with
minor amounts of silica and carbon (Table 4). This composition is typical of iron solids
precipitated passively from alkaline Fe-contaminated water where the dried solids are found to
5
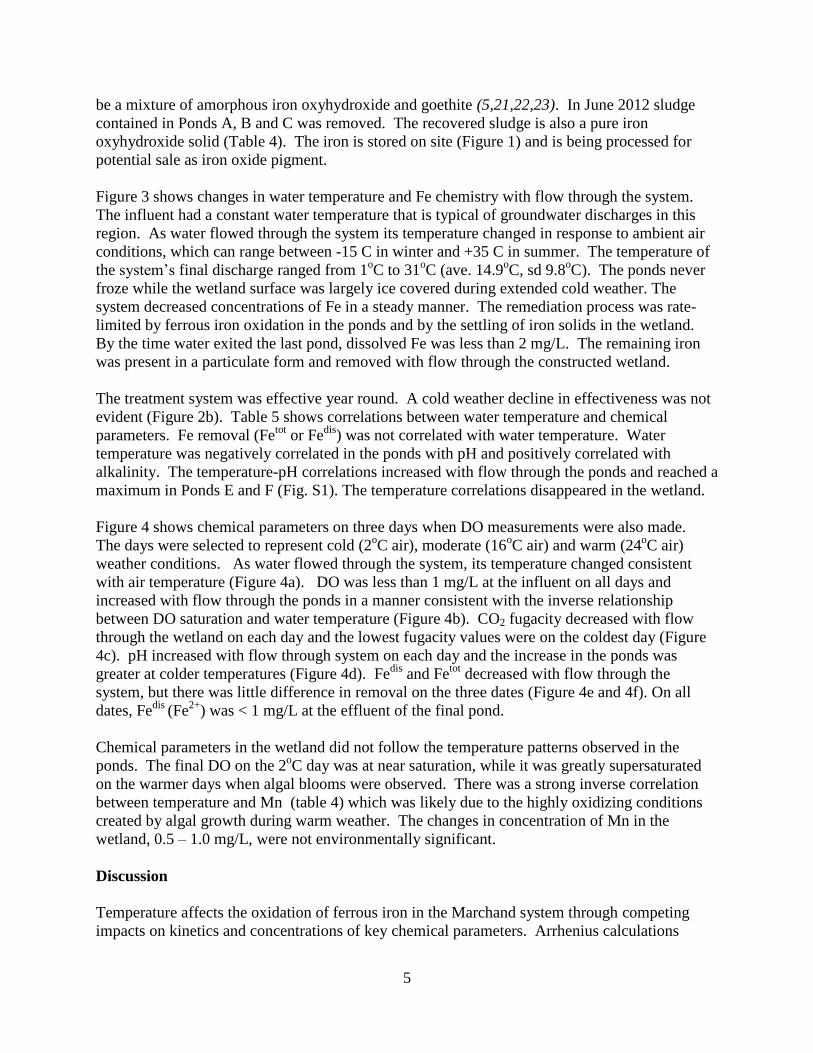
be a mixture of amorphous iron oxyhydroxide and goethite (5,21,22,23). In June 2012 sludge
contained in Ponds A, B and C was removed. The recovered sludge is also a pure iron
oxyhydroxide solid (Table 4). The iron is stored on site (Figure 1) and is being processed for
potential sale as iron oxide pigment.
Figure 3 shows changes in water temperature and Fe chemistry with flow through the system.
The influent had a constant water temperature that is typical of groundwater discharges in this
region. As water flowed through the system its temperature changed in response to ambient air
conditions, which can range between -15 C in winter and +35 C in summer. The temperature of
the system’s final discharge ranged from 1oC to 31
oC (ave. 14.9
oC, sd 9.8
oC). The ponds never
froze while the wetland surface was largely ice covered during extended cold weather. The
system decreased concentrations of Fe in a steady manner. The remediation process was rate-
limited by ferrous iron oxidation in the ponds and by the settling of iron solids in the wetland.
By the time water exited the last pond, dissolved Fe was less than 2 mg/L. The remaining iron
was present in a particulate form and removed with flow through the constructed wetland.
The treatment system was effective year round. A cold weather decline in effectiveness was not
evident (Figure 2b). Table 5 shows correlations between water temperature and chemical
parameters. Fe removal (Fetot
or Fedis
) was not correlated with water temperature. Water
temperature was negatively correlated in the ponds with pH and positively correlated with
alkalinity. The temperature-pH correlations increased with flow through the ponds and reached a
maximum in Ponds E and F (Fig. S1). The temperature correlations disappeared in the wetland.
Figure 4 shows chemical parameters on three days when DO measurements were also made.
The days were selected to represent cold (2oC air), moderate (16
oC air) and warm (24
oC air)
weather conditions. As water flowed through the system, its temperature changed consistent
with air temperature (Figure 4a). DO was less than 1 mg/L at the influent on all days and
increased with flow through the ponds in a manner consistent with the inverse relationship
between DO saturation and water temperature (Figure 4b). CO2 fugacity decreased with flow
through the wetland on each day and the lowest fugacity values were on the coldest day (Figure
4c). pH increased with flow through system on each day and the increase in the ponds was
greater at colder temperatures (Figure 4d). Fedis
and Fetot
decreased with flow through the
system, but there was little difference in removal on the three dates (Figure 4e and 4f). On all
dates, Fedis
(Fe2+
) was < 1 mg/L at the effluent of the final pond.
Chemical parameters in the wetland did not follow the temperature patterns observed in the
ponds. The final DO on the 2oC day was at near saturation, while it was greatly supersaturated
on the warmer days when algal blooms were observed. There was a strong inverse correlation
between temperature and Mn (table 4) which was likely due to the highly oxidizing conditions
created by algal growth during warm weather. The changes in concentration of Mn in the
wetland, 0.5 – 1.0 mg/L, were not environmentally significant.
Discussion
Temperature affects the oxidation of ferrous iron in the Marchand system through competing
impacts on kinetics and concentrations of key chemical parameters. Arrhenius calculations

6
indicate that the kinetic constants double/halve for each 5-6o C change in water temperature. It
would appear that the treatment system should oxidize iron on cold winter days at 5-10 times
slower rates than warm summer days. The kinetic effect is, however, offset by a concentration
effect resulting from the inverse relationship between water temperature and pH. Figure 5 shows
for each pond the calculated impact on Fe2+
oxidation of the individual temperature-related
factors and the combined effect of both, k1/[H+]2. The combined effect was not strongly related
to temperature in any of the ponds. This result explains the absence a temperature penalty for
Fe2+
oxidation and hence bulk Fe removal by the treatment system.
The pH in buffered mine water systems is largely controlled by carbonate chemistry.
Bicarbonate neutralizes protons produced by ferric iron hydrolysis (reaction F), preventing a
decrease in pH (as occurs in unbuffered systems). Dissolved CO2, present at very high partial
pressures, exsolves to the atmosphere increasing pH (reaction G). Because of the strong
dependence of Fe oxidation on pH and the demonstrated ability of accelerated CO2 degassing to
increase iron oxidation rates (24,25), mechanical aeration is a common practice in conventional
treatment systems (1). Variable CO2 degassing in passive treatment systems is an unrecognized
phenomenon that appears to influence iron dynamics in a similar manner. The degassing of CO2
in the Marchand ponds was strongly temperature dependent with lower CO2 fugacities occurring
when water temperatures were colder (Fig. S2). The direct relationship between CO2 fugacity
and water temperature in the ponds was unexpected because CO2 solubility increases with
decreasing water temperature. The simplest explanation for the inverse relationship between
water temperature and CO2 is that the ponds mix more thoroughly at colder temperatures. When
the air temperature is lower than water temperature, the surface waters are continually being
cooled and sinking due to density gradients. The mixing continually refreshes the surface with
deeper water that is more supersaturated with CO2 which prompts exsolution. Water
temperatures in the ponds never fell below 4oC where mixing stops and ice forms. When air
temperatures are warmer than the pond water temperature, the warmer less dense surface water
floats and mixing is poor. The surface is not refreshed and gas exchange processes are slowed.
All temperature correlations weakened in the wetland. While the ponds never froze, the
wetlands commonly froze in cold weather. The ice cap presumably lessened gas exchange
processes. While the ponds are largely devoid of plant growth, the wetlands contained emergent
plants and large blooms of the alga Chara vulgaris during most spring and summer seasons. The
shallow water depths combined with seasonal biological activity create a more dynamic system
where temperature relations are more complex and unpredictable than in the simple oxidation
ponds.
The year round effective treatment of Fe by the Marchand passive treatment cautions against
simplistic evaluations of the natural systems where temperature effects are predicated simply on
kinetic considerations. In this case, temperature-related variation in a key chemical parameter,
pH, completely offset the kinetic penalty. The underlying cause of the pH variation appears to
be the unexpected increase in CO2 degassing during cold weather. The mechanisms at work in
this man-made system may have parallels in other environments where CO2-supersaturated
waters are exposed to variable atmospheric conditions.

7
The Marchand treatment system has been successful in its six years of operation in three
respects. First, it has consistently lowered concentrations of Fe to levels compliant with routine
NPDES permits. Second, the treatment has been achieved as a fraction the cost of conventional
chemical treatment. The Marchand system was designed, permitted and installed at a cost of
$1.3 million (2006) and its routine operation costs $5,000/yr (8). A conventional chemical plant
would cost approximately $3 million to install and cost at least $100,000/yr to operate. Third,
the Marchand system produces a pure iron sludge whose value can offset sludge management
costs. Conventional treatment produces a chemically heterogenous sludge that has no
established value and whose disposal is costly. The combination of effective low-cost passive
treatment with the recovery of saleable iron solids makes possible a sustainable treatment
approach where the costs of operation are balanced by income from solids recovery and sale.
Acknowledgements
The Marchand System was constructed by Sewickley Creek Watershed Association with funding
provided by the Pennsylvania Department of Environmental Protection Growing Greener
Program. Sewickley Creek Watershed Association provided access to the system. Analytical
costs were supported by the Western Pennsylvania Coalition for Abandoned Mine Reclamation,
Pennsylvania Department of Environmental Protection, and Trout Unlimited Eastern Abandoned
Mine Program. Prof. Rosemary Capo and her students at the University of Pittsburgh
Department of Geology and Planetary Science provided valuable sampling and analytical
support.
Literature Cited
1) Younger, P. L.; Banwart, S. A.; Hedin, R. S. Mine Water: Hydrology, Pollution,
Remediation, Kluwer Academic Publishers: Dordrecht, The Netherlands, 2002.
2) Hedin, R. S.; Nairn, R.W.; Kleinmann, R. L. P. Passive Treatment of Coal Mine Drainage.
U.S. Department of the Interior, Bureau of Mines Information Circular 9389, 1994.
3) Batty, L. C.; Younger, P. L. Critical role of macrophytes in achieving low iron concentration
in mine water treatment wetlands. Environ. Sci. Technol. 2002, 36, 3997-4002.
4) Hedin, R.S. Recovery of marketable iron oxide from mine drainage in the USA. Land
Contamination Reclamation, 2003, 11, 93-97.
5) Filip, J.; Zboril, R.; Schneeweiss, O.; Zeman, J.; Cernik, M.; Kvapil, P., Otuepka, M.
Environmental applications of chemically pure natural ferrihydrite. Environ. Sci. Technol.
2007,41, 4367-4374.
6) Ziemkiewicz, P.E.; O’Neil, M.; Lovett, R. J. Selenium leaching kinetics and in situ control.
Mine Water Env. 2011, 30, 141-150.
7) Ziemkiewicz, P. E.; Skousen, J. G.; Simmons, J. Long-term performance of passive acid
mine drainage treatment systems, Mine Water Env. 2003, 22, 118-129.
8) Hedin, R.S. Iron removal by a passive system treating alkaline coal mine drainage. Mine
Water Env. 2008, 27, 200-209.
9) Singer, P.C.; Stumm, W. Oxygenation of ferrous iron. Water Poll. Cont. Res. Ser. 14010-
66169, 1970.
10) Singer, P.C.; Stumm, W. Acid mine drainage, the rate determining step. Science, 1970, 167,
1121-1123.

8
11) Millero, F. J.; Sotolongo, S.; Izaguirre, M. The oxidation kinetics of Fe(II) in seawater.
Geochim. Cosmochim. Acta, 1987, 51, 793-801.
12) Dempsey, B. A.; Roscoe, H. C.; Ames, R.; Hedin, R.; Jeon, B. H. Ferrous oxidation
chemistry in passive abiotic systems for treatment of mine drainage. Geochemistry,
Exploration, Environment, Analysis. 2001.1, 81-88.
13) Morgan, B.; Lahav, O. The effect of pH on the kinetics of spontaneous Fe(II) oxidation by O2
in aqueous solution – basic principles and a simple heuristic description. Chemosphere, 2007,
68, 2080 – 2084
14) Stumm, W.; Morgan, J. J. Aquatic Chemistry: Chemical Equilibria and Rates in Natural
Waters, 3rd
Edition; John Wiley and Sons: New York, U.S, 1996.
15) Ames, R. P. Iron oxidation, gas transfer, and solids formation in passive treatment systems
for mine drainage. MSc Thesis, Pennsylvania State University, University Park, PA, 1998.
16) Kleinmann, R. L. P.; Crerar, D. A. Thiobacillus ferrooxidans and the formation of acidity in
simulated coal environments. Geomicrobiology Journal, 1979, 1, 373-387.
17) Kirby, C. S.; Thomas, H. M.; Southam, G.; Donald, D.. Relative contributions of abiotic and
biological factors in acid mine drainage treatment. Applied Geochemistry, 1999, 14, 511-
530.
18) Banks, D.; Younger, P .L.; Arnersen, R. T.; Iverson, E. R.; Banks, S. B. Mine-water
chemistry: the good, the bad and the ugly. Environ. Geol. 1997, 32, 157-174.
19) Clesceri L. S.; Greenberg, A.E.; Eaton A. D., Eds. Standard Methods for the Examination of
Water and Wastewater, 21st ed.; American Public Health Assoc., American Water Works
Assoc, and the Water Environment Federation: Washington, DC, USA, 2005.
20) United States Environmental Protection Agency. Approved General-Purpose Methods:
website epa.gov.scitech/methods/cwa
21) Fish, C. L.; Hedin, R. S.; Partezana J. Chemical characterization of iron oxide precipitates
from wetlands constructed to treat polluted mine drainage. In: Proceedings of 13th Annual
Meeting of the American Society for Surface Mining and Reclamation, ASMR, Lexington,
KY, 1996.
22) Kairies, C. L.; Capo, R. C.; Watzlaf, G. R., Chemical and physical properties of iron
hydroxide precipitates associated with passively treated coal mine drainage in the
Bituminous Region of Pennsylvania and Maryland. Applied Geochemistry 2005, 20, 1445-
1460
23) Neely, C. A.; Nairn, R. W. Characterization of iron oxides from abandoned mine drainage. In
Bridging Reclamation, Science and the Community; Barnhisel, R. I. ed.; ASMR, Lexington
KY 2010.
24) Cravotta, C.A., III. Passive aerobic treatment of net-alkaline, iron-laden drainage from a
flooded underground anthracite mine, Pennsylvania, USA. Mine Water Env. 2007, 26, 128-
149.
25) Kirby, C. S.; Dennis, A.; Kahler, A. Aeration to degas CO2, increase pH, and increase iron
oxidation rate for efficient treatment of net alkaline mine drainage. Applied Geochemistry,
2009, 24, 1175-1184
26) Pennsylvania Code. Title 25 Environmental Protection, Chapter 87 Surface Mining of Coal.
Commonwealth of Pennsylvania: Harrisburg, PA, USA. 2012.

9
Figure 1. Marchand passive treatment system on August 29, 2012. Arrows show flow paths. Circles are sampling points. The
system location is 40o 14 ’4.81” N; 79
o 45’ 55.63 W.
Sewickley Creek
Pon
d A
Pon
d B
Pon
d C
Pon
d D
Pon
d E
Pon
d F
FeOOH recovered
in 2012

10
Figure 2. Treatment performance by the Marchand system. A) Flow rate at system influent; B)
Total Fe at the system influent and effluent stations
0
2
4
6
8
10
12
Dec
-06
Jun
-07
Dec
-07
Jun
-08
Dec
-08
Jun
-09
Dec
-09
Jun
-10
Dec
-10
Jun
-11
Dec
-11
Jun
-12
Dec
-12
flo
w, m
3/m
in
A
0
20
40
60
80
100
Dec
-06
Jun
-07
Dec
-07
Jun
-08
Dec
-08
Jun
-09
Dec
-09
Jun
-10
Dec
-10
Jun
-11
Dec
-11
Jun
-12
Dec
-12
Fe, m
g/L
influent
effluent B

11
Figure 3. Temperature (A) and concentrations of total Fe (B), dissolved Fe (C), and particulate
Fe (D) through the Marchand system. Average values and one standard deviation shown.
0
5
10
15
20
25
30
infl
ue
nt
A o
ut
B o
ut
C o
ut
D o
ut
E o
ut
F o
ut
effl
ue
nt
Tem
per
atu
re, C
A
0
20
40
60
80
100
infl
ue
nt
A o
ut
B o
ut
C o
ut
D o
ut
E o
ut
F o
ut
effl
ue
nt
FeT,
mg/
L
B
0
20
40
60
80
100
infl
ue
nt
A o
ut
B o
ut
C o
ut
D o
ut
E o
ut
F o
ut
effl
ue
nt
FeD
, mg/
L C
0
20
40
60
80
100
infl
ue
nt
A o
ut
B o
ut
C o
ut
D o
ut
E o
ut
F o
ut
effl
ue
nt
FeP,
mg/
L
D

12
Figure 4 (part 1)
0
5
10
15
20
25
Infl
uen
t
A o
ut
B o
ut
C o
ut
D o
ut
E o
ut
F o
ut
Effl
uen
t
Wat
er
Tem
pe
ratu
re, C
2C air16C air
24C air
0
2
4
6
8
10
12
14
16
18
20
Infl
uen
t
A o
ut
B o
ut
C o
ut
D o
ut
E o
ut
F o
ut
Effl
uen
t
DO
mg/
L
2C air16C air24C air
0.000
0.020
0.040
0.060
0.080
0.100
0.120
0.140
0.160
0.180
0.200
infl
uen
t
A o
ut
B o
ut
C o
ut
D o
ut
E o
ut
F o
ut
Wet
ou
t
CO
2 f
uga
city
2C air16C air24C air

13
Figure 4. Changes in mine water chemistry with flow through
the Marchand system on days with the air temperature was
2oC, 16
oC and 24
oC.
6.0
6.5
7.0
7.5
8.0
8.5
Infl
uen
t
A o
ut
B o
ut
C o
ut
D o
ut
E o
ut
F o
ut
Effl
uen
t
pH
2C air
16C air
24C air
0
10
20
30
40
50
60
70
80
Infl
uen
t
A o
ut
B o
ut
C o
ut
D o
ut
E o
ut
F o
ut
Effl
uen
t
Fe (
D)
mg/
L
2C air16C air24C air
0
10
20
30
40
50
60
70
80
Infl
uen
t
A o
ut
B o
ut
C o
ut
D o
ut
E o
ut
F o
ut
Effl
uen
t
Fe (
T) m
g/L
2C air
16C air
24C air

14
Figure 5 (part 1)
-100%
-50%
0%
50%
100%
150%
200%
0 5 10 15 20 25 30
chan
ge r
ela
tive
to
ave
rage
T
Water Temperature, C
Pond A out k1[H+]2k1/[H+]2pH = -0.041*T + 7.041, r2 = 0.36
-100%
-50%
0%
50%
100%
150%
200%
250%
0 5 10 15 20 25 30
chan
ge r
ela
tive
to
ave
rage
T
Water Temperature, C
Pond B out k1[H+]2k1/[H+]2pH= -0.046*T + 7.234, r2 = 0.43
-100%
-50%
0%
50%
100%
150%
200%
250%
0 10 20 30
chan
ge r
ela
tive
to
ave
rage
T
Water Temperature, C
Pond C out k1[H+]2k1/[H+]2pH = -0.042*T + 7.281, r2 = 0.58

15
Figure 5. Temperature effects on k1, [H+]2, and k1/[H
+]
2 over the temperature range observed in
each pond. k1 at varying temperature calculated from e(-Ea/RT)
where Ea is 23 kcal/mol K. pH
effect determined from second order rate relationship where pH values determined from pH-T
regression equations developed for each pond (shown). The plotted values are relative to the
average T in each pond.
-200%
-100%
0%
100%
200%
300%
400%
0 5 10 15 20 25 30
chan
ge r
ela
tive
to
ave
rage
T
Water Temperature, C
Pond D out k1[H+]2k1/[H+]2pH = -0.044*T + 7.422, r2 = 0.64
-200%
-100%
0%
100%
200%
300%
400%
500%
600%
0 10 20 30
chan
ge r
ela
tive
to
ave
rage
T
Water Temperature, C
Pond E out k1[H+]2k1/[H+]2
pH= -0.044*T + 7.539, r2 = 0.75
-200%
-100%
0%
100%
200%
300%
400%
500%
600%
700%
0 10 20 30
chan
ge r
ela
tive
to
ave
rage
T
water Temperature, C
Pond F out k1[H+]2k1/[H+]2
pH = -0.044*T + 7.692, r2 = 0.73

16
Table 1. Chemical characteristics of the Marchand passive treatment system influent and
effluent, April 24, 2008. Samples were filtered (0.22 um) prior to laboratory analyses.
Parameter Units Influent Effluent
Flow m3/min 7.9 na
pH standard unit 6.31 7.93
Temp °C 14.2 22.0
Alkalinity mg/L CaCO3 341 228
Dissolved oxygen ppm 0.65 18.8
Conductivity μS 2688 2434
CO2 fugacity 0.1547 0.0027
Na+ mg/L 479 456
Ca2+
mg/L 154 130
Fe2+
mg/L 58.3 0.04
Mg2+
mg/L 41.2 41.3
Si mg/L 9.7 5.4
K+ mg/L 6.1 4.7
Sr2+
mg/L 2.17 1.87
Mn2+
mg/L 0.98 0.11
Ni2+
mg/L 0.028 0.021
Zn2+
mg/L 0.012 <0.003
Al3+
mg/L <0.05 <0.05
Co2+
mg/L <0.039 <0.039
SO42-
mg/L 1,114 1,057
HCO3- mg/L 416 278
Cl- mg/L 125 141
F- mg/L 0.38 0.40
B mg/L 0.36 0.25
Br- mg/L <0.1 <0.1
NO2- mg/L <0.1 <0.1
NO3- mg/L <0.2 7.9
PO42-
mg/L <0.1 <0.1
Cation sum meq/L 34.2 29.8
Anion sum meq/L 33.5 30.7
Saturation Index
Calculations
Siderite (FeCO3) log Q/K +0.60 -12.01
Rhodochrosite (MnCO3) log Q/K -1.02 -0.53
Calcite (CaCO3) log Q/K -0.70 +0.77
Magnesite (MgCO3) log Q/K -1.86 -0.21
Dolomite (CaMg(CO3)2) log Q/K -0.86 +2.21
Gypsum (CaSO4) log Q/K -0.79 -0.87
Epsomite (MgSO4) log Q/K -11.14 -10.72
Quartz (SiO2) log Q/K +0.42 +0.013
Goethite (FeOOH) log Q/K +7.22 +5.44

17
Table 2. Average conditions at the Marchand Mine passive treatment system, Jan 2007 – Dec 2012. TSS is total suspended solids.
Flow Temp DO pH HCO3-
Fetot
Fedis
Mntot
Altot
SO4tot
TSS CO2
m3/min C
o mg/L s.u. mg/L mg/L mg/L mg/L mg/L mg/L mg/L fugacity
Influent 7.1 13.9 0.8 6.30 407 72.4 66.8 1.2 <0.2 1,036 25 0.163
A out na 13.9 4.1 6.46 367 62.7 51.2 1.2 <0.2 1,109 60 0.106
B out na 13.8 6.1 6.59 342 54.5 35.7 1.2 <0.2 1,110 60 0.078
C out na 13.7 7.0 6.70 316 40.7 20.8 1.2 <0.2 1,074 50 0.056
D out na 13.5 7.5 6.82 294 30.0 12.4 1.2 <0.2 1,083 37 0.042
E out na 13.3 8.0 6.93 288 19.3 4.9 1.2 <0.2 1,115 25 0.032
F out na 13.3 9.3 7.10 281 12.4 1.4 1.1 <0.2 1,117 16 0.022
Effluent na 14.5 16.8 7.76 262 1.0 0.1 0.5 <0.2 1,160 <6 0.0045

18
Table 3. Effluent standards for permitted coal mine discharges in Pennsylvania (26)
30-day average Daily maximum
Fetot
3.0 mg/L 6.0 mg/L
Mntot
2.0 mg/L 4.0 mg/L
TSS 35 mg/L 70 mg/L
pH 6 – 9
Alkalinity Alkalinity > acidity
Table 4. Composition of solids samples collected from ponds and during sludge removal in June
2012.
Solids Chemistry (dry weight basis)
Al C Ca Fe K Mg Mn Na P S Si
In place % % % % % % % % % % %
Pond A 0.5 1.4 0.2 50.2 0.1 0.1 0.0 0.1 0.1 0.2 3.9
Pond B 0.2 0.9 0.2 52.6 0.0 0.0 0.1 0.2 0.1 0.3 2.5
Pond C 0.4 2.2 0.4 49.8 0.1 0.1 0.1 0.1 0.0 0.3 3.6
Pond D 0.4 2.3 0.3 50.5 0.1 0.1 0.1 0.2 0.0 0.2 4.2
Pond E 0.3 2.7 0.4 49.4 0.1 0.1 0.1 0.2 0.0 0.9 3.5
Recovered
Ponds A, B, C 0.2 0.7 0.6 52.7 <0.1 0.1 <0.1 0.1 <0.1 0.2 2.0
Table 5. Temperatures correlations for measured and calculated parameters. Correlations
significant at the P = 0.05 level are labeled with *.
Fe removal CO2
Flow pH Alk Fe(tot
) Fe(dis
) Fe(tot
) Fe(dis
) Mn fugacity
Influent -0.25 0.49* 0.33 0.38 0.16 0.31
A out 0.17 -0.59* 0.24 -0.23 -0.19 0.25 0.21 -0.38 0.68*
B out 0.15 -0.65* 0.26 -0.01 -0.31 -0.41 0.02 -0.34 0.74*
C out 0.22 -0.76* 0.43* 0.28 -0.01 -0.27 -0.29 -0.34 0.84*
D out 0.22 -0.80* 0.47* 0.43 0.15 -0.23 -0.35 -0.22 0.85*
E out 0.22 -0.87* 0.45* 0.02 0.11 0.34 0.09 -0.33 0.90*
F out 0.18 -0.85* 0.45* 0.23 0.15 -0.14 0.03 -0.12 0.85*
Effluent 0.22 -0.34 -0.13 -0.15 -0.17 0.14 0.10 -0.73* 0.36

Supplemental Information
Figure S1. Relationship between water
temperature and pH at each sampling point.
Note the x-axis scale differs between charts.
y = -0.04x + 6.80 R² = 0.02
6.10
6.20
6.30
6.40
6.50
6.60
10 12 14 16
Fie
ld p
H
Water temperature, C
Influent
y = -0.04x + 7.07 R² = 0.35
6.00
6.20
6.40
6.60
6.80
5 15 25
Fie
ld p
H
Water temperature, C
Pond A out
y = -0.05x + 7.26 R² = 0.42
6.15
6.30
6.45
6.60
6.75
6.90
7.05
5 15 25
Fie
ld p
H
Water temperature, C
Pond B out
y = -0.04x + 7.30 R² = 0.59
6.20
6.40
6.60
6.80
7.00
7.20
5 15 25
Fie
ld p
H
Water temperature, C
Pond C out
y = -0.05x + 7.44 R² = 0.65
6.20
6.40
6.60
6.80
7.00
7.20
7.40
0 10 20 30
Fie
ld p
H
Water temperature, C
Pond D out
y = -0.046x + 7.553 R² = 0.760
6.00
6.40
6.80
7.20
7.60
8.00
0 10 20 30
Fie
ld p
H
Water temperature, C
Pond E out
y = -0.045x + 7.701 R² = 0.746
6.00
6.40
6.80
7.20
7.60
8.00
0 10 20 30
Fie
ld p
H
Water temperature, C
Pond F out
y = -0.012x + 8.023 R² = 0.182
6.50
6.90
7.30
7.70
8.10
8.50
0 20 40
Fie
ld p
H
Water temperature, C
Effluent

Supplemental Information
Figure S2. Relationship between water
temperature and CO2 fugacity at each
sampling point. Note the x-axis scale differs
between charts.
y = 0.03x - 0.26 R² = 0.09
0.00
0.05
0.10
0.15
0.20
0.25
10 12 14 16
CO
2 F
ug
acit
y
Water Temperature, C
Influent
y = 0.01x - 0.05 R² = 0.46
0.00
0.05
0.10
0.15
0.20
5 15 25
CO
2 F
ug
acit
y
Water Temperature, C
Pond A out
y = 0.0094x - 0.0488 R² = 0.5481
0.00
0.05
0.10
0.15
0.20
5 15 25
CO
2 F
ug
acit
y
Water Temperature, C
Pond B out
y = 0.0058x - 0.0225 R² = 0.6992
0.00
0.05
0.10
0.15
5 15 25
CO
2 F
ug
acit
y
Water Temperature, C
Pond C out
y = 0.0043x - 0.0150 R² = 0.7213
0
0.02
0.04
0.06
0.08
0.1
0 10 20 30
CO
2 F
ug
acit
y
Water Temperature, C
Pond D out
y = 0.0034x - 0.0128 R² = 0.8027
0
0.02
0.04
0.06
0.08
0.1
0 10 20 30C
O2 F
ug
acit
y
Water Temperature, C
Pond E out
y = 0.0023x - 0.0077 R² = 0.7247
-0.02
0.00
0.02
0.04
0.06
0.08
0 10 20 30
CO
2 F
ug
acit
y
Water Temperature, C
Pond F out
y = 0.0001x + 0.0019 R² = 0.1133
0
0.002
0.004
0.006
0.008
0.01
0 20 40
CO
2 F
ug
acit
y
Water Temperature, C
Effluent

ES&T Rejection of Paper emails
-----Original Message----- From: [email protected]
[mailto:[email protected]] On Behalf Of [email protected] Sent: Monday, March 11, 2013 3:28 PM
To: [email protected] Cc: [email protected]; [email protected]
Subject: Final decision on ES&T manuscript es-2013-00074b 11-Mar-2013
Journal: Environmental Science & Technology Manuscript ID: es-2013-
00074b Title: "Temperature independent removal of iron in a passive mine water treatment system"
Author(s): Hedin, Robert
Dear Dr. Hedin:
Thank you for considering Environmental Science & Technology for your manuscript submission. It has been forwarded to reviewers for their consideration, and the reviews are enclosed. After careful consideration, I
regret to inform you that the manuscript cannot be accepted for publication in ES&T.
I hope that the reviewers' comments are of help to you if you choose to revise the manuscript for submission to another journal.
I wish you much success in your future research. Please accept my thanks
for the opportunity to consider your contribution for Environmental Science & Technology.
Sincerely,
Prof. Xiang-dong Li Associate Editor Environmental Science & Technology
Phone: 919-918-3912 Fax: 202-513-8660
Email: [email protected] ------------------------------------
Reviewer(s)' Comments to Author:
Reviewer: 1
Comments: Review attached.
Reviewer: 2
Comments: AMD passive treatment was evaluated at a multi-pond site. It was reported
that Fe removal was just as effective during the winter as during the summer. This seemed counter-intuitive based on chemical kinetic issues.
This result is very interesting and deserves to be published in some format. However, the final explanation for the effect was pretty simple (increased wind in the winter leading to faster removal of CO2 and higher pH). It could
even be that the result is not generalizable. Consequently the authors should consider shortening substantially, retaining the stunning aerial photo and just
one or possibly two plots, and publishing as a technical note (whether in this journal or elsewhere) rather than as a research article, or publish with the current length in another journal.
Some specific comments:
(1) I found the use of fugacity for CO2 and mg/L for DO to be troublesome.
Why not be consistent and use similar terminology to express the concentration or relative partial pressure of O2 and CO2 in the same way? Also, fugacity has dimensions of pressure, while fugacity coefficient is
dimensionless.
(2) Page 4/14, line 19: The only flow data was based on velocity into the first pond. Stratification or other physical characteristics of the system were not evaluated or reported. Flow and mixing within the basins apparently was
crucial to understanding the result (no decrease in Fe-oxidation with lower pond temperatures). This suggests that there could be more short-circuiting
during the summer and more wind-induced and thermal-induced mixing during the winter. In order to add to the knowledge base about how these systems work, it seems crucial to be able to describe the flow regimes as a
function of season.
(3) The discussion section seems weak and speculative. The important observation was that the pH was higher than expected in the winter, and the proposed explanation was increased gas transfer due to better mixing in the
winter, but without any documentation other than the original observation that the pH was higher.
(4) The cost comparison in the final paragraph of the paper was not documented. It might be better to provide comparative costs based on
designs that can be documented, or provide more data for these design costs, or provide comparative costs for active versus passive systems with
similar flow and AMD strength.

(5) Several items in Table 1:
The extremely high DO (18.8 mg/L) must reflect an algal bloom and the sample must have been taken at the peak productivity hour - that is perhaps
not representative of average conditions, including the pH. As noted above, fugacity units are pressure, but anyway it seems better to
report all dissolved gases using similar units.
That's a huge alkalinity at the effluent side, which typically means the ALD is over-designed, and consequently perhaps this site has a higher pH and is not as representative of most AMD passive systems as it should be.
Where did all that nitrate come from, especially does it mean that there's
storm runoff that enters the ponds and that could possibly affect the results and conclusions?

From: Bob Hedin [[email protected]] Sent: Friday, March 29, 2013 5:40 PM
To: Xiang-dong Li Subject: RE: Final decision on ES&T manuscript es-2013-00074b
Prof. Xiang-dong Li
Thank you for considering the paper. I have been in contact with one of the reviewers who was disappointed to hear that the paper was not going to be
published. Reviewer 2 has some reasonable comments about the paper, but made one that has bothered me. The reviewer states that the results were not generalizable because the water chemistry of the system is unusual due
to it pretreatment with limestone.
"That's a huge alkalinity at the effluent side, which typically means the ALD is over-designed, and consequently perhaps this site has a higher pH and is not as representative of most AMD passive systems as it
should be."
The "ALD" that reviewer 2 refers to a limestone pre-treatment system that is used in some treatment systems to add alkalinity to acid mine water. The
treatment system presented in the paper does not have contain an ALD or any pre-treatment with limestone. The paper never discusses an "ALD" or even limestone treatment. As noted in background section, the "huge
alkalinity" is natural and is typical of hundreds (thousands?) of discharges flowing from flooded mines around the world. It concerns me that the
reviewer imposed a treatment assumption into his review of the paper that was artificial, unwarranted and incorrect. I believe that this error biased his review and his opinion that the results were not generalizable and therefore
not appropriate for the broad ES&T audience.
The review makes other comments about the interpretation of the findings that have merit and could be handled in a rewrite.
Sincerely,
Robert Hedin

Dear Dr. Hedin,
I have read through the two reviewers' comments again. The point you referred to is not the only drawback of the present study and I am unwilling to change the decision. Thank you again for your interest in ES&T, and I look
forward to your new contribution in the future.
Best wishes, Dr. Xiang-dong Li
Associate Editor Environmental Science & Technology
Email: [email protected] Phone: 919-918-3912
________________________________________