Embed Size (px)
Citation preview
DOI: https://doi.org/10.24820/ark.5550190.p011.189Page 1 ©AUTHOR(S)
The Free Internet Journal
for Organic Chemistry Paper
Archive for
Organic Chemistry
Arkivoc 2020, part __, 0-0
to be inserted by editorial office
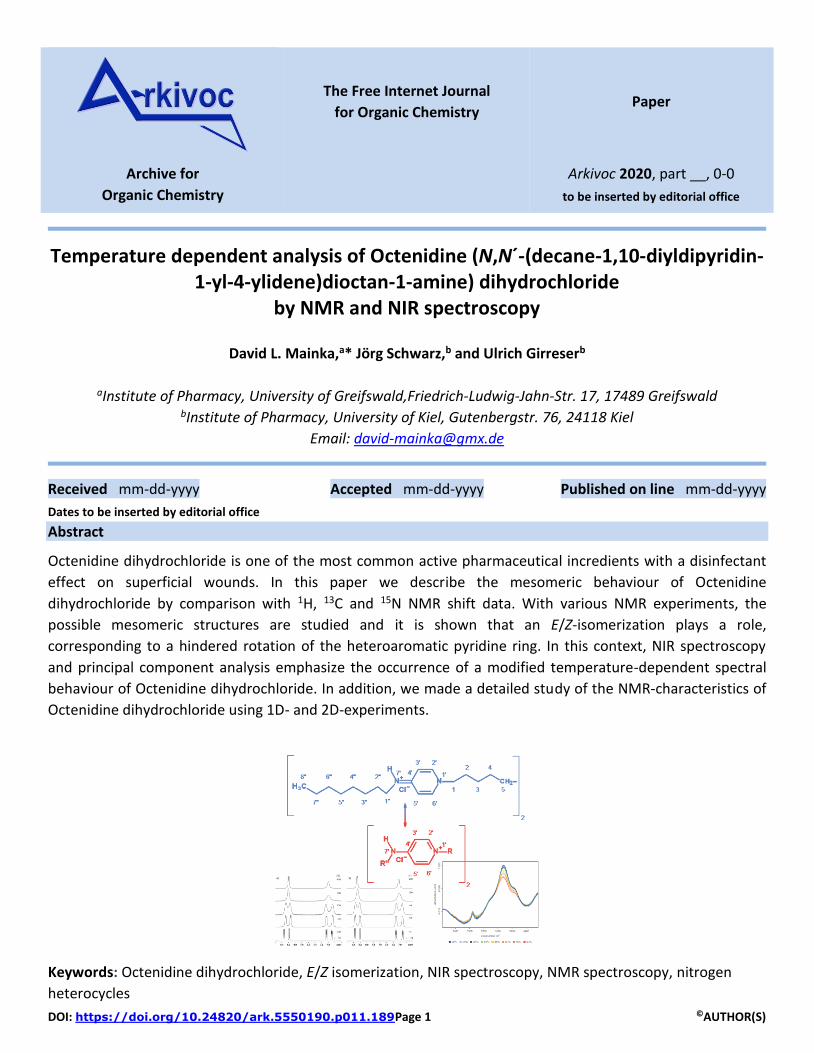
Temperature dependent analysis of Octenidine (N,N´-(decane-1,10-diyldipyridin-1-yl-4-ylidene)dioctan-1-amine) dihydrochloride
by NMR and NIR spectroscopy
David L. Mainka,a* Jörg Schwarz,b and Ulrich Girreserb
aInstitute of Pharmacy, University of Greifswald,Friedrich-Ludwig-Jahn-Str. 17, 17489 Greifswald
bInstitute of Pharmacy, University of Kiel, Gutenbergstr. 76, 24118 Kiel
Email: [email protected]
Received mm-dd-yyyy Accepted mm-dd-yyyy Published on line mm-dd-yyyy
Dates to be inserted by editorial office
Abstract
Octenidine dihydrochloride is one of the most common active pharmaceutical incredients with a disinfectant
effect on superficial wounds. In this paper we describe the mesomeric behaviour of Octenidine
dihydrochloride by comparison with 1H, 13C and 15N NMR shift data. With various NMR experiments, the
possible mesomeric structures are studied and it is shown that an E/Z-isomerization plays a role,
corresponding to a hindered rotation of the heteroaromatic pyridine ring. In this context, NIR spectroscopy
and principal component analysis emphasize the occurrence of a modified temperature-dependent spectral
behaviour of Octenidine dihydrochloride. In addition, we made a detailed study of the NMR-characteristics of
Octenidine dihydrochloride using 1D- and 2D-experiments.
Keywords: Octenidine dihydrochloride, E/Z isomerization, NIR spectroscopy, NMR spectroscopy, nitrogen
heterocycles
Arkivoc 2020, part _, 0-0 Mainka, D. L. et al.
Page 2 ©AUTHOR(S)
Introduction
The pharmaceutical drug Octenidine dihydrochloride is one of the most important disinfectant drugs for
superficial wounds.1 Its use is restricted to superficial wounds, as clarified by the manufacturer in 2011 after
some adverse drug reactions in Germany with a so-called ‘Rote-Hand-Brief’ (warning letter after detection of
adverse drug reactions).2 In cavities or when there is a lack of drainage for the sore liquid the substance
Octenidine dihydrochloride leads to necrosis of the affected tissue. When used superficially, it works
excellently as a disinfectant.3 The differences in the effects, when using Octenidine dihydrochloride, may be
linked to changes in the structure. Similar necrotic effects have been reported for e.g. cetyl pyridinium
chloride, a cationic quaternary ammonium structure.4,5 If so, the description of mesomeric structures may
yield an explanation for the different modes of action of this API (active pharmaceutical ingredient).
Therefore, we carried out a temperature-dependent analysis of the API with NMR and NIR spectroscopy.
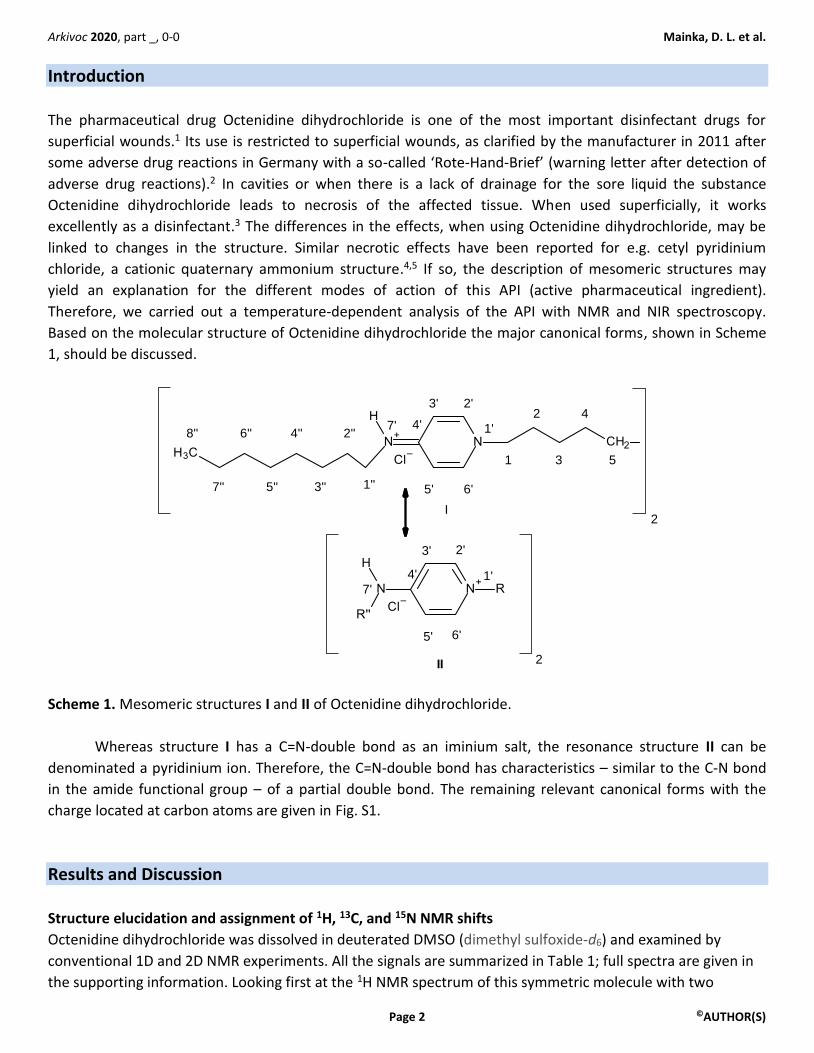
Based on the molecular structure of Octenidine dihydrochloride the major canonical forms, shown in Scheme
1, should be discussed.
I
II
1
2
3
4
5
1'
2'3'
4'
5' 6'
7'
1''
2''
3''
4''
5''
6''
7''
8''
2
2
1'
2'3'
4'
5' 6'
7'
Scheme 1. Mesomeric structures I and II of Octenidine dihydrochloride.
Whereas structure I has a C=N-double bond as an iminium salt, the resonance structure II can be
denominated a pyridinium ion. Therefore, the C=N-double bond has characteristics – similar to the C-N bond
in the amide functional group – of a partial double bond. The remaining relevant canonical forms with the
charge located at carbon atoms are given in Fig. S1.
Results and Discussion
Structure elucidation and assignment of 1H, 13C, and 15N NMR shifts
Octenidine dihydrochloride was dissolved in deuterated DMSO (dimethyl sulfoxide-d6) and examined by
conventional 1D and 2D NMR experiments. All the signals are summarized in Table 1; full spectra are given in
the supporting information. Looking first at the 1H NMR spectrum of this symmetric molecule with two
Arkivoc 2020, part _, 0-0 Mainka, D. L. et al.
Page 3 ©AUTHOR(S)
perpendicular mirror planes, a high frequency shifted NH signal can be identified at about 9.1 ppm as a triplet.
Next to this signal four doublets of doublets in the olefinic region of the proton NMR spectrum are noticeable,
corresponding to the signals in position 2', 3', 5' and 6' (shown in Fig. 1 and Fig. S4 and S5) in the range of 8.3
to 6.9 ppm. Clearly, the four signals can be best explained by looking at the mesomeric structure I in Scheme
1, the iminium isomer with chemically non-equivalent sides of the substituted dihydropyridine ring with
protons in E and Z position relative to the alkyl group at the C=N double bond. Each of the signals is split by a
coupling over three and one over four bonds. A first order analysis of this AGMX system explains the basic
splitting of these olefinic signals.
Using a 2D NOESY experiment the protons next to the iminium proton can be assigned and also the
methylene groups in the vicinity of this NH proton, thereby allowing the assignment of all the different olefinic
signals. The remaining protons, i.e. all the methylene groups without a nitrogen atom in the vicinity, resonate
as a broad multiplet centred around 1.25 ppm.
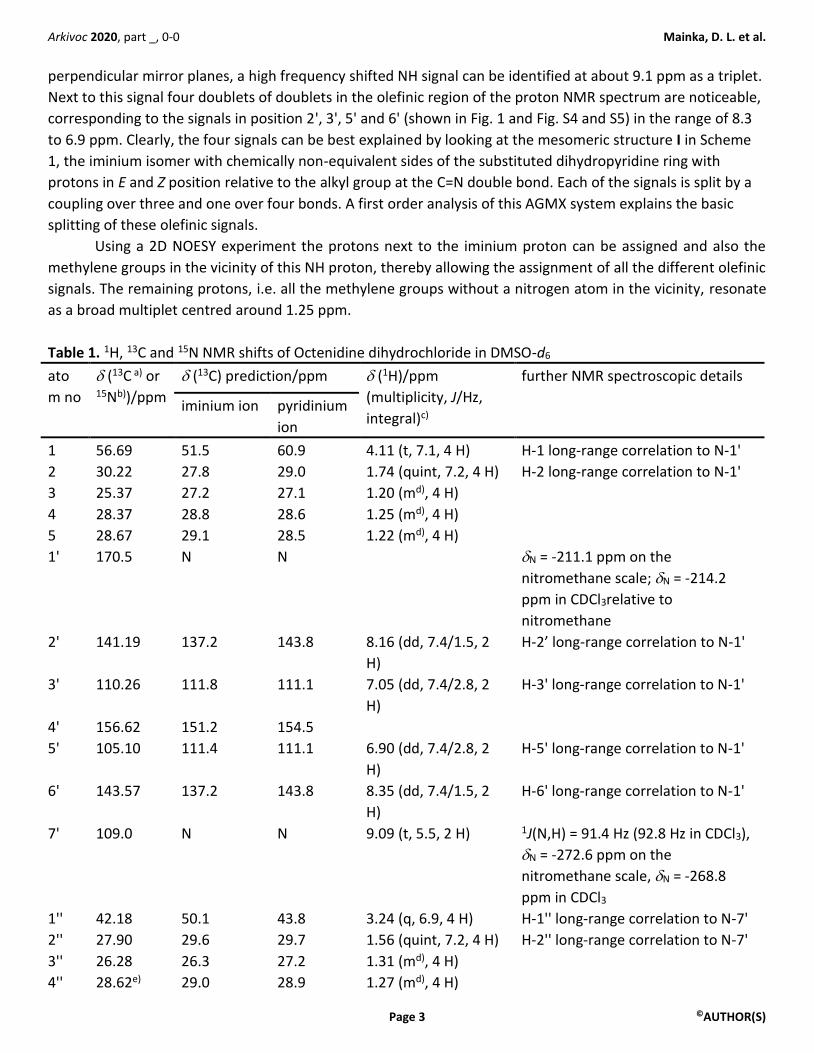
Table 1. 1H, 13C and 15N NMR shifts of Octenidine dihydrochloride in DMSO-d6
ato
m no
(13C a) or 15Nb))/ppm
(13C) prediction/ppm (1H)/ppm
(multiplicity, J/Hz,
integral)c)
further NMR spectroscopic details
iminium ion pyridinium
ion
1 56.69 51.5 60.9 4.11 (t, 7.1, 4 H) H-1 long-range correlation to N-1'
2 30.22 27.8 29.0 1.74 (quint, 7.2, 4 H) H-2 long-range correlation to N-1'
3 25.37 27.2 27.1 1.20 (md), 4 H)
4 28.37 28.8 28.6 1.25 (md), 4 H)
5 28.67 29.1 28.5 1.22 (md), 4 H)
1' 170.5 N N N = -211.1 ppm on the
nitromethane scale; N = -214.2
ppm in CDCl3relative to
nitromethane
2' 141.19 137.2 143.8 8.16 (dd, 7.4/1.5, 2
H)
H-2’ long-range correlation to N-1'
3' 110.26 111.8 111.1 7.05 (dd, 7.4/2.8, 2
H)
H-3' long-range correlation to N-1'
4' 156.62 151.2 154.5
5' 105.10 111.4 111.1 6.90 (dd, 7.4/2.8, 2
H)
H-5' long-range correlation to N-1'
6' 143.57 137.2 143.8 8.35 (dd, 7.4/1.5, 2
H)
H-6' long-range correlation to N-1'
7' 109.0 N N 9.09 (t, 5.5, 2 H) 1J(N,H) = 91.4 Hz (92.8 Hz in CDCl3),
N = -272.6 ppm on the
nitromethane scale, N = -268.8
ppm in CDCl3
1'' 42.18 50.1 43.8 3.24 (q, 6.9, 4 H) H-1'' long-range correlation to N-7'
2'' 27.90 29.6 29.7 1.56 (quint, 7.2, 4 H) H-2'' long-range correlation to N-7'
3'' 26.28 26.3 27.2 1.31 (md), 4 H)
4'' 28.62e) 29.0 28.9 1.27 (md), 4 H)
Arkivoc 2020, part _, 0-0 Mainka, D. L. et al.
Page 4 ©AUTHOR(S)
5'' 28.61e) 29.0 29.0 1.27 (md), 4 H)
6'' 31.21 31.5 31.5 1.24 (md), 4 H)
7'' 21.98 22.8 22.8 1.24 (md), 4 H)
8'' 13.93 14.1 14.1 0.86 (t, 6.8, 6 H) a) 100 MHz relative to the internal DMSO-d6 signal at 39.5 ppm, b) 30.6 MHz relative to external
nitromethane in DMSO-d6 c) 400 MHz relative to internal TMS, a-c) for details see experimental section d)
overlapping multiplets, refined shifts were taken from the 1H,13C HSQC spectrum e) assignment
interchangeable
A refined determination of the 1H chemical shifts of these methylene groups was performed by evaluation
of the 1H,13C HSQC cross signals. This 2D technique was also used for the assignment of the 13C NMR shifts,
further information was gained from the 1H,13C HMBC measurement. All carbon signals can be assigned except
for the two methylene group signals at 28.61 and 28.62 ppm (C-4'' and C-5''), here the assignment is
interchangeable. Two special observations have to be explained: firstly the methyl group forms a distorted
triplet due to a well-known higher order effect observable with long linear alkyl chains. The other effect
needing explanation is the different line widths and thus different resolution and signals heights of the olefinic
signals (Fig. S4). These originate from unresolved long range couplings, the NH proton couples over five bonds
with H-6' (an ‘extended’ W coupling) and a very weak interaction of the protons of methylene group 1 with H-
3' but not with H-5' (also a 5J coupling) was detectable using a long range H,H COSY.
An alternative possible tautomeric structure with protonation of the annular nitrogen atom, instead of the
imine nitrogen, can be easily excluded by analysis of the 1H,15N HSQC and HMBC spectrum, as the proton at
about 9.1 ppm shows coupling to the imine nitrogen atom N-7' and not to the endocyclic nitrogen atom N-1'.
Moreover, the NH long range couplings confirm the assignment of the 15N NMR shifts, the endocyclic nitrogen
atom 1' at 170 ppm shows coupling with all four olefinic protons and the high frequency shifted methylene
group at about 4.1 ppm. There is no evidence in any of the spectra for the presence for this or any other
tautomer.
Predicted NMR shifts for the 1H and 13C nucleus were calculated using established online prediction
portals based on experimental values in order to describe the structure of Octenidine dihydrochloride by the
observed NMR shift values. The predictions are based either on neural networks which are trained by
experimental NMR shift data6,7 or by comparison of chemical shifts using the so-called HOSE (hierarchically
ordered spherical environment) code, which is also able to encode three-dimensional structures, that means
considering stereochemical information,8,,9 which is, however, not relevant for Octenidine. Some prediction
tools use both methods. The predicted shifts are obtained after generating the HOSE code of the atom under
investigation and searching the chemical shift library for atoms with the same HOSE code. If several values are
found they are averaged. Some of the prediction portals use both methods. The libraries contain a huge
amount of experimental NMR shifts, e.g. in the case of the 13C prediction portal about five hundred thousand
spectra. Especially the 13C prediction tool is even used to check the quality of submitted 13C NMR shift data for
inconsistencies by organic chemistry journals.10
For the two different canonical forms I and II with the positive charge located at the nitrogen atom (we
named these resonance structures pyridinium and iminium ions compared to the remaining three mesomeric
structures named carbenium ions 1-3, Scheme 1 and Fig. S3), the predicted values are given in Tables S1 and
S2. It is quite obvious from this comparison, especially when looking only at the values predicted for the atoms
near the nitrogen atoms, that the 1H and 13C chemical shifts describe best the pyrimidinium ion, here a
Arkivoc 2020, part _, 0-0 Mainka, D. L. et al.
Page 5 ©AUTHOR(S)
minimum for the standard deviation between observed and predicted shifts is observed. When estimating the
charge distribution with a simple tool (HMO charge distribution within MarvinSketch), more than 40% of the
charge is localized at the endocyclic nitrogen atom and the remainder is distributed nearly equally on the two
ortho carbon positions, the carbon in para position and the imine nitrogen (Fig. S2).
The chemical shifts of the nitrogen atoms are also in accordance with this charge distribution. Beltrame
et al.11 observed 15N shift values of 159.9 and 91.5 ppm for the endocyclic and the exocyclic nitrogen atom,
respectively, for protonated 4-aminopyridine, which are quite similar to the measured values of 170.5 and
109.0 ppm in Octenidine dihydrochloride, considering different standards and the necessity for re-referencing
(see Table S3), the use of a solvent mixture (changing from DMSO-d6 to CDCl3 decreases the shift values up to
10 ppm,7 the additional alkyl substituent at both nitrogen atoms in Octenidine dihydrochloride (methylation
for uncharged nitrogen atoms leads to a shift of the resonance frequency to lower values up to 5 ppm,12) and
finally the additional compounds present in solution in the 4-aminopyridine measurement, where protonation
was achieved by addition of pyridinium chloride. Especially the shift of the endocyclic nitrogen atom fits also
well with the shift value observed in 4-pyridone (155.1 ppm with a calculated charge HMO charge density of
0.40) and even better with the protonated form of 4-pyridone, that is the 4-hydroxypyridinium ion (175.4
ppm; HMO charge density 0.46, see Fig. S4).13 This simple approach, however, does not work similarly well for
the evaluation of the shift of the exocyclic iminium-type nitrogen atom. Protonation effects on the nitrogen
chemical shifts, especially also in imines, have been analysed on a theoretical level only recently14,15 the imine
nitrogen in Schiff bases, i.e. N-substituted ketimines and aldimines and also conjugated aliphatic imines,16
resonates in the range of 320 to 340 ppm, protonation leads to a remarkable low frequency shift of up to 150
ppm to typical shift values of 200 ppm. In a special case, for intramolecular protonation of the imine function
via tautomerism, a shift of the 15N signal to 142 ppm for the protonated form has been observed in the solid
state.17
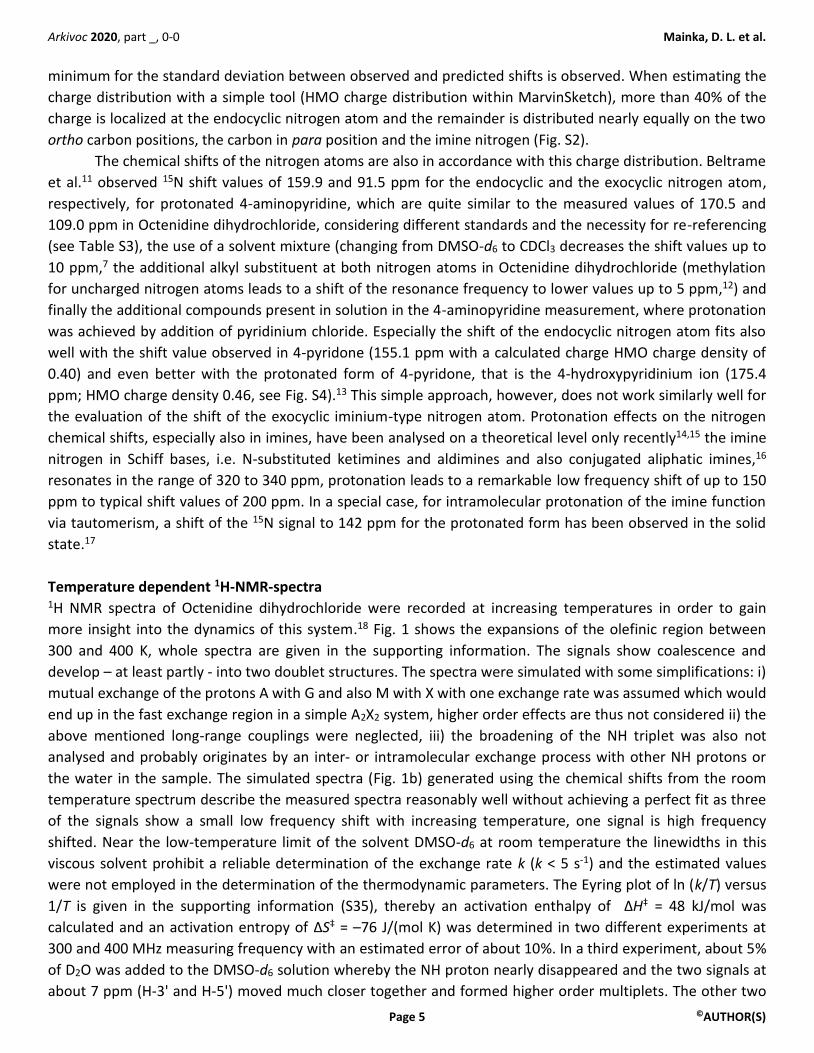
Temperature dependent 1H-NMR-spectra 1H NMR spectra of Octenidine dihydrochloride were recorded at increasing temperatures in order to gain
more insight into the dynamics of this system.18 Fig. 1 shows the expansions of the olefinic region between
300 and 400 K, whole spectra are given in the supporting information. The signals show coalescence and
develop – at least partly - into two doublet structures. The spectra were simulated with some simplifications: i)
mutual exchange of the protons A with G and also M with X with one exchange rate was assumed which would
end up in the fast exchange region in a simple A2X2 system, higher order effects are thus not considered ii) the
above mentioned long-range couplings were neglected, iii) the broadening of the NH triplet was also not
analysed and probably originates by an inter- or intramolecular exchange process with other NH protons or
the water in the sample. The simulated spectra (Fig. 1b) generated using the chemical shifts from the room
temperature spectrum describe the measured spectra reasonably well without achieving a perfect fit as three
of the signals show a small low frequency shift with increasing temperature, one signal is high frequency
shifted. Near the low-temperature limit of the solvent DMSO-d6 at room temperature the linewidths in this
viscous solvent prohibit a reliable determination of the exchange rate k (k < 5 s-1) and the estimated values
were not employed in the determination of the thermodynamic parameters. The Eyring plot of ln (k/T) versus
1/T is given in the supporting information (S35), thereby an activation enthalpy of ΔH‡ = 48 kJ/mol was
calculated and an activation entropy of ΔS‡ = –76 J/(mol K) was determined in two different experiments at
300 and 400 MHz measuring frequency with an estimated error of about 10%. In a third experiment, about 5%
of D2O was added to the DMSO-d6 solution whereby the NH proton nearly disappeared and the two signals at
about 7 ppm (H-3' and H-5') moved much closer together and formed higher order multiplets. The other two
Arkivoc 2020, part _, 0-0 Mainka, D. L. et al.
Page 6 ©AUTHOR(S)
olefinic signals at 8 ppm, however, allowed the determination of the inversion barrier, affording a similar
coalescence and quite similar parameters (ΔH‡ = 51.5 kJ/mol, ΔS‡ = –62 J/(mol K) in this solvent mix. This
coalescence is also observable in the proton decoupled 13C NMR spectra, when the carbon signals for the four
olefinic methine groups broaden extremely at temperatures above 320 K, leading – in practice in diluted
solutions – to a complete disappearance of these signals (spectra not shown).
Figure 1. a) temperature dependent 1H NMR spectra of Octenidine dihydrochloride in the range of 8.6 to 6.6
ppm from 300 to 400 Kb) simulated spectra with exchange rates.
For the barrier of E/Z isomerization of substituted imines, values between 65 and 100 kJ/mol are
reported.19 It is generally accepted that protonation catalyses this isomerization thus lowering the barrier. In
detailed investigations by Jennings20 and later by Johnson21 supported by theoretical calculations on
differently substituted imines, two different mechanisms for the isomerization have to be considered: i)
protonation followed by rotation and ii) nucleophilic catalysis via a tetrahedral intermediate. For Octenidine
dihydrochloride, both processes are conceivable, as the chloride counter anion can partake in this process ii),
however, more important is the conclusion from these calculations that substituents which stabilize the
positive charge by delocalization reduce the isomerization barrier by as much as 40 to 70 kJ/mol.21
The Eyring plot of temperature-dependent sequence of the 1H-spectra is accessible in the supplements.
FT-NIR-spectroscopic analysis of the resonance structures of Octenidine dihydrochloride
A second approach measured Octenidine dihydrochloride in solid state and in DMSO at different
temperatures via near infrared spectroscopy (NIR). The measurements aimed to see, whether the verified
dynamics observed in the NMR study are also discernible in the NIR spectra. NIR spectroscopic measurements
allow a detailed study of the dynamics of the resonance from approx. 30 °C to 60 °C (303.15-333.15 K) for the
Octenidine dihydrochloride in its solid-state. The measurements in DMSO were performed from 35 °C to 80 °C
(308.15-353.15 K) (see Fig. 5).
At first glance, in the spectra derived from the solid-state measurements, one area at approx. 5000 cm-
1 can be detected (see Fig. S39), where major differences between the samples at different temperatures,
appear. The pretreatment was done with a Standard Normal Variate (SNV),22 which is quite common to
Arkivoc 2020, part _, 0-0 Mainka, D. L. et al.
Page 7 ©AUTHOR(S)
diminish the influence of physical properties of the samples (e.g. particle size). The identified area is part of
the spectral region where combination bands can be found (especially: N–H; C–H and O–H).
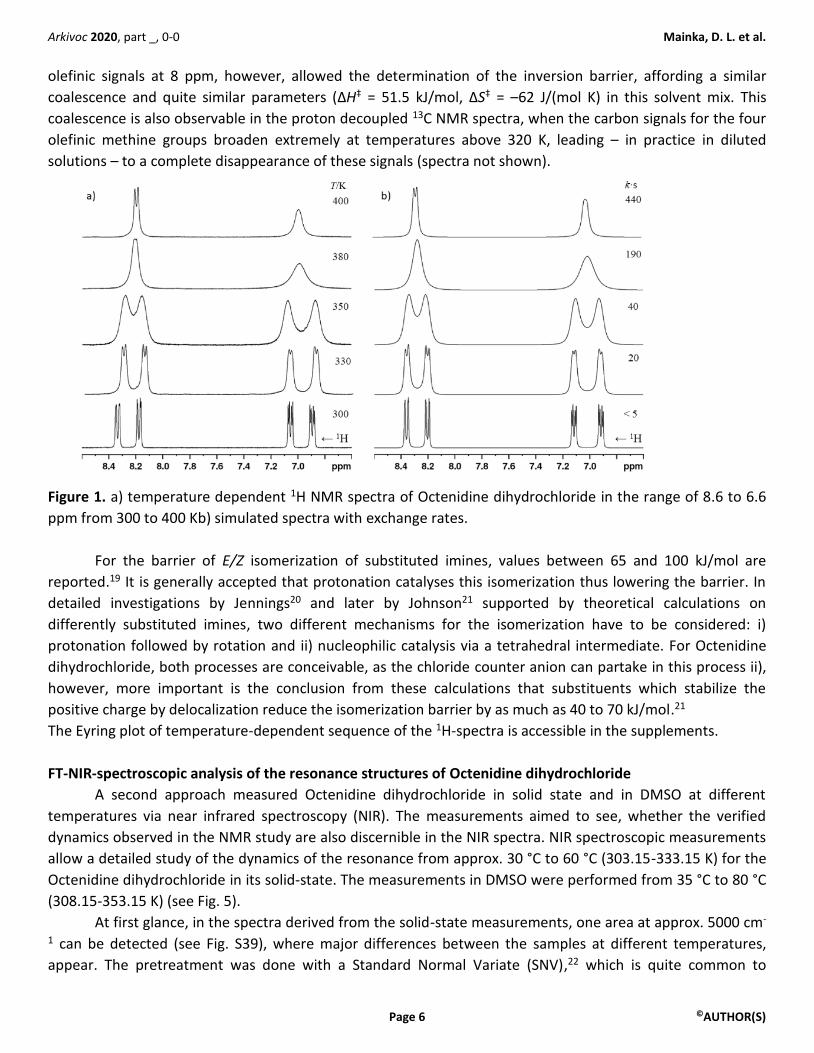
Figure 2. Pretreated NIR-spectra solid-state Octenidine dihydrochloride, SNV as pretreatment (Enlargement of
the significant section).
The spectral range between 4820 and 5480 cm-1, harbours two different peak areas (1.: 5250 to 5300
cm-1 and 2.: 4950 to 5100 cm-1), which behave quite differently to each other. The first one is the typical
region for the hydrogen bond in water (1. overtone in this case) and shows a relatively equal increase in
absorbance relative to the temperature of the samples. The second region shows a differing behaviour due to
a decrease in absorption especially around approx. 5032 cm-1. In this region the N–H-bond-signal, which
underlies certain molecular influences due to the mesomeric effect affecting the bond dipole moment, is
expected. A visual comparison of the different spectra at 5032 cm-1 shows a disjointed decrease (especially in
comparison to the H2O-bond) of the absorbance indicating a structural change and not only the influence of
temperature itself on the molecule. To prove this hypothesis a Principal Component Analysis (PCA) was
performed with spectral data from 4980 to 5120 cm-1. This is a common tool to analyse multivariate data in
order to explore the variances in the set and to reduce the information particularly in co-correlated data sets
(e.g. spectra). A spectrum with e.g. 1898 recorded data points represents an 1898-dimensional vector, which
can be transcribed in a matrix row. This is done with the whole data set, allowing one to explore the data set
in a vectorized space further on. The algorithm works by searching for the highest variance between the data
(the so-called principal component 1) and optimizing the presentation of the data towards the highest
variance(s). Secondly, a second principal component is searched in order to explain the remaining variance.
And subsequently the remaining variance is being appointed to a principal component (defined maximum: 100
iterations). The variance left unexplained at the end of this iterative process represents residuals. The data
was pretreated by SNV and secondly with a derivatization (second derivative, 17 smoothing points) by
polynomial fitting according to Savitzky-Golay’s procedure.23
Arkivoc 2020, part _, 0-0 Mainka, D. L. et al.
Page 8 ©AUTHOR(S)
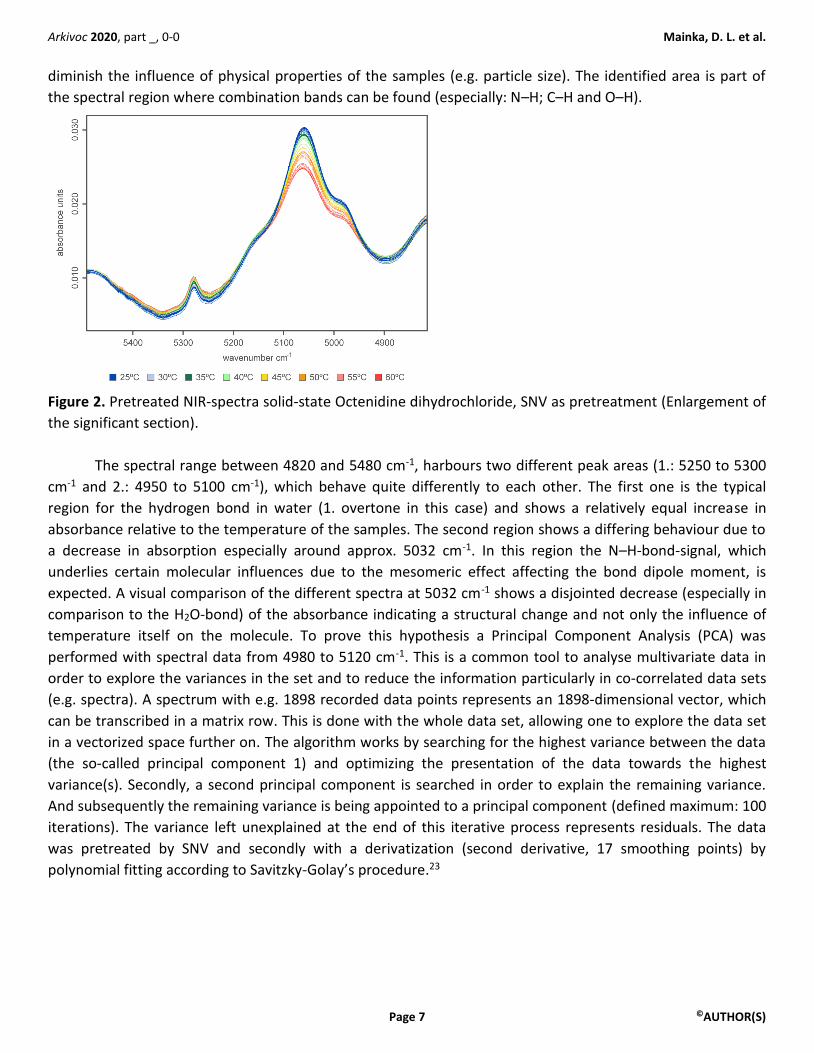
Figure 3. Pretreated NIR-spectra, solid-state Octenidine dihydrochloride (2. Derivative and SNV).
There are two reasons for this further pretreatment: On one hand the scattering correction by
eliminating linear and multiplicative base line shifts and on the other hand the higher resolution of
overlapping peaks. Thus, it was possible to define the spectral region impacted most by temperature changes.
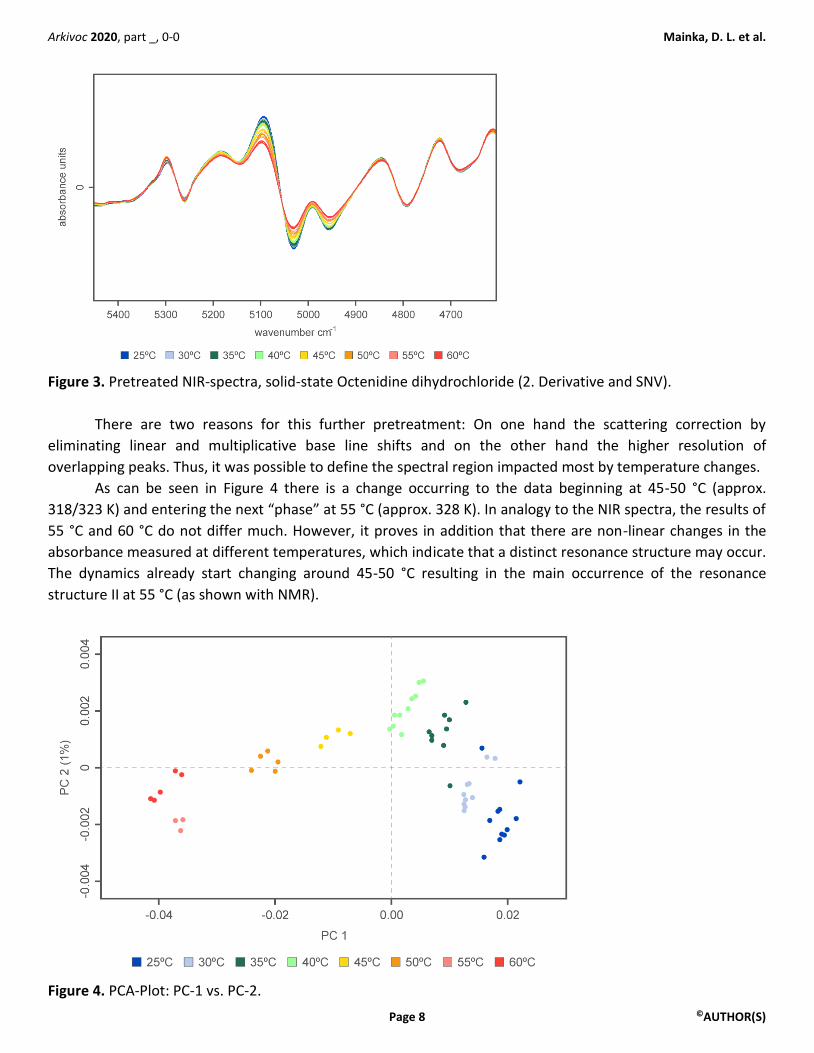
As can be seen in Figure 4 there is a change occurring to the data beginning at 45-50 °C (approx.
318/323 K) and entering the next “phase” at 55 °C (approx. 328 K). In analogy to the NIR spectra, the results of
55 °C and 60 °C do not differ much. However, it proves in addition that there are non-linear changes in the
absorbance measured at different temperatures, which indicate that a distinct resonance structure may occur.
The dynamics already start changing around 45-50 °C resulting in the main occurrence of the resonance
structure II at 55 °C (as shown with NMR).
Figure 4. PCA-Plot: PC-1 vs. PC-2.
Arkivoc 2020, part _, 0-0 Mainka, D. L. et al.
Page 9 ©AUTHOR(S)
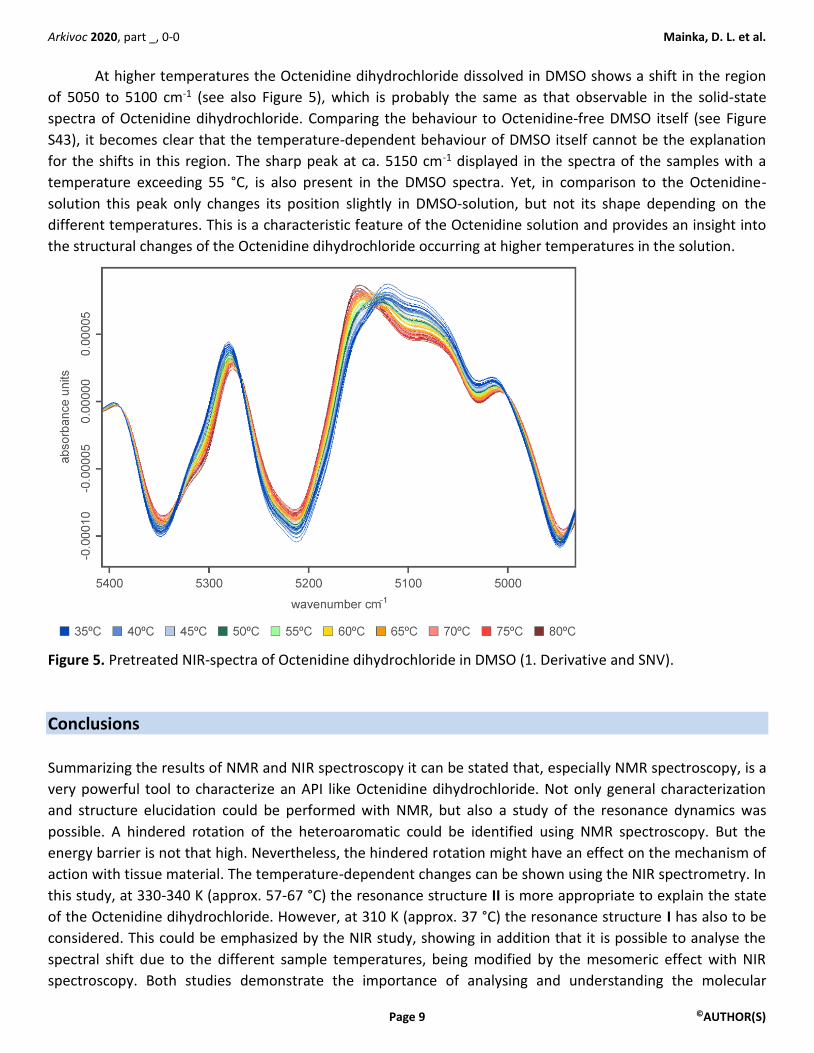
At higher temperatures the Octenidine dihydrochloride dissolved in DMSO shows a shift in the region
of 5050 to 5100 cm-1 (see also Figure 5), which is probably the same as that observable in the solid-state
spectra of Octenidine dihydrochloride. Comparing the behaviour to Octenidine-free DMSO itself (see Figure
S43), it becomes clear that the temperature-dependent behaviour of DMSO itself cannot be the explanation
for the shifts in this region. The sharp peak at ca. 5150 cm-1 displayed in the spectra of the samples with a
temperature exceeding 55 °C, is also present in the DMSO spectra. Yet, in comparison to the Octenidine-
solution this peak only changes its position slightly in DMSO-solution, but not its shape depending on the
different temperatures. This is a characteristic feature of the Octenidine solution and provides an insight into
the structural changes of the Octenidine dihydrochloride occurring at higher temperatures in the solution.
Figure 5. Pretreated NIR-spectra of Octenidine dihydrochloride in DMSO (1. Derivative and SNV).
Conclusions
Summarizing the results of NMR and NIR spectroscopy it can be stated that, especially NMR spectroscopy, is a
very powerful tool to characterize an API like Octenidine dihydrochloride. Not only general characterization
and structure elucidation could be performed with NMR, but also a study of the resonance dynamics was
possible. A hindered rotation of the heteroaromatic could be identified using NMR spectroscopy. But the
energy barrier is not that high. Nevertheless, the hindered rotation might have an effect on the mechanism of
action with tissue material. The temperature-dependent changes can be shown using the NIR spectrometry. In
this study, at 330-340 K (approx. 57-67 °C) the resonance structure II is more appropriate to explain the state
of the Octenidine dihydrochloride. However, at 310 K (approx. 37 °C) the resonance structure I has also to be
considered. This could be emphasized by the NIR study, showing in addition that it is possible to analyse the
spectral shift due to the different sample temperatures, being modified by the mesomeric effect with NIR
spectroscopy. Both studies demonstrate the importance of analysing and understanding the molecular
Arkivoc 2020, part _, 0-0 Mainka, D. L. et al.
Page 10 ©AUTHOR(S)
dynamics of the API, especially those effects which are easily detectable by NMR and NIR spectroscopy. A
more detailed investigation of the dynamics of the aliphatic chain and the complete conformational space
might be necessary, presumably only on a theoretical level. No apparent effects could be observed e.g. in the
NMR spectra in the investigated temperature range for the aliphatic signals. The question remains, whether
the adverse drug reactions of Octenidine dihydrochloride occurring when used in cavities and deep wounds
can be linked to the temperature-dependent resonance structures, especially the quaternary pyridinium ion.24
Further investigation of this topic is needed to provide further insights.
Experimental Section
NMR-spectroscopy. NMR spectra were measured either on a Bruker Avance III 300 spectrometer or a Bruker
Avance III 400 NMR spectrometer (Bruker, Rheinstetten, Germany) equipped with a variable temperature unit,
a standard probe head for the detection of proton and heteroatoms with deuterium lock (PABBO), gradient
unit and automatic tuning and shimming. Temperature calibration was done with a solution of methanol-d4.
Either DMSO-d6 (99.8 %) or CDCl3 was used (Eurisotop). For the measurements at 300 MHz a sample of 31 mg
of Octenidine dihydrochloride in 0.6 mL of DMSO-d6 and 150 mg in 0.6 mL of CDCl3 was used, at 400 MHz the
concentration was 12 mg in 0.6 mL of DMSO-d6. The higher concentrated solution of Octenidine in DMSO-d6
showed crystallization of the drug below 310 K, the solution of 12 mg of the drug was stable at 298 K, so
standard 1D and 2D spectra were recorded at 400 MHz using the pulse programs of the manufacturer’s pulse
program library at this temperature. For the temperature dependent 1H NMR spectra after reaching the
measuring temperature the sample was allowed to equilibrate for a further 3 minutes, and for each
temperature the probe head was automatically tuned and matched and the sample was reshimmed. For the
temperature measurements in DMSO-d6, a plot of the proton resonance shift of the water signal versus
temperature gives an excellent linear fit (R2 = 0.997) when using a calibration via the measuring frequency
setting, indicating that equilibrium temperature was achieved in the sample for all spectra. NMR spectra were
measured and calibrated to the internal standard or residual solvent signals, that is DMSO-d5 1H (400 MHz):
2.50 ppm, TMS 0.00 ppm, DMSO-d6 13C (100 MHz): 39.50 ppm, 15N (30.4 MHz): spectra were referenced to
external nitromethane in the corresponding solvent, measured in an HMBC experiment and set to 0.0 ppm.
Details of recalculating different reference shifts for the 15N nucleus are given in the supporting information
and are partly taken from25 and references therein.
Spectra were processed using Bruker TOPSPIN 3.6 with standard processing parameters for the
respective type of 1D or 2D spectrum. The temperature dependent NMR spectra were recorded with 64 K data
points and were processed with a Gauß multiplication and zero filling with a line broadening factor of –0.1 and
a Gauß multiplication factor of 0.1. 13C and 1H NMR chemical shifts were predicted for the mesomeric forms in
Fig. 1 using the online portals of the CSEARCH program (13C nucleus26) and the nmrdb.org website (1H
nucleus27). For the line shape analysis, the shift region in the range of 6.5 to 8.5 ppm was simulated and
dynamic processes were investigated using Spinworks 4.2.9,28 especially the DNMR3 calculation suite.29 The
results of the simulation were evaluated by the spectroscopist’s eye and the exchange rate constants were
determined. No further adjustments of the exchange rate constants were made after plotting in order to
improve the correlation. The Eyring plot of ln(k/T) versus 1/T was performed conveniently on Arrhenius and
Eyring calculations on Clymer’s website.30
Arkivoc 2020, part _, 0-0 Mainka, D. L. et al.
Page 11 ©AUTHOR(S)
In the supporting information a visualization of possible conformations of the two mesomeric
structures was achieved using OpenBabel 2.3.0 and AutoDockTools-1.5.4 via an internet portal31 and
presentation with Rasmol.32 The Hückel MO charge distribution was calculated with Marvin Sketch 19.18.33
NIR-spectroscopy. The measurements were performed using a TANGO-R and a TANGO-T FT-NIR-spectrometer
of Bruker Optics (Ettlingen, Germany). The solid Octenidine dihydrochloride was measured via diffuse
reflection spectroscopy, while the Octenidine dihydrochloride containing DMSO-solution was measured in
transmission (glass vials, 10 mm optical path length). The samples were tempered using a heating block
(Accuracy according to manufacturer: -/+2 °C). The software used for the measurements was OPUS 7.5 (Bruker
Optics, Ettlingen). For the purpose of analysis, the OPUS software was used as well as The Unscrambler X
(CAMO Analytics, Oslo). The PCA was performed with the Unscrambler X-software using the NIPALS algorithm
and the default parameters recommended by the software provider. All spectra were measured with 128
single scans and a spectral resolution of 8 cm-1.
Supplementary Material
Supporting information for this article is given via a link in the document.
References
1. Schmidt, J.; Zyba, V.; Jung, K.; Rinke, S.; Haak, R.; Mausberg, R. F.; Ziebolz, D. Drug Chem. Toxicol. 2016, 39,
322–330.
http://dx.doi.org/10.3109/01480545.2015.1121274
2. Schülke&Mayr GmbH, Rote-Hand-Brief zu Octenisept®, 2011, Dr. Jörg Siebert.
3. Hübner, N. O.; Siebert, J.; Kramer, A. Skin Pharmacol. Physiol. 2010, 23, 244–258.
http://dx.doi.org/10.1159/000314699
4. National Center for Biotechnology Information. PubChem Database. Cetylpyridinium chloride, CID=31239,
https://pubchem.ncbi.nlm.nih.gov/compound/Cetylpyridinium-chloride (accessed 17 December 2019).
5. Roberts, W. R.; Addy, M. J. Clin. Periodont. 1981, 8, 295–310.
https://doi.org/10.1111/j.1600-051X.1981.tb02040.x
6. Aires-de-Sousa, J.; Hemmer, M. C.; Gasteiger, J. Anal. Chem. 2002, 74, 80-90.
https://doi.org/10.1021/ac010737m 7. Binev, Y.; Marques, M. M. B.; Aires-de-Sousa, J. J. Chem. Inf. Model. 2007, 47, 2089-2097.
https://doi.org/10.1021/ci700172n 8. Schütz, V.; Purtuc, V.; Felsinger, S.; Robien, W. Fresenius J. Anal. Chem. 1997, 359, 33-41.
https://doi.org/10.1007/s002160050531
9. Kuhn, S.; Johnson, S. R. ACS Omega 2019, 4, 7323-7329.
https://doi.org/10.1021/acsomega.9b00488
10. Robien, W. Monatsh. Chem. 2019, 150, 927-932.
https://doi.org/10.1007/s00706-019-02407-5 11. Beltrame, P.; Cadoni, E.; Floris, C.; Gelli, G.; Lai, A. Spectrochim. Acta A 2002, 58, 2693–2697.
https://doi.org/10.1016/S1386-1425(02)00015-X
Arkivoc 2020, part _, 0-0 Mainka, D. L. et al.
Page 12 ©AUTHOR(S)
12. Dokalik, A.; Kalchhauser, H.; Mikenda, W.; Schweng, G. Magn. Res. Chem. 1999, 37, 895–902.
https://doi.org/10.1002/(SICI)1097-458X(199912)37:12<895::AID-MRC581>3.0.CO;2-7 13. Sammes, M. P.; Lai, T. F.; Katrizky, A. R.; Murugan, R.; Luce, H. J. Chem. Soc., Perkin Trans. 2 1985, 573–579.
https://doi.org/10.1039/P29850000573 14. Semenov, V. A.; Samultsev, D. O.; Krivdin, L. B. Magn. Res. Chem. 2015, 53, 433–441.
https://doi.org/10.1002/mrc.4231
15. Semenov, V. A.; Samultsev, D. O.; Krivdin, L. B. Magn. Res. Chem. 2018, 56, 727–739.
https://doi.org/10.1002/mrc.4721 16. Muccio, D. D.; Copan, W. G.; Abrahamson, W. W.; Mateescu, G. D. Org. Magn. Res. 1984, 22, 121–124.
https://doi.org/10.1002/mrc.1270220214 17. Schilf, W.; Kamieński, B.; Szady-Chełmieniecka, A.; Grech, E. J. Mol. Struct. 2004, 700, 105–108.
https://doi.org/10.1016/j.molstruc.2003.12.052
18. Günther, H. NMR spectroscopy, 3rd Ed., Wiley-VCH: Weinheim, 2013; pp 501–518.
19. Eliel, E.L.; Wilen, S.H.; Mander, L.N. Stereochemistry of Organic Compounds, Wiley: New York, 1994; pp
550–554.
https://doi.org/10.1002/9780470147306 20. Jennings, W. B.; Al-Showiman, S.; Tolley, M. S.; Boyd, D. R. J. Chem. Soc., Perkin Trans. 2 1975, 1535–1539.
https://doi.org/10.1039/P29750001535
21. Johnson, J. E.; Morales, N. M.; McAllister, M. A. J. Org. Chem. 2001, 66, 7979–7985.
https://doi.org/10.1021/jo010067k 22. Véstia, J.; Barroso, J. M.; Ferreira, H.; Gaspar, L.; Rato, A. E. Food C hem. 2019, 276, 71-76.
http://dx.doi.org/10.1016/j.foodchem.2018.09.116.
23. Rinnan, A.; van den Berg, F.; Engelsen, S. B. TrAC Trends in Analytical Chemistry 2009, 28, 1201-1222.
http://dx.doi.org/10.1016/j.trac.2009.07.007.
24. Hülsemann, W.; Habenicht, R. Handchir. Mikrochir. Plast. Chir. 2009, 41, 277-282.
http://dx.doi.org/10.1055/s-0029-1238282.
25. Martin, G.E.; SoIntseva, M.; Williams, A.J. In Application of 15N NMR Spectroscopy in Alkaloid Chemistry,
Modern Alkaloids; E. Fattorusso, O. Taglialatela-Scafati Eds.; Wiley-VCH: Weinheim, 2008; pp 409–471.
26. Haider, N.; Robien, W. CSEARCH Robot Referee. http://nmrpredict.orc.univie.ac.at/c13robot/robot.php
(accessed 01 July 2019).
27. Castillo, A. M.; Patiny M.; Wist, L. J. Magn. Res. 2011, 209, 123–130; http://www.nmrdb.org/ (accessed 01
July 2019).
28. Marat, K. SpinWorks 4.2.9, (accessed 01 July 2019), University of Manitoba.
29. Stephenson, D. S.; Binsch, G. J. Magn. Res. 1978, 30, 625–626.
30. Clymer, J. http://clymer.altervista.org/arr/ 2015, (accessed 01 July 2019).
31. Li, Q.; Xiang, J.-F.; Yang, Q.-F.; Sun, H.-X.; Guan, A.-J.; Tang, J.-L. Nucl. Acids Res., 2013, 41, D1115–D1123;
www.gl4db.org (accessed 01 July 2019).
32. Rasmol, Windows Version 2.7.5.2., www.rasmol.org (accessed 01 July 2019).
33. MarvinSketch 18.19, Huckel analysis plugin evaluation mode, www.chemaxon.com (accessed 01 July
2019).
This paper is an open access article distributed under the terms of the Creative Commons Attribution (CC BY) license
(http://creativecommons.org/licenses/by/4.0/)


![Synthetic Studies on 1-Azabicyclo[5.3.0]decane Alkaloids](https://img.dokumen.tips/doc/110x75/616cc042dbd8765d5f5c1a4e/synthetic-studies-on-1-azabicyclo530decane-alkaloids.jpg)