Embed Size (px)
Citation preview
International Research Journal of Engineering and Technology (IRJET) e-ISSN: 2395-0056
Volume: 02 Issue: 08 | Nov-2015 www.irjet.net p-ISSN: 2395-0072
© 2015, IRJET ISO 9001:2008 Certified Journal Page 1115
Temperature Dependence of Electrical Resistivity of Metals at Very
Low Temperatures
P. Poddar1 & Shekhar2
1Associate Professor, University Department of Physics Magadh University BodhGaya- 824234 Bihar (India)
2Research Scholar; University Department of Physics Magadh University, BodhGaya- 824234 Bihar (India)
Abstract
In this paper we have discussed on the electrical resistance ratio of metals in
respect of temperature dependence, magnitude and constancy in Debye temperatures
at very low temperature. Some earlier reports in this context and Bloch Grueneisen law
have also been reviewed in the light of present results. Here it has been concluded that
the B.G. formula is not justified fully in the metals under the present study in the said
temperature zone.
Key Words : Bloch’s law, Umklapp process, Phonon drag, B.G. formula, M.R., Debye
temperature.
1. Introduction : Various theoretical and experimental investigations at low
temperatures provide different ideas regarding the temperature dependence of
electrical resistivity and its closeness with standard theory in metals. It is worthwhile
to give a brief outline of the previous findings in these contexts. Garland and Bower
(1968)[1] have reported an AT2+BT5 variation of resistance of Indium below 4K and
have suggested that the T2 term is due to electron-electron scattering as discussed by
Peierls (1964) [2] and Ziman (1964) [3], Caplin and Rizzuto (1970) [4]. Deviation from
the Bloch’s expression has been observed by Woods (1956) [5] for sodium and the
results, so obtained are as follows :
ρi T5.0; for 9 T 15 K
ρi T6.0; for 4 T 9 K
International Research Journal of Engineering and Technology (IRJET) e-ISSN: 2395-0056
Volume: 02 Issue: 08 | Nov-2015 www.irjet.net p-ISSN: 2395-0072
© 2015, IRJET ISO 9001:2008 Certified Journal Page 1116
Aleksandrov and Dyakov (1963) [6] claimed T5 variation for Sn, In, Pb, Cd and Zn but
found that Al did not obey Bloch’s law[7] at temperature below 10K. Bloch’s formula[7]
for electron-phonon scattering for T 4.2 K is accepted with considerable confidence
[Ziman (1964)][3] and therefore, it is assumed that observed departure from T5 law is
due to other effects. Compbell (1971)[8] suggested that the problem could be resolved
by assuming a relaxation of conservation of momentum required in electron-phonon
scattering. Smith (1971) [9] rejected this and all other previous proposed explanations.
Keveh and Wiser (1971)[10] suggested by categorically that Bloch T5 law[7] does not
describe the low temperature electrical resistivity of any metal. They claim that the
results of Garland and Bower (1968)[1] as well as those of Woods (1956)[5] can be
precisely accounted by a theory which takes into account of Umklapp processes in the
scattering of the electron by phonons, the momentum dependence of electron-phonon
interaction scattering amplitude and also phonon drag. Dworin (1971)[11] considers
Caplin and Rizzuto’s result to be consequence of phonon drag.
The electrical resistivity of transition metals clearly exhibits the effect of
electron-electron scattering [Rice (1969)][12] although there is no strong evidence of it
in simple metals.
In the noble metals, a T3 term has been found in the resistivity of Ag between
1.4K and 4.2 K [Kos (1972)][13] and more recently in that of copper between 1K and
8.5K [Rumbo (1973)].[14] Wilson (1938)[15] showed that if at low temperature s-d
transitions are not prohibited by conservation laws, the resistivity should vary at T3.
However, Dworin (1971) [11] is against the T3 law. White and Woods (1959) [16]
predicted electrical resistivity of metals, viz, Cu, Au and Na except Mn follows a T5 law
developed by Bloch- Grueneisen (1930, 1933) [7,17] down to θ/5, θ being Debye
temperature although slight anomalies are shown by V, Cr, Fe, Co and Ni at low
temperatures. The resistivity of metals, Viz, Mn, Fe, Co, Ni, Pd, Pt and perhaps in W and
Nb at temperature below 10K vary nearly as T2 whose magnitude are given below.
International Research Journal of Engineering and Technology (IRJET) e-ISSN: 2395-0056
Volume: 02 Issue: 08 | Nov-2015 www.irjet.net p-ISSN: 2395-0072
© 2015, IRJET ISO 9001:2008 Certified Journal Page 1117
Mn (0.15T2) ; Nb (140×10-6 T2) ; W (10×10-6T2)
Fe (13×10-6T2) ; Co (13×10-6 T2) ; Ni (16×10-6T-2)
Pd (33×10-6T2) ; Pt (14×10-6 T-2)
However, they should not produces any apparent evidence of T2 dependence in other
elements.
Berry (1967)[18] investigated that the resistivity of platinum (Pt) may be
represented by T2 (electron-electron scattering term) plus second term proportional to
T4.7±0.2 in range of temperature 7K-17K and approximately T4.7±0.5 in the 3K-7K region.
De-Hass and De-Boer (1934)[19] observed T2 dependence in Pt and it was ascribed by
Baber (1937)[20] to the effect of electron-electron scattering. Olsen Bar (1958)[21] and
also Mendelssohn (1956)[22] have examined i (electrical resistivity) for elements Fe,
Co, Ni, Pt, Pd, and Rh below 25K and the experimental results of Olsen Bar (1958)[21]
also suggested approximately T2 variation at sufficiently low temperatures. White &
Woods (1959)[16] did not find T2 dependence down to about 10K in Zirconium and
Rhenium.
These previous results, discussed above, stimulated our interest in the
investigation of behaviour of electrical resistivity at very low temperature. In this paper
an attempt has been made in this direction.
2. Analysis of data from International Critical Table (1929) in the reference of
B.G. formula:
Resistance ratio RT/R273 reported earlier [International Critical Table (1929)][23] with
and without impurity contribution in some metals; viz, Cd, K, Zn, Hg, Pt & Au, in
temperature interval below about 0.1θ has been analysed. In the process of analysis we
have plotted log (RT/R273) against log T. A linear relationship with probability 99% is
found in each case. The slope and intercept for each curve were obtained on the basis of
least square method [Yong (1962)][24]. The equations for RT/R273 (with and without
International Research Journal of Engineering and Technology (IRJET) e-ISSN: 2395-0056
Volume: 02 Issue: 08 | Nov-2015 www.irjet.net p-ISSN: 2395-0072
© 2015, IRJET ISO 9001:2008 Certified Journal Page 1118
impurity contribution) followed from the logarithmic plots are given under [Where
RT/R273 = WT)].
Cd : WiT = 3.90084 × 10⁻⁶ T2.8539325 (1)
R.T. = 13 20.42K ; (Without I.C.)
Cd : WT = 1.0326 × 10⁻⁵ T2.5581395 (2)
R.T. = 13 20.42K ; (With I.C.)
K : WT = 1.6178 × 10⁻⁵ T1.6969696 (3)
R.T. = 13 20.16K ; (With I.C.)
K : WiT = 5.6247 × 10⁻⁶ T2.7227 (4)
R.T. = 13 20.16K ; (Without I.C.)
Zn : WiT = 1.8588 × 10⁻⁴ T2.0754716 (5)
R.T. = 13 20.4K ; (Without I.C.)
Hg : WT = 1.2598 × 10⁻⁴ T3.5294117 (6)
R.T. = 4.06 4.24 K ; (With I.C.)
Pt : WT = 3.5188 × 10⁻⁷ T2.7686 (7)
R.T. = 4 13K ; (With I.C.)
Au : WiT = 1.700353 × 10⁻⁸ T4.25 (8)
R.T. = 4 13K; (Without I.C.)
(In above equations, the impurity contribution has been eliminated by applying simple
M.R. RiT/R273 = WiT where impurity contribution has been eliminated)
Further some recent data of resistance ratio WiT [Wilson (1965)[24], Berry
(1963)[25], De-Hass, De- Boer & Vanden berg (1934)[26], Mac Donald and
Mendelssohn (1950) [27] and Berry (1967)][18] have been analysed on the basis of
logarithmic plots, A linear relationship in between log (WiT) and log T with probability
99 % is found in each case. Least square method [Yong (1962)[24], Fisher and Yats
International Research Journal of Engineering and Technology (IRJET) e-ISSN: 2395-0056
Volume: 02 Issue: 08 | Nov-2015 www.irjet.net p-ISSN: 2395-0072
© 2015, IRJET ISO 9001:2008 Certified Journal Page 1119
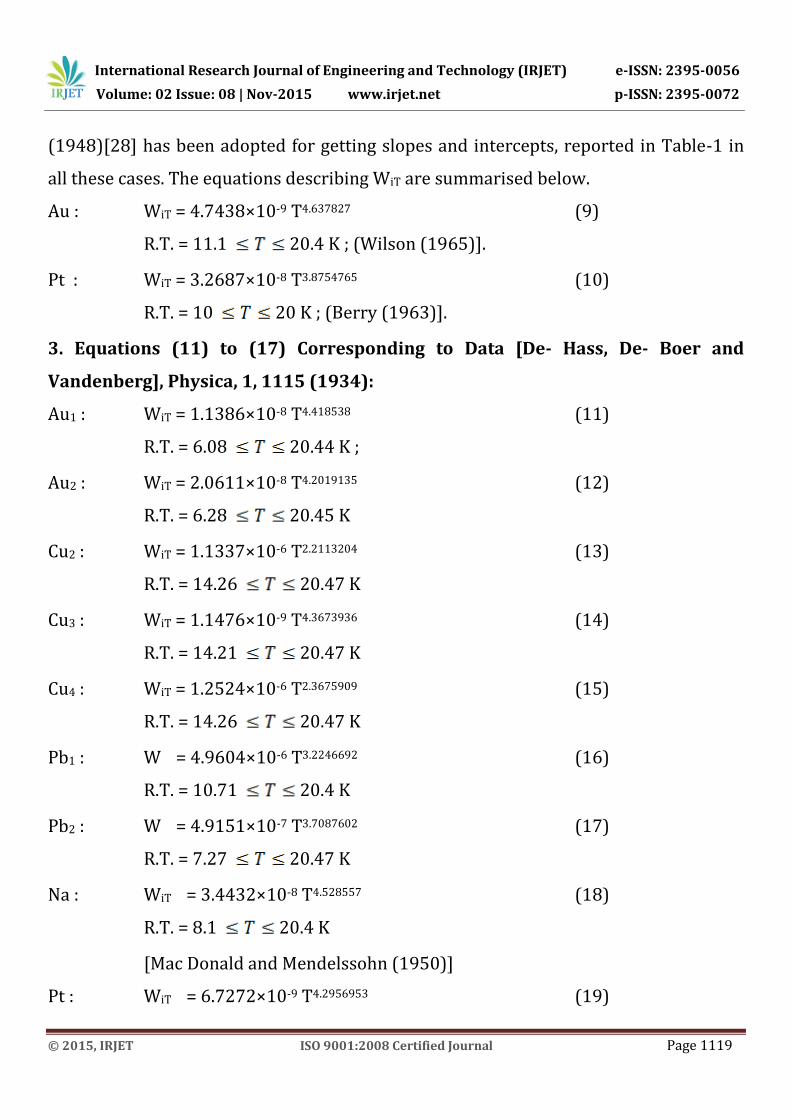
(1948)[28] has been adopted for getting slopes and intercepts, reported in Table-1 in
all these cases. The equations describing WiT are summarised below.
Au : WiT = 4.7438×10⁻⁹ T4.637827 (9)
R.T. = 11.1 20.4 K ; (Wilson (1965)].
Pt : WiT = 3.2687×10⁻⁸ T3.8754765 (10)
R.T. = 10 20 K ; (Berry (1963)].
3. Equations (11) to (17) Corresponding to Data [De- Hass, De- Boer and
Vandenberg], Physica, 1, 1115 (1934):
Au1 : WiT = 1.1386×10⁻⁸ T4.418538 (11)
R.T. = 6.08 20.44 K ;
Au2 : WiT = 2.0611×10⁻⁸ T4.2019135 (12)
R.T. = 6.28 20.45 K
Cu2 : WiT = 1.1337×10⁻⁶ T2.2113204 (13)
R.T. = 14.26 20.47 K
Cu3 : WiT = 1.1476×10⁻⁹ T4.3673936 (14)
R.T. = 14.21 20.47 K
Cu4 : WiT = 1.2524×10⁻⁶ T2.3675909 (15)
R.T. = 14.26 20.47 K
Pb1 : W = 4.9604×10⁻⁶ T3.2246692 (16)
R.T. = 10.71 20.4 K
Pb2 : W = 4.9151×10⁻⁷ T3.7087602 (17)
R.T. = 7.27 20.47 K
Na : WiT = 3.4432×10⁻⁸ T4.528557 (18)
R.T. = 8.1 20.4 K
[Mac Donald and Mendelssohn (1950)]
Pt : WiT = 6.7272×10⁻⁹ T4.2956953 (19)
International Research Journal of Engineering and Technology (IRJET) e-ISSN: 2395-0056
Volume: 02 Issue: 08 | Nov-2015 www.irjet.net p-ISSN: 2395-0072
© 2015, IRJET ISO 9001:2008 Certified Journal Page 1120
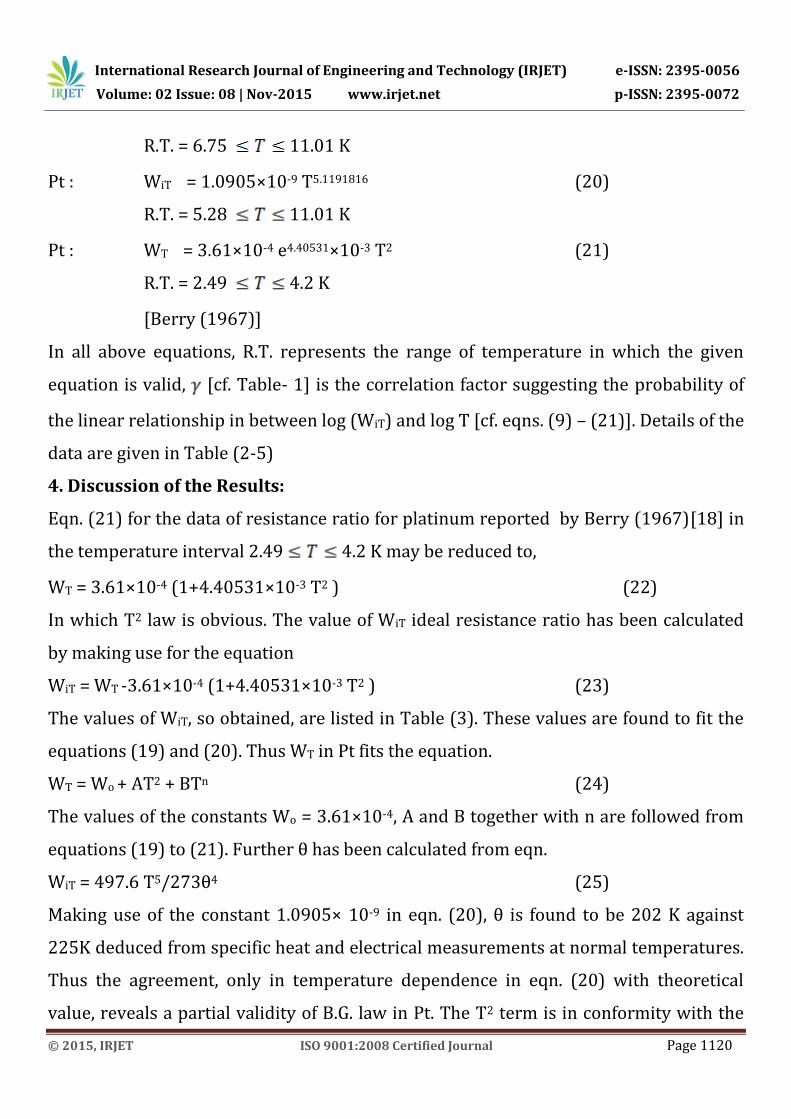
R.T. = 6.75 11.01 K
Pt : WiT = 1.0905×10⁻⁹ T5.1191816 (20)
R.T. = 5.28 11.01 K
Pt : WT = 3.61×10⁻⁴ e4.40531×10-3 T2 (21)
R.T. = 2.49 4.2 K
[Berry (1967)]
In all above equations, R.T. represents the range of temperature in which the given
equation is valid, [cf. Table- 1] is the correlation factor suggesting the probability of
the linear relationship in between log (WiT) and log T [cf. eqns. (9) – (21)]. Details of the
data are given in Table (2-5)
4. Discussion of the Results:
Eqn. (21) for the data of resistance ratio for platinum reported by Berry (1967)[18] in
the temperature interval 2.49 4.2 K may be reduced to,
WT = 3.61×10⁻⁴ (1+4.40531×10⁻³ T2 ) (22)
In which T2 law is obvious. The value of WiT ideal resistance ratio has been calculated
by making use for the equation
WiT = WT -3.61×10⁻⁴ (1+4.40531×10⁻³ T2 ) (23)
The values of WiT, so obtained, are listed in Table (3). These values are found to fit the
equations (19) and (20). Thus WT in Pt fits the equation.
WT = Wo + AT2 + BTn (24)
The values of the constants Wo = 3.61×10⁻⁴, A and B together with n are followed from
equations (19) to (21). Further θ has been calculated from eqn.
WiT = 497.6 T5/273θ4 (25)
Making use of the constant 1.0905× 10⁻⁹ in eqn. (20), θ is found to be 202 K against
225K deduced from specific heat and electrical measurements at normal temperatures.
Thus the agreement, only in temperature dependence in eqn. (20) with theoretical
value, reveals a partial validity of B.G. law in Pt. The T2 term is in conformity with the

International Research Journal of Engineering and Technology (IRJET) e-ISSN: 2395-0056
Volume: 02 Issue: 08 | Nov-2015 www.irjet.net p-ISSN: 2395-0072
© 2015, IRJET ISO 9001:2008 Certified Journal Page 1121
earlier report [White and Woods (1959)][16]. The values of WiT listed in Table- 4 for
the specimen Au1, Au2, Cu2, Cu3, Cu4 have been obtained from WT [De-Hass (1934)][19]
making use of the eqn.
WiT = WT- Wo (26)
Where Wo is the minimum observed value of WT in the specimen concerned. This
process has been based on the simple M.R. and vanishing contribution due to other
factors such as scattering of electrons by electrons etc. In case of Pb1 and Pb2 the value
of resistance ratio WT has been taken for WiT because the minimum value of it is not
available in the literature [De-Hass, De-Boer and Vandenberg (1934)][26]. Subscript
1,2,3 and 4 refer to the different specimen of a metal.
In Pb1 & Pb2 [cf. eqn. (17)] the temperature dependence agrees well with the
theoretical values. However, the constants in eqns. (16) & (17) deviate appreciably.
The present conclusion in Pb1 is in conformity with the earlier report [De-Hass, De-
Boer and Vandenberg (1934)][26] in respect of temperature dependence only.
Behaviour of resistivity in Cu3 [cf. eqn. (14)] is close to the B.G. formula if only the
consideration of temperature dependence is taken into account. Below T= 0.07θ, the
standard theory requires the constant, pertaining to the equation referring to T5 law for
θ= 310K, to be 1.93655×10⁻¹⁰, however, the present analysis find it to be 1.1476×10⁻⁹
[cf eqn. (14)] suggesting a large departure. In Cu2 and Cu4 [cf. eqn. (13) & (15)] the
agreement with the standard theory is not acceptable at all. If only the temperature
dependence is taken into account, then the behaviour of resistivity is Au1 and Au2 [cf.
eqns. (11) (12)] appears to tend towards the theoretical prediction. In Na [cf. eqn. (18)]
the agreement in temperature dependence is tolerable through the constant term
appearing in eqn. (18), is greater by more than three times [cf. eqn. (5)]. Thus a partial
agreement is reached in 8.1 20.44 K. Data for Pt [White and Words (1959)][16]
do not obey B.G. formula [cf. eqn. (10)]. A typical set of data for WiT i.e., resistivity ratio
[Wilson (1965)][24] for Au is close to the theoretical value in respect of temperature
International Research Journal of Engineering and Technology (IRJET) e-ISSN: 2395-0056
Volume: 02 Issue: 08 | Nov-2015 www.irjet.net p-ISSN: 2395-0072
© 2015, IRJET ISO 9001:2008 Certified Journal Page 1122
dependence. However, the constant 4.7438×10⁻⁹ in eqn. (9) is more than two times the
value in the standard theory if θ is taken as 170 K. The behaviour of some data of WT
excluding impurity contribution reported in International critical Tables of numerical
data (1929) [23] for Cd, K, Zn, Hg, Pt and Au does not obey B.G. formula [cf. eqn. (1) to
(8)] though in these cases also simple M.R. has been applied to obtain the ideal
resistance ratio in the present analysis. Thus the observation, reported by White and
Woods (1959)[16] in Pt is close to the result in the present analysis in respect of the
existence of T2 term, but a deviation occurs in the magnitude of the constant associated
with T2 [cf. eqn. (21)]. The earlier value is 14×10-6 and the present value is
15.903133×10⁻⁷. An indication of T3 variation in Cd, [cf. eqn. (1)] and Pt [cf. eqn. (7)] is
found. On the basis of above results, the sound validity of B.G. formula may not be
claimed in metals under consideration. This is in conformity with the conclusion
reached by Kaveh & Wiser (1971)[10]. The departure from the standard theory at least
in noble and alkali metals may not be based on electron-electron scattering or
interband conduction phenomena theory. In metals, discussed above, in which
temperature dependence is close to the theoretical value, the divergence may be
probably in using the same value of the constant A١ appearing in the equations for
electrical resistivity at low and high temperatures. The other factor which may cause
the departure from the standard theory may be the variation of Debye temperature
with temperature [Blackmann (1941)][29]. Since T2 or T3 variation is expected only at
extremely low temperatures the deviation, so obtained, may not be interpreted in
terms of these factors also[30-33].
5. Conclusions :
On the basis of above results, it may be concluded that the B.G. formula is not
justified fully in the metals under the present study in the said temperature zone. Any
regular law to meet the magnitude as well as temperature dependence in consistant
International Research Journal of Engineering and Technology (IRJET) e-ISSN: 2395-0056
Volume: 02 Issue: 08 | Nov-2015 www.irjet.net p-ISSN: 2395-0072
© 2015, IRJET ISO 9001:2008 Certified Journal Page 1123
with the experimental findings at low temperature cannot be suggested in the
reference of standard theories.
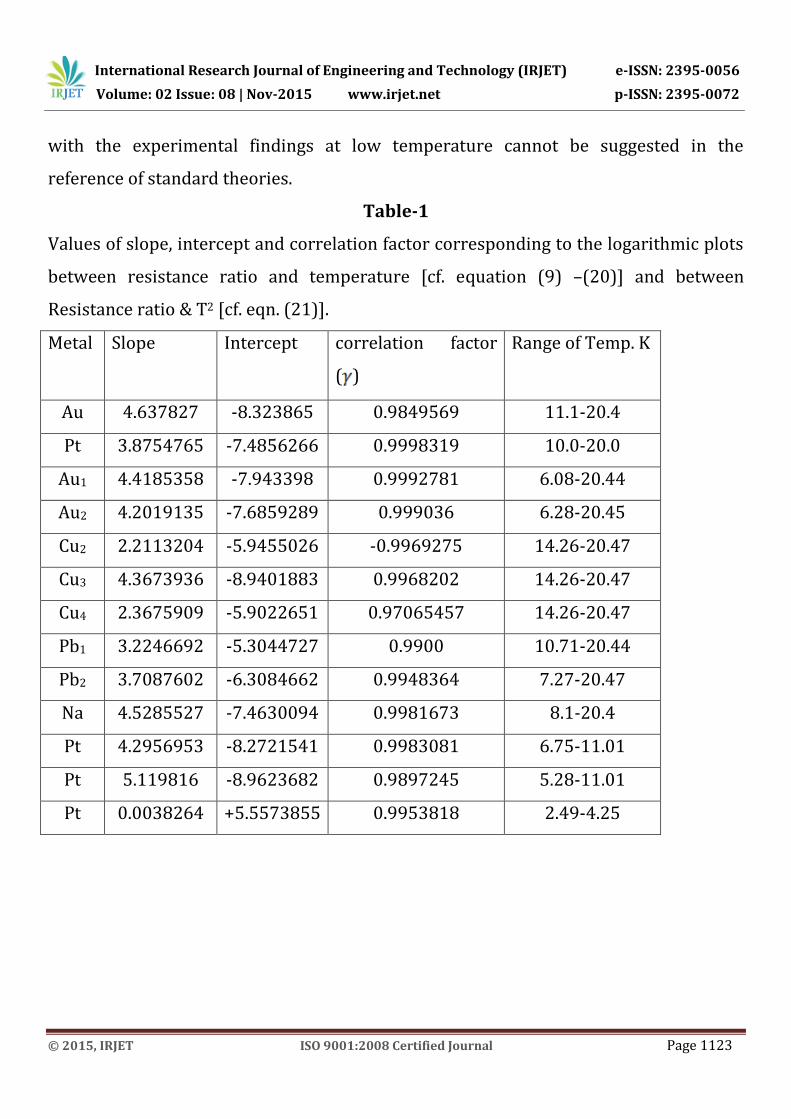
Table-1
Values of slope, intercept and correlation factor corresponding to the logarithmic plots
between resistance ratio and temperature [cf. equation (9) –(20)] and between
Resistance ratio & T2 [cf. eqn. (21)].
Metal Slope Intercept correlation factor
( )
Range of Temp. K
Au 4.637827 -8.323865 0.9849569 11.1-20.4
Pt 3.8754765 -7.4856266 0.9998319 10.0-20.0
Au1 4.4185358 -7.943398 0.9992781 6.08-20.44
Au2 4.2019135 -7.6859289 0.999036 6.28-20.45
Cu2 2.2113204 -5.9455026 -0.9969275 14.26-20.47
Cu3 4.3673936 -8.9401883 0.9968202 14.26-20.47
Cu4 2.3675909 -5.9022651 0.97065457 14.26-20.47
Pb1 3.2246692 -5.3044727 0.9900 10.71-20.44
Pb2 3.7087602 -6.3084662 0.9948364 7.27-20.47
Na 4.5285527 -7.4630094 0.9981673 8.1-20.4
Pt 4.2956953 -8.2721541 0.9983081 6.75-11.01
Pt 5.119816 -8.9623682 0.9897245 5.28-11.01
Pt 0.0038264 +5.5573855 0.9953818 2.49-4.25

International Research Journal of Engineering and Technology (IRJET) e-ISSN: 2395-0056
Volume: 02 Issue: 08 | Nov-2015 www.irjet.net p-ISSN: 2395-0072
© 2015, IRJET ISO 9001:2008 Certified Journal Page 1124
Table-2
Values of Electrical Resistance ratio WiT for Pt Berry (1963), of Eqn. (10)
Temp. K WiT ×106
10 251.6
12 489.7
14 884.5
16 1502.5
18 2408.7
20 3660.7
Table – 3
Values of Electrical resistance ratio WT& WiT [cf. eqn. (19) – (21)] R.J. Berry, Can. J.
Phys., 45, 1963 (1967) for Pt.
Temp. K WT ×106 WiT ×106
2.49 371.24
3 375.45
3.36 379.03
3.5 380.56
4.25 390.40
5.28 409.48 4.1446
6.75 452.62 24.95601
7.41 479.86 38.52216
8.51 538.92 62.74938
8.82 559.25 74.53574
9.07 577.00 85.17306
9.96 650.84 132.07838
11.01 764.1 210.3227
International Research Journal of Engineering and Technology (IRJET) e-ISSN: 2395-0056
Volume: 02 Issue: 08 | Nov-2015 www.irjet.net p-ISSN: 2395-0072
© 2015, IRJET ISO 9001:2008 Certified Journal Page 1125
WiT = WT – 3.61×10⁻⁴ (1+4.40531×10⁻³ T2)
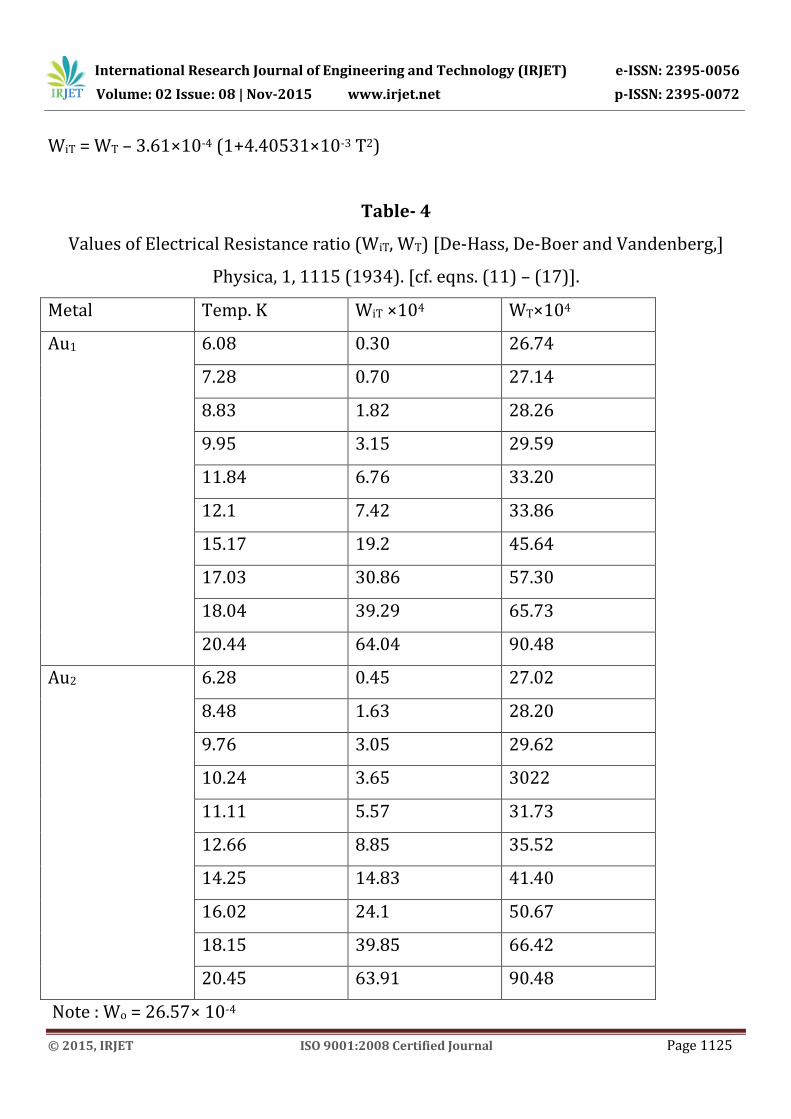
Table- 4
Values of Electrical Resistance ratio (WiT, WT) [De-Hass, De-Boer and Vandenberg,]
Physica, 1, 1115 (1934). [cf. eqns. (11) – (17)].
Metal Temp. K WiT ×104 WT×104
Au1 6.08 0.30 26.74
7.28 0.70 27.14
8.83 1.82 28.26
9.95 3.15 29.59
11.84 6.76 33.20
12.1 7.42 33.86
15.17 19.2 45.64
17.03 30.86 57.30
18.04 39.29 65.73
20.44 64.04 90.48
Au2 6.28 0.45 27.02
8.48 1.63 28.20
9.76 3.05 29.62
10.24 3.65 3022
11.11 5.57 31.73
12.66 8.85 35.52
14.25 14.83 41.40
16.02 24.1 50.67
18.15 39.85 66.42
20.45 63.91 90.48
Note : Wo = 26.57× 10⁻⁴
International Research Journal of Engineering and Technology (IRJET) e-ISSN: 2395-0056
Volume: 02 Issue: 08 | Nov-2015 www.irjet.net p-ISSN: 2395-0072
© 2015, IRJET ISO 9001:2008 Certified Journal Page 1126
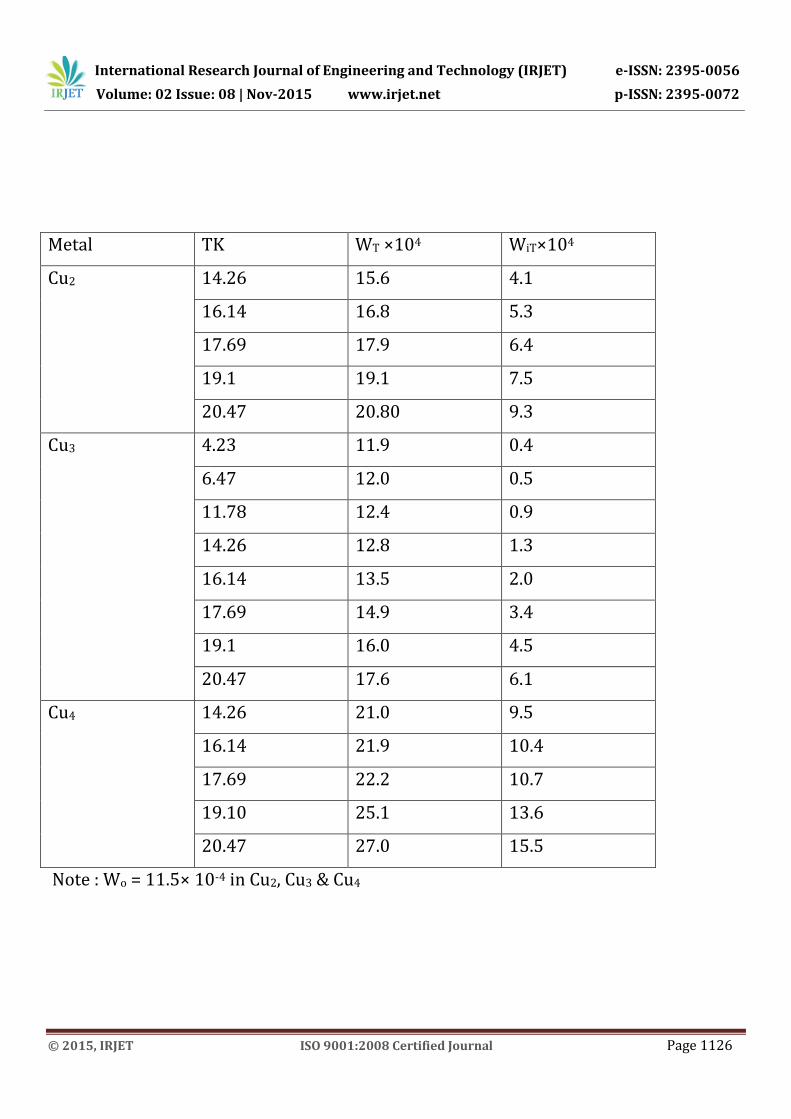
Metal TK WT ×104 WiT×104
Cu2 14.26 15.6 4.1
16.14 16.8 5.3
17.69 17.9 6.4
19.1 19.1 7.5
20.47 20.80 9.3
Cu3 4.23 11.9 0.4
6.47 12.0 0.5
11.78 12.4 0.9
14.26 12.8 1.3
16.14 13.5 2.0
17.69 14.9 3.4
19.1 16.0 4.5
20.47 17.6 6.1
Cu4 14.26 21.0 9.5
16.14 21.9 10.4
17.69 22.2 10.7
19.10 25.1 13.6
20.47 27.0 15.5
Note : Wo = 11.5× 10⁻⁴ in Cu2, Cu3 & Cu4
International Research Journal of Engineering and Technology (IRJET) e-ISSN: 2395-0056
Volume: 02 Issue: 08 | Nov-2015 www.irjet.net p-ISSN: 2395-0072
© 2015, IRJET ISO 9001:2008 Certified Journal Page 1127
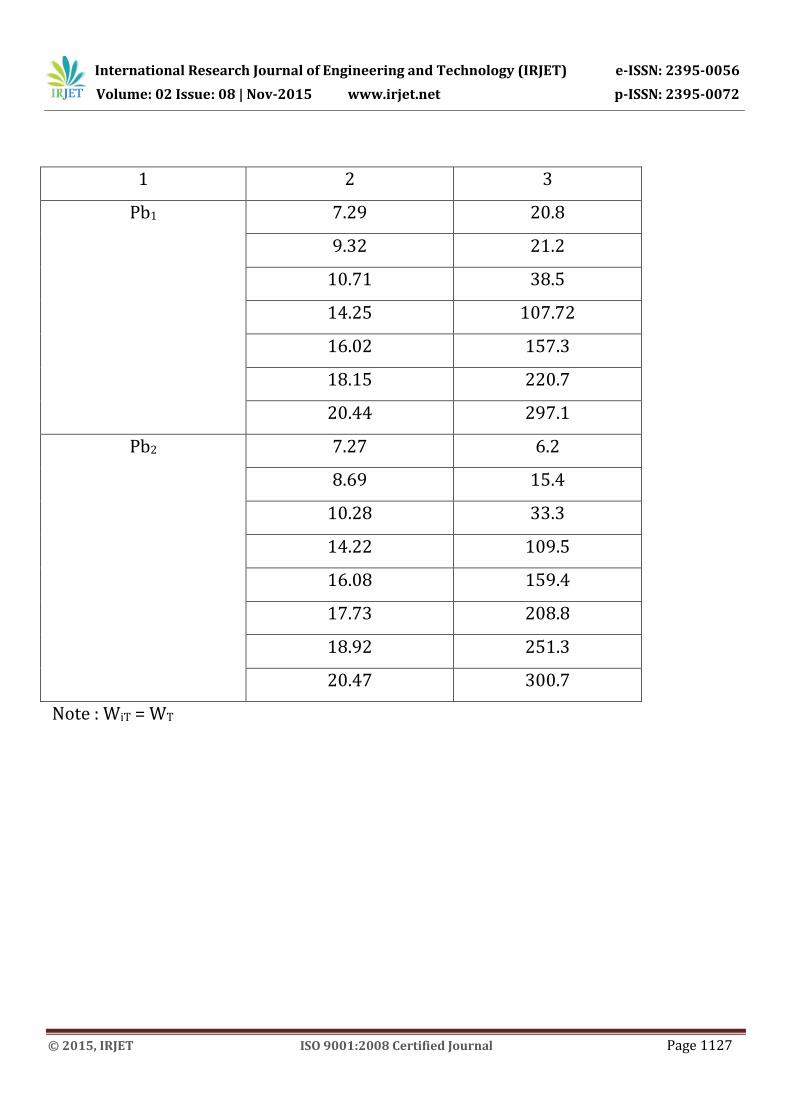
1 2 3
Pb1 7.29 20.8
9.32 21.2
10.71 38.5
14.25 107.72
16.02 157.3
18.15 220.7
20.44 297.1
Pb2 7.27 6.2
8.69 15.4
10.28 33.3
14.22 109.5
16.08 159.4
17.73 208.8
18.92 251.3
20.47 300.7
Note : WiT = WT

International Research Journal of Engineering and Technology (IRJET) e-ISSN: 2395-0056
Volume: 02 Issue: 08 | Nov-2015 www.irjet.net p-ISSN: 2395-0072
© 2015, IRJET ISO 9001:2008 Certified Journal Page 1128
Table- 5
Values of Electrical resistance ratio WiT [D.K.C. Mac Donald & K. Mendelssohn] Proc.
Roy. Soc. 4202, 103 (1950) [cf. eqn. (18)].
Metal Temperature K WiT ×104
Na 20.4 0.00326
15.95 0.0098
14.1 0.00051
13.1 0.00036
11.05 0.00017
9.65 0.0001
8.1 0.00005
References
[1] J.C. Garland and R. Bower Phys. Rev. letters 21 1007 , 1968
[2] R. Peierl Quantum theory of solids, oxford University, Press, London p. 137., 1964
[3] J. M. Ziman Principle of theory of solids, Cambridge University, Press, 1964
[4] Caplin and C. Rizzuto J. Phys. C3 L 117, 1970.
[5] S.B. Woods Can. J. Physics 34 223, 1956
[6] B.N. Aleksandrov & T.G. Dyakov Sov. Phys. J. Exper. Theor. Phys. 16 603, 1963
[7] F. Bloch Z.Phys. 59, 208, 1930.
[8] L.L. Campbell Phys. Rev. Letter 26 239, 1971
[9] J. Smith J. Phys Solid Stat Phy 4, L145 1971
[10] M. Kaveh and N. Wiser Phys. Rev. Letter 26 635, 1971
[11] L. Dworin Phys. Rev. Letters 26 1244, 1971.
[12] O.K. Rice Phys. Rev. Letters 23 1109, 1969
[13] J.F. Kos Physica Status Solids, 52 389, 1972
[14] E.R. Rumbo J. Phys. F; Met Phys 3 L9, 1973
International Research Journal of Engineering and Technology (IRJET) e-ISSN: 2395-0056
Volume: 02 Issue: 08 | Nov-2015 www.irjet.net p-ISSN: 2395-0072
© 2015, IRJET ISO 9001:2008 Certified Journal Page 1129
[15] A.H. Wilson Proc. Roy. Soc. 167, 580, 1938.
[16] G.K. White & S.B. Woods Phil. Trans. Roy. Soc. A 251, 273, 1959.
[17] E. Grueneisen Ann. Phys. 16, 530, 1933
[18] R.J. Berry Can. J. Phys. 45 , 1693, 1967
[19] W.T. De-Hass and J. De-Boer Physica 1 609, 1934.
[20] W.G. Baber Proc. Roy. Soc. 158, 383, 1937.
[21] Olsen Bar Helv. Phy. Acta, 31 1193, 1958.
[22] K Mendelssohn Can. J. Phys. 34 1315, 1956
[23] International Critical Table of Numerical data, Physics, Chemistry and
Technology, Vol. VI, 1st Edn. (Mc-Graw-Hill Book Co. Inc. New York) 1929.
[24] A.H. Wilson The Theory of Metals; Cambridge University Press, Cambridge 2nd
Edn. Chap- 9, P- 269 Table- IX 1 & 2, 1965.
[25] R.J. Berry Can. J. Phys. 51 946, 1963.
[26] W.J. De-Hass and J. De-Boer & G.J. Vanden berg Physica 1 1115, 1934.
[27] D.K.C. Mac Donald and K. Mendelssohn Proc. Roy Soc. A 209, 103. 1950.
[28] R.A. Fisher & F. Yates, Statistical Table for Biological, Agricultural and Medical
research (Oliver and Boyd Ltd. Edinburgh). Table VI, 1948.
[29] M. Blackman Repts Progr. Phys., 8, 11, 1941
[30] S. Kumar, A.K. Barnwal & P. Poddar J. Pure Appl & Ind. Phys. Vol. 3(2), 88. 2013.
[31] S. Kumar & P. Poddar J. Pure Appl & Ind. Phys. Vol 5 (7), 197, 2015.
[32] P. Poddar & A.K. Barnwal J. Pure Appl & Ind. Phys. Vol 2(3), 242, 2012.
[33] P. Poddar J. Chem. Bio. Phy. Sci. Sec. A. Vol.- 5 No. 3 1728, 2015.