Embed Size (px)
Citation preview

Temperature Data Analysis
Average 7 day max by River Mile
20.9 20.6 20.2
18.9
21.5
15.9
18.6 18.9
18.2
20.6
20.6
10
12
14
16
18
20
22
24
0 5 10 15 20 25 30 35 40
River Mile
Avg
erag
e 7
Day
Max
for J
uly
2000
North Fork 7 Day Max Moving Averages
10.0
12.0
14.0
16.0
18.0
20.0
22.0
24.0
6/30/2000 7/5/2000 7/10/2000 7/15/2000 7/20/2000
Date
Tem
pera
ture
(Cel
cius
)
NF@Cooper 4
NF@Bennet 10.5
NF@Hervey 19.5
NFabvMoon 34
Statewide std.
7 Day Moving Average Plots
• Representing multiple sites on a single chart creates a better understanding of the watershed
• Using river mile is an easy way to set the geographic picture without creating maps.
• If you have access to GIS, maps with different sized/colored markers are excellent.
• 7-day average maximum graphs are excellent for showing general behavior of sites.
Continuous Temperature Data Analysis andPresentation
Summary Statistics by River Mile

Temperature Data Analysis
Temperature Data Processing Tools
HYDROSTAT_Simple.xlsTEMPTURE.xls
vs.

Temperature Data Analysis
Temperature Data Processing Tools
HYDROSTAT_Simple.xlsTEMPTURE.xls
Good
• Plots data for viewing, monthly graphs and 7 day moving average.• Calculates 7 day moving average values• Uses format needed for submittal to DEQ, same as downloaded from Vemcos
Good
• Calculates summary statistics from multiple sites at one time• Relatively small in size, can save summary table• Has instruction manual
Bad
• Only works with one site at a time• Relatively large files• Need to export graphs as images to use in reportsBad
• Creates no graphs for reviewing data• Vemco files require more messaging to get into required format• Must clip data to whole days

Temperature Data Analysis
Temperature Data Processing Tools:Comparison of input files
TEMPTURE.xls HYDROSTAT_Simple.xls
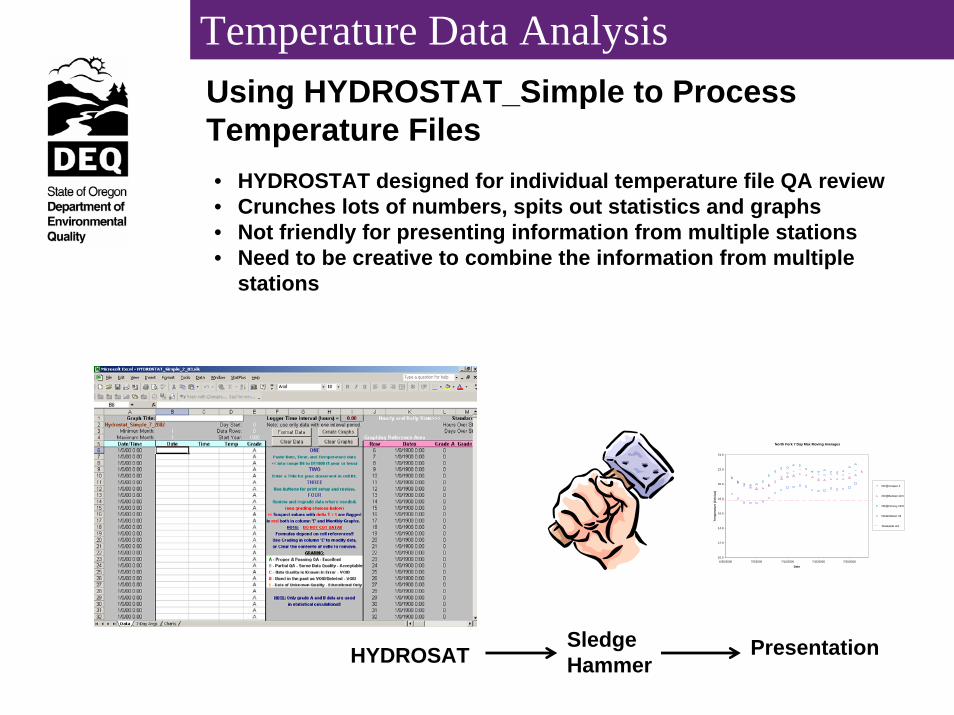
Temperature Data AnalysisUsing HYDROSTAT_Simple to Process Temperature Files• HYDROSTAT designed for individual temperature file QA review• Crunches lots of numbers, spits out statistics and graphs• Not friendly for presenting information from multiple stations• Need to be creative to combine the information from multiple
stations
North Fork 7 Day Max Moving Averages
10.0
12.0
14.0
16.0
18.0
20.0
22.0
24.0
6/30/2000 7/5/2000 7/10/2000 7/15/2000 7/20/2000
Date
Tem
pera
ture
(Cel
cius
)
NF@Cooper 4
NF@Bennet 10.5
NF@Hervey 19.5
NFabvMoon 34
Statewide std.
SledgeHammer
PresentationHYDROSAT

Temperature Data AnalysisUsing HYDROSTAT_Simple to Process Temperature Files
Create a workbook outside HYDROSTAT where you can copy the information you want to present.
Include all the information you might want to present, including meta data like, river mile, stream discharge measurements, etc.
NOTE: This analysis assumes you have an identified range of data with known deployment and retrieval times and known data quality

Temperature Data Analysis
Open a raw data file. Make sure your data is in the right format and in separate columns.
Data format for the Excel fileis determined during Mililog setup
• comma delimited• date: mm/dd/yyyy• time: hh:mm:ss• temperature: TT.TT (Units must
match HYDROSTAT to calculate statistics correctly.
Using HYDROSTAT_Simple to Process Temperature Files

Temperature Data AnalysisUsing HYDROSTAT_Simple to Process Temperature Files
Cut and paste raw data file values into HYDROSTAT• Make sure the date and time get combined in column A
• Statistics will only be calculated for results with a data quality of A or B. Make sure it is all graded.
If the date and time don’t combine
properly, the program will not
work. Check your formats.
Make sure each result is graded
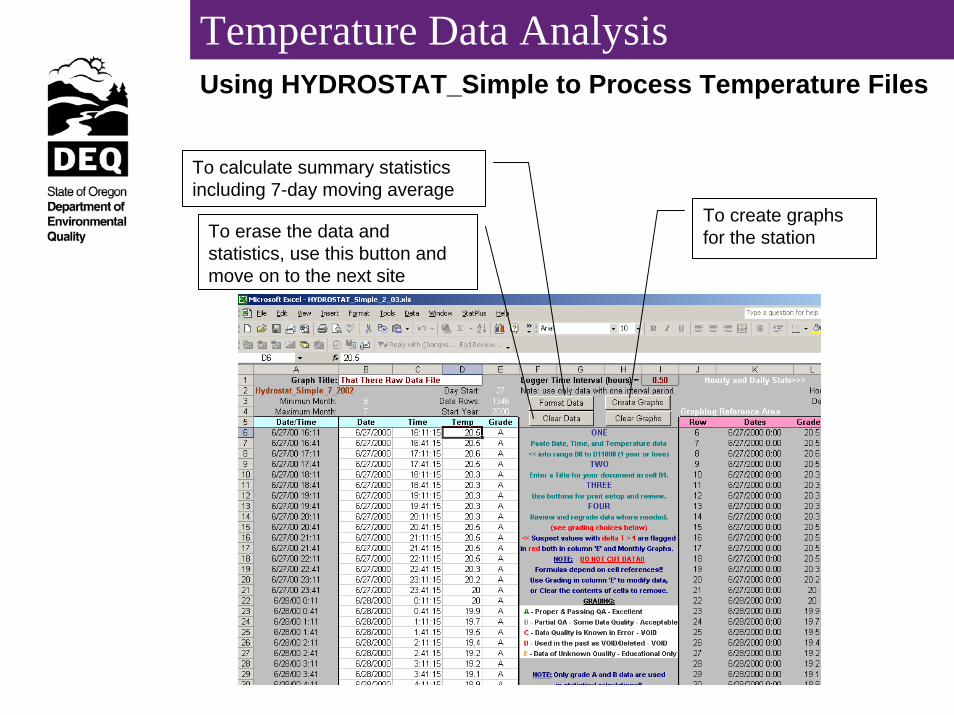
Temperature Data AnalysisUsing HYDROSTAT_Simple to Process Temperature Files
To create graphs for the station
To calculate summary statistics including 7-day moving average
To erase the data and statistics, use this button and move on to the next site
Temperature Data AnalysisUsing HYDROSTAT_Simple to Process Temperature Files
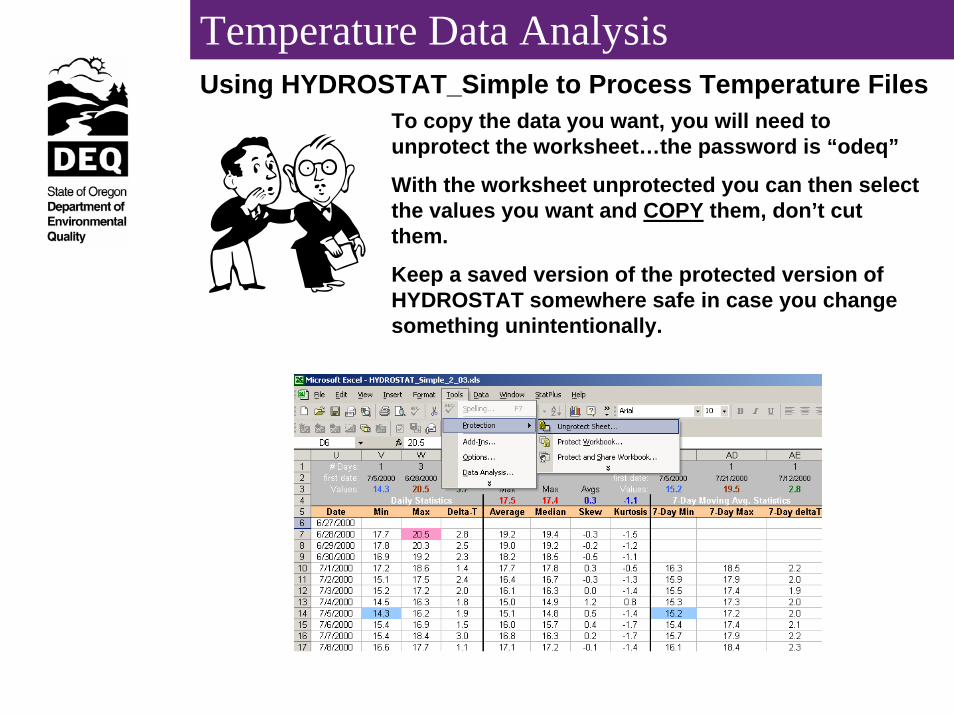
To copy the data you want, you will need to unprotect the worksheet…the password is “odeq”
With the worksheet unprotected you can then select the values you want and COPY them, don’t cut them.
Keep a saved version of the protected version of HYDROSTAT somewhere safe in case you change something unintentionally.

Temperature Data AnalysisUsing HYDROSTAT_Simple to Process Temperature Files
“Paste Special” all of your values from HYDROSTAT into your workbook as values, or you will end up with cell references.
The summary data will now be in your personal workbook and is ready for presentation.
Clear Data in HYDROSTAT to work on the next stations data.
When pasting 7 day moving averages,
make sure you line up the data with the correct
date.

Temperature Data AnalysisUsing HYDROSTAT_Simple to Process Temperature Files
To Create 7-Day Average Maximum or summary statistics vs. river mile charts, use Excel XY scatter plots.
Average 7 day max by River Mile
20.9 20.6 20.2
18.9
21.5
15.9
18.6 18.9
18.2
20.6
20.6
10
12
14
16
18
20
22
24
0 5 10 15 20 25 30 35 40
River Mile
Avg
erag
e 7
Day
Max
for J
uly
2000
North Fork 7 Day Max Moving Averages
10.0
12.0
14.0
16.0
18.0
20.0
22.0
24.0
6/30/2000 7/5/2000 7/10/2000 7/15/2000 7/20/2000
Date
Tem
pera
ture
(Cel
cius
)
NF@Cooper 4
NF@Bennet 10.5
NF@Hervey 19.5
NFabvMoon 34
Statewide std.

Temperature Data Analysis
Exercise:Process 3 raw temperature files from the accompanying CD and
present summary information using charts and/or tables.1. Create a spreadsheet for summary data from the 3 sites with
column and row headings for the summary data you want to present. The dates for the data set are 7/1/2000 to 7/22/2000.
2. Open HYDROSTAT_Simple.3. Open a text file and follow the instructions above to calculate
statistics with HYDROSTAT.4. Copy the relevant information into the summary spreadsheet
you created in step 1.5. Clear the data from HYDROSTAT and repeat steps 3 & 4 for
each of the other files.6. Create graphs or tables that think will best be able to describe
the data.7. Identify something interesting to you that the data represents
and select one or two presentation pieces (graphs or tables) that best display this interesting characteristic.
8. You will be asked to share what you found and what problems you had with the rest of the group.

Temperature Data Analysis