Embed Size (px)
Citation preview

Menoufia UniversityFaculty of Electronic Engineering, Menouf
Department of Communications Engineering
A Master Thesis of
Teletraffic Analysis of the Next-Generation Integrated
Terrestrial/Satellite Mobile Radio Networks
by
Waleed Eid Al-Hanafy
(B.Sc.)
ABSTRACT
As mobile service demands increase dramatically, interest in cellular system structure withhierarchical terrestrial/satellite architecture has emerged. Without satellite participation,terrestrial cellular systems would be primarily restricted to regional service. For the networkto have seamless radio coverage and sufficient capacity to accommodate anticipated highteletraffic demand, integration of satellite network and terrestrial cellular system is indis-pensable. In this research project, a space/terrestrial mobile radio communication networkwith multiple hierarchical cellular overlays is considered. In the lowest hierarchical level, mi-crocells serve the highest teletraffic density, while overlaying macrocells serve both calls fromareas that are difficult to be covered by microcells, as well as overflow traffic from microcells.At the highest hierarchical level, satellites focus their spotbeams to serve satellite-only userssparsely distributed and act as teletraffic relief for the terrestrial segment. At each hierarchi-cal level different priority schemes are used to privilege handoff requests. Reserved channelscheme (RCS) is applied in the microcell layer, both RCS and sub-rating scheme (SRS) areused in the macrocell layer, while in the spotbeam cell layer, RCS, SRS, and queuing prio-rity scheme (QPS) are implemented. An analytical teletraffic model is developed to evaluatethe proposed architecture. Numerical results are presented and discussed for the new callblocking, handoff failure, forced termination and noncompletion probabilities. The workpresented in the thesis will help understanding the next-generation communication networkand thereby allow better engineering of its resources.
2002

Menoufia UniversityFaculty of Electronic Engineering, MenoufDepartment of Communications Engineering
Teletraffic Analysis of the Next-Generation Integrated
Terrestrial/Satellite Mobile Radio Networks
by
Waleed Eid Al-Hanafy
(B.Sc.)
A Master Thesis Submitted in Partial Fulfilment of the Requirements
for the M.Sc. Degree in Communications Engineering,
Faculty of Electronic Engineering-Menouf, Menoufia University.
SUPERVISORS:
Dr. Sami A. El-Dolil [ ]Assoc. Prof., Department of Electrical Communications EngineeringFaculty of Electronic Engineering-Menouf, Menoufia University
Dr. Mostafa A. Nofal [ ]Assoc. Prof., Department of Electrical Communications EngineeringFaculty of Electronic Engineering-Menouf, Menoufia University
2002

Menoufia UniversityFaculty of Electronic Engineering, MenoufDepartment of Communications Engineering
Teletraffic Analysis of the Next-Generation Integrated
Terrestrial/Satellite Mobile Radio Networks
by
Waleed Eid Al-Hanafy
(B.Sc.)
A Master Thesis Submitted in Partial Fulfilment of the Requirements
for the M.Sc. Degree in Communications Engineering,
Faculty of Electronic Engineering-Menouf, Menoufia University.
APPROVED BY:
Dr. Said M. El-Noby [ ]Prof., Department of Electrical EngineeringFaculty of Engineering, Alexandria University
Dr. Saber H. Zainud-Deen [ ]Prof., Department of Electrical Communications EngineeringFaculty of Electronic Engineering-Menouf, Menoufia University
Dr. Sami A. El-Dolil [ ]Assoc. Prof., Department of Electrical Communications EngineeringFaculty of Electronic Engineering-Menouf, Menoufia University
Dr. Mostafa A. Nofal [ ]Assoc. Prof., Department of Electrical Communications EngineeringFaculty of Electronic Engineering-Menouf, Menoufia University
2002
Acknowledgements
I want to express my gratitude to Dr. Sami El-Dolil and Dr. Mostafa Nofal who helped me
greatly collecting the background of the research and thank them for comprehensive guidance
with following me up and evaluating my research.
As for Dr. Sami, he did his best, spending very much time supervising me step by step.
As for Dr. Mostafa, he strongly supported me, programming my research modelling and
overcoming any obstacles that faced me.
All thanks to their great support and careful valuable revision of the thesis.
Finally, I would like to thank my professors and colleagues in the faculty especially in
my department.
iv

Note on Publication
A paper extracted from the research work of the MSc thesis
Paper title: “An Integrated Space/Terrestrial Cellular Architecture with Dif-
ferent Priority Schemes for Global Mobile Communications”
Authors: Sami El-Dolil, Mostafa Nofal, and Waleed Al-Hanafy
A paper is accepted for presentation and publication in the pro-
ceeding of the 55th IEEE Vehicular Technology Conference VTC
Spring 2002 , Birmingham, AL, USA, May, 2002.
Also accepted in proceeding of the 19th National Radio Science
Conference, NRSC, Alexandria, Egypt, March, 2002.
v

List of Symbols
K cluster sizeC/R carrier to interference ratioγ propagation path loss exponentD/R frequency reuse distanceAs satellite coverage areaα minimum elevation angleθ earth central angleh satellite altitudeRe radius of the earthCm no. of microcells per macrocellCM no. of macrocells per spotbeam cellNm no. of channels per microcellNmh no. of channels reserved for handoff per microcellNM no. of channels per macrocellNMo no. of channels reserved for handoff overflow per macrocellNMh no. of channels reserved for handoff per macrocellNs no. of channels per spotbeam cellNso no. of channels reserved for handoff overflow per spotbeam cellNsh no. of channels reserved for handoff per spotbeam cellλm new call rate per microcellλmh handoff call rate per microcellλM new call rate per macrocellλMon new call rate overflowed to macrocellλMoh handoff call rate overflowed to macrocellλMh handoff call rate per macrocellλs new call rate per spotbeam cellλson new call rate overflowed to spotbeam cellλsoh handoff call rate overflowed to spotbeam cellλsh handoff call rate per spotbeam cellT̄M average call duration time = 1/µMT̄n1 average residing time of a new call in microcell = 1/µn1T̄h1 average residing time of a handoff call in microcell = 1/µh1T̄n2 average residing time of a new call in macrocell = 1/µn2T̄h2 average residing time of a handoff call in macrocell = 1/µh2T̄n3 average residing time of a new call in spotbeam cell = 1/µn3T̄h3 average residing time of a handoff call in spotbeam cell = 1/µh3
vi

vii
T̄q average queuing time within the overlapping area for the spotbeam cell = 1/µqT̄H1 average channel holding time in the microcell = 1/µH1
T̄H2 average channel holding time in the macrocell = 1/µH2
T̄H3 average channel holding time in the spotbeam cell = 1/µH3
PN1 probability that a successfully initiated call in the microcell requires a handoffPH1 probability that a handoff call in the microcell will require more handoff
PN2probability that a successfully initiated call in the macrocell requires ahandoff
PH2 probability that a handoff call in the microcell will require more handoff
PN3probability that a successfully initiated call in the spotbeam cell requires ahandoff
PH3 probability that a handoff call in the spotbeam cell will require more handoffPBm new call blocking probability in the microcellPfhm handoff failure probability in the microcellPBMon overflowed new call blocking probability in the macrocellPBMoh overflowed handoff call blocking probability in the macrocellPBM new call blocking probability in the macrocellPfhM handoff failure probability in the macrocellPBson overflowed new call blocking probability in the spotbeam cellPBsoh overflowed handoff call blocking probability in the spotbeam cellPBs new call blocking probability in the spotbeam cellPfhs handoff failure probability in the spotbeam cellPBdo overall blocking probability of the dual-mode users within microcellPBdw weighted blocking probability of the dual-mode usersPfhdo overall handoff failure probability of the dual-mode users within microcellPfhdw weighted handoff failure probability of the dual-mode usersPBto overall blocking probability of the terrestrial-only users within microcellPBtw weighted blocking probability of the terrestrial-only usersPfhto overall handoff failure probability of the terrestrial-only users within microcellPfhtw weighted handoff failure probability of the terrestrial-only usersPBso overall blocking probability of the satellite-only usersPBsw weighted blocking probability of the satellite-only usersPfhso overall handoff failure probability of the satellite-only usersPfhsw weighted handoff failure probability of the satellite-only users
PFdoverall forced termination probability of the dual-mode users within amicrocell
PFtoverall forced termination probability of the terrestrial-only users within amicrocell
PFs overall forced termination probability of the satellite-only usersPncd noncompleted call probability of the dual-mode usersPnct noncompleted call probability of the terrestrial-only usersPncs noncompleted call probability of the satellite-only users
Contents
Acknowledgements iv
Note on Publication v
List of Symbols vi
1 Introduction 11.1 Objective of the Thesis . . . . . . . . . . . . . . . . . . . . . . . . . . . . . 21.2 Organization of the Thesis . . . . . . . . . . . . . . . . . . . . . . . . . . . 2
2 Overview of Mobile Radio Systems 42.1 Introduction . . . . . . . . . . . . . . . . . . . . . . . . . . . . . . . . . . . 42.2 Evolution of Mobile Communication Systems . . . . . . . . . . . . . . . . . 5
2.2.1 First generation . . . . . . . . . . . . . . . . . . . . . . . . . . . . . 52.2.2 Second generation . . . . . . . . . . . . . . . . . . . . . . . . . . . . 62.2.3 Third generation . . . . . . . . . . . . . . . . . . . . . . . . . . . . . 6
2.3 Design Concepts of Cellular Mobile Radio Systems . . . . . . . . . . . . . . 72.3.1 Frequency reuse . . . . . . . . . . . . . . . . . . . . . . . . . . . . . 92.3.2 Cell splitting . . . . . . . . . . . . . . . . . . . . . . . . . . . . . . . 112.3.3 Sectorization and trunking efficiency . . . . . . . . . . . . . . . . . . 122.3.4 Handoff mechanism . . . . . . . . . . . . . . . . . . . . . . . . . . . 13
2.4 Elements of Cellular Mobile Radio Systems . . . . . . . . . . . . . . . . . . 142.4.1 The mobile station (MS) . . . . . . . . . . . . . . . . . . . . . . . . 142.4.2 The base station (BS) . . . . . . . . . . . . . . . . . . . . . . . . . . 152.4.3 The mobile switching center (MSC) . . . . . . . . . . . . . . . . . . 15
2.5 Space-based Systems . . . . . . . . . . . . . . . . . . . . . . . . . . . . . . . 162.5.1 Satellite orbits . . . . . . . . . . . . . . . . . . . . . . . . . . . . . . 172.5.2 GEO Vs LEO satellites . . . . . . . . . . . . . . . . . . . . . . . . . 182.5.3 Satellite constellations . . . . . . . . . . . . . . . . . . . . . . . . . . 19
2.6 Mobile Radio Channel Characteristics . . . . . . . . . . . . . . . . . . . . . 212.7 Channel Assignment Schemes . . . . . . . . . . . . . . . . . . . . . . . . . . 24
2.7.1 Fixed channel assignment (FCA) . . . . . . . . . . . . . . . . . . . . 252.7.2 Dynamic channel assignment (DCA) . . . . . . . . . . . . . . . . . . 262.7.3 Hybrid channel assignment (HCA) . . . . . . . . . . . . . . . . . . . 27
3 Teletraffic Analysis of Mobile Radio Networks 293.1 Introduction . . . . . . . . . . . . . . . . . . . . . . . . . . . . . . . . . . . 293.2 Fundamentals of Teletraffic Theory . . . . . . . . . . . . . . . . . . . . . . . 30
3.2.1 Basic teletraffic terms . . . . . . . . . . . . . . . . . . . . . . . . . . 30
viii

CONTENTS ix
3.2.2 General birth-death process . . . . . . . . . . . . . . . . . . . . . . . 323.3 Some Basic Models . . . . . . . . . . . . . . . . . . . . . . . . . . . . . . . . 33
3.3.1 Erlang loss formula BCC (random traffic) . . . . . . . . . . . . . . . 333.3.2 Engset formula BCC (quasi-random traffic) . . . . . . . . . . . . . . 353.3.3 Erlang delay formula BCD . . . . . . . . . . . . . . . . . . . . . . . 363.3.4 The Poisson formula BCH . . . . . . . . . . . . . . . . . . . . . . . . 38
3.4 Teletraffic Theory for Cellular Mobile Radio . . . . . . . . . . . . . . . . . . 39
4 Mobility Management in Multilayered Systems 424.1 Introduction . . . . . . . . . . . . . . . . . . . . . . . . . . . . . . . . . . . . 424.2 Mobility Management . . . . . . . . . . . . . . . . . . . . . . . . . . . . . . 43
4.2.1 Location management . . . . . . . . . . . . . . . . . . . . . . . . . . 444.2.1.1 Location registration . . . . . . . . . . . . . . . . . . . . . 454.2.1.2 Call delivery . . . . . . . . . . . . . . . . . . . . . . . . . . 46
4.2.2 Handoff management . . . . . . . . . . . . . . . . . . . . . . . . . . 494.3 Location Registration and Call Delivery Research . . . . . . . . . . . . . . . 53
4.3.1 Centralized database structure . . . . . . . . . . . . . . . . . . . . . 544.3.1.1 Pointer forwarding . . . . . . . . . . . . . . . . . . . . . . . 544.3.1.2 Local anchoring . . . . . . . . . . . . . . . . . . . . . . . . 55
4.3.2 Distributed database structure . . . . . . . . . . . . . . . . . . . . . 554.3.2.1 A fully distributed database scheme . . . . . . . . . . . . . 564.3.2.2 Partitioning . . . . . . . . . . . . . . . . . . . . . . . . . . 56
5 Teletraffic Modeling of an Integrated Space/Terrestrial Cellular Architec-ture with Different Priority Schemes 595.1 Introduction . . . . . . . . . . . . . . . . . . . . . . . . . . . . . . . . . . . 595.2 Teletraffic Modelling of Voice Communications . . . . . . . . . . . . . . . . 60
5.2.1 Model description . . . . . . . . . . . . . . . . . . . . . . . . . . . . 605.2.2 Performance analysis . . . . . . . . . . . . . . . . . . . . . . . . . . 63
5.3 Teletraffic Modelling of Voice and Data Services . . . . . . . . . . . . . . . . 765.3.1 Model description . . . . . . . . . . . . . . . . . . . . . . . . . . . . 765.3.2 Performance analysis . . . . . . . . . . . . . . . . . . . . . . . . . . 77
5.3.2.1 Microcell level . . . . . . . . . . . . . . . . . . . . . . . . . 775.3.2.2 Macrocell level . . . . . . . . . . . . . . . . . . . . . . . . . 805.3.2.3 Spotbeam cell level . . . . . . . . . . . . . . . . . . . . . . . 82
6 Results and Discussion 866.1 Numerical Results for Providing Voice Service Only . . . . . . . . . . . . . . 866.2 Parametric Effects . . . . . . . . . . . . . . . . . . . . . . . . . . . . . . . . 87
6.2.1 Effects of reserved channel scheme, sub-rating scheme, and queueingpriority scheme . . . . . . . . . . . . . . . . . . . . . . . . . . . . . . 87
6.2.2 Effect of number of overlaid microcells . . . . . . . . . . . . . . . . . 936.2.3 Effect of number of overlaid macrocells . . . . . . . . . . . . . . . . . 936.2.4 Effect of infinite queue . . . . . . . . . . . . . . . . . . . . . . . . . . 956.2.5 Effect of handoff area size . . . . . . . . . . . . . . . . . . . . . . . . 95
6.3 Numerical Results for Voice/Data Integration . . . . . . . . . . . . . . . . . 98

CONTENTS x
7 Conclusion and Future Work 1007.1 Conclusion . . . . . . . . . . . . . . . . . . . . . . . . . . . . . . . . . . . . 1007.2 Future Work . . . . . . . . . . . . . . . . . . . . . . . . . . . . . . . . . . . 100
List of Figures 102
References 104

Chapter 1
Introduction
The ultimate aim for next-generation mobile radio network is to enable mobile users to
initiate and receive calls with any one, anywhere and at anytime using a single telecommu-
nication device. The terrestrial-based cellular system is a high-density architecture that is
able to provide wireless connections to regions with high teletraffic demand. For sparsely
populated and less-privilege areas, implementing terrestrial systems is not economically fea-
sible. Moreover, aeronautical and maritime communities can not be served by terrestrial
systems. Therefore, terrestrial systems have limited coverage and expensive infrastructure.
On the other hand, satellite systems can provide wide-area or global coverage. They do an
excellent job of providing connections everywhere, but can not compete with terrestrial ar-
chitectures in providing high capacity due to their large created cells on the earth’s surface.
It is thus evident that if the future global telecommunication network is to have seamless
radio coverage and sufficient capacity to accommodate anticipated high teletraffic demand,
integration of satellite network and terrestrial cellular system is indispensable.
For the integrated satellite/terrestrial mobile radio system, the network is arranged in
a hierarchical architecture. The terrestrial segment consists of microcells and macrocells.
Overlaying macrocells cover spots that are difficult in radio propagation for microcells and
provide overflow channels for clusters of microcells. The satellite segment, on the other hand,
will extend the radio coverage regions where terrestrial coverage deemed uneconomical or
impractical and works as well as a backup facility for overflow traffic from the terrestrial
segment. The situation, then, where satellite-only, terrestrial-only and dual-mode terminal
1
1.1. Objective of the Thesis 2
coexist can be envisaged. From the teletraffic point of view, user mobility in this hierarchical
architecture results in more complex mobility management due to the horizontal handoff from
cell-to-cell in the same level as well as the vertical handoff to a higher level in the architecture.
The user mobility results in reduction of the resource occupation time compared to the total
cell duration. In addition, the radio resources of a cell in any level should cater for both new
calls originated in its coverage area and incoming handoff requests from any neighbouring
cell in the same level or underlay cell in the lower level. An abnormal call termination due
to lack of resources in the target cell should be avoided as possible by providing different
priority schemes at any hierarchical level.
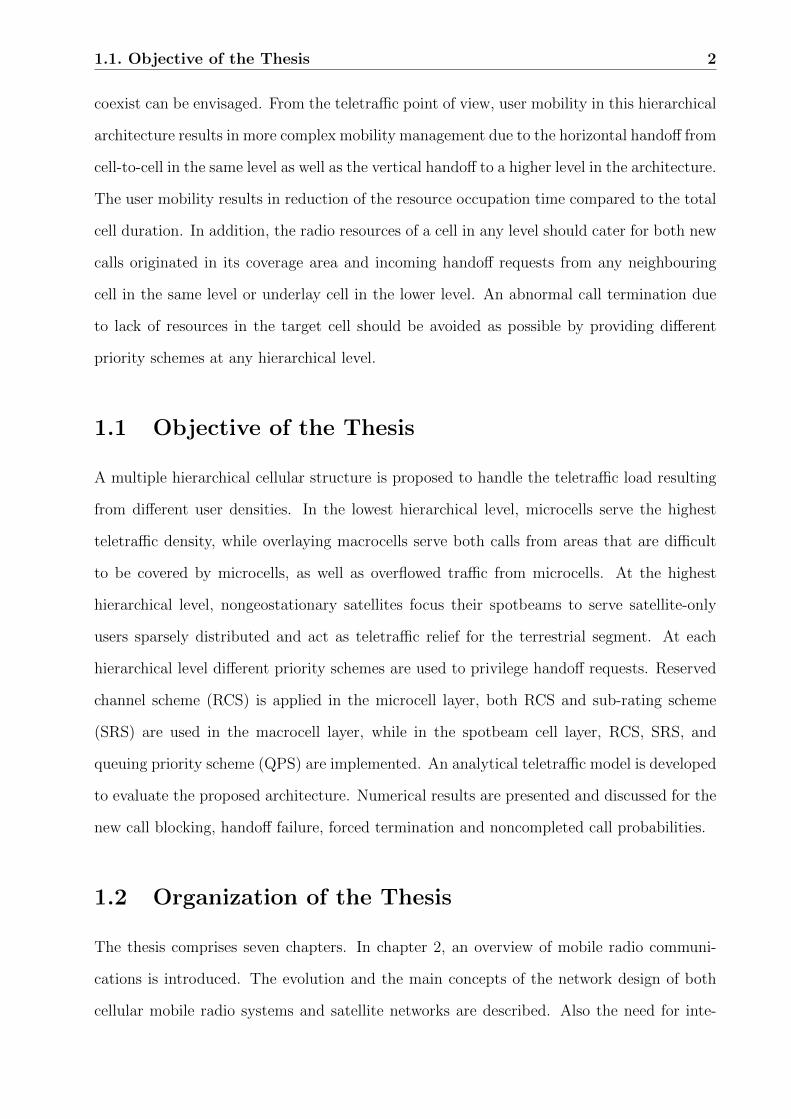
1.1 Objective of the Thesis
A multiple hierarchical cellular structure is proposed to handle the teletraffic load resulting
from different user densities. In the lowest hierarchical level, microcells serve the highest
teletraffic density, while overlaying macrocells serve both calls from areas that are difficult
to be covered by microcells, as well as overflowed traffic from microcells. At the highest
hierarchical level, nongeostationary satellites focus their spotbeams to serve satellite-only
users sparsely distributed and act as teletraffic relief for the terrestrial segment. At each
hierarchical level different priority schemes are used to privilege handoff requests. Reserved
channel scheme (RCS) is applied in the microcell layer, both RCS and sub-rating scheme
(SRS) are used in the macrocell layer, while in the spotbeam cell layer, RCS, SRS, and
queuing priority scheme (QPS) are implemented. An analytical teletraffic model is developed
to evaluate the proposed architecture. Numerical results are presented and discussed for the
new call blocking, handoff failure, forced termination and noncompleted call probabilities.
1.2 Organization of the Thesis
The thesis comprises seven chapters. In chapter 2, an overview of mobile radio communi-
cations is introduced. The evolution and the main concepts of the network design of both
cellular mobile radio systems and satellite networks are described. Also the need for inte-
1.2. Organization of the Thesis 3
gration of the two systems is briefly investigated in order to reach a unified global system.
In chapter 3, the classical teletraffic theory and its associated terms are presented and
accompanied with analysis of its formulae and parameters. Also, an extension of this classical
theory to accommodate the handoff process resulting from user’s mobility in the cellular
structure is introduced.
The multilayered systems with hierarchical structures including terrestrial systems re-
presented by microcells and macrocells, and satellite systems represented by spotbeam cells
are integrated to attain the desired unified global mobile communication system. Also the
mobility management describing this integration is introduced in chapter 4.
The teletraffic analysis of the multiple hierarchical cellular communication system with
different handoff priority schemes including, reserved channel scheme (RCS), sub-rating
scheme (SRS), and queuing priority scheme (QPS), is introduced and evaluated in chap-
ter 5.
Chapter 6 encompasses the numerical results for the performance measures of the pro-
posed model obtained for nominal system parameters. These are followed by an analysis of
the proposed model performance under some parameters variations to evaluate the validity
of the proposed architecture under different circumstances.
Our conclusion and future trends toward advanced global mobile communication system
that makes use of the software radios are presented in chapter 7.

Chapter 2
Overview of Mobile Radio Systems
2.1 Introduction
Perhaps the clearest constituents in all of the wireless personal communications activity are
the desire for mobility in communications and the companion desire to be free from tethers
i.e., from physical connections to communications networks. These desires arise from the
very rapid growth of mobile technologies that provide primarily two-way voice services, even
though economical wireline voice services are readily available [1].
The phenomenal growth in the mobile communications industry has been one of the
success stories of the last decade. With almost 5 million new mobile users per month the
global market for mobile communications is forecasted to grow from today’s figure of 200
million to around 2.4 billion users by 2015 [2]. Wireless access will overtake fixed access
to global telecommunications early in the 21st century. Mobile communication technology
has evolved along a long path, from the simple first-generation analog products designed for
business use to second- generation digital wireless telecommunication systems for residential
and business environments. Entertainment, video, banking and the like are all separate
entities. In the future it is envisioned that a complete personal communication system
(PCS) will exist. These will enable users to economically transfer and receive any form of
information anywhere and at anytime. This will encourage the use of mobile phone as a
“life-style portal” rather than just a voice communications device. In order to accomplish
this, a new generation of mobile communications systems is required. This new generation
4
2.2. Evolution of Mobile Communication Systems 5
of mobile systems will be known as third-generation mobile communications systems [2].
PCS employs a small handset that allows a user to communicate with anyone, in a variety
of formats–voice, data, image, and full motion video–from virtually any geographic location,
whether from home, the office, or on the road. To do this, the PCS relies on access to a
variety of networks including the public switched telephone network, wireless and satellite
systems, the integrated service digital network, and the terrestrial mobile systems. The
key element that forms the basis for this mobility is a single personal telecommunications
number, or PTN. Armed with this number, the user has the unprecedented capability of
global roaming [3].
In this chapter an overview of mobile radio communications is introduced. The evolution
as well as the main design and network concepts of both cellular mobile radio systems and
satellite networks are described. Also the need for integration between the two systems is
briefly investigated in order to reach a unified global system.
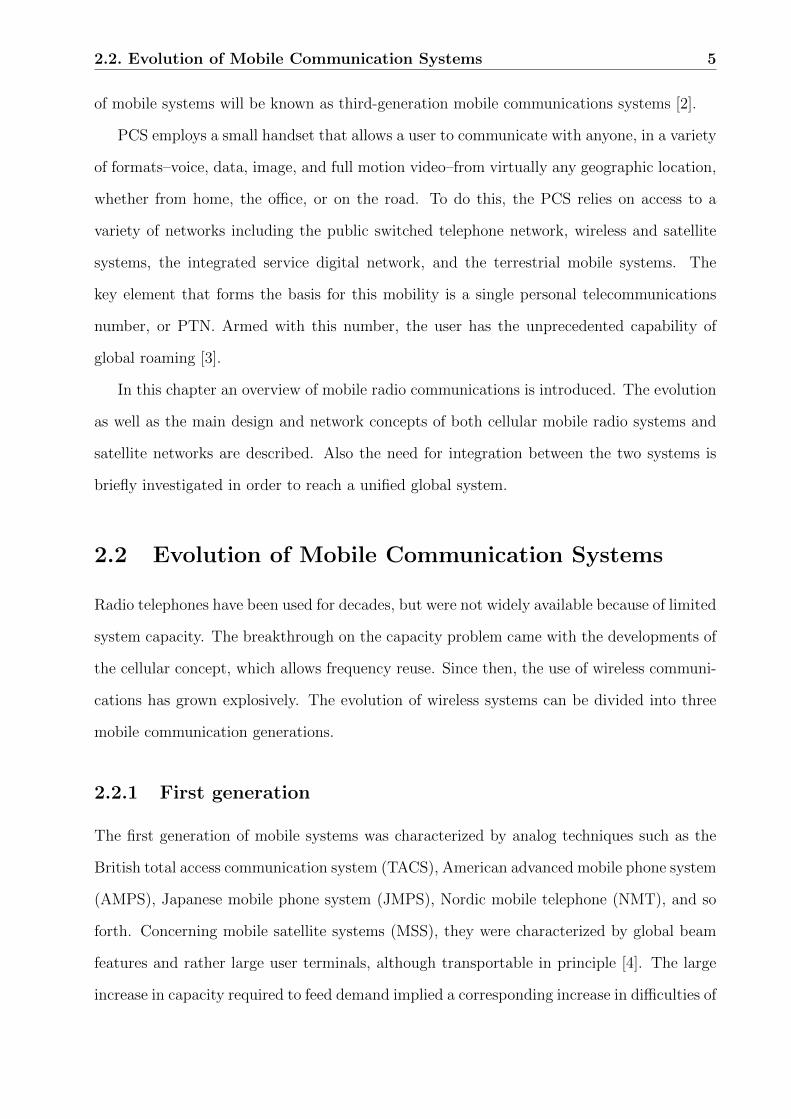
2.2 Evolution of Mobile Communication Systems
Radio telephones have been used for decades, but were not widely available because of limited
system capacity. The breakthrough on the capacity problem came with the developments of
the cellular concept, which allows frequency reuse. Since then, the use of wireless communi-
cations has grown explosively. The evolution of wireless systems can be divided into three
mobile communication generations.
2.2.1 First generation
The first generation of mobile systems was characterized by analog techniques such as the
British total access communication system (TACS), American advanced mobile phone system
(AMPS), Japanese mobile phone system (JMPS), Nordic mobile telephone (NMT), and so
forth. Concerning mobile satellite systems (MSS), they were characterized by global beam
features and rather large user terminals, although transportable in principle [4]. The large
increase in capacity required to feed demand implied a corresponding increase in difficulties of
2.2. Evolution of Mobile Communication Systems 6
enlarging the networks. In addition to the capacity bottleneck, the utility of first generation
analog systems was diminished by the proliferation of incompatible standards in Europe.
The same mobile telephone frequencies could not be used in different European countries.
These limitations as well as digital communication technologies become mature enough for
commercial use provided motivations for the development of second generation systems [2].
2.2.2 Second generation
The second generation digital wireless system is built in the late 1980’s and the 1990’s.
The main feature of this generation is the implementation of digital technology. The system
capacity is several times higher than the traditional analog system. More service features are
introduced, the service quality is improved, and the service cost is significantly reduced [3].
Telepoint and cordless telephone systems (e.g., CT2, CT3, Digital European cordless te-
lecommunications (DECT)), paging (European radio messaging system (ERMES)), cellular
networks such as global system for mobile communications (GSM), digital cellular system
at 1800 MHz (DCS-1800) or personal communication networks (PCN’s), as well as multiple
beam mobile satellite systems servicing briefcase lap-top size terminals, all are examples of
second generation personal communication systems. Each one being based on technologies
designed and optimized for specific traffic scenarios. Telepoint/Cordless systems match the
requirement for wireless communications in very high traffic density environments (residen-
tial, in-building, public transportation, etc.). Cellular networks like GSM, are the winning
choices for high-to-medium traffic density areas (urban, suburban, possibly rural environ-
ments). Satellite communication networks play their role wherever the terrestrial networks
are neither competitive (low traffic density), nor applicable (maritime and aeronautical ser-
vices), or even undeveloped at all [4].
2.2.3 Third generation
The drawback of existing mobile systems is that they are not capable of supporting the
high bandwidth applications that characterize the kind of services users will demand as
we move into the next century. With the trend towards globalization of the world’s eco-

2.3. Design Concepts of Cellular Mobile Radio Systems 7
nomy it is desirable that communications take place globally providing ‘communications
anywhere-anytime’ [2]. Despite the fact that some of the more recent systems work on si-
milar principles, most of them are incompatible with each other. Thus, with a universal
personal telecommunication (UPT), user should be able to utilize personal services indepen-
dently of the kind of network access (PSTN, cellular, satellite, etc.) [4]. It is clear that a
new generation of wireless services is required which can address the above problems. This
new generation of wireless services is described as third generation mobile communications
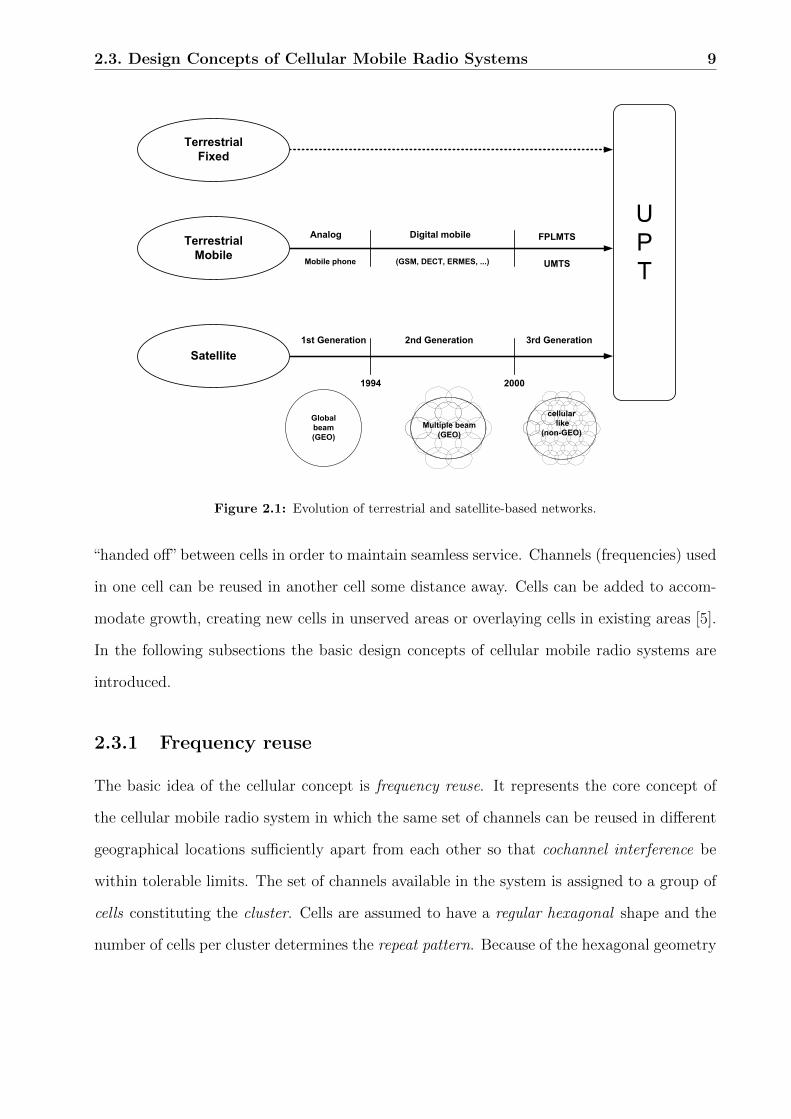
systems [2] as shown in Table 1 and Fig. 2.1. Its purpose is to provide wireless access to
the global telecommunications infrastructure through both satellite and terrestrial systems,
serving fixed and mobile users in public and private networks. Although most discussions on
PCS have focused on the terrestrial system, we believe that the mobile satellite systems will
also play a significant role. Satellite service complements the existing terrestrial systems by
providing coverage in geographical areas where the terrestrial component cannot physically
or economically provide coverage, e.g., coverage of ships, aircraft, and users in rural areas.
In addition, it is crucial to support the global roaming feature of PCS. The key problem
in satellite system design is the efficient use of two critical satellite resources (bandwidth
and power). The cellular concept is also introduced in the satellite system to increase the
system capacity [3]. The European version of the third generation systems is known as the
Universal Mobile Telephone System (UMTS). UMTS will encourage the use of the phone as
a ‘lifestyle portal’ rather than just a voice communications device.
It will include improvements in batteries, integrated circuits, introduction of flat screens,
camera, voice recognition, speaker verification systems, and end-to-end encryption. It is
aimed to be lunched in 2002-2005 [2].
2.3 Design Concepts of Cellular Mobile Radio Systems
A cellular mobile communications system uses a large number of low-power wireless transmit-
ters to create cells (the basic geographic service area of a wireless communications system).
Variable power levels allow cells to be sized according to the subscriber density and demand
within a particular region. As mobile users travel from cell to cell, their conversations are

2.3. Design Concepts of Cellular Mobile Radio Systems 8
Table 2.1: Comparison between the three mobile communications generations.
Time First generation1970’s-1980’s
Second generation1980’s-1990’s
Third generationYear 2000+
Service
� Wireless voiceservice
� Advanced wire-less voice ser-vices
� Advanced wire-less data ser-vices
� integrated wi-reless voice,data, andimaging
� Advanced wire-less data ser-vices, e.g., full-motion video
Technology
� Analog cellularand cordlesstechnology
� Macrocellular
� Digital cellularand cordlesstechnology
� Microcellularand picocellu-lar
� Intelligent basestation techno-logy
� Broader band-width radiochannels
� Higher fre-quency spec-trum utiliza-tion
� Advancedintelligentnetwork tech-nology
2.3. Design Concepts of Cellular Mobile Radio Systems 9
Analog
Mobile phone
Digital mobile
(GSM, DECT, ERMES, ...)
FPLMTS
UMTS
1st Generation 2nd Generation 3rd Generation
1994 2000
Global
beam
(GEO)
Multiple beam
(GEO)
cellular
like
(non-GEO)
Terrestrial
Fixed
Terrestrial
Mobile
Satellite
Figure 2.1: Evolution of terrestrial and satellite-based networks.
“handed off” between cells in order to maintain seamless service. Channels (frequencies) used
in one cell can be reused in another cell some distance away. Cells can be added to accom-
modate growth, creating new cells in unserved areas or overlaying cells in existing areas [5].
In the following subsections the basic design concepts of cellular mobile radio systems are
introduced.
2.3.1 Frequency reuse
The basic idea of the cellular concept is frequency reuse. It represents the core concept of
the cellular mobile radio system in which the same set of channels can be reused in different
geographical locations sufficiently apart from each other so that cochannel interference be
within tolerable limits. The set of channels available in the system is assigned to a group of
cells constituting the cluster. Cells are assumed to have a regular hexagonal shape and the
number of cells per cluster determines the repeat pattern. Because of the hexagonal geometry

2.3. Design Concepts of Cellular Mobile Radio Systems 10
only certain repeat patterns can tessellate. The number K of cells per cluster is given by
K = i2 + ij + j2, (2.1)
where i and j are integers. From (2.1) we note that the clusters can accommodate only
certain numbers of cells such as 1, 3, 4, 7, 9, 12,· · · . The number of cells per cluster is
intuitively related with system capacity as well as with transmission quality. The fewer cells
per cluster, the larger the number of channels per cell (higher traffic carrying capacity) and
the closer the cocells (potentially cochannel interference). A sample of cell reuse patterns is
shown in Fig. 2.2.
An important parameter of a cellular layout relating these entities is the frequency reuse
ratio (D/R), sometimes called the cochannel interference reduction ratio, where D is the
distance between cocells and R is the cell radius. In a hexagonal geometry it is easy to show
that
D/R =√
3K . (2.2)
The carrier-to-interference ratio (C/I) is an important parameter in the cellular concept
that sets a limit to the available number of channels per cell and consequently determines
(a) K = 4 (b) K = 7 (c) K = 12
Figure 2.2: The K-cell reuse pattern.
2.3. Design Concepts of Cellular Mobile Radio Systems 11
the system capacity as demonstrated below. Assuming that the local noise level is much less
than the interference level and can be neglected. Then, C/I can be expressed as
C
I=
R−γ∑nin=1D
−γn
, (2.3)
where γ is a propagation path-loss slope determined by the actual terrain environment. In a
real mobile radio medium γ usually lies between 2 and 5 depending on the actual conditions,
and always assumed to be 4, and ni is the number of interfering cells which range from 1 for
60◦ directional antennas to 6 for omnidirectional cells. Assuming that γ is equal to 4 and all
Dn in (2.3) are the same as D, then we can write
C
I=
(D/R)4
ni=
(3K)2
ni. (2.4)
If the total allocated spectrum is BT Hz and the channel bandwidth is BC Hz, the available
number of channels per cell N is given by
N =BT
BCK. (2.5)
Then from (2.4) and (2.5), N can be obtained by
N =BT
BC
√ni9
(C/I). (2.6)
From (2.6) it is clear that to attain accepted voice quality C/I the number of channels per
cell is decreased.
2.3.2 Cell splitting
The motivation behind implementing a cellular mobile system is to improve the utilization
of the allocated spectrum. The frequency reuse scheme is one concept, and cell splitting is
another concept. There are two configurations of cell splitting as shown in Fig. 2.3 depending
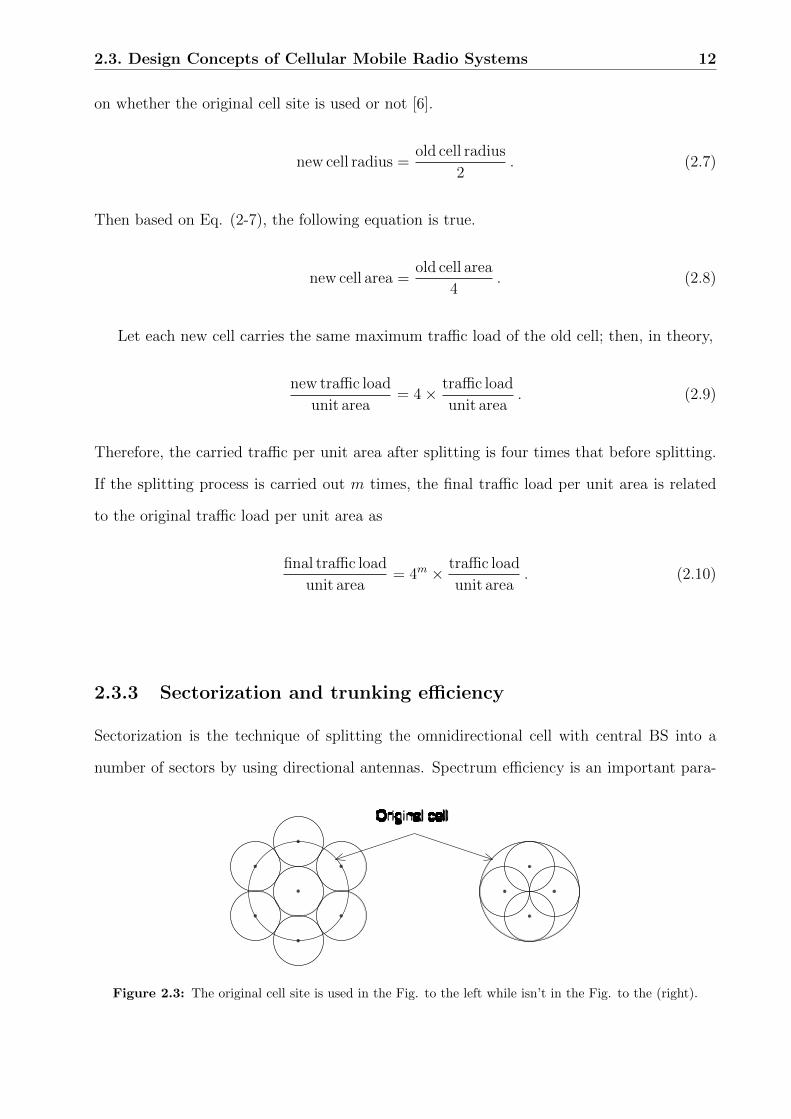
2.3. Design Concepts of Cellular Mobile Radio Systems 12
on whether the original cell site is used or not [6].
new cell radius =old cell radius
2. (2.7)
Then based on Eq. (2-7), the following equation is true.
new cell area =old cell area
4. (2.8)
Let each new cell carries the same maximum traffic load of the old cell; then, in theory,
new traffic load
unit area= 4× traffic load
unit area. (2.9)
Therefore, the carried traffic per unit area after splitting is four times that before splitting.
If the splitting process is carried out m times, the final traffic load per unit area is related
to the original traffic load per unit area as
final traffic load
unit area= 4m × traffic load
unit area. (2.10)
2.3.3 Sectorization and trunking efficiency
Sectorization is the technique of splitting the omnidirectional cell with central BS into a
number of sectors by using directional antennas. Spectrum efficiency is an important para-
Figure 2.3: The original cell site is used in the Fig. to the left while isn’t in the Fig. to the (right).

2.3. Design Concepts of Cellular Mobile Radio Systems 13
meter in the design of cellular systems. It gives a measure of how much traffic a system can
carry per unit frequency per unit area [7] as
Spectrum Efficiency =Erlang
BW × area. (2.11)
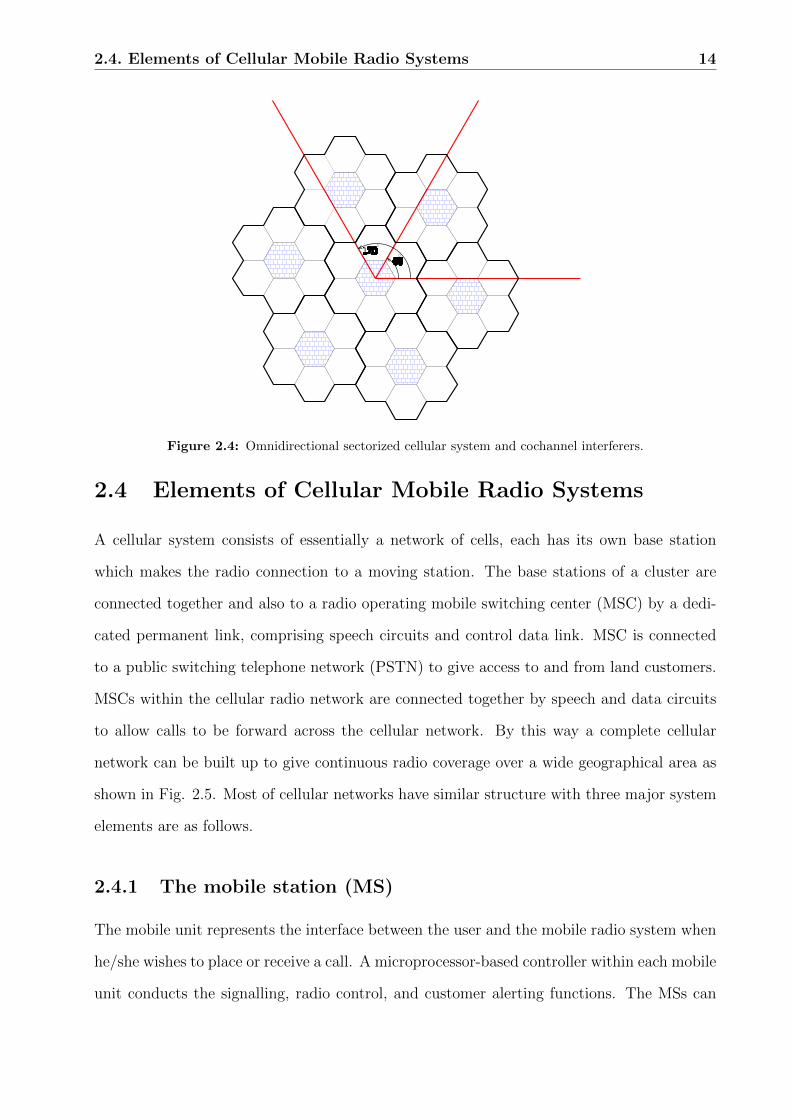
For a given cluster size, sectorizing a cell produces two effects. First, it reduces cochannel
interference. Because of the front-to-back ratio of the antenna gain, the number of stations
that are interfered with by a particular base station is reduced as shown in Fig. 2.4. As a
result, the C/I ratio is improved. Second, sectorization divides the cell into smaller sectors.
Since the given amount of spectrum or the available channels are now distributed into smaller
sectors instead of a single cell, trunking efficiency is reduced. It can be shown that higher
spectrum efficiency is achieved by reducing the cluster size in a sectorized cellular system
without lowering the C/I ratio below the minimum requirement [7]. From Eq. (2-4) to
maintain a C/I ratio of at least 18 dB, an omnidirectional system (ni = 6) requires K = 7,
a three-sector system (ni = 2) requires K = 4, and a six-sector system (ni = 1) requires
K = 3.
2.3.4 Handoff mechanism
The final obstacle in the design of the cellular radio system involved the problem of handoff
when the mobile station (MS) moves out of the coverage area of a given cell site, the reception
becomes weak. At this point, the cell site in use requests a handoff. The system switches the
call to a stronger frequency channel in a new site without interrupting the call or alerting
the user. The call continues as long as the user is talking, and the user doesn’t notice the
handoff at all [5].
2.4. Elements of Cellular Mobile Radio Systems 14
Figure 2.4: Omnidirectional sectorized cellular system and cochannel interferers.
2.4 Elements of Cellular Mobile Radio Systems
A cellular system consists of essentially a network of cells, each has its own base station
which makes the radio connection to a moving station. The base stations of a cluster are
connected together and also to a radio operating mobile switching center (MSC) by a dedi-
cated permanent link, comprising speech circuits and control data link. MSC is connected
to a public switching telephone network (PSTN) to give access to and from land customers.
MSCs within the cellular radio network are connected together by speech and data circuits
to allow calls to be forward across the cellular network. By this way a complete cellular
network can be built up to give continuous radio coverage over a wide geographical area as
shown in Fig. 2.5. Most of cellular networks have similar structure with three major system
elements are as follows.
2.4.1 The mobile station (MS)
The mobile unit represents the interface between the user and the mobile radio system when
he/she wishes to place or receive a call. A microprocessor-based controller within each mobile
unit conducts the signalling, radio control, and customer alerting functions. The MSs can

2.4. Elements of Cellular Mobile Radio Systems 15
BS
1
BS
2
BS
N
M
S
CPSTN
MS
Partydata
voice
Figure 2.5: General view of cellular communication system.
take several forms ranging from vehicle mounted mobiles, through transportable units to
handheld portable units.
2.4.2 The base station (BS)
Each BS contains a group of low-power transceiver that communicate with mobiles in its
coverage area over the channels assigned to it. The BS processes the signals to make them
suitable for transmission between the land-line network and the radio network for all mobile
telephones communicating with it [8]. This requires real-time control, which is accomplished
with stored-program control technique. In addition, the BS performs other control and
signalling functions such as call set-up, call supervision, mobile locating, handoffs, and call
termination [9].
2.4.3 The mobile switching center (MSC)
MSC handles the traffic to and from the MSs via the BSs as well as the interfacing of
the cellular system to the PSTN. A grid of BSs dispersed through out the service area are
connected and controlled by the MSC. It is a computer-controlled telephone exchange espe-
cially designed to serve as a central coordinator of the cellular system. It administers radio
channel assignment and analyzing mobile location and signal strength data to determine
when it would be advisable for the mobile to handoff to a new cell. The MSCs are linked
together with digital circuits forming a fully interconnected network. The MSCs connect to
the land-line network at a large number of points in order to distribute the traffic load and
2.5. Space-based Systems 16
minimize the impact of any failures on call handling.
2.5 Space-based Systems
Due to the large coverage area offered by a satellite beam, which provides equal priority cove-
rage for all areas of population density, the satellite component can be used to complete the
coverage beyond the terrestrial network. Furthermore, aeronautical and maritime users may
be solely dependent on the satellite component for the provision of services [10]. Satellite-
based mobile communications have been going through an evolutionary change in the past
10 years, starting with the Inmarsat-type of mobile communications with the satellite in
geostationary earth orbit (GEO) where initially global beams are used to provide services to
ships at sea. In 1996, Inmarsat lunched two (of five) Inmarsat 3 satellites which produced
global spot beams where the earth’s disk is divided into large coverage areas serviced by
individual spot beams. For the same satellite-transmitted power, the spot beams provide
considerably greater effective isotropic radiated power (EIRP) than global beams. This era
was followed by satellites in GEO providing several spot beam type services to terrestrial
mobile units, either in vehicles or suitcase-size earth terminals. With the reasonably high
EIRP laid down by the satellite, the mobiles can use medium-gain directional antennas for
both data reception and voice service. However it is not able to supply service to handheld
transceivers.
The next phase in mobile communications, which now borders on PCS, involves handheld
transceivers characterized by very poor performance structure with power output in the
order of tens of milliwatts and antenna gains in the order of 0 to 3 dB. In this application,
satellites in low earth orbit (LEO) (altitudes 1,000 km) and medium earth orbit (MEO)
(altitudes 10,000 km) are emerging which will lay down multiple spot beams similar to
cellular structures in terrestrial cellular systems. Here, however, the cells (spot beams) have
motion as the satellite flies over, and the mobile is basically stationary when compared
with the rapidly moving spot (cellular) beams. It is also possible for the spot beams to
be programmed to continuously searchlight the terrestrial service areas and remain fixed
similar to their terrestrial cellular counterparts. This, of course, requires a more complicated
2.5. Space-based Systems 17
antenna such as a phased array or mechanically slewed antenna and/or altitude control of
the satellite bus [11].
2.5.1 Satellite orbits
An orbit is a circular path in space occupied by an object, moving in a direction parallel to
the surface of the planet, that has a forward velocity sufficient to create an outward thrust
(centrifugal force) equal to the gravitational pull of the planet it orbits. The plane of the
orbit must pass through the center of the object to be orbited. There are several orbital
constellations proposed for satellite communications, these include GEO, LEO and MEO.
The choice of the orbital altitude is driven by the orbital environment and the estimated cost
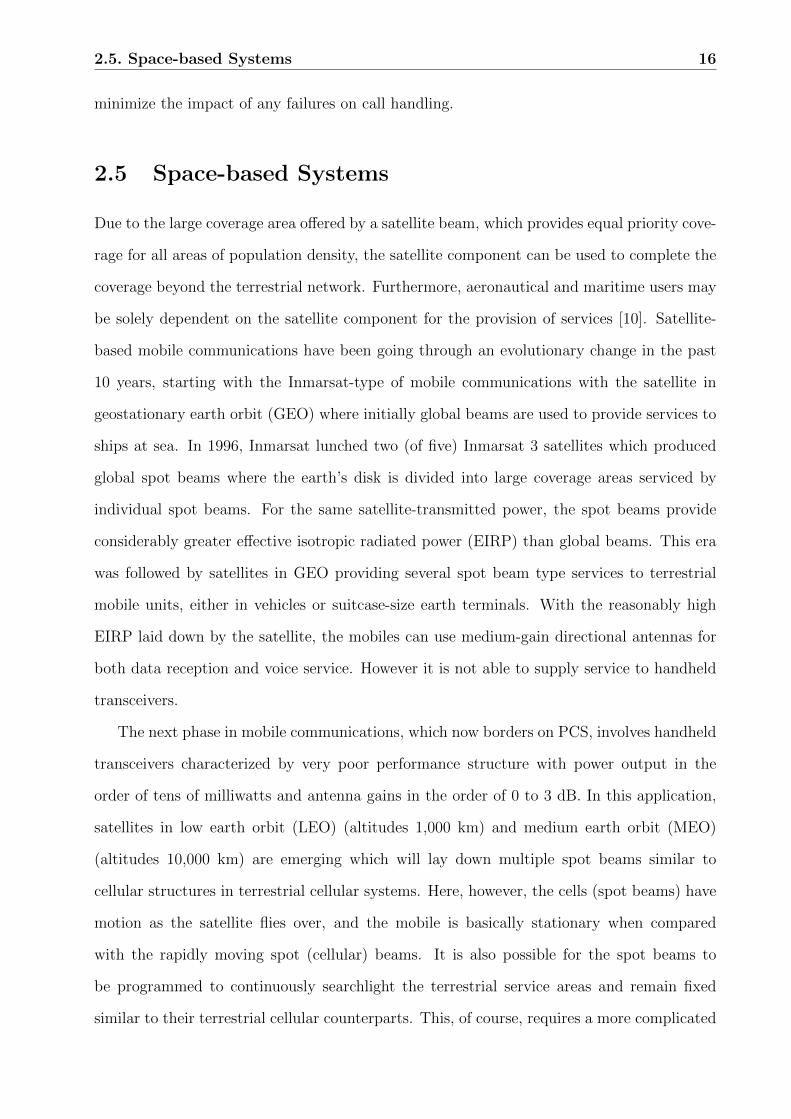
of the proposed constellation [12]. The relative amounts of earth coverage afforded by each
one are shown in Fig. 2.6, it is clearly noted that the higher the distance from the earth’s
surface the larger the afforded coverage area.
The position of satellites relative to the service area is of crucial importance for the
coverage, service quality, price and complexity of the overall network. When a satellite
encompasses the earth in 24-hr. periods, the term geosynchronous orbit has been used. An
orbit that is inclined with the respect to the equatorial plane is called an inclined orbit; an
orbit with a 90° inclination is called a polar orbit. A circular geosynchronous orbit over the
equatorial plane (0° inclination) is known as geostationary orbit, since from any point at the
surface of the earth the satellite appears to be stationary; this orbit is particularly suitable
for the land mobile services at low latitudes and for maritime and aeronautical services at
LEO
750-1,800 km
MEO
10-14,000 km
GEO
36,000 km
Earth
Figure 2.6: The relative amounts of earth coverage afforded by satellites.
2.5. Space-based Systems 18
latitudes of <80°. An elliptical geosynchronous orbit with the inclination angle of 63.4° is
known as tundra orbit. An elliptical 12-hr. orbit with the inclination angle of 63.4° is known
as Molniya orbit. Both tundra and Molniya orbits have been selected for the coverage of
the northern latitudes and the area around the north pole; for users at those latitudes the
satellites appear to wander around the zenith for a prolonged period of time. The coverage of
a particular region (regional coverage) and the whole globe (global coverage) can be provided
by different constellations of satellites including those in inclined and polar orbits [1].
2.5.2 GEO Vs LEO satellites
The success of satellite communications from geostationary orbit has not removed all the
objections, nor has it eliminated the advantages of other orbits for some purposes.
A significant objection to GEO is the propagation delay, which is unavoidable because of
the great distance and finite velocity of light. The altitude of the GEO is 35,786 km. Thus
the one-way propagation delay, including the up-link and the down-link, is between 240 and
270 ms. On a typical international connection the, the round trip delay is about 0.6 s.
Its effect on a voice conversation can be distracting at best and, at worst when aggravated
by echo at either end of the line, can make conversation almost impossible. For digital
data transmissions the delay inhibits the use of error correcting protocols that require error
detection and selective retransmission of the errored blocks. The delay to low- and medium-
altitude orbits is much less and the effects are either negligible or are easily accommodated.
The second fundamental objection to GEO is the lack of coverage at far northern and sou-
thern latitudes. There is considerable theory and experiment to suggest that elevation angles
higher than 40° are desired for consistent service. These elevations are simply unachievable
from GEO even at latitudes as close to the equator as 45°. Many of the capitals of Europe,
including Paris, London, Berlin, Warsaw, and Moscow, are north of this latitude. On the
other hand, high angles of elevation from inclined or polar orbiting LEO constellations are
easily attained.
The requirements of short time delay and high angles of elevation, together with space-
craft design constraints such as antenna size, lead to the choice of LEO or MEO for mobile
2.5. Space-based Systems 19
satellite communications for the majority of the proposed systems. However, the orbit alti-
tude cannot be freely chosen because of the existence of the Van Allen radiation belts. There
are two torroidal belts, centered on the earth’s geomagnetic axis, at altitudes ranging from
about 1,500 to 5,000 km and from 13,000 to 20,000 km [13].
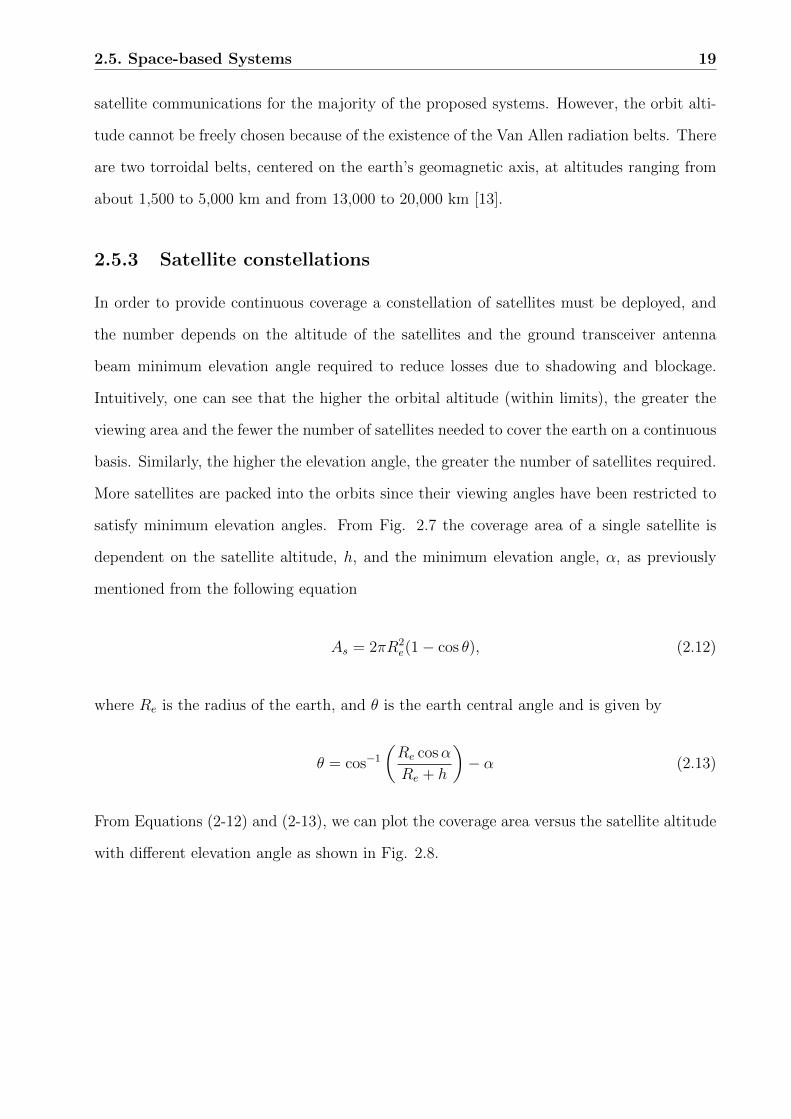
2.5.3 Satellite constellations
In order to provide continuous coverage a constellation of satellites must be deployed, and
the number depends on the altitude of the satellites and the ground transceiver antenna
beam minimum elevation angle required to reduce losses due to shadowing and blockage.
Intuitively, one can see that the higher the orbital altitude (within limits), the greater the
viewing area and the fewer the number of satellites needed to cover the earth on a continuous
basis. Similarly, the higher the elevation angle, the greater the number of satellites required.
More satellites are packed into the orbits since their viewing angles have been restricted to
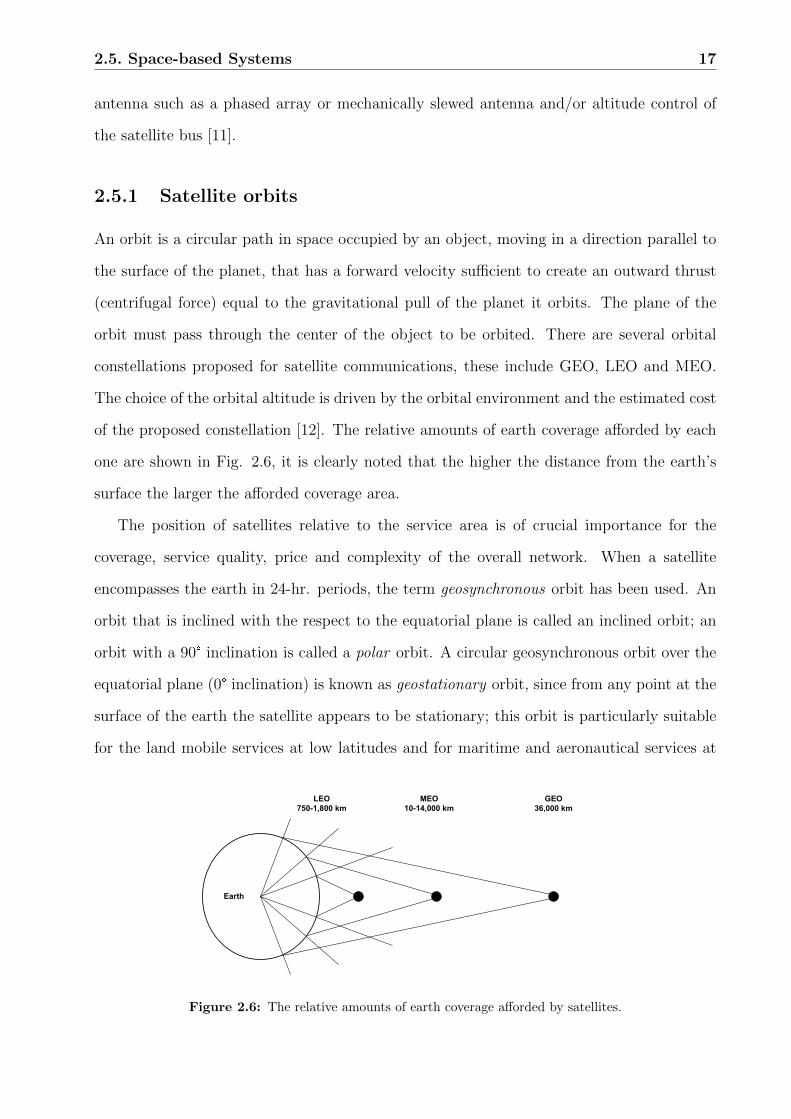
satisfy minimum elevation angles. From Fig. 2.7 the coverage area of a single satellite is
dependent on the satellite altitude, h, and the minimum elevation angle, α, as previously
mentioned from the following equation
As = 2πR2e(1− cos θ), (2.12)
where Re is the radius of the earth, and θ is the earth central angle and is given by
θ = cos−1
(Re cosα
Re + h
)− α (2.13)
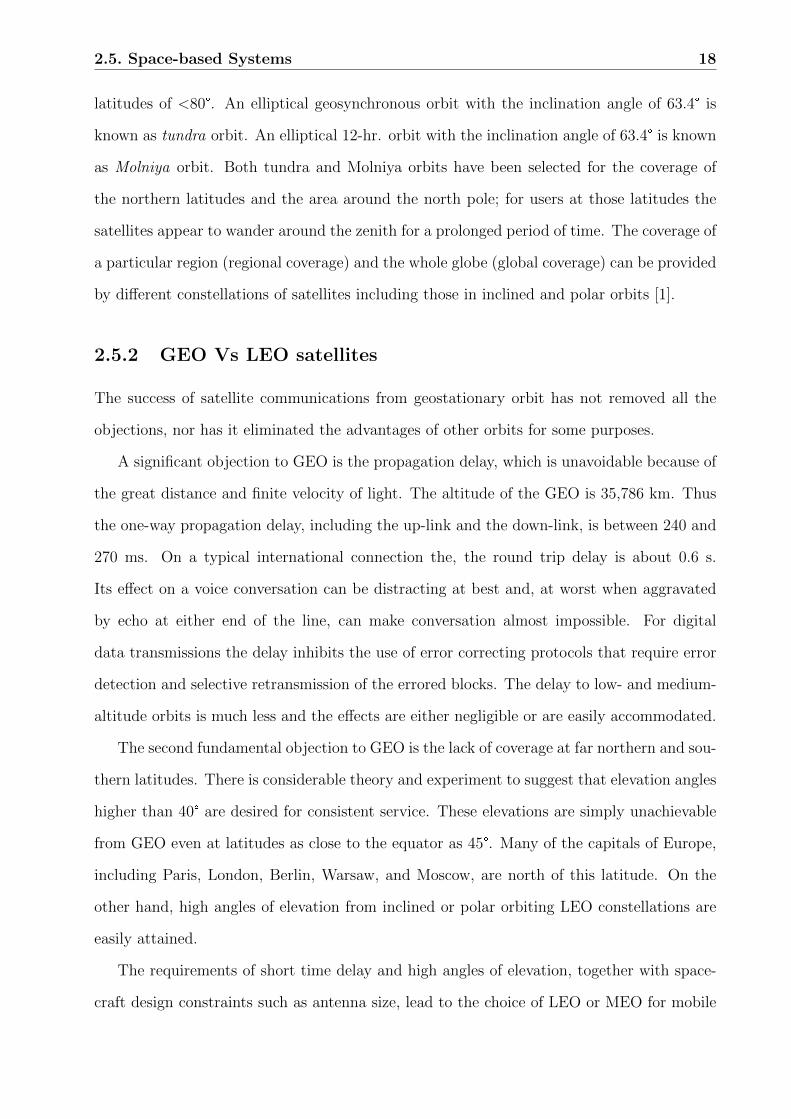
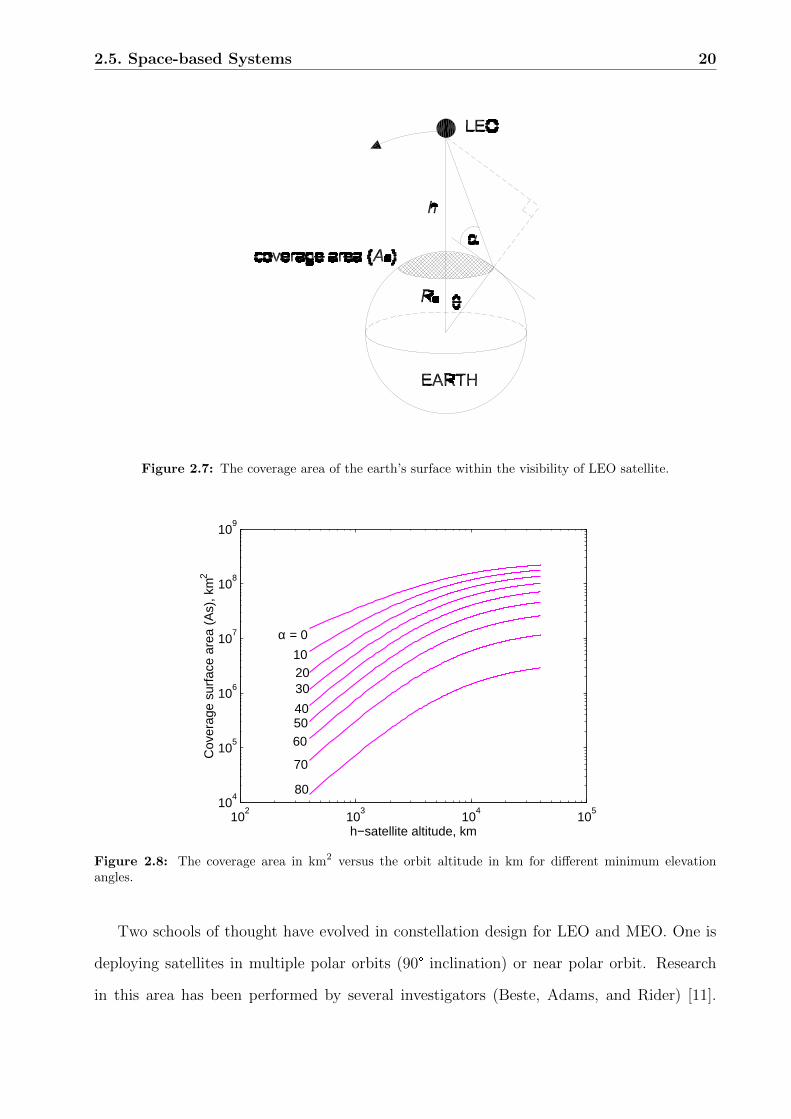
From Equations (2-12) and (2-13), we can plot the coverage area versus the satellite altitude
with different elevation angle as shown in Fig. 2.8.
2.5. Space-based Systems 20
Figure 2.7: The coverage area of the earth’s surface within the visibility of LEO satellite.
102
103
104
105
104
105
106
107
108
109
h−satellite altitude, km
Cov
erag
e su
rfac
e ar
ea (
As)
, km
2
α = 0
10 20 30
40 50 60
70
80
Figure 2.8: The coverage area in km2 versus the orbit altitude in km for different minimum elevationangles.
Two schools of thought have evolved in constellation design for LEO and MEO. One is
deploying satellites in multiple polar orbits (90° inclination) or near polar orbit. Research
in this area has been performed by several investigators (Beste, Adams, and Rider) [11].

2.6. Mobile Radio Channel Characteristics 21
The other approach has considered satellites in several planes but in inclined orbits. These
studies have been completed by Ballared and Walker [11].
Because of the altitude and the finite antenna aperture sizes possible on spacecraft, the
spot beams will encompass large areas (hundreds of miles in diameter) which can be refer-
red to as megacells, as compared to macrocells or microcell of terrestrial cellular systems.
Terrestrial cells may range from 1 to 20 miles in diameter. It is of interest and important to
note that the satellite spot beams approximate contiguous cellular clusters as in terrestrial
systems, but the performance parameters are not quite the same for many reasons. First,
the satellite cellular signal received at the ground receiver does not manifest the inverse 4th
power loss attenuation commonly used in terrestrial cellular systems. Second, in terrestrial
cellular systems there is generally no line-of-sight propagation, where in satellite applications
generally there is line-of-sight propagation, and the signal will have a strong dominant com-
ponent (plus random components due to multipath). Finally, from an interference point of
view, spot beams do not confine their energy to a single spot or cell but wiggle into other
cells because of the attendant sidelobes of the satellite beam(s).
2.6 Mobile Radio Channel Characteristics
The radio channel places fundamental limitations on the performance of mobile communica-
tion systems. Unlike wired channels that are stationary and predictable, radio channels are
extremely random and do not offer easy analysis. In fact, modeling the radio channel has
historically been one of the challenging parts of any radio system design and is typically done
in a statistical fashion, based on measurements made specifically for an intended communi-
cation system [1]. The propagation between the transmitting antenna and the mobile unit
antenna is over several paths, namely, the line-of-sight path and the paths due to scattering
caused by reflections from and diffractions around obstructions. These interfering signals
produce a complex standing wave pattern of varying field strength, with maxima and mi-
nima being of the order of a quarter wavelength apart. As a result of the vehicle movement
through this standing wave pattern, the received signal experiences random variations in
both amplitude and phase. Fades of 40 dB or more below the mean signal level are common,

2.6. Mobile Radio Channel Characteristics 22
with successive minima occurring about every half wavelength of the carrier transmission
frequency [14].
Free space is an ideal propagation model that can be accurately applied only to satellite
communication and short line-of-sight radio links has a path-loss slope of 20 dB/decade.
While in mobile radio environments, a path-loss slope of 40 dB/decade is always applied. In
general, a mobile radio signal r(t), can be characterized by two components m(t), and r0(t)
based in natural physical phenomena where
r(t) = m(t)r0(t) (2.14)
The component m(t) is called local mean, also called slow fading, long-term fading, or log-
normal fading and its variation is due to the terrain contour between the base station and the
mobile unit, here the signal being blocked by a large structures or by hills and mountains.
The factor r0 is called multipath fading or short-term fading, or Rayleigh fading and its
variation is due to the waves reflected from the surrounding buildings and other structures.
In the case of a direct wave path (a path clear from the terrain contour) or a line-of-sight
path (a path clear from buildings), although the 40 dB/decade path-loss slope remains the
same, the short-term fading is observed to be Rician fading. It results from a strong line-of-
sight path and a ground-reflected wave combined, plus many weak building-reflected waves.
When an out-of-sight condition is reached, the 40 dB/decade path-loss slope still remains
as shown in Fig. 2.9. However, all reflected waves, including ground-reflected waves and
building-reflected waves, become dominant. The short-term received signal at the mobile
unit observes a Rayleigh fading. As shown in Fig. 2.10 Rayleigh fading is the most severe
fading.
Studies have shown that the envelope of the mobile radio signal is Rayleigh distributed
when measured over distances of a few tens of wavelengths, where the mean signal is sensibly
constant, whereas, the phase of the received signal is uniformly distributed from 0 to 2π.
Another set of problems that arise in the mobile channel is a result of the motion of the
mobile user and other moving objectives. The first is the Doppler shift that is dependent on
the mobile speed and the carrier frequency. The Doppler shifts occupy a continuum between

2.6. Mobile Radio Channel Characteristics 23
BS antenna
(MS)
Reflect
ed signa
l
Diffracted signal
Figure 2.9: Multipath propagation in urban area.
0 10 20 30 40 50−40
−30
−20
−10
0
10
distance in wavelength
sign
al le
vel (
dB)
Figure 2.10: The Raleigh fading envelope
2.7. Channel Assignment Schemes 24
the positive and negative limits because the mobile antenna simultaneously picks up signals
scattered from some objects it is moving towards and away from them. The second motion-
related problem concerns cochannel and adjacent channel interference. Because of vehicle
motion, a receiver and a transmitter operating on adjacent or nearly adjacent channels may
be physically close together. The receiver selectivity must be extremely good to prevent
substantial interference from strong transmitted signals. Also, in a cellular mobile communi-
cation system, where frequencies are reused in the same city area, cochannel interference will
occur and this can not be reduced by improving receiver selectivity. Cochannel interference
plays a predominant role in determining the capacity of any cellular system.
2.7 Channel Assignment Schemes
Since the frequency spectrum is the most limited resource in the cellular system, channel
assignment schemes proposed so far have aimed at making efficient utilization of frequency
channels [15]. With the emergence of wireless personal communications and use of microcell
with non-uniform traffic, radio resource assignment becomes essential to network operation
and largely determines the available spectrum efficiency. Fixed channel assignment (FCA)
and dynamic channel assignment (DCA) techniques are the two extremes of allocating radio
channels to mobile subscribers. For specific grade of service and quality of transmission,
the assignment scheme provides a tradeoff between spectrum utilization and implementation
complexity. The performance parameters from a radio resource assignment point of view are
interference constraints (quality of transmission link), probability of call blocking (grade of
service), and the system capacity (spectrum utilization) described by busy hour traffic that
can be carried by the network. In a cellular system, however, there exist other functions,
such as handoff and its execution or radio access control. These functions may be facilitated
by the use of specific assignment schemes and, therefore, they should be considered in such
a tradeoff.

2.7. Channel Assignment Schemes 25
2.7.1 Fixed channel assignment (FCA)
In fixed channel assignment the interference constraints are ensured by a frequency plan
independent of the number and location of active mobiles. Each cell is then assigned a fixed
number of channels, dependent on the traffic density and the cell size. These channels are
permanently assigned for use in that cell. The corresponding frequency plan remains fixed
on a long-term basis. For a given set of communications system parameters, the minimum
allowed carrier to interference ratio (C/I)0 relates to a specific quality of transmission link
(e.g., probability of bit error or voice quality). This parameter in turn relates to the number
of channel sets (or cluster size) given by . Thus, the frequency reuse ratio D/R is determined
by (C/I)0. For example, the (C/I)0 of 18 dB results in K = 7 or the D/R = 4.6. Here, we
have used propagation attenuation proportional to the fourth power of the distance. The
radius of the cell is determined mainly by the projected traffic density. The number of
channels for each cell can be determined through the Erlang-B formula by knowing the busy
hour traffic and the desired probability of blocking (grade of service). Probability of blocking
PB is related to offered traffic A, and the number of channels per cell N by
PB =AN/N !∑Ni=0A
i/i!. (2.15)
This applies to the case of blocked calls cleared system. If calls are delayed, the grade of
service becomes measured by the probability of calls being delayed PD and is given by
PD =
AN
N !(1−A/N)∑N−1i=0 Ai/i! + AN
N !(1−A/N)
(2.16)
FCA worked very well in the first generation cellular systems, which have regular cell struc-
ture and stable system configuration. With the introduction of microcells and picocells in
PCS, FCA becomes inadequate because of the following:
� Frequency planning is getting more difficult and tedious in the microcellular environ-
ment since accurate propagation predictions require a more detailed knowledge of the
landscape than is required for large area coverage design.
2.7. Channel Assignment Schemes 26
� The fixed assignment strategy does not provide the flexibility for system reconfigura-
tion.
� FCA is not flexible enough to handle the unpredicted traffic and abnormal interference
scenarios, such as traffic jam, car accident, etc.
� It is not suitable to provide “bandwidth on demand” which is important for multimedia
services in PCS.
To improve the utilization while maintaining the implementation simplicity, various strategies
have been proposed as enhancements to FCA and deployed in existing networks. Two often
used methods are channel borrowing and directed retry.
In the channel borrowing strategy, channels that are not in use in their cells may be
borrowed by adjacent cells with high offered traffic on a call-by-call basis. Borrowing of
channels allows the arriving calls to be served in their own cells. This implies that there will
be further restrictions in using the borrowed channels in other cells.
In directed retry, a call to or from a mobile subscriber may try other cells with channels
with sufficient signal strength meeting the C/I constraint if there are no channels available
in its own cell to be served. In some cases it may be necessary to direct some of the calls in
progress in a given congested cell to adjacent lightly loaded cells in order to accommodate
the new calls in that given cell. This is referred to as directed handoff. The combination of
these two capabilities provides a significant increase in bandwidth utilization.
2.7.2 Dynamic channel assignment (DCA)
In dynamic channel assignment, the assignment of channels to cells occurs based on the
traffic demand in the cells. In other words, channels are pooled together and assignments
are made and modified in real time. Therefore, this assignment scheme has the potential
to achieve significantly improved bandwidth utilization when there are temporal or spatial
variations. In DCA, the interference constraints are ensured by a real time evaluation of
the most suitable (less interfered) channels that can be activated in a given cell. That is,
the system behaves as if the frequency plan was dynamically changing to meet the actual

2.7. Channel Assignment Schemes 27
radio link quality and traffic loads, realizing an implicit sharing of the frequency band under
interference constraints.
When DCA is being used, different channels are assigned to serve calls randomly. Because
of this randomness, it is found that cells that have used the same frequency channel, on the
average, are spaced apart at a greater distance than the minimum reuse distance. Since
DCA implies the lack of a fixed relationship between cells and channels. This definition
allows for almost an infinite variety of dynamic channel assignment procedures a[16]. Many
studies have focused in this field are presented in [16, 17, 18, 19, 20]. For example channel
reassignment methods are presented in [19] to improve the performance of DCA, where calls
already in progress are switched back, whenever possible, to other fixed channels with the
objective of keeping the distance between cells using the same channel simultaneously to
a minimum [20]. This frees the dynamic channel for future assignment and ensures that a
large number of calls is being served by the optimally spaced fixed channels [19].
The performance of DCA depends on the algorithm implementing this capability. In ge-
neral, due to interactions between different cells, the performance of the system will involve
modeling the system as a whole, as opposed to in FCA where cells are treated independently.
Therefore, mathematical modeling and performance evaluation of DCA becomes quite com-
plex. Simplifying assumptions may, therefore, be necessary to obtain approximate results.
Simulation techniques have been widely used in evaluation of DCA performance.
2.7.3 Hybrid channel assignment (HCA)
Hybrid channel assignment technique employs a mixture of fixed and dynamic techniques.
In this strategy, channels assigned to each cell are divided into two groups. The first group
(nominal channels) can be used only for local calls using the FCA policy. The second group
(common channels) is kept as a common pool to be shared by all subscribers on DCA basis.
The common group is only used when there are no nominal channels available. By carefully
adjusting the ratio of the number of channels in these two groups according to the traffic
distribution it is possible to design a system to maintain good spatial efficiency and at the
same time gain sufficient flexibility to respond to abnormal traffic distributions. It was found

2.7. Channel Assignment Schemes 28
that the optimum ratio depends on the percentage increase in traffic density.
This scheme can be further improved by switching calls from the common pool to one
of the nominal channels when these becomes free, this is so-called channel reassignment or
intra-cell handoff previously described. It is, therefore, advantageous to carry as much of the
traffic as possible on FCA. As the HCA scheme uses both FCA and DCA schemes, hence, it
performs well in both heavy and light traffic conditions.
Chapter 3
Teletraffic Analysis of Mobile Radio
Networks
3.1 Introduction
Teletraffic theory plays an important role in analyzing and designing the performance of
information transmission systems including public switched telephone systems, mobile radio
communication systems, and others [21]. The theory is intimately connected to the pro-
bability theory. A teletraffic network should be planned so that even during the periods
of heaviest traffic, usually called the busy hour, the teletraffic requests attempted by users
have a good chance of success. The number of communication channels to be provided for
handling this traffic is normally calculated so that during the busy hour only a small, but
usually predetermined proportion of calls will be blocked.
The classical teletraffic theory usually applied for public switched telephone network is
extended here to take into account the mobility of users in the service area of the cellular
mobile systems. If the cell is sufficiently large such that the handoff requests are negligible
i.e., the probability of a MS moves out of a cell during making a call is low. In this situation
the classical teletraffic theory is applicable as the method of handling the call in the fixed
networks. Then mobile networks is quite similar, i.e., once the user attempted a call in a
specified cell and is assigned a radio channel by its BS, he/she occupies the channel for the
29

3.2. Fundamentals of Teletraffic Theory 30
total call duration and when a call is over, the channel is released and could be assigned
to another user. We emphasize here that in this case the channel holding time (i.e., the
occupation time of the channel by the call in the cell) is equal to the call duration. This is
not the case in a microcellular radio networks as we will see later.
In this chapter the classical teletraffic theory and its associated terms are discussed and
analyzed to formulate the performance and determine the required parameters. Also, an
extension of this classical theory to accommodate the handoff process resulting from user
mobility in the microcellular structure is introduced.
3.2 Fundamentals of Teletraffic Theory
In order to get insight the detailed analysis of some basic systems, the basic terms of the
teletraffic theory should be clearly defined to understand the technical differences between
these systems and to be aware of which of these will suit a specified teletraffic model.
3.2.1 Basic teletraffic terms
Any queuing model is defined in terms of three characteristics, these are, the input process,
the service mechanism, and the queue discipline. The input process describes the sequence
of requests for service. For example, a common assumption for the input process is that of
Poisson (random) input, where the customers are assumed to arrive according to a Poisson
process. Another input process is called quasi-random input, where each idle source generates
requests independently and with the same exponentially distributed interrequest time.
The service mechanism is the category that includes such characteristics as the num-
ber of servers (channels) and the length of time that customers hold the server. We will
study models with an arbitrary number of parallel servers and with independent, identically
distributed exponential service times.
The queue discipline specifies the disposition of blocked customers (customers who find
all servers busy). We will consider three different queue service disciplines. When blocked
customers do not wait, but return immediately to their prerequest state, the queue discipline

3.2. Fundamentals of Teletraffic Theory 31
is said to be blocked customers cleared or blocked calls cleared (BCC). When blocked custo-
mers wait as long as necessary for service, the queue discipline is said to be blocked customers
delayed (BCD). And when customers are assumed to stay in the system for a time duration
(sojourn time) that is independent of the state of the system, the queue discipline is said to
be blocked customers held (BCH).
Based on the above definition of the queue model we can define some teletraffic terms as:
� Call arrival rate
The demand for telephone calls may arise randomly at any hour of the day. Although the
call arrival rate varies significantly with time, the rate associated with the peak demand is
the most important. Dividing the number of calls requests during a measured time interval
by the interval gives the mean call rate λ.
� Call duration
Once a call attempt is successful and a channel is assigned, the period of time during which
the channel is occupied by the user is called the call duration or the channel holding time
T . Because calls occupy the channel for a random length of time, we are usually interested
in the mean call duration. A most widely used distribution for the channel holding time is
the negative exponential distribution (NED), given its probability density function (pdf) in
Eq. (3-1), with the mean T̄ = 1/µ, where µ is called the termination or the departure rate.
The most important feature of this distribution, beside its mathematical tractability, is its
memoryless property. The memoryless property, sometimes called the Markovian property,
means that the probability that a call terminates in a given interval does not depend on the
time the call has been in progress.
fT (t) =
µe−µt for t ≥ 0
0 otherwise
(3.1)
� Offered traffic
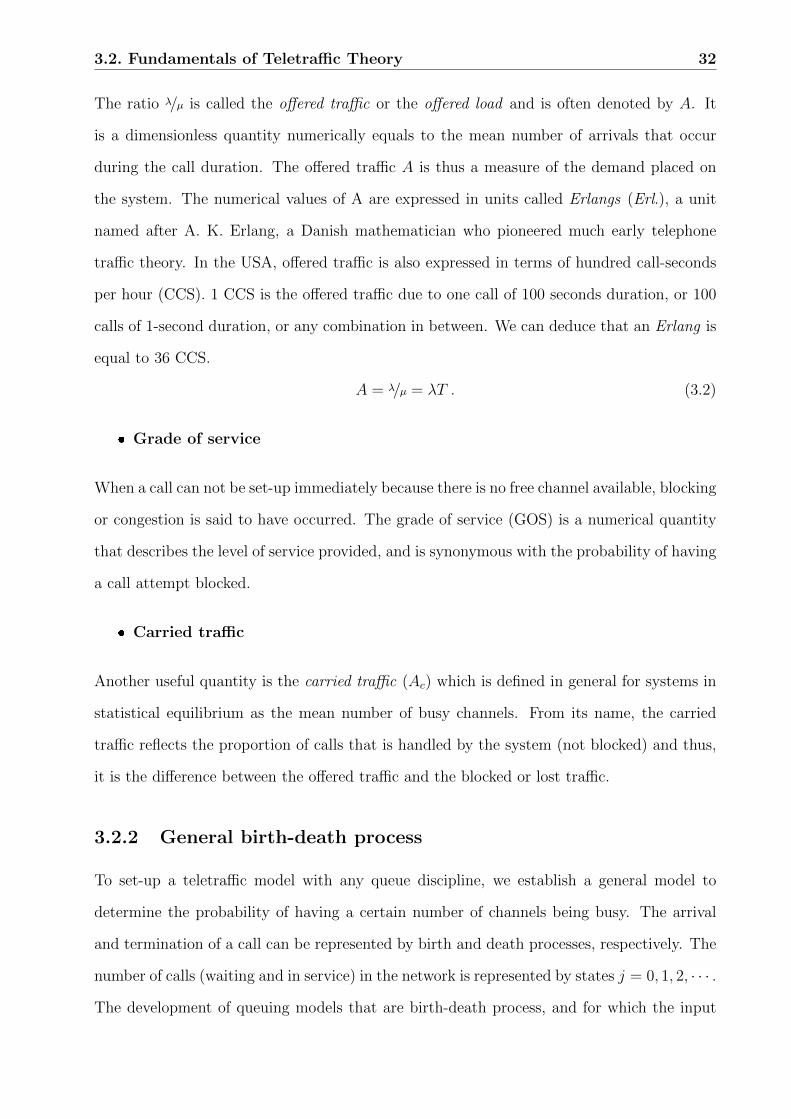
3.2. Fundamentals of Teletraffic Theory 32
The ratio λ/µ is called the offered traffic or the offered load and is often denoted by A. It
is a dimensionless quantity numerically equals to the mean number of arrivals that occur
during the call duration. The offered traffic A is thus a measure of the demand placed on
the system. The numerical values of A are expressed in units called Erlangs (Erl.), a unit
named after A. K. Erlang, a Danish mathematician who pioneered much early telephone
traffic theory. In the USA, offered traffic is also expressed in terms of hundred call-seconds
per hour (CCS). 1 CCS is the offered traffic due to one call of 100 seconds duration, or 100
calls of 1-second duration, or any combination in between. We can deduce that an Erlang is
equal to 36 CCS.
A = λ/µ = λT . (3.2)
� Grade of service
When a call can not be set-up immediately because there is no free channel available, blocking
or congestion is said to have occurred. The grade of service (GOS) is a numerical quantity
that describes the level of service provided, and is synonymous with the probability of having
a call attempt blocked.
� Carried traffic
Another useful quantity is the carried traffic (Ac) which is defined in general for systems in
statistical equilibrium as the mean number of busy channels. From its name, the carried
traffic reflects the proportion of calls that is handled by the system (not blocked) and thus,
it is the difference between the offered traffic and the blocked or lost traffic.
3.2.2 General birth-death process
To set-up a teletraffic model with any queue discipline, we establish a general model to
determine the probability of having a certain number of channels being busy. The arrival
and termination of a call can be represented by birth and death processes, respectively. The
number of calls (waiting and in service) in the network is represented by states j = 0, 1, 2, · · · .
The development of queuing models that are birth-death process, and for which the input

3.3. Some Basic Models 33
process, the service mechanism, and the queue discipline can be specified through choice
of birth rates λj and the death rates µj. We are interested in the steady state condition,
which is reached under statistical equilibrium. The statistical equilibrium means that the
chance of finding the network in any specified state is the same. Equivalently, the statistical
equilibrium state probabilities are defined when the probability to move to state j is equal
to the probability of leaving state j, i.e.,
µjPj = λj−1Pj−1 . (3.3)
By iterations,
Pj =λj−1λj−2 · · ·λ0
µjµj−1 · · ·µ1
P0, (3.4)
where the value of P0 is obtained by setting the summation of all probabilities to unity.
3.3 Some Basic Models
In this section we are going to analyze some basic teletraffic models with different queue
disciplines, the input process is assumed to be Poisson (random) or quasi-random process.
3.3.1 Erlang loss formula BCC (random traffic)
The demand for telephone calls has a random nature. Calls arrive at the network and depart
at random, and the number of calls in progress, and hence the number of busy channels,
jj -1 j +1
j-1 jj-2
10
0
1
1
j j+1 j+2j-1
j+1
Figure 3.1: State transition diagram for general birth-death process.
3.3. Some Basic Models 34
will vary in a random fashion. This randomness of call arrivals implies that the inter-arrival
time between calls is negatively exponential distributed. If the mean arrival rate is λ, then
the mean inter-arrival time is 1/λ. This means that calls arrive without reference to each
other and independently on the state of the network. Furthermore, this randomness implies
that the probability that k calls originate during an arbitrary time interval t is distributed
according to the Poisson law given in Eq. (3-5)
Pk (t) =(λt)k
k!e−λt . (3.5)
The theoretical support for this is that the number of users should be infinite. Practically
this condition is satisfied when the number of users is large compared to the number of
channels (e.g. by a ratio of 10). Therefore, for N channels BCC system as shown in Fig. 3.2
the call arrival rate, generated by an infinite number of users, is independent of the number
of users already engaged, so we can write
λj =
λ 0 ≤ j ≤ N − 1
0 j = N
. (3.6)
Because the call duration has a negative exponential distribution, when there are j calls in
progress the departure rate µj is
µj = jµ 0 ≤ j ≤ N .
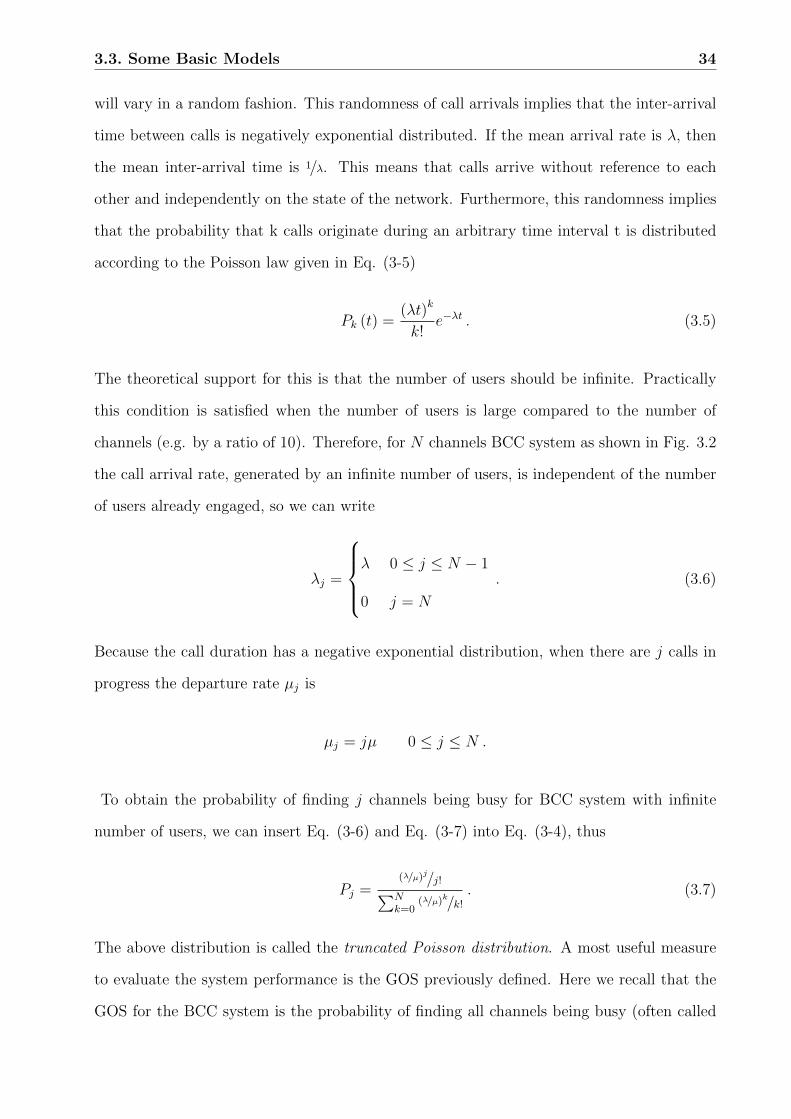
To obtain the probability of finding j channels being busy for BCC system with infinite
number of users, we can insert Eq. (3-6) and Eq. (3-7) into Eq. (3-4), thus
Pj =(λ/µ)j/j!∑Nk=0
(λ/µ)k/k!. (3.7)
The above distribution is called the truncated Poisson distribution. A most useful measure
to evaluate the system performance is the GOS previously defined. Here we recall that the
GOS for the BCC system is the probability of finding all channels being busy (often called

3.3. Some Basic Models 35
Figure 3.2: Blocked calls cleared BCC system.
the blocking probability PB) and thus a call attempt will be lost and cleared from the system.
This will be intuitively obtained by substituting j = N in Eq. (3-8), therefore
PB = PN =(λ/µ)N/N !∑Nk=0
(λ/µ)k/k!. (3.8)
This formula was first derived by Erlang in 1917, called the Erlang loss formula in the United
States and is denoted by B (N,A). While in Europe it is called Erlang’s first formula and is
denoted by E1,2 (A) where A = λ/µ is the offered traffic previously defined. An application of
the BCC assumption arises in telephone traffic engineering, where calls that find all trunks
busy are given a busy signal.
3.3.2 Engset formula BCC (quasi-random traffic)
We assume that the number of users M is finite (but still greater than the number of channels
N) and each user independently generates requests at rate α when idle. Clearly, the arrival
call rate will not be constant (independent of the network state) as in Poisson random
arrivals, but it will depend directly on the number of idle users, therefore we have
λj =
(M − j)α 0 ≤ j ≤ N − 1
0 j = N
. (3.9)
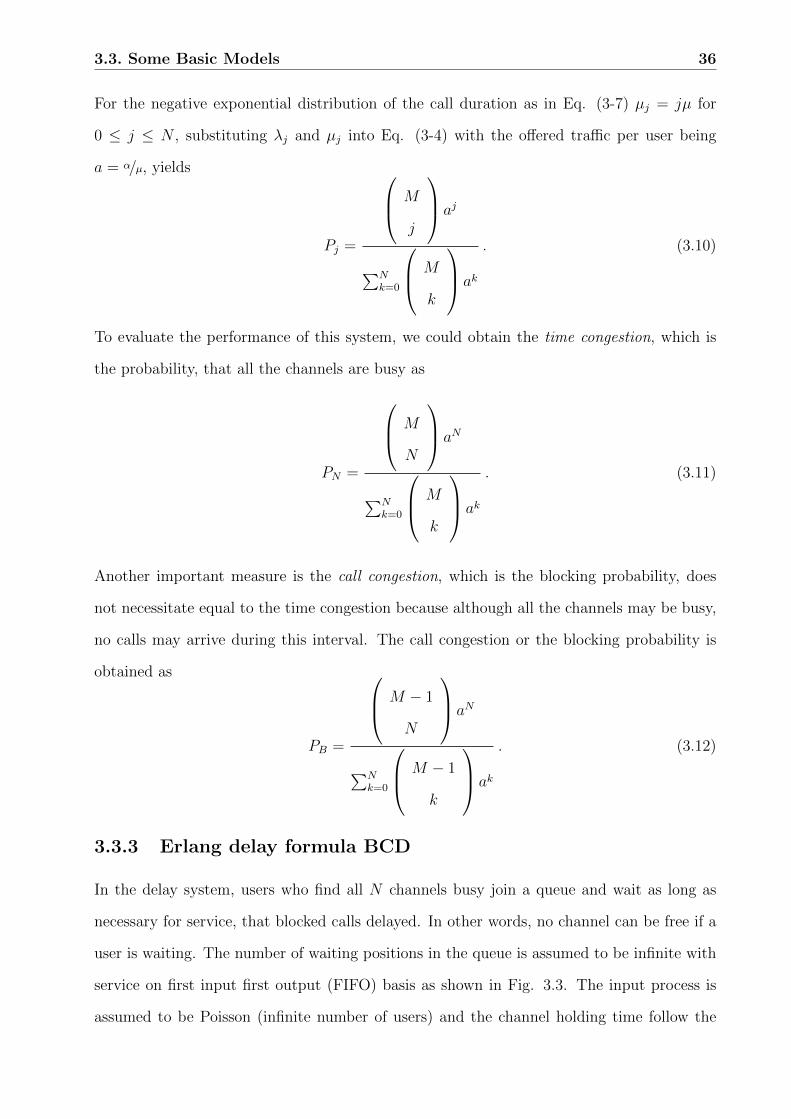
3.3. Some Basic Models 36
For the negative exponential distribution of the call duration as in Eq. (3-7) µj = jµ for
0 ≤ j ≤ N , substituting λj and µj into Eq. (3-4) with the offered traffic per user being
a = α/µ, yields
Pj =
M
j
aj
∑Nk=0
M
k
ak
. (3.10)
To evaluate the performance of this system, we could obtain the time congestion, which is
the probability, that all the channels are busy as
PN =
M
N
aN
∑Nk=0
M
k
ak
. (3.11)
Another important measure is the call congestion, which is the blocking probability, does
not necessitate equal to the time congestion because although all the channels may be busy,
no calls may arrive during this interval. The call congestion or the blocking probability is
obtained as
PB =
M − 1
N
aN
∑Nk=0
M − 1
k
ak
. (3.12)
3.3.3 Erlang delay formula BCD
In the delay system, users who find all N channels busy join a queue and wait as long as
necessary for service, that blocked calls delayed. In other words, no channel can be free if a
user is waiting. The number of waiting positions in the queue is assumed to be infinite with
service on first input first output (FIFO) basis as shown in Fig. 3.3. The input process is
assumed to be Poisson (infinite number of users) and the channel holding time follow the

3.3. Some Basic Models 37
NED, therefore both the call arrival rate and the departure rate are given by
λj = λ j = 0, 1, 2, · · · (3.13)
µj =
jµ j = 0, 1, 2, · · · , N
Nµ j = N,N + 1 · · ·. (3.14)
Eq. (3-15) is obtained from the assumption of NED of the channel holding time. That
implies that if at any time all the j calls in the system are in service, the rate at which
service completions occur is jµ; if all N channels are busy, only those users that are in
service are eligible to leave.
To obtain the probability of finding j channels being busy, we can insert Eq. (3-14) and
Eq. (3-15) into Eq. (3-4), thus
Pj =
Aj
j!P0, j = 0, 1, · · · , N − 1
Aj
N !Nj−N P0, j = N,N + 1, · · ·(3.15)
where P0 is given by
P0 =
[N−1∑k=0
Ak
k!+∞∑k=N
Ak
N !Nk−N P0
]−1
. (3.16)
If A < N , the infinite geometric sum on the right of Eq. (3-17) converges, and
P0 =
[N−1∑k=0
Ak
k!+
AN
(N − 1)! (N − A)
]−1
. (3.17)
Figure 3.3: Blocked calls delayed BCD system.
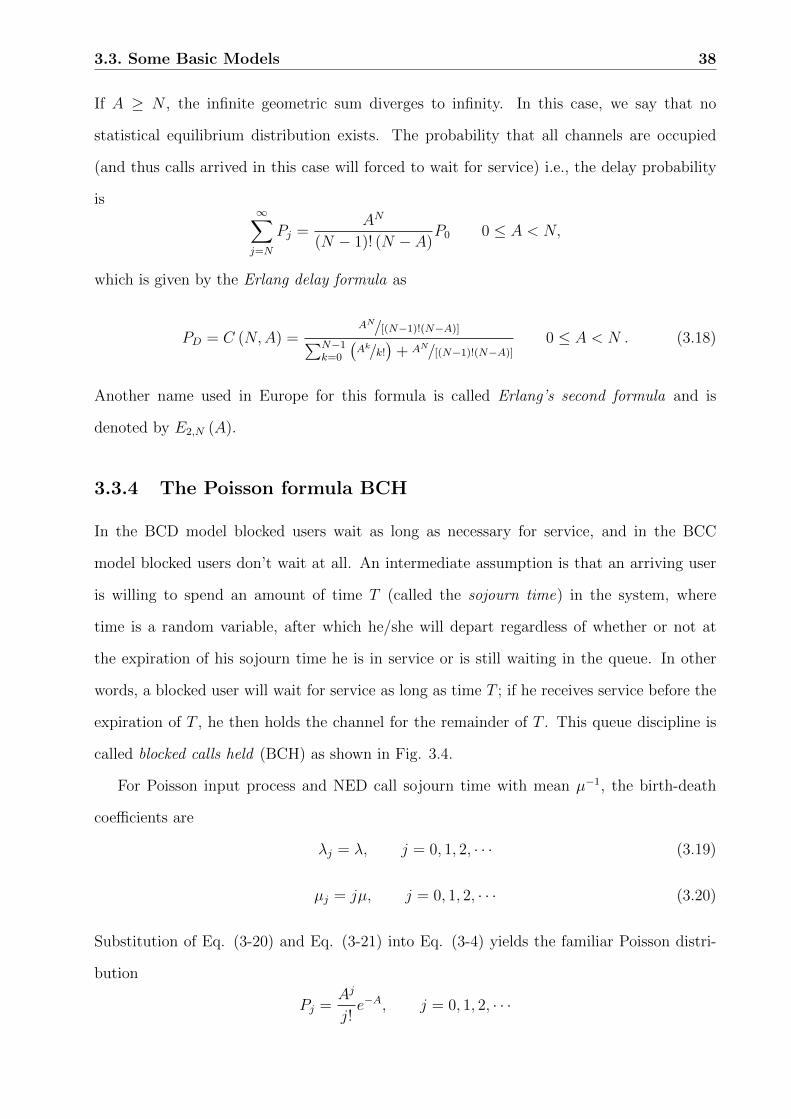
3.3. Some Basic Models 38
If A ≥ N , the infinite geometric sum diverges to infinity. In this case, we say that no
statistical equilibrium distribution exists. The probability that all channels are occupied
(and thus calls arrived in this case will forced to wait for service) i.e., the delay probability
is∞∑j=N
Pj =AN
(N − 1)! (N − A)P0 0 ≤ A < N,
which is given by the Erlang delay formula as
PD = C (N,A) =AN/[(N−1)!(N−A)]∑N−1
k=0
(Ak/k!
)+ AN/[(N−1)!(N−A)]
0 ≤ A < N . (3.18)
Another name used in Europe for this formula is called Erlang’s second formula and is
denoted by E2,N (A).
3.3.4 The Poisson formula BCH
In the BCD model blocked users wait as long as necessary for service, and in the BCC
model blocked users don’t wait at all. An intermediate assumption is that an arriving user
is willing to spend an amount of time T (called the sojourn time) in the system, where
time is a random variable, after which he/she will depart regardless of whether or not at
the expiration of his sojourn time he is in service or is still waiting in the queue. In other
words, a blocked user will wait for service as long as time T ; if he receives service before the
expiration of T , he then holds the channel for the remainder of T . This queue discipline is
called blocked calls held (BCH) as shown in Fig. 3.4.
For Poisson input process and NED call sojourn time with mean µ−1, the birth-death
coefficients are
λj = λ, j = 0, 1, 2, · · · (3.19)
µj = jµ, j = 0, 1, 2, · · · (3.20)
Substitution of Eq. (3-20) and Eq. (3-21) into Eq. (3-4) yields the familiar Poisson distri-
bution
Pj =Aj
j!e−A, j = 0, 1, 2, · · ·
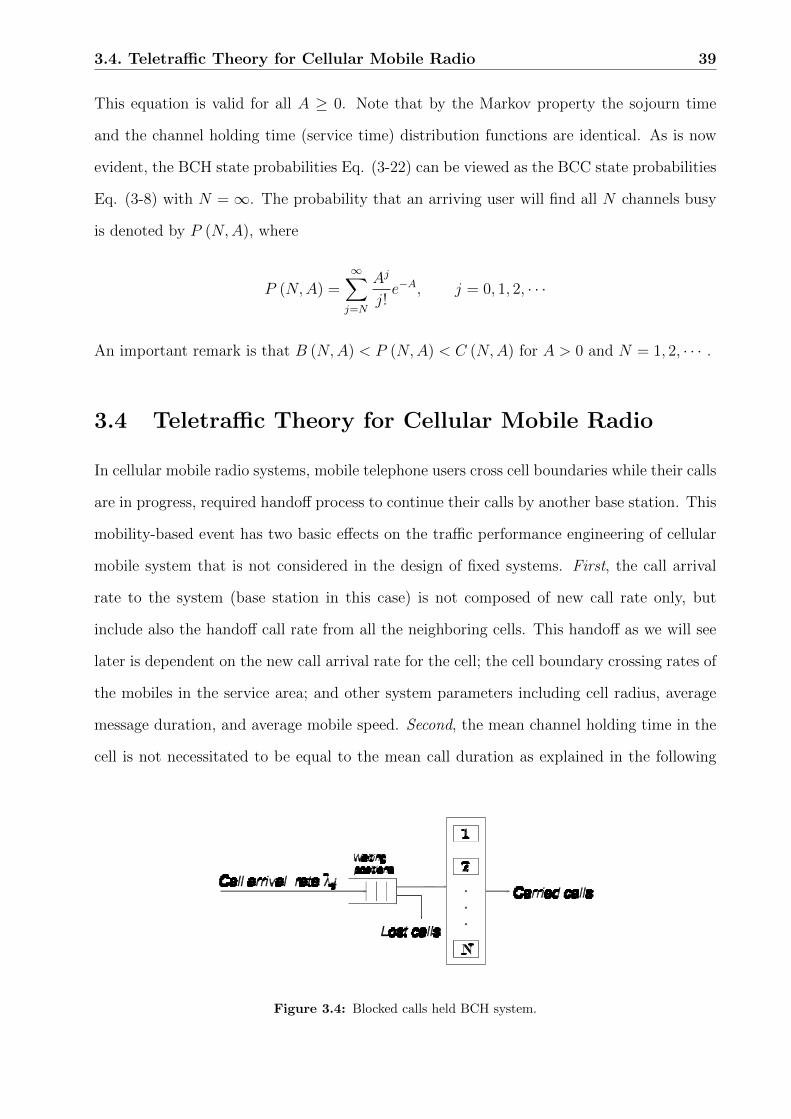
3.4. Teletraffic Theory for Cellular Mobile Radio 39
This equation is valid for all A ≥ 0. Note that by the Markov property the sojourn time
and the channel holding time (service time) distribution functions are identical. As is now
evident, the BCH state probabilities Eq. (3-22) can be viewed as the BCC state probabilities
Eq. (3-8) with N =∞. The probability that an arriving user will find all N channels busy
is denoted by P (N,A), where
P (N,A) =∞∑j=N
Aj
j!e−A, j = 0, 1, 2, · · ·
An important remark is that B (N,A) < P (N,A) < C (N,A) for A > 0 and N = 1, 2, · · · .
3.4 Teletraffic Theory for Cellular Mobile Radio
In cellular mobile radio systems, mobile telephone users cross cell boundaries while their calls
are in progress, required handoff process to continue their calls by another base station. This
mobility-based event has two basic effects on the traffic performance engineering of cellular
mobile system that is not considered in the design of fixed systems. First, the call arrival
rate to the system (base station in this case) is not composed of new call rate only, but
include also the handoff call rate from all the neighboring cells. This handoff as we will see
later is dependent on the new call arrival rate for the cell; the cell boundary crossing rates of
the mobiles in the service area; and other system parameters including cell radius, average
message duration, and average mobile speed. Second, the mean channel holding time in the
cell is not necessitated to be equal to the mean call duration as explained in the following
Figure 3.4: Blocked calls held BCH system.

3.4. Teletraffic Theory for Cellular Mobile Radio 40
paragraph. When a call is originated in a cell and gets a channel, the call holds the channel
until the call is completed in the cell or the mobile moves out of the cell. Therefore, the
channel holding time in the cell THn is either the mean call duration TM or the time Tn
for which the mobile resides in the cell (from the onset of the call), whichever is less. For
a call that has been handed off successfully, the channel is held until the call is completed
in the cell or the mobile again moves out of the cell before call completion. Because of the
memoryless property of the exponential distribution, the remaining duration of a call after
handoff has the same distribution as the mean call duration. In this case the channel holding
time in the cell THh is either the remaining of the call duration TM or mobile residing time
Th in the cell (from cell crossing); whichever is less. This is represented mathematically as
THn = min (TM , Tn)
THh = min (TM , Th)(3.21)
The average channel holding time in the cell T̄H will be obtained from both THn and THh as
we will see later.
Once, the total call arrival rate (new and handoff calls) and the average channel holding
time are determined for an arbitrary cell. The cellular mobile teletraffic modeling could be
analyzed and evaluated to obtain the performance measures that determines the required
GOS in terms of blocking probability according to the aforementioned queue disciplines
models. The design is usually achieved for a mobile station-to-base station or vice versa
(MS↔BS) communication path which indeed is valid for the whole system design if we
consider a large number of cells, with uniformly distributed users in the whole service area.
Under statistical equilibrium each cell will exhibit similar statistical behavior independently.
For mobile station-to-mobile station MS↔MS communications, the case will not much differs
because if the blocking probability of MS↔BS is PB, then the successful connection of
MS↔MS will be
Psucc = (1− PB) (1− PB) . (3.22)

3.4. Teletraffic Theory for Cellular Mobile Radio 41
Then the blocking probability of MS↔MS connection PBm−m is
PBm−m = 1− Psucc . (3.23)
Chapter 4
Mobility Management in Multilayered
Systems
4.1 Introduction
One of the important engineering issues in cellular communication systems is to improve
spectrum efficiency because teletraffic demands for wireless communications services are
increasing dramatically. Microcell systems can be given more channels per unit coverage
area than macrocell systems so that the spectrum efficiency of microcell systems is better
than that of macrocell systems. However, microcell systems are not cost effective in areas
with low user population density due to base station building cost; they are also not suitable
for high mobility users with large handoff rate. Therefore, cellular systems with hierarchical
structure were proposed to take the advantages of both microcell and macrocell systems [22].
Serving both low- and high-mobility user populations within an integrated system re-
presents a major challenge in PCS. To do this objective, a wireless system should strive to
maximize the number of subscribers while keeping the network control (associated with han-
doff) at an acceptable level. Achieving the conflicting goals of maximizing network capacity
(which implies the use of small cells i.e., microcells) and minimizing network control (which
favors large cells i.e., macrocells), requires a system architecture consisting of two tiers of
cells [23].
42

4.2. Mobility Management 43
Several researches on two tiers systems have been extensively carried out and deployed in
major city centers, these include microcell and macrocell as mentioned above and represent
the terrestrial systems. However, these systems would be primarily restricted to regional
service because the complete deployment of such terrestrial networks take several years due
to the network infrastructures needed to cover the entire service area. As a consequence, such
deployment will start in more densely populated geographical (metropolitan) areas, where
the communication demand is higher. Whereas areas characterized by spread-out population
and/or low communication demand (rural and developing areas) will have to wait a long time
for a homogeneous distribution of the network facilities [24]. It is thus evident that a new
dimension of the multilayer system should be introduced to obtain a seamless coverage using
satellite systems.
The main advantages of the use of the satellite are the enlargement and a completion of
the service area, the immediate deployment of the service and the availability of additional
capacity; on the other hand, the satellite resources can not support the same traffic volume
as a cellular terrestrial network [25]. Thus, integration of terrestrial and satellite systems is
indispensable.
In this chapter, the multilayered systems with hierarchical structures including terrestrial
systems represented by microcells, macrocells and satellite systems represented by spotbeam
cells are integrated to attain the desired unified global mobile communication system. Also,
the mobility management of this integration is introduced.
4.2 Mobility Management
Mobility management enables telecommunication networks to locate roaming terminals for
call delivery and to maintain connections as the terminal is moving into a new service area.
Thus, mobility management supports mobile terminals, allowing users to roam while simul-
taneously offering them incoming calls and supporting calls in progress.
The next-generation wireless networks will begin to implement terminal mobility, personal
mobility, and service provider portability. Terminal mobility refers to the ability of the
network to route calls to the mobile terminal (MT) regardless of its point of attachment to

4.2. Mobility Management 44
the network, while personal mobility is the ability of the users to access their personal services
independent of their attachment point or terminal. Service provider portability allows the
user and/or the MT to move beyond regional mobile networks. The users will be able to
receive their personalized end-to-end services regardless of their current network–within the
limits of the visited network’s service offering. The wireless user terminals are connecting to
the unified wireless network via their resident networks [26].
This freedom requires future wireless networks to incorporate and transport heteroge-
neous traffic over both wireless and wireline networks. This level of global mobile freedom
will also require the coordination of a wide range of service providers, compatibility of back-
bone networks, and network operator agreements.
Mobility management handles all the issues associated with the mobility features of the
next-generation wireless networks, such as location management and handoff management.
It is the basis for ubiquitous, location-independent communications.
4.2.1 Location management
Location management is a two-stage process that enables the network to discover the current
attachment point of the mobile user for call delivery. The first is location registration (or
location update). In this stage, the mobile terminal periodically notifies the network of its
new access point, allowing the network to authenticate the user and revise the user’s location
profile. The second stage is call delivery. Here the network is queried for the user location
profile and the current position of the mobile host is found.
Current techniques for location management involve database architecture design and the
transmission of signalling messages between various components of a signalling network. As
the number of mobile subscribers increases, new or improved schemes are needed to support
effectively a continuously increasing subscriber population. Since location management deals
with database and signalling issues, many of the issues are not protocol dependent.
In ordinary wireline networks, such as telephone network, there is a fixed relationship
between a terminal and its location. Changing the location of a terminal generally involves
the network administration and it cannot easily be performed by a user. Incoming calls for

4.2. Mobility Management 45
a particular terminal are always routed to its associated location, as there is no distinction
between a terminal and its location. In contrast, MT’s are free to travel and thus the network
access point of an MT changes as it moves around the network coverage area. As a result,
the ID of an MT does not implicitly provide the location information of the MT and the call
delivery process becomes more complex.
Current schemes for public land mobile network (PLMN) location management are based
on a two-level data hierarchy such that two types of network location database, the home
location register (HLR) and the visitor location register (VLR), are involved in tracking an
MT. In general, there is an HLR for each network and a user is permanently associated with
an HLR in his/her subscribed network. Information about each user, such as the types of
services subscribed and location information, are stored in a user profile located at the HLR.
The number of VLR’s and their placements vary among networks. Each VLR stores the
information of the MT’s (downloaded from the HLR) visiting its associated area.
There are currently two commonly used standards for location management in the PLMN:
the Electronic and telephone industry associations EIA/TIA Interim Standard 41 (IS-41)
in North America and the Global System for Mobile Communications (GSM) in Europe,
partition their coverage areas into a number of location areas (LA), each consisting of a
group of cells. When a mobile enters an LA, it reports to the network the information
about its current new location (location update). When an incoming call arrives, the network
simultaneously pages the mobile (terminal paging) in all cells within the LA where the mobile
currently resides. In these standards, the LA coverage is fixed for all users [27]. In general,
all BS’s belonging to the same LA are connected to the same MSC. The IS-41 standards for
location registration and call delivery are presented here.
4.2.1.1 Location registration
The following is the ordered list of tasks that are performed during location registration as
illustrated in Fig. 4.1.
1. The MT enters a new LA and transmits a location update message to the new BS.
2. The BS forwards the location update message to the MSC, which lunches a registration
4.2. Mobility Management 46
query to its associated VLR.
3. The VLR updates its record on the location of the MT. If the new LA belongs to
a different VLR, the new VLR determines the address of the HLR of the MT from
its mobile identification number. This is achieved by a table lookup procedure called
global title translation. The new VLR then sends a location registration message to
the HLR. Otherwise, location registration is completed.
4. The HLR performs the required procedures to authenticate the MT and records the
ID of the new serving VLR of the MT. The HLR then sends a registration acknowled-
gement message to the new VLR.
5. The HLR sends a registration cancellation to the old VLR.
6. The old VLR removes the record of the MT and returns a cancellation message to the
HLR.
4.2.1.2 Call delivery
Two major steps are involved in call delivery: i) determining the serving VLR of the called
MT and ii) locating the visiting cell of the called MT. Locating the serving VLR of the called
MT involves the following as illustrated in Fig. 4.2.
1. The calling MT sends a call initiation signal to the serving MSC of the MT through a
nearby BS.
2. The MSC determines the address of the HLR of the called MT by global title translation
and sends a location request message to the HLR.
3. The HLR determines the serving VLR of the called MT and sends a route request
message to the VLR. This VLR then forward the message to the MSC serving the MT.
4. The MSC allocates a temporary identifier called temporary local directory number
(TLDN) to the MT and sends a reply to the HLR together with the TLDN.

4.2. Mobility Management 47
H
L
R
MSC
VLR
MSC
VLR
(3)
(4) (6)
(5)
(2)
MT
(1)
BS
Figure 4.1: Location registration procedures.
5. The HLR forwards this information to the MSC of the calling MT.
6. The calling MSC requests a call set up to the called MSC through the signalling system
7 (SS7) network.
The procedure described above allows the network to set up a connection from the calling
MT to the serving MSC of the called MT. Since each MSC is associated with an LA and
there are more than one cell in each LA, a mechanism is therefore necessary to determine
the cell location of the called MT. This is achieved by paging (or alerting) procedures such
that polling signals are broadcast to all cells within the residing LA of the called MT. On
receiving the polling signal, the MT sends a replay, which allows the MSC to determine its
current residing cell.
The above procedures for location registration and call delivery result in a significant
signalling traffic especially when the number of mobile subscribers keeps increasing. That is
due to the centralized database architecture used. A consequence of this is that the connec-
tion set up delay may become very high. On the other hand, an advantage of the centralized

4.2. Mobility Management 48
H
L
R
(6) MSC
VLR
MSC
VLR
(2)
(5) (4)
(3)
(1)
Called MT
Calling MT
Figure 4.2: Call delivery procedures.
approach is that the number of database updates and queries for location registration and
call delivery is relatively small. This minimizes the delay due to database accesses.
The distributed database approach has the advantage that database accesses are localized.
An update or query to a far away database is executed only when necessary. However, the
number of database accesses required for location registration and call delivery is significantly
increased from that of the centralized approach. According to the aforementioned, it is
likely that the ideal architecture should lie between the centralized and the fully distributed
approach. Thus future research in location registration and call delivery should focus on the
design of network architectures that combine, to a certain degree, the centralized and the
fully distributed approaches. In addition, methods for determining the mobility level and
the call arrival statistics for an MT in real-time must be developed. Dynamic schemes for
limiting or enhancing the distribution of location information on a per-user basis should be
considered.
4.2. Mobility Management 49
4.2.2 Handoff management
Handoff is another important function of mobility management. It is unique in cellular sys-
tems and crucial to support global roaming in PCS. Handoff denotes the process of changing
the channel associated with the current connection to maintain acceptable service quality or
to provide better service. It is often initiated either by cell boundary crossing or deteriorated
service quality in the current channel.
With the penetration of PCS, the microcell and the hybrid cell (macro-, micro-, and pico-
) structure are exploited to support the drastically increased demand. The smaller cell size
and the variable propagation conditions in microcells introduce much more frequent handoffs
than ever before. Poorly designed handoff strategy will generate very heavy signalling traffic
and worsen service quality.
To maintain acceptable service to the moving user, basic requirements for integrated
systems handoff operations are the execution speed and reliability as well as transparency to
the user. In addition, due to the multiple types of services supported, the handoff strategy
needs to take different features of these services into account, i.e.; the ideal handoff process
is service-independent. For example, voice transmission is very sensitive to interruption. On
the other hand, loss data has little impact on the data performance since it can be recovered
by the retransmission procedure. Therefore, a successful handoff is very important to voice,
but not as critical to data (the data here is not delay-sensitive) [3].
In order to enable the seamless integration between existing and future networks, it is
necessary to develop radio independent signalling protocol. In an integrated UMTS envi-
ronment, a dual-mode space/terrestrial terminal will enable the continuation of an ongoing
call, which otherwise would have been dropped (resulting in the subsequent degradation in
quality of service), by transferring the call from one network (whether a terrestrial or satel-
lite) to the other (satellite or terrestrial). This is known as intersegment handoff (ISHO) or
vertical handoff (as the call upwards or downwards between layers). Of course the handoff
between cells within the same layer (horizontal handoff) is also considered.
The priority level of the satellite resources has two criteria: i) Satellite and terrestrial
resources have the same priority, and the choice between them is based on the link quality

4.2. Mobility Management 50
criterion. ii) Satellite resources are considered more precious than the terrestrial ones and
chosen only if terrestrial resources are not available for whatever reason (e.g. lack of coverage,
congestion of channels, etc.)
They represent a link-based and a network-based criterion, respectively. It is found that
a more efficient resource management of the integrated system is obtained by the latter.
Therefore, this criterion has been selected [24]. Thus, it is intuitively noted that horizontal
handoff is the first choice, when both horizontal and vertical handoffs are available. This is
due to the less impact on the system signalling traffic and design complexity encountered
with the horizontal handoff. In order to implement ISHO, an effective protocol must be
implemented, taking into account the difference between the propagation delays and radio
interface characteristics of the respective segments (satellite and terrestrial). For maximum
network efficiency, such a protocol should aim to minimize the signalling load and the si-
gnalling delay [28].
The handoff process usually consists of three phases: i) the initiation phase, ii) the
decision phase, and iii) the execution phase.
The handoff may be initiated under three situations:
1. When the received signal strength degrades due to bad propagation conditions.
2. When the user moves across the cell boundary.
3. When the system needs to rearrange the resource allocation to accommodate new
services.
The monitoring of the signal quality and the subsequent decision to initiate handoff encom-
passes the first two phases. These two phases can be performed by four different handoff-
controlling schemes, depending on whether the MT or the network makes the decision and
monitors the link quality, namely
� Network-controlled handoff (NCHO)
� Mobile-controlled handoff (MCHO)
� Network-assisted handoff (NAHO)
4.2. Mobility Management 51
� Mobile assisted handoff (MAHO)
In MAHO, both mobile and network monitor the link quality. The MT monitor the current
link quality of the surrounding terrestrial cells and visible satellite beams (spotbeams) and
passes this information to the fixed part of the network for further analysis. The network
decides when to initiate handoff and the appropriate target cell or beam to handoff the call.
This scheme requires less-sophisticated MT when compared with NAHO. Furthermore, under
the MAHO scheme, the handoff decision is more reliable when compared with the MCHO
or the NCHO. Hence this handoff scheme has the advantages of being simple to implement
and reducing the signalling load and thus was employed in the GSM mobile standard.
There are two types of handoff processes to achieve different goals, namely, intercell
handoff and intracell handoff. In an intracell handoff, the user is transferred to a new
channel from the current one, but the service is still provided by the same BS. This kind
of handoff is usually caused by deteriorated channel quality or resource rearrangement. An
intercell handoff is triggered when the user moves away from the current serving BS or the
current BS cannot provide sufficient service quality.
Once the handoff initiation and decision phases have been accomplished, the handoff
execution phase will follow to establish new connections with the target BS (in the terrestrial
case) or the fixed earth station (FES) (in the satellite case) and to disconnect the original
connections (signalling and traffic channels) with the serving BS (or FES). This requires a
signalling procedure for a handoff connection establishment to be performed between the MT
and network. There are two distinct connection establishment schemes for this signalling
procedure, namely, forward and backward. The main difference between these two schemes
depends on which signalling channel is used to perform the signalling exchange required for
the handoff execution. The forward scheme establishes and uses a new signalling channel with
the target BS (or FES) while the latter retains the old signalling link to perform signalling
exchanges.
Finally, three different transference schemes can be used in the establishment of new
traffic channels, namely, hard handoff, soft handoff, and signalling diversity. In the first
scheme, the current traffic channel is released before the establishment of the new one, while

4.2. Mobility Management 52
in the second and third schemes, the current traffic connection will not be released until the
new one is firmly established. In the second strategy, both the current and new traffic links
are used simultaneously during handoff execution. With signalling diversity, the signalling
procedures are performed through both the old and new signalling link simultaneously, while
the user traffic uses the old traffic link. When the new traffic channel is firmly established,
the user traffic is then switched to the new link and the old one is released [28].
Incomplete calls are considered less desirable from the user’s viewpoint than the oc-
currence of blocking of a new call and they should be at a minimum. Since a customer’s
satisfaction is determined by rate of call completions and how low the connection delays
are, it is the interest of the service provider to meet these satisfaction measures as much as
possible [29]. Therefore, the resource assignment should give priority to handoff calls. In the
following some different proposed types of priority disciplines are considered.
� Reserved channel scheme
In this scheme, a few channels, say N are reserved and dedicated for handoff use. Suppose
there are C channels in a cell, the other (C − N) channels can be shared between handoff
calls and new calls. If the number of free channels is less than or equal to N, the new call will
be blocked. The handoff calls can still gain access to the system until there is no available
channel. This method reduces the failure rate of handoff calls at the expense of increasing
the new call blocking rate and reducing the spectrum efficiency.
� N-times retry scheme
The unsuccessful handoff requests can be resubmitted for a specific number of times at
predetermined time intervals. More retries give the handoff calls more opportunity to access
the channel than the new ones. Therefore, the handoff failure rate will be reduced. The
new call blocking rate remains almost unchanged since all channels are available for the new
calls.
� Queueing scheme
4.3. Location Registration and Call Delivery Research 53
The handoff call can be queued if no channel is available when the request is presented.
This scheme exploits the fact that the user will spend some time in the handoff area, i.e.,
in this area, the user can still receive acceptable service through the old connection before
the new one is established. There are two types of priority schemes, the FIFO scheme and
the measurement-based priority scheme. In the FIFO scheme, the handoff request is queued
according to the request arrival time. While the measurement-based priority scheme ensures
that the user in the most urgent situation gets access to the system first. The problem of
this priority scheme is that it is complicated compared to the FIFO one.
� Sub-rating scheme
Sub-rating means an occupied full-rate channel is temporarily divided into two channels
at half the original rate: one to serve the existing call and the other to serve the handoff
request [30]. When there is a free channel, one of the half-rate calls will be moved there,
freeing up a half-rate channel which will be merged with the other half-rate one to provide a
full-rate service again. This scheme trades the service quality with the system capacity [3].
4.3 Location Registration and Call Delivery Research
The cost of mobility management is defined as the sum of a mobile’s location update cost
and the cost incurred in paging the mobile [27]. These costs are highly dependent on the
database network architecture and the signalling traffic cost associated with location update
and paging.
A very large number of mobile terminals, worldwide service area, and a broad range of
terminal mobilities may result in excessive supervisory signalling traffic for location updating
and paging. Larger LA’s allow less frequent LA boundary crossings and thus less signalling
traffic for location updates. However, larger LA’s imply larger paging areas, which in turn
introduce, for an incoming call, longer paging delay and/or more paging traffic on control
channels. The size of the LA must balance the signalling costs of location updating and
paging [31]. Methods for reducing the signalling traffic are therefore needed.
4.3. Location Registration and Call Delivery Research 54
Research in this area generally falls into two categories. A centralised database structure,
which records all movements of MT’s in a central database, has a simple algorithm to locate
MT’s. But its implementation is impractical because the centralized database cannot support
such a large number of MT’s in a global system. The other category is a distributed database
structure. This structure was studied for third-generation mobile systems and consists of
distributed HLR’s which store the permanent MT information within any network and VLR
in charge of roaming MT’s in one or more location areas [32].
A study presented in [32] shows that the cost of signalling network traffic and its travel-
ling distance is less important relative to the number database accesses and complexity of
database processing for locating a MT unless the signalling network traffic exceeds certain
limits, on the order of several Mb/s. This is due to the advances in fiber optic technology
and the wavelength division multiplexing techniques which make it possible for transport
transmission systems to have enough bandwidth up to 100 Gb/s.
4.3.1 Centralized database structure
An advantage of the centralized approach is that the number of database updates and que-
ries for location registration and call delivery is relatively small. This minimizes the delay
due to database accesses. But as the number of MT’s increases, the signalling traffic may
significantly degrade the performance of the network. One undesirable consequence is that
the connection set-up delay may become very high.
4.3.1.1 Pointer forwarding
The basic idea of the pointer forwarding scheme is that instead of reporting a local change
to the HLR every time the MT moves to an area belonging to a different VLR, the reporting
can be eliminated by simply setting up a forwarding pointer from the old VLR to the new
VLR. When a call for the MT is initiated, the network locates the MT by first determining
the VLR at the beginning of the pointer chain and then following the pointers to the current
serving VLR of the MT. To minimize the delay in locating an MT, the length of the pointer
chain is limited to a predefined maximum value K. When the length of the pointer chain

4.3. Location Registration and Call Delivery Research 55
reaches K, additional forwarding is not allowed and location change must be reported to the
HLR as shown in Fig 4.3 for K = 2. And then the original pointers are deleted and the HLR
records the ID of the current serving VLR of the MT.
4.3.1.2 Local anchoring
Under this scheme, a VLR close to the MT is selected as its local anchor. Instead of
transmitting registration messages to the HLR. Location changes are reported to the local
anchor. Since the local anchor is close to the MT, the signalling cost incurred in location
registration is reduced. The HLR keeps a pointer to the local anchor. When an incoming
call arrives, the HLR queries the local anchor of the called MT which, in turn, queries the
serving VLR to obtain a routable address to the called MT.
4.3.2 Distributed database structure
The distributed database approach has the advantage that database accesses are localized.
An update or query to a far away database is executed only when necessary. However, the
number of database accesses required for location registration and call delivery is significantly
increased from that of the centralized approach. Careful design is needed to ensure that
database accesses will not significantly increase the signalling delay.
HLR
VLR1MSC1
VLR2MSC2
VLR3MSC3
VLR4MSC4
MT
Figure 4.3: Pointer forwarding scheme.
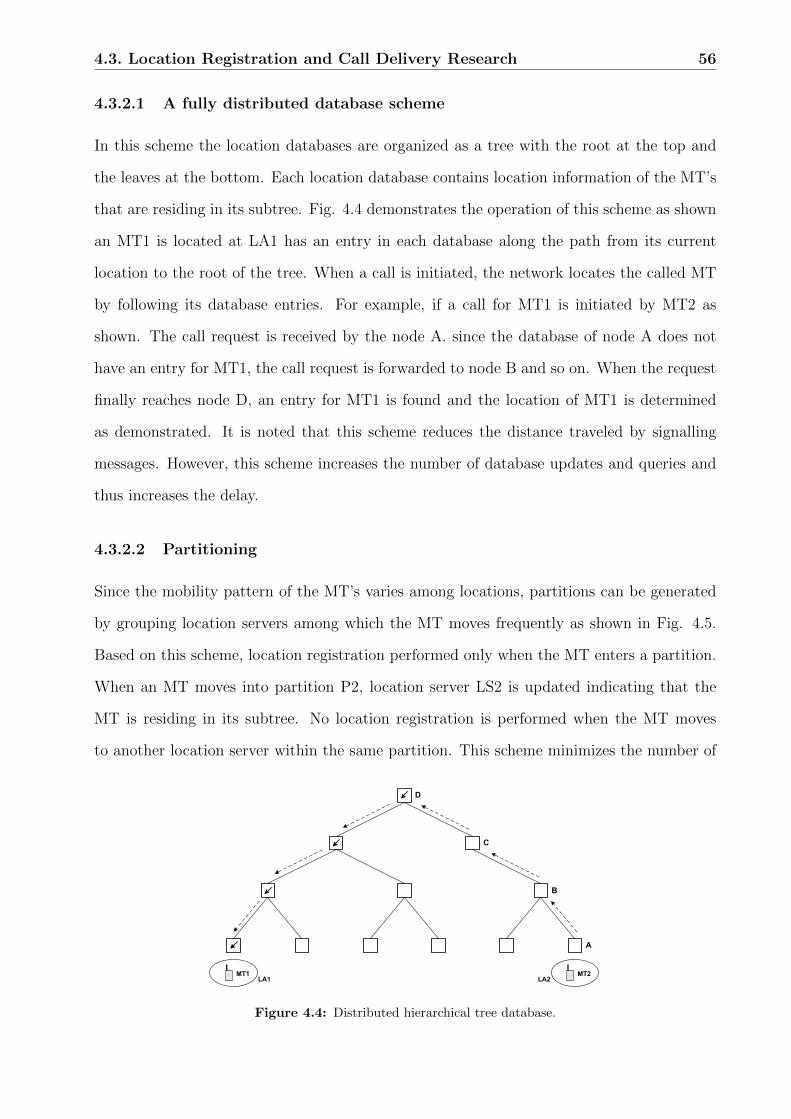
4.3. Location Registration and Call Delivery Research 56
4.3.2.1 A fully distributed database scheme
In this scheme the location databases are organized as a tree with the root at the top and
the leaves at the bottom. Each location database contains location information of the MT’s
that are residing in its subtree. Fig. 4.4 demonstrates the operation of this scheme as shown
an MT1 is located at LA1 has an entry in each database along the path from its current
location to the root of the tree. When a call is initiated, the network locates the called MT
by following its database entries. For example, if a call for MT1 is initiated by MT2 as
shown. The call request is received by the node A. since the database of node A does not
have an entry for MT1, the call request is forwarded to node B and so on. When the request
finally reaches node D, an entry for MT1 is found and the location of MT1 is determined
as demonstrated. It is noted that this scheme reduces the distance traveled by signalling
messages. However, this scheme increases the number of database updates and queries and
thus increases the delay.
4.3.2.2 Partitioning
Since the mobility pattern of the MT’s varies among locations, partitions can be generated
by grouping location servers among which the MT moves frequently as shown in Fig. 4.5.
Based on this scheme, location registration performed only when the MT enters a partition.
When an MT moves into partition P2, location server LS2 is updated indicating that the
MT is residing in its subtree. No location registration is performed when the MT moves
to another location server within the same partition. This scheme minimizes the number of
A
B
C
D
MT1 MT2LA1 LA2
Figure 4.4: Distributed hierarchical tree database.

4.3. Location Registration and Call Delivery Research 57
location registration in areas where the mobility rate of the MT’s is high.
The concept of LA used in the current PLMN has a number of inefficiencies associated
with the static location updates and paging of this concept as follows:
1. Excessive location updates may be performed by MT’s that are located around LA
boundaries and are making frequent movements back and forth between two LA’s.
2. Requiring the network to poll all cells within the LA each time a call arrives may result
in excessive volume of wireless broadcast traffic.
3. The mobility and call arrival patterns of MT’s vary, and it is generally difficult to
select an LA size that is optimal for all users. An ideal location update and paging
mechanism should be able to adjust on a per-user basis.
Recent research efforts attempt to reduce the effects of these inefficiencies. Many recent
efforts focus primarily on dynamic location update mechanisms, which perform location
update based on the mobility of the MT’s and the frequency of incoming calls (call arrival
pattern) [26].
Dynamic location management schemes discard the notation of LA borders. A mobile
in these schemes updates its location based on either elapsed time (time-based), number
of crossed cell borders (movement-based), or traveled distance (distance-based). All these
patterns can be dynamically adapted to each mobile’s traffic and mobility patterns, hence
providing better cost-effectiveness than the LA scheme [27].
LS3LS2LS1
Partition P1 Partition P2 Partition P3
Figure 4.5: Partitioning scheme.

4.3. Location Registration and Call Delivery Research 58
In the time-based scheme, the MT performs location updates periodically at a constant
time interval ∆T . While in the movement-based scheme, the MT performs location update
whenever it completes a predefined number of movements across cell boundaries. In the
distance-based scheme, the MT performs location updates when its distance from the cell it
preformed the last location update exceeds a predefined value. Researches in this area result
in that the distance-based scheme produces the best performance but its implementation
incurs the highest overhead.
From the preceding discussion of the location management in the future PLMN it is
concluded that:
� The network design architectures should combine, to a certain degree, the centralized
and the fully distributed approaches. In addition, methods for determining the mobility
level and the call arrival statistics for an MT in real-time must be developed.
� The design of dynamic location update and paging schemes should be simple to im-
plement.

Chapter 5
Teletraffic Modeling of an Integrated
Space/Terrestrial Cellular
Architecture with Different Priority
Schemes
5.1 Introduction
The integration between terrestrial networks and satellite systems is vital for global commu-
nication. Without satellite participation, terrestrial systems would be restricted to regional
service [4]. It is thus evident that integration of satellite network and terrestrial system is
indispensable in order to have seamless radio coverage with sufficient capacity to accommo-
date anticipated high teletraffic demand. Some basic problems of handoff, different handoff
scenarios, and relevant signalling aspects have been considered when GSM and MSS are
integrated in the same communication system. A substantial evolution of the GSM mobility
management techniques is required when integration with MSS using a dynamic satellite
constellation is considered. The complete integration of a satellite network with a terrestrial
cellular network is a system architecture challenge that requires solving problems at both
the transmission and the network levels [24].
59

5.2. Teletraffic Modelling of Voice Communications 60
The hierarchical cellular structure provides an efficient way for handling different tele-
traffic densities. On the terrestrial segment, the microcell layer provides services for areas
with high traffic densities, followed by an overlaying macrocell layer that serves moderate
traffic demand and provides relief channels for clusters of microcells. On the space segment,
low earth orbit (LEO) satellites introduce a new dimension to terrestrial communication for
seamless global coverage and relief the high teletraffic demand rejected by the terrestrial
segment. A pattern of overlapping spotbeams overlays clusters of macrocells. A general
frame work for hierarchical systems with two layers based on speed sensitive are presented
in [33] and [34]. In [35] terrestrial and satellite systems are integrated and different overflow
strategies are introduced. A three layered integrated system with reserved channel scheme
(RCS) handoff priority appeared in [36].
Many strategies have been recently proposed to privilege the handoff services at the
expenses of new call arrivals. On the basis of International Telecommunication Union (ITU)
requirements for land mobile services, the values of call dropping probability (Pdrop) and call
blocking probability (PB) should not exceed 5× 10⁻⁴ and 10−2, respectively [37].
In our work a multiple hierarchical cellular communication system with different handoff
priority schemes is evaluated. These include RCS, sub-rating scheme (SRS), and queueing
priority scheme (QPS).
5.2 Teletraffic Modelling of Voice Communications
In this section, a proposed model for voice services is introduced. A detailed analysis is
discussed in order to evaluate the performance measures of the proposed voice model.
5.2.1 Model description
Fig. 5.1 shows the encountered model layers. It is considered that every Cm microcells are
overlaid by a macrocell, and every CM macrocells are in turn overlaid by a spotbeam cell.
Independent statistical behaviour between neighbouring cells is assumed. We therefore, can
focus on only one cell in each layer. The operation scenario can be described with the aid of

5.2. Teletraffic Modelling of Voice Communications 61
Fig. 5.2 and the flow charts of Fig. 5.3, Fig. 5.4, and Fig. 5.5 as follows:
1. Consider that the number of channels assigned for each microcell, macrocell and spot-
beam cell are Nm, NM and Ns, respectively.
2. Consider also that the number of channels for handoff requests in each microcell, ma-
crocell and spotbeam cell are Nmh, NMh and Nsh respectively.
3. Furthermore, NMo channels per macrocell and Nso channels per spotbeam cell are
privileged to accommodate the handoff traffic overflowed to the macrocell and the
spotbeam cell, respectively.
4. Three categories of users are existing in the system. These are terrestrial-only users
with access to terrestrial subnetwork, satellite-only users with access to the space seg-
ment only and dual-mode users with access to both terrestrial and space segments.
5. A call attempt in terrestrial network is directed first to the lowest layer, i.e., the
microcell. The call is served if the number of channels in use is less than Nm−Nmh, or
overflowed to the umbrella macrocell and gets service there if the number of channels
in use is less than NM − NMo − NMh. Otherwise, the call is directed to the overlaid
highest layer (spotbeam cell) and served there if the number of channels in use in the
spotbeam cell is less than Ns −Nso −Nsh.
6. Handoff requests are privileged with more reserved channels. A handoff request is
served in the microcell if the number of channels in use are less than Nm and in the
macrocell if the number of channels in use are less than NM −NMh, and in spotbeam
cell if the number of channels in use are less than Ns −Nsh.
A similar approach is adopted for new and handoff calls initiated firstly in macrocells. In
addition to reserved channel scheme, channel sub-rating is also applied. For those calls first
initiated in the spotbeam cell we, furthermore, implement a queueing priority scheme in this
layer.
Note that since the direction of handoff overflow is upward only in the system hierarchy
(i.e., handoff requests search for idle channels starting from the same hierarchical level), and
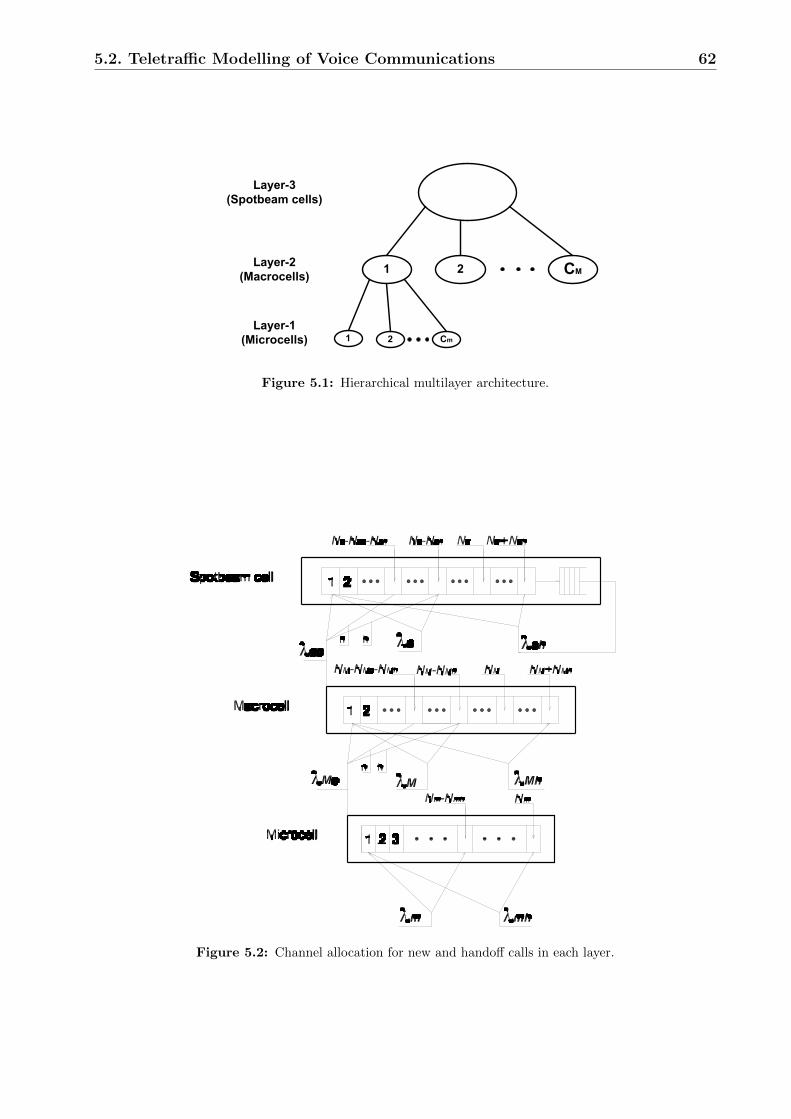
5.2. Teletraffic Modelling of Voice Communications 62
1 2 CM
Layer-3
(Spotbeam cells)
Layer-2
(Macrocells)
Layer-1
(Microcells) 1 2 Cm
Figure 5.1: Hierarchical multilayer architecture.
Figure 5.2: Channel allocation for new and handoff calls in each layer.
5.2. Teletraffic Modelling of Voice Communications 63
a call will not revert to service at lower level, the system operation tends to create a traffic
distribution in which high mobility users are more likely to be served by the larger cells (i.e.,
cells that are higher in system hierarchy). This traffic distribution is achieved without any
other mechanism for mobility management, such as those based on speed measurements for
initial cell assignment [36].
5.2.2 Performance analysis
In this section, a comprehensive analysis of the system performance in each level of the
hierarchy is introduced to obtain the performance measures of the system. These include
new call blocking, handoff failure, forced termination, and noncompletion probabilities.
� Microcell level
A hexagonal microcell shape with radius Rm is considered. A large population of mobile
users is assumed so that the average new call rate is independent of the number of calls
in progress. Each microcell is allocated Nm channel with fixed channel allocation (FCA)
scheme. Out of those channels, Nmh is exclusively reserved for handoff requests. The new
call rate in each microcell λm is related to the microcell radius, Rm, average user density in
the microcell, Dum, and new call rate per user λu as
λm =3√
3
2R2mλuDum . (5.1)
The channel holding times of new calls THn1, and handoff calls THh1, in the microcell are
given by [38, 39]
THn1 = min (TM , Tn1) ,
THh1 = min (TM , Th1) ,(5.2)
where TM is the average call duration, Tn1 is the residing time of a call initiated in the
microcell. The time Th1 is the residing time of a handoff call in the microcell. Assume that
TM , Tn1, and Th1 are independent negatively exponentially distributed random variables with
mean values of T̄M = 1/µM , T̄n1 = 1/µn1, and T̄h1 = 1/µh1 respectively. Let PBm, and Pfhm
denote the blocking and handoff failure probabilities at the microcell layer, respectively. The
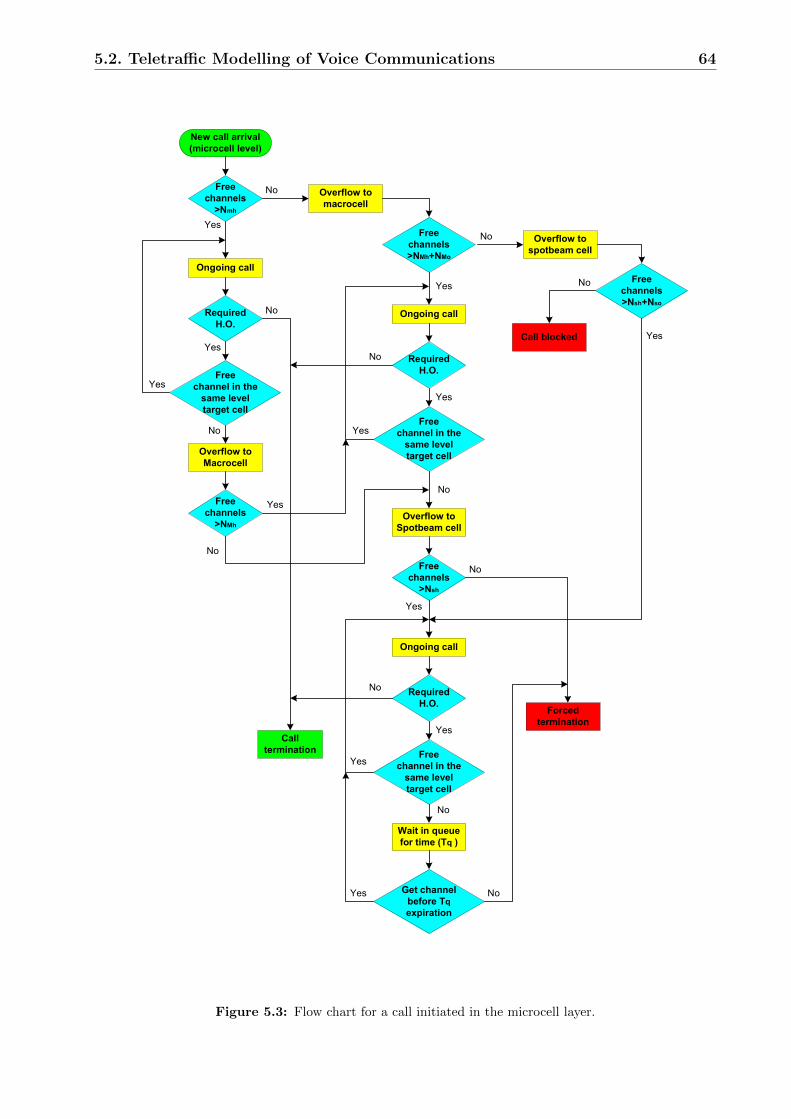
5.2. Teletraffic Modelling of Voice Communications 64
New call arrival
(microcell level)
Free
channels
>Nmh
Ongoing call
Required
H.O.
Free
channel in the
same level
target cell
Overflow to
Macrocell
Free
channels
>NMh
Ongoing call
Required
H.O.
Free
channel in the
same level
target cell
Free
channels
>Nsh
Ongoing call
Required
H.O.
Free
channel in the
same level
target cell
Wait in queue
for time (Tq )
Overflow to
Spotbeam cell
Yes
Yes
Call
termination
No
YesNo
Yes
No
Yes
No
Free
channels
>NMh+NMo
Overflow to
macrocell
No
Yes
Yes
No
Yes
Free
channels
>Nsh+Nso
Overflow to
spotbeam cell
No
Yes
Yes
No
Forced
termination
Yes
No
Call blocked
No
No
Get channel
before Tq
expiration
NoYes
Figure 5.3: Flow chart for a call initiated in the microcell layer.

5.2. Teletraffic Modelling of Voice Communications 65
New call arrival
(macrocell level)
Free
channels
>NMh
Ongoing call
Required
H.O.
Free
channel in the same
level target cell
Overflow to
spotbeam cell
Free
channels
>Nsh
Ongoing call
Required
H.O.
Free
channel in the same
level target cell
Yes
Yes
Call termination
No
YesNo
Yes
No
Yes
No
Free
channels
>Nsh+Nso
Overflow to
spotbeam cell
No
Yes
Yes
No
No
Call blocked
Forced
termination
Wait in queue for
time (Tq )
Get channel before
Tq expiration
No Yes
Figure 5.4: Flow chart for a call initiated in the macrocell layer.
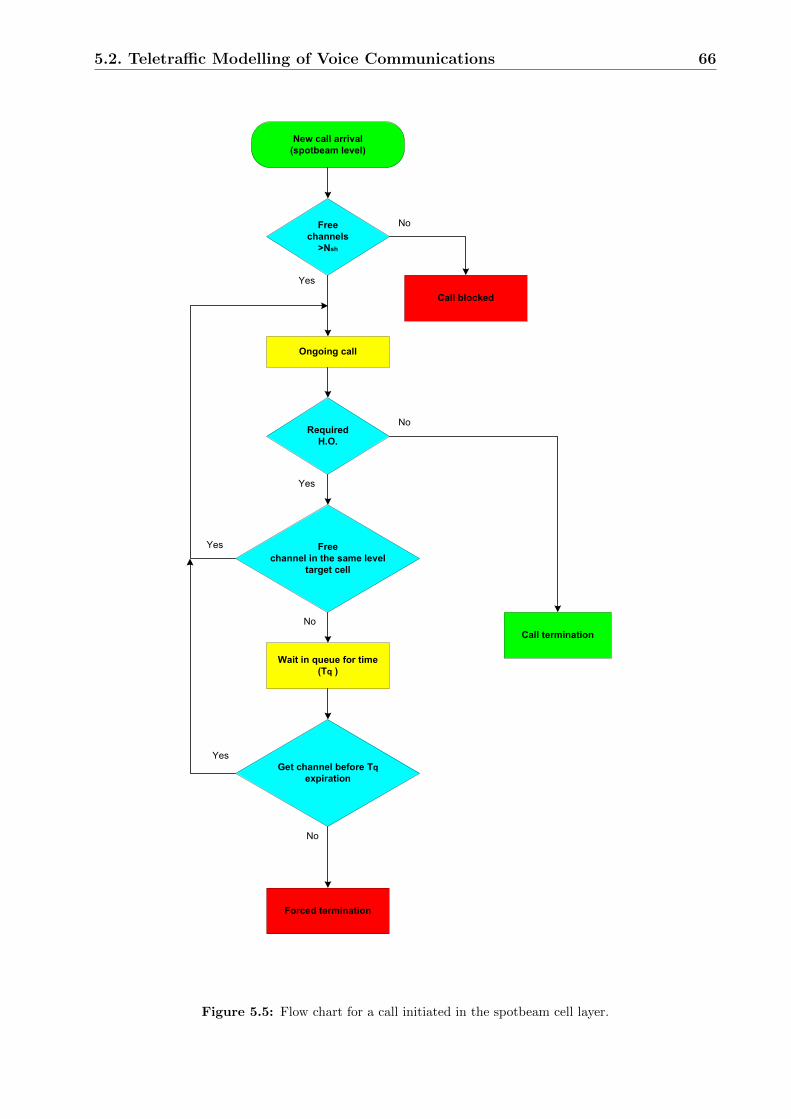
5.2. Teletraffic Modelling of Voice Communications 66
New call arrival
(spotbeam level)
Free
channels
>Nsh
Ongoing call
Required
H.O.
Free
channel in the same level
target cell
Yes
Yes
Call termination
No
No
Yes
No
No
Call blocked
Forced termination
Wait in queue for time
(Tq )
Get channel before Tq
expiration
Yes
Figure 5.5: Flow chart for a call initiated in the spotbeam cell layer.
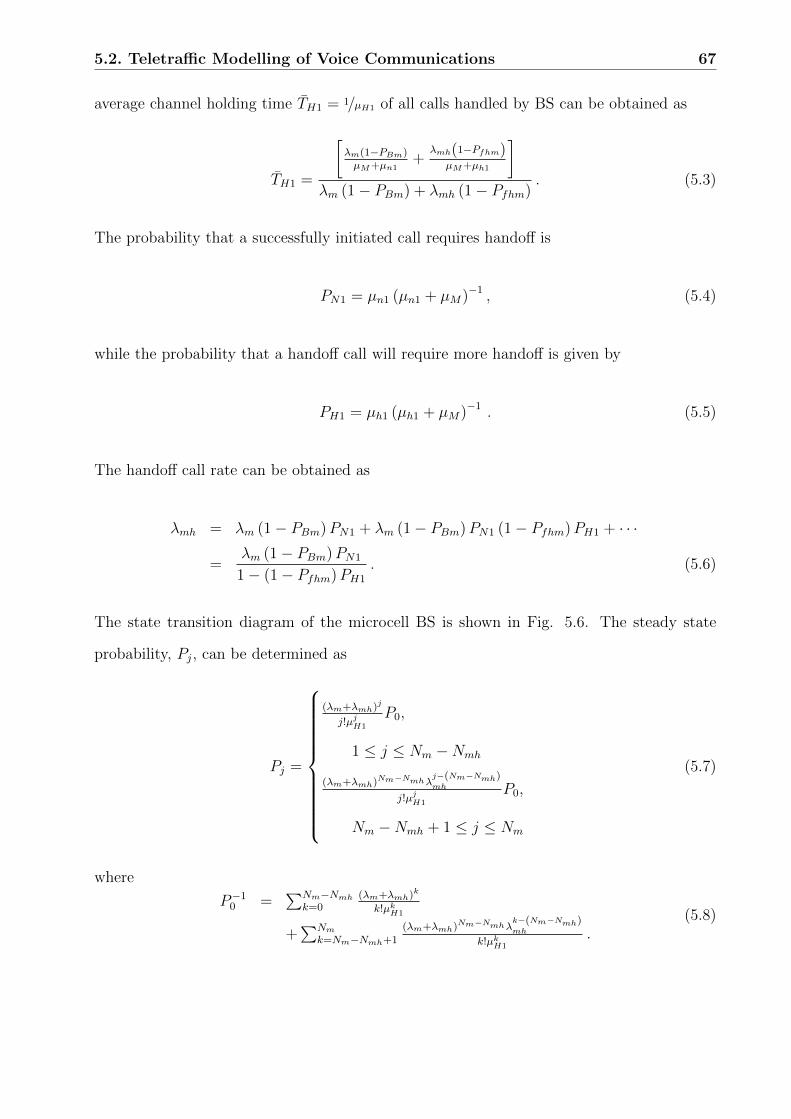
5.2. Teletraffic Modelling of Voice Communications 67
average channel holding time T̄H1 = 1/µH1 of all calls handled by BS can be obtained as
T̄H1 =
[λm(1−PBm)µM+µn1
+λmh(1−Pfhm)
µM+µh1
]λm (1− PBm) + λmh (1− Pfhm)
. (5.3)
The probability that a successfully initiated call requires handoff is
PN1 = µn1 (µn1 + µM)−1 , (5.4)
while the probability that a handoff call will require more handoff is given by
PH1 = µh1 (µh1 + µM)−1 . (5.5)
The handoff call rate can be obtained as
λmh = λm (1− PBm)PN1 + λm (1− PBm)PN1 (1− Pfhm)PH1 + · · ·
=λm (1− PBm)PN1
1− (1− Pfhm)PH1
. (5.6)
The state transition diagram of the microcell BS is shown in Fig. 5.6. The steady state
probability, Pj, can be determined as
Pj =
(λm+λmh)j
j!µjH1
P0,
1 ≤ j ≤ Nm −Nmh
(λm+λmh)Nm−Nmhλj−(Nm−Nmh)mh
j!µjH1
P0,
Nm −Nmh + 1 ≤ j ≤ Nm
(5.7)
where
P−10 =
∑Nm−Nmhk=0
(λm+λmh)k
k!µkH1
+∑Nm
k=Nm−Nmh+1
(λm+λmh)Nm−Nmhλk−(Nm−Nmh)mh
k!µkH1.
(5.8)
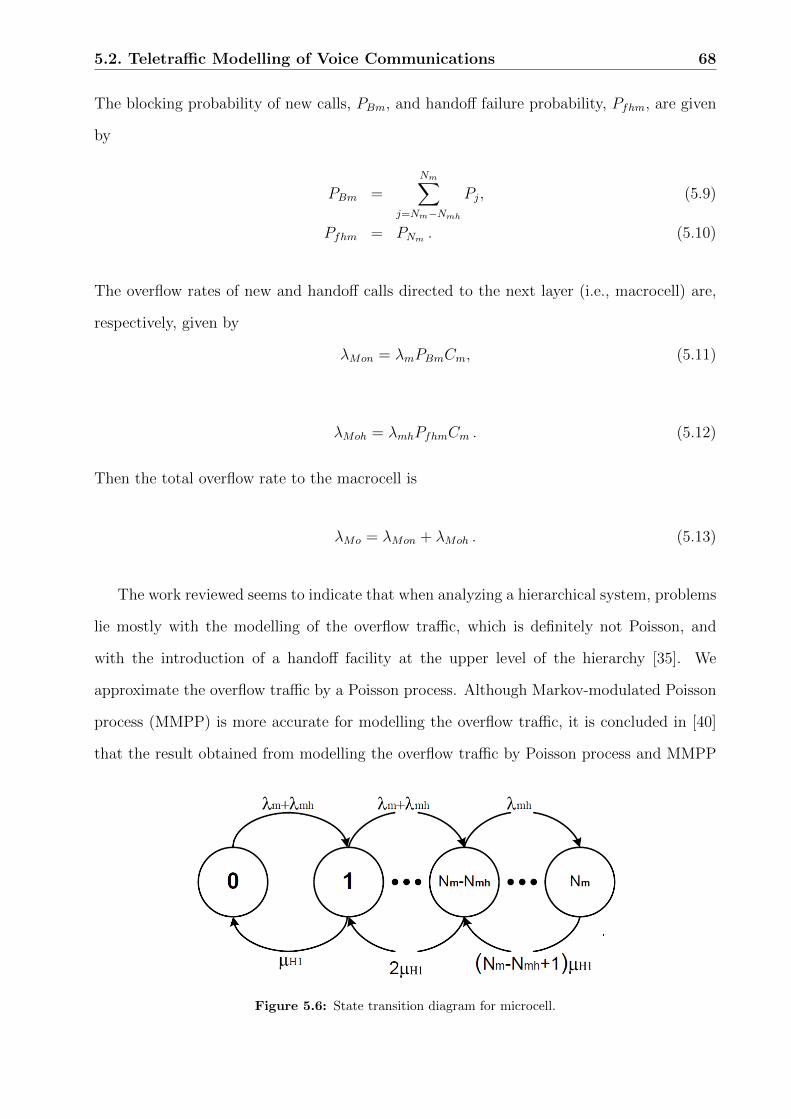
5.2. Teletraffic Modelling of Voice Communications 68
The blocking probability of new calls, PBm, and handoff failure probability, Pfhm, are given
by
PBm =Nm∑
j=Nm−Nmh
Pj, (5.9)
Pfhm = PNm . (5.10)
The overflow rates of new and handoff calls directed to the next layer (i.e., macrocell) are,
respectively, given by
λMon = λmPBmCm, (5.11)
λMoh = λmhPfhmCm . (5.12)
Then the total overflow rate to the macrocell is
λMo = λMon + λMoh . (5.13)
The work reviewed seems to indicate that when analyzing a hierarchical system, problems
lie mostly with the modelling of the overflow traffic, which is definitely not Poisson, and
with the introduction of a handoff facility at the upper level of the hierarchy [35]. We
approximate the overflow traffic by a Poisson process. Although Markov-modulated Poisson
process (MMPP) is more accurate for modelling the overflow traffic, it is concluded in [40]
that the result obtained from modelling the overflow traffic by Poisson process and MMPP
Figure 5.6: State transition diagram for microcell.

5.2. Teletraffic Modelling of Voice Communications 69
are very close. So, for simplicity we choose to consider Poisson modelling.
� Macrocell level
The macrocell BS handles both traffic belonging to this level (i.e., new and handoff calls
placed in regions uncovered by microcells) as well as the overflowed traffic denied in those
microcells underlayed the macrocell. Each macrocell is allocated NM channels, from which
NMo can not be accessed by new calls overflowed from microcells but allowed for the new
calls initiated in the macrocell and the overflow handoff attempts. Also NMh channels are
reserved for handoff calls in this level as shown in Fig. 5.2. Moreover, we allow those NMh
channels to be split to serve a handoff request if no channel is available and we call this
scheme the sub-rating technique. The new call rate in the macrocell λM is
λM =3√
3
2R2MλuDuM (5.14)
where RM is the macrocell radius and DuM is the average user density in the macrocell
regions uncovered by microcells. Newly originated calls have residing time Tn2 while the
handoff requests in the macrocell have residing time Th2. Both the new and handoff calls
overflowed to the macrocell are treated as new calls in the macrocell layer since the occurrence
of them is placed in an arbitrary position in the macrocell coverage area. Thus the cumulative
distribution function (CDF) of the channel holding time FTH2(t) is calculated as
FTH2(t) =
[(λM + λMoh) (1− PBM ) + λMon (1− PBMon)]FTHn2 (t) + λMh (1− PfhM )FTHh2 (t)
(λM + λMoh) (1− PBM ) + λMon (1− PBMon) + λMh (1− PfhM ).
(5.15)
The average channel holding time in the macrocell T̄H2 = 1/µH2 is given by
T̄H2 =
(λM+λMoh)(1−PBM )+λMon(1−PBMon)µM+µn2
+λMh(1−PfhM)
µM+µh2
(λM + λMoh) (1− PBM) + λMon (1− PBMon) + λMh (1− PfhM). (5.16)
The handoff rate in the macrocell is given by
λMh =PN2 [(λM + λMoh) (1− PBM) + λMon (1− PBMon)]
1− PH2 (1− PfhM)(5.17)
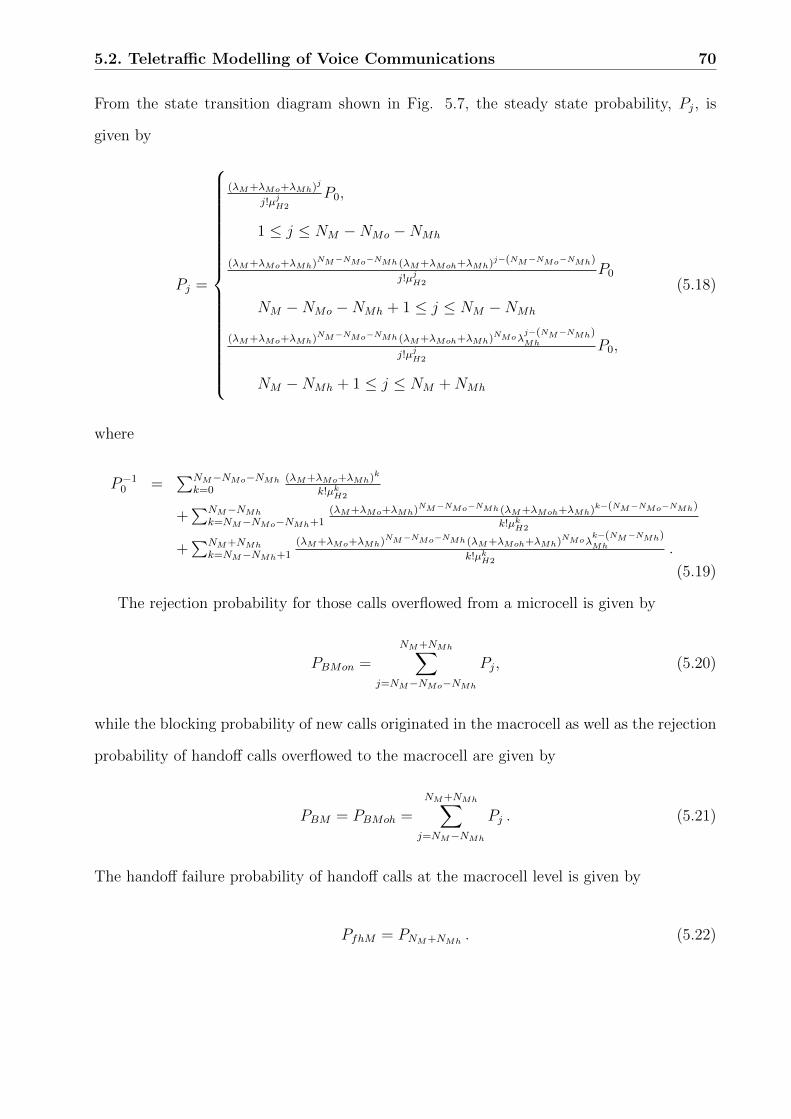
5.2. Teletraffic Modelling of Voice Communications 70
From the state transition diagram shown in Fig. 5.7, the steady state probability, Pj, is
given by
Pj =
(λM+λMo+λMh)j
j!µjH2
P0,
1 ≤ j ≤ NM −NMo −NMh
(λM+λMo+λMh)NM−NMo−NMh (λM+λMoh+λMh)j−(NM−NMo−NMh)
j!µjH2
P0
NM −NMo −NMh + 1 ≤ j ≤ NM −NMh
(λM+λMo+λMh)NM−NMo−NMh (λM+λMoh+λMh)NMoλj−(NM−NMh)Mh
j!µjH2
P0,
NM −NMh + 1 ≤ j ≤ NM +NMh
(5.18)
where
P−10 =
∑NM−NMo−NMh
k=0(λM+λMo+λMh)k
k!µkH2
+∑NM−NMh
k=NM−NMo−NMh+1(λM+λMo+λMh)NM−NMo−NMh (λM+λMoh+λMh)k−(NM−NMo−NMh)
k!µkH2
+∑NM+NMh
k=NM−NMh+1
(λM+λMo+λMh)NM−NMo−NMh (λM+λMoh+λMh)NMoλk−(NM−NMh)Mh
k!µkH2.
(5.19)
The rejection probability for those calls overflowed from a microcell is given by
PBMon =
NM+NMh∑j=NM−NMo−NMh
Pj, (5.20)
while the blocking probability of new calls originated in the macrocell as well as the rejection
probability of handoff calls overflowed to the macrocell are given by
PBM = PBMoh =
NM+NMh∑j=NM−NMh
Pj . (5.21)
The handoff failure probability of handoff calls at the macrocell level is given by
PfhM = PNM+NMh. (5.22)
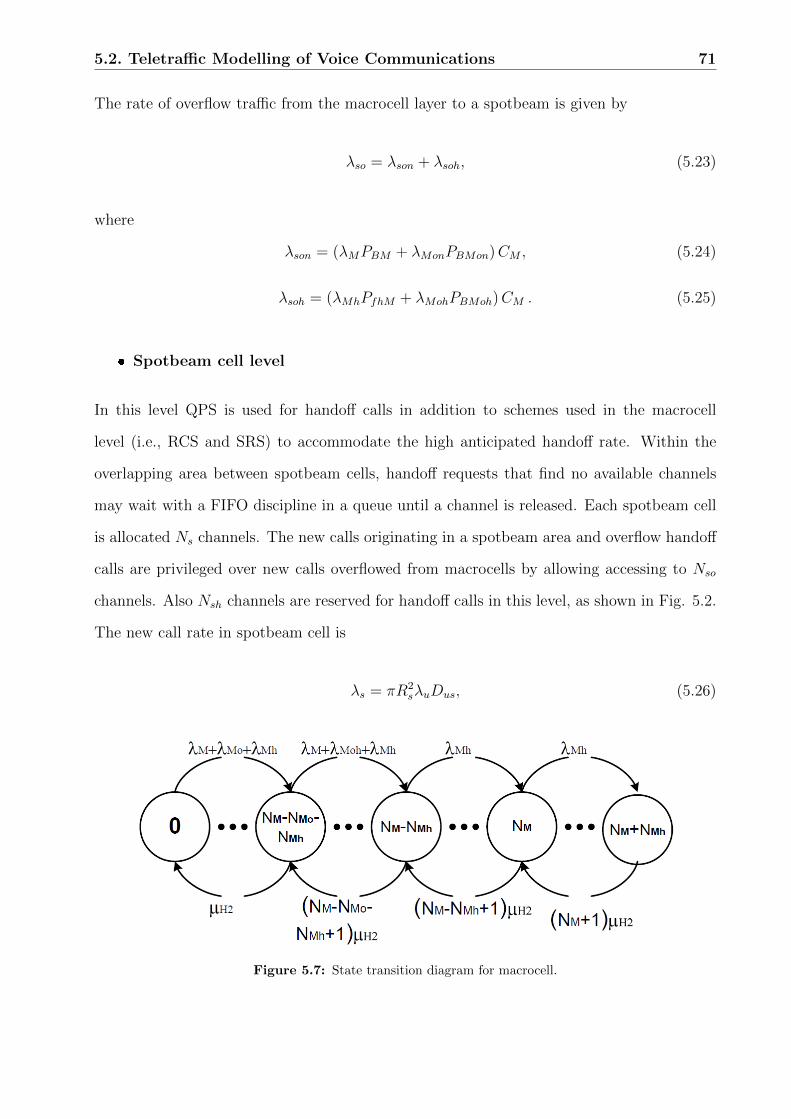
5.2. Teletraffic Modelling of Voice Communications 71
The rate of overflow traffic from the macrocell layer to a spotbeam is given by
λso = λson + λsoh, (5.23)
where
λson = (λMPBM + λMonPBMon)CM , (5.24)
λsoh = (λMhPfhM + λMohPBMoh)CM . (5.25)
� Spotbeam cell level
In this level QPS is used for handoff calls in addition to schemes used in the macrocell
level (i.e., RCS and SRS) to accommodate the high anticipated handoff rate. Within the
overlapping area between spotbeam cells, handoff requests that find no available channels
may wait with a FIFO discipline in a queue until a channel is released. Each spotbeam cell
is allocated Ns channels. The new calls originating in a spotbeam area and overflow handoff
calls are privileged over new calls overflowed from macrocells by allowing accessing to Nso
channels. Also Nsh channels are reserved for handoff calls in this level, as shown in Fig. 5.2.
The new call rate in spotbeam cell is
λs = πR2sλuDus, (5.26)
Figure 5.7: State transition diagram for macrocell.
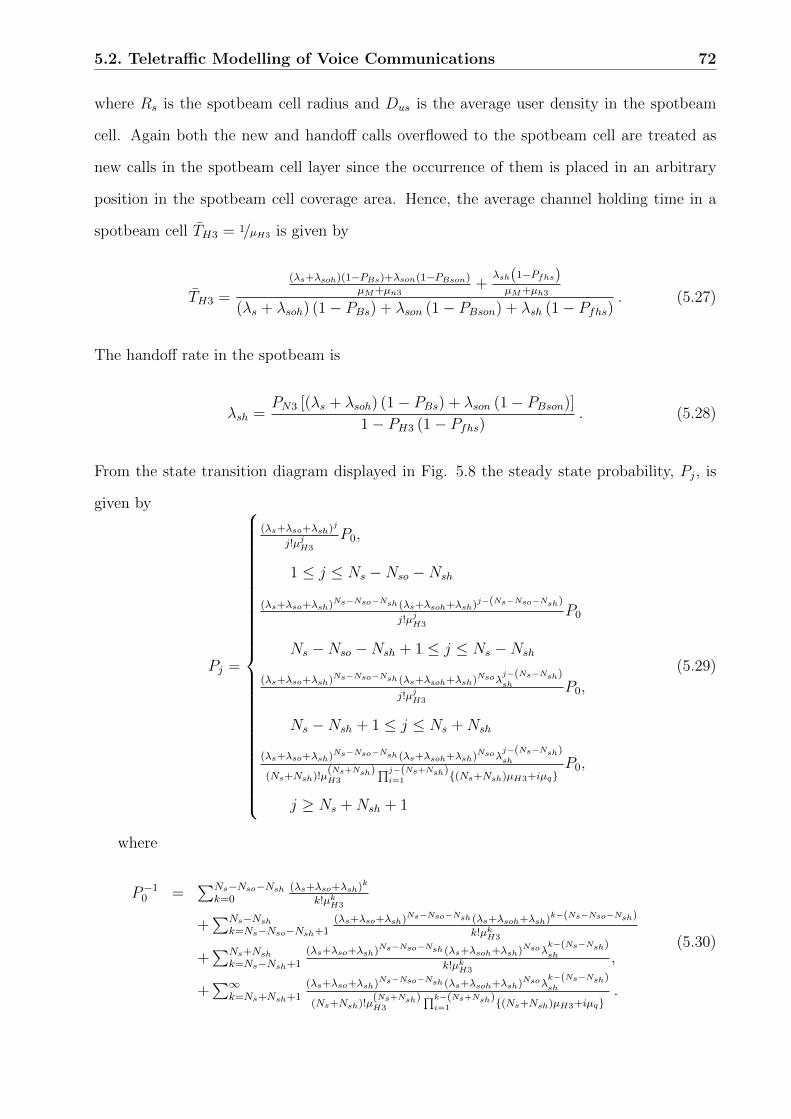
5.2. Teletraffic Modelling of Voice Communications 72
where Rs is the spotbeam cell radius and Dus is the average user density in the spotbeam
cell. Again both the new and handoff calls overflowed to the spotbeam cell are treated as
new calls in the spotbeam cell layer since the occurrence of them is placed in an arbitrary
position in the spotbeam cell coverage area. Hence, the average channel holding time in a
spotbeam cell T̄H3 = 1/µH3 is given by
T̄H3 =
(λs+λsoh)(1−PBs)+λson(1−PBson)µM+µn3
+λsh(1−Pfhs)µM+µh3
(λs + λsoh) (1− PBs) + λson (1− PBson) + λsh (1− Pfhs). (5.27)
The handoff rate in the spotbeam is
λsh =PN3 [(λs + λsoh) (1− PBs) + λson (1− PBson)]
1− PH3 (1− Pfhs). (5.28)
From the state transition diagram displayed in Fig. 5.8 the steady state probability, Pj, is
given by
Pj =
(λs+λso+λsh)j
j!µjH3
P0,
1 ≤ j ≤ Ns −Nso −Nsh
(λs+λso+λsh)Ns−Nso−Nsh (λs+λsoh+λsh)j−(Ns−Nso−Nsh)
j!µjH3
P0
Ns −Nso −Nsh + 1 ≤ j ≤ Ns −Nsh
(λs+λso+λsh)Ns−Nso−Nsh (λs+λsoh+λsh)Nsoλj−(Ns−Nsh)sh
j!µjH3
P0,
Ns −Nsh + 1 ≤ j ≤ Ns +Nsh
(λs+λso+λsh)Ns−Nso−Nsh (λs+λsoh+λsh)Nsoλj−(Ns−Nsh)sh
(Ns+Nsh)!µ(Ns+Nsh)H3
∏j−(Ns+Nsh)i=1 {(Ns+Nsh)µH3+iµq}
P0,
j ≥ Ns +Nsh + 1
(5.29)
where
P−10 =
∑Ns−Nso−Nshk=0
(λs+λso+λsh)k
k!µkH3
+∑Ns−Nsh
k=Ns−Nso−Nsh+1(λs+λso+λsh)Ns−Nso−Nsh (λs+λsoh+λsh)k−(Ns−Nso−Nsh)
k!µkH3
+∑Ns+Nsh
k=Ns−Nsh+1
(λs+λso+λsh)Ns−Nso−Nsh (λs+λsoh+λsh)Nsoλk−(Ns−Nsh)sh
k!µkH3,
+∑∞
k=Ns+Nsh+1
(λs+λso+λsh)Ns−Nso−Nsh (λs+λsoh+λsh)Nsoλk−(Ns−Nsh)sh
(Ns+Nsh)!µ(Ns+Nsh)H3
∏k−(Ns+Nsh)i=1 {(Ns+Nsh)µH3+iµq}
.
(5.30)
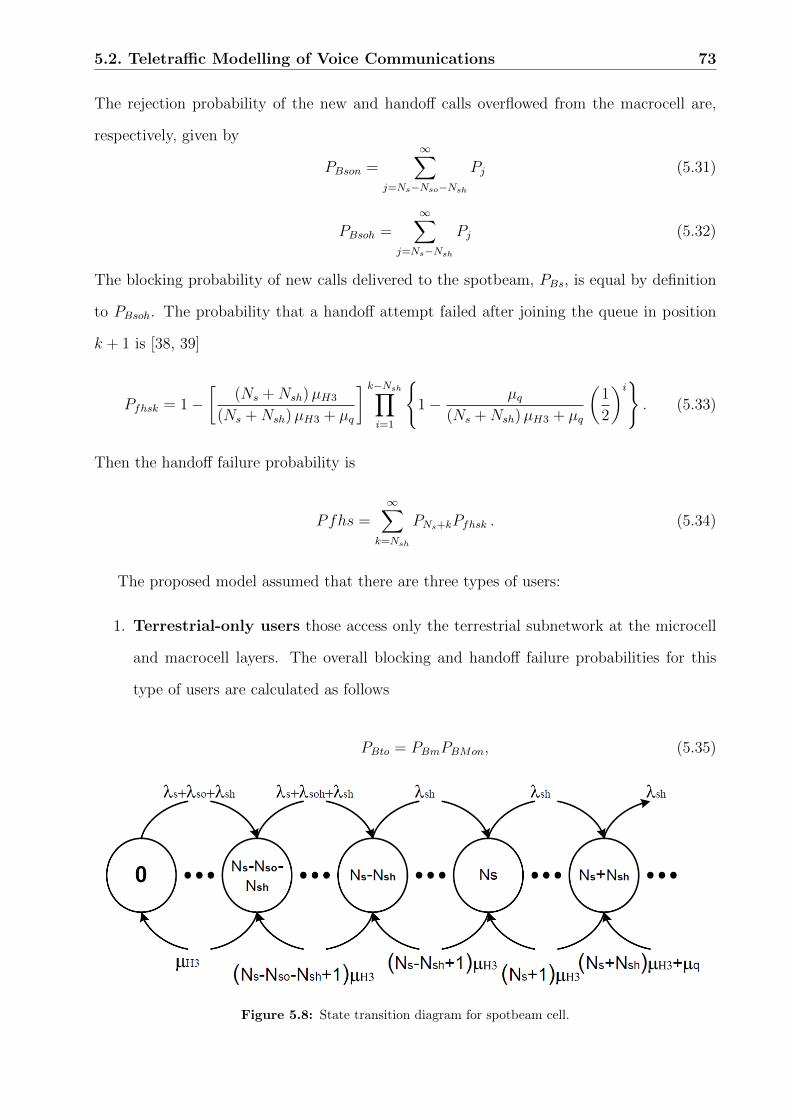
5.2. Teletraffic Modelling of Voice Communications 73
The rejection probability of the new and handoff calls overflowed from the macrocell are,
respectively, given by
PBson =∞∑
j=Ns−Nso−Nsh
Pj (5.31)
PBsoh =∞∑
j=Ns−Nsh
Pj (5.32)
The blocking probability of new calls delivered to the spotbeam, PBs, is equal by definition
to PBsoh. The probability that a handoff attempt failed after joining the queue in position
k + 1 is [38, 39]
Pfhsk = 1−[
(Ns +Nsh)µH3
(Ns +Nsh)µH3 + µq
] k−Nsh∏i=1
{1− µq
(Ns +Nsh)µH3 + µq
(1
2
)i}. (5.33)
Then the handoff failure probability is
Pfhs =∞∑
k=Nsh
PNs+kPfhsk . (5.34)
The proposed model assumed that there are three types of users:
1. Terrestrial-only users those access only the terrestrial subnetwork at the microcell
and macrocell layers. The overall blocking and handoff failure probabilities for this
type of users are calculated as follows
PBto = PBmPBMon, (5.35)
Figure 5.8: State transition diagram for spotbeam cell.
5.2. Teletraffic Modelling of Voice Communications 74
Pfhto = PfhmPBMoh . (5.36)
The weighted blocking and handoff failure probabilities are
PBtw =λmPBmCmPBMon + λMPBM
λmCm + λM, (5.37)
Pfhtw =λmhPfhmCmPBMoh + λMhPfhM
λmhCm + λMh
. (5.38)
2. Satellite-only users those access only to the satellite sub network. Both overall and
weighted blocking and handoff failure probabilities for this type of users are the same
as those for the satellite layer, i.e.,
PBso = PBsw = PBs, (5.39)
Pfhso = Pfhsw = Pfhs . (5.40)
3. Dual-mode users using dual-mode telephone sets, to enable them to access both
the terrestrial sub network and the satellite sub network. The overall and weighted
blocking and handoff failure probabilities for those users are given by
PBdo = PBmPBMonPBson, (5.41)
Pfhdo = PfhmPBMohPBsoh, (5.42)
PBdw =(λmPBmCmPBMon + λMPBM)CMPBson + λsPBs
λmCmCM + λMCM + λs, (5.43)
Pfhdw =(λmhPfhmCmPBMoh + λMhPfhM)CMPBsoh + λshPfhs
λmhCmCM + λMhCM + λsh. (5.44)
Another important parameter for evaluating the system performance is the forced termina-
tion probability. It is defined as the probability that a nonblocked call is forced to terminate
during its lifetime. It is important to distinguish between this probability and the handoff
failure probability during a single handoff attempt [8]. We define first PF1, PF2, and PF3 as
the noncompleted call probabilities because of handoff failure in micro- macro- and spotbeam

5.2. Teletraffic Modelling of Voice Communications 75
cell layers, respectively, as
PF1 =∞∑n=1
PN1Pfhm [(1− Pfhm)PH1]n−1 =PN1Pfhm
1− (1− Pfhm)PH1
, (5.45)
PF2 =PN2PfhM
1− (1− PfhM)PH2
, (5.46)
PF3 =PN3Pfhs
1− (1− Pfhs)PH3
.
The overall forced termination probability of the dual-mode users within a microcell, PFd,
is calculated as the probability that a call is initiated in a microcell and noncompleted
because of a handoff failure, or rejected in a microcell and accepted in a macrocell and then
noncompleted because of a handoff failure, or finally rejected in both microcell and macrocell
and accepted in a spotbeam cell and then noncompleted because of a handoff failure. To
compute this we first define the forced termination probability for calls initiated in micro-,
macro-, and spotbeam cells as PFm, PFM , and PFs, respectively, (clearly PFs is equal to PF3)
these are given by
PFm = PF1 [PBMoh + (1− PBMoh)PF2] [PBsoh + (1− PBsoh)PF3] , (5.47)
PFM = PF2 [PBsoh + (1− PBsoh)PF3] . (5.48)
Then
PFd =PFm [1− PBm] + PFM [PBm (1− PBMon)] + PFs [PBmPBMon (1− PBson)]
1− PBmPBMonPBson. (5.49)
Similarly, the overall forced termination probability of the terrestrial-only users within a
microcell, PFt, is calculated as the probability that a call is initiated in a microcell and
noncompleted because of a handoff failure, or is rejected in a microcell and accepted in a
macrocell and then noncompleted because of a handoff failure, this is given by
PFt =PF1 [PBMoh + (1− PBMoh)PF2] (1− PBm) + PF2 [PBm (1− PBMon)]
1− PBmPBMon
. (5.50)
5.3. Teletraffic Modelling of Voice and Data Services 76
Finally, the overall forced termination probability of the satellite-only users is calculated as
the probability that a call is initiated in a spotbeam cell and noncompleted because of a
handoff failure, i.e.,
PFs = PF3 . (5.51)
The noncompleted call probability for a specific type of calls is defined as the fraction of new
call attempts that will not be completed because of either blocking or unsuccessful handoff
that is calculated for terrestrial-only users as
Pnct = PBto + PFt (1− PBto) , (5.52)
for satellite-only users as
Pncs = PBs + PFs (1− PBs) , (5.53)
and, for the dual-mode users as
Pncd = PBdo + PFd (1− PBdo) . (5.54)
5.3 Teletraffic Modelling of Voice and Data Services
In this section, both voice and data services are integrated over the proposed model. The
required modifications are made to the previous detailed analysis of voice only service in
order to accommodate the data service as well as the voice service.
5.3.1 Model description
The operation scenario can be described with the aid of Fig. 5.9 as follows:
1. Both voice and data services are encountered and offered for each cell-layer with dif-
ferent model parameters such as average call duration, average arrival call rates, and
with different call-handling scheme.
2. Voice service, which is delay-sensitive, are given higher priority in the microcell layer

5.3. Teletraffic Modelling of Voice and Data Services 77
than data service. While data service may tolerate an acceptable delay level wait in a
queue for channel release in both the macrocell and spotbeam cell layers.
3. Voice handoff requests are privileged with more reserved channels. Also the overflow
handoff voice requests are privileged with more reserved channels than the overflow
new voice call attempts.
4. Data messages are forced to wait in a queue for a channel in the macrocell layer while
the number of waiting positions are limited to P , and in the spotbeam cell layer for an
infinite waiting positions.
The above proposed architecture is attained to perform well with the challenge of mixing
voice and data services because it permits data messages which is usually short (i.e., don’t
significantly increase the traffic load). In the same time, handoff voice requests are given
priority than new ones by privilege them with more channels in micro- and macro- cells and
further privileged by letting them to be wait in a queue in the spotbeam cell layer but with
lower delay time than the data messages. This time is highly related to the overlapping areas
between spotbeams.
5.3.2 Performance analysis
5.3.2.1 Microcell level
Each microcell is allocated Nm channel with fixed channel allocation (FCA) scheme. Out of
those channels, Nmh is exclusively reserved for voice handoff requests. The voice and data
new call rates in each microcell λmv,λmd are related to the microcell radius, Rm, average
user density in the microcell, Dum, voice and data new call rates per user λuv, λud, and the
average fractions of voice and data users, αv, αd respectively as
λmv =3√
3
2R2mλuvDumαv, (5.55)
λmd =3√
3
2R2mλudDumαd . (5.56)
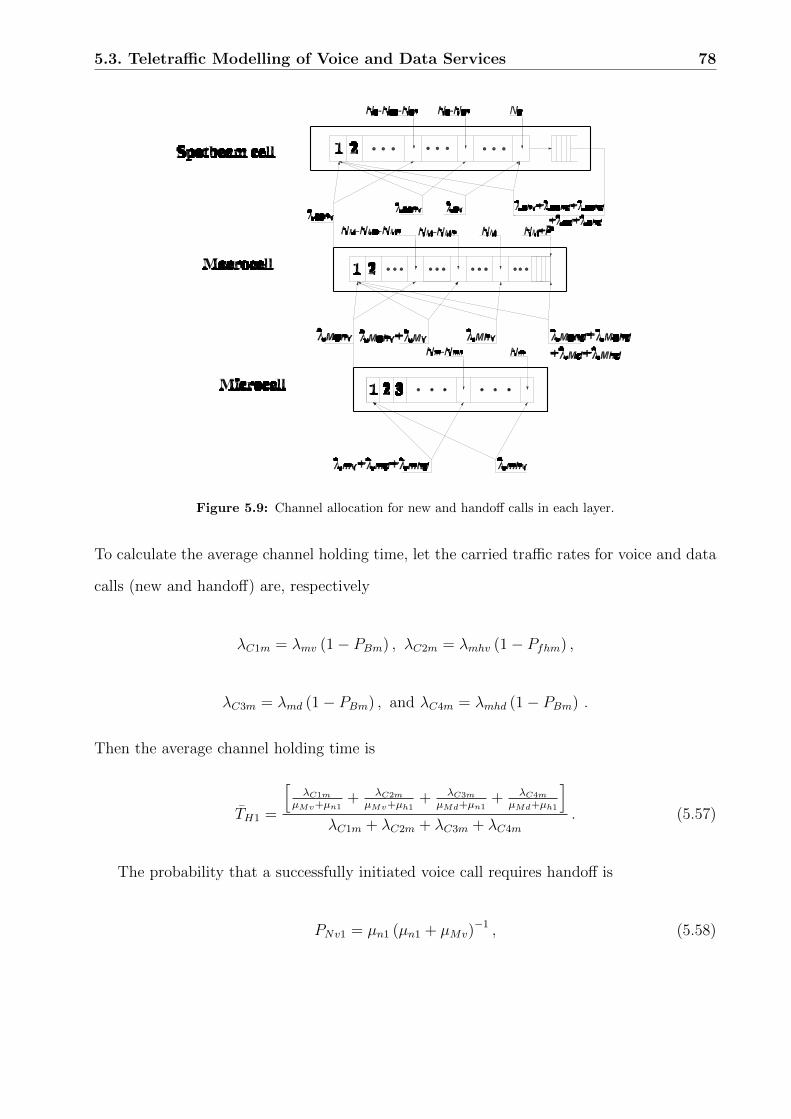
5.3. Teletraffic Modelling of Voice and Data Services 78
Figure 5.9: Channel allocation for new and handoff calls in each layer.
To calculate the average channel holding time, let the carried traffic rates for voice and data
calls (new and handoff) are, respectively
λC1m = λmv (1− PBm) , λC2m = λmhv (1− Pfhm) ,
λC3m = λmd (1− PBm) , and λC4m = λmhd (1− PBm) .
Then the average channel holding time is
T̄H1 =
[λC1m
µMv+µn1+ λC2m
µMv+µh1+ λC3m
µMd+µn1+ λC4m
µMd+µh1
]λC1m + λC2m + λC3m + λC4m
. (5.57)
The probability that a successfully initiated voice call requires handoff is
PNv1 = µn1 (µn1 + µMv)−1 , (5.58)
5.3. Teletraffic Modelling of Voice and Data Services 79
while the probability that a handoff call will require more handoff is given by
PHv1 = µh1 (µh1 + µMv)−1 . (5.59)
Similarly for data calls
PNd1 = µn1 (µn1 + µMd)−1 , (5.60)
PHd1 = µh1 (µh1 + µMd)−1 . (5.61)
The handoff call rates for voice and data can be obtained as
λmhv =λmv (1− PBm)PNv1
1− (1− Pfhm)PHv1
, (5.62)
λmhd =λmd (1− PBm)PNd1
1− (1− Pfhm)PHd1
. (5.63)
The aggregate microcell call rate is
λmt = λmv + λmd + λmhv + λmhd .
The steady state probability, Pj, can be determined as
Pj =
λjmtj!µjH1
P0,
1 ≤ j ≤ Nm −Nmh
λNm−Nmhmt λ
j−(Nm−Nmh)mhv
j!µjH1
P0,
Nm −Nmh + 1 ≤ j ≤ Nm
(5.64)
where
P−10 =
∑Nm−Nmhk=0
λkmtk!µkH1
+∑Nm
k=Nm−Nmh+1
λNm−Nmhmt λ
k−(Nm−Nmh)mhv
k!µkH1.
(5.65)
The blocking probability of new voice and date calls as well as the data handoff failure

5.3. Teletraffic Modelling of Voice and Data Services 80
probability, PBm, and voice handoff failure probability, Pfhm, are given by
PBm =Nm∑
j=Nm−Nmh
Pj, (5.66)
Pfhm = PNm . (5.67)
The overflow rates of voice and data new and handoff calls directed to the next layer (i.e.,
macrocell) are, respectively, given by
λMonv = λmvPBmCm, λMohv = λmhvPfhmCm, λMond = λmdPBmCm, and
λMohd = λmhdPBmCm .
5.3.2.2 Macrocell level
The voice and data new call rates in each macrocell λMv, λMd are respectively given by
λMv =3√
3
2R2MλuvDuMαv, (5.68)
λMd =3√
3
2R2MλudDuMαd . (5.69)
The average channel holding time in the macrocell T̄H2 = 1/µH2 is given by
T̄H2 =
[λC1M
µMv+µn2+ λC2M
µMv+µh2+ λC3M
µMd+µn2+ λC4M
µMd+µh2
]λC1M + λC2M + λC3M + λC4M
, (5.70)
where
λC1M = (λMv + λMohv) (1− PBMv) + λMonv (1− PBMonv) , λC2M = λMhv (1− PfhMv) ,
λC3M = (λMond + λMohd + λMd) (1− PtnMd) , and λC4M = λMhd (1− PthMd) .
5.3. Teletraffic Modelling of Voice and Data Services 81
The handoff call rates for voice and data can be obtained as
λMhv =PNv2 [(λMv + λMohv) (1− PBMv) + λMonv (1− PBMonv)]
1− (1− PfhMv)PHv2
, (5.71)
λMhd =PNv2 (λMond + λMohd + λMhd) (1− PtnMd)
1− (1− PthMd)PHd2
. (5.72)
The aggregate macrocell call rate is
λMt = λMonv + λMond + λMohv + λMohd + λMv + λMd + λMhv + λMhd
Let λMt1 = λMt − λMonv, λMt2 = λMt1 − λMohv − λMv, and λMt3 = λMt2 − λMhv .
The steady state probability, Pj, is given by
Pj =
λjMt
j!µjH2
P0,
1 ≤ j ≤ NM −NMo −NMh
λNM−NMo−NMhMt λ
j−(NM−NMo−NMh)Mt1
j!µjH2
P0
NM −NMo −NMh + 1 ≤ j ≤ NM −NMh
λNM−NMo−NMhMt λ
NMoMt1 λ
j−(NM−NMh)Mt2
j!µjH2
P0,
NM −NMh + 1 ≤ j ≤ NM
λNM−NMo−NMhMt λ
NMoMt1 λ
NMhMt2 λ
j−NMMt3
NM !µNMH2
∏j−NMi=1 (NMµH2+iµq1)
P0,
NM + 1 ≤ j ≤ NM + P
(5.73)
where
µq1 =(λMd + λMond + λMohd)µn2 + λMhdµh2
λMd + λMond + λMohd + λMhd
,
and
P−10 =
∑NM−NMo−NMh
k=0λkMt
k!µkH2
+∑NM−NMh
k=NM−NMo−NMh+1
λNM−NMo−NMhMt λ
k−(NM−NMo−NMh)Mt1
k!µkH2
+∑NM
k=NM−NMh+1
λNM−NMo−NMhMt λ
NMoMt1 λ
k−(NM−NMh)Mt2
k!µkH2
+∑NM+P
k=NM+1
λNM−NMo−NMhMt λ
NMoMt1 λ
NMhMt2 λ
k−NMMt3
NM !µNMH2
∏k−NMi=1 (NMµH2+iµq1)
.
(5.74)
5.3. Teletraffic Modelling of Voice and Data Services 82
The blocking probability for those voice calls overflowed from a microcell is given by
PBMonv =
NM+P∑j=NM−NMo−NMh
Pj (5.75)
while the blocking probability of new voice calls originated in the macrocell as well as the
blocking probability of handoff voice calls overflowed to the macrocell are given by
PBMv = PBMohv =
NM+P∑j=NM−NMh
Pj . (5.76)
The handoff failure probability of handoff voice calls at the macrocell level is given by
PfhMv =
NM+P∑j=NM
Pj . (5.77)
The transfer probability of new and handoff data calls are calculated as follows
PtnMd =
NM+P∑j=NM
Pj
[1−
{NMµH2
NMµH2 + µn2
j−NM∏i=1
(1−
(µn2
NMµH2 + µn2
)(1
2
)i)}], (5.78)
PthMd =
NM+P∑j=NM
Pj
[1−
{NMµH2
NMµH2 + µh2
j−NM∏i=1
(1−
(µh2
NMµH2 + µh2
)(1
2
)i)}]. (5.79)
The overflow rates of voice and data new and handoff calls directed to the next layer (i.e.,
spotbeam cell) are, respectively, given by
λsonv = (λMonvPBMonv + λMvPBMv)CM , λsohv = (λMohvPBMv + λMhvPfhMv)CM ,
λsond = (λMond + λMd)PtnMdCM , and λsohd = (λMohvPtnMd + λMhdPthMd)CM .
5.3.2.3 Spotbeam cell level
The voice and data new call rates in each macrocell λsv,λsd are respectively given by
λsv = πR2sλuvDusαv (5.80)

5.3. Teletraffic Modelling of Voice and Data Services 83
λsd = πR2sλudDusαd (5.81)
The average channel holding time T̄H3 = 1/µH3 is given by
T̄H3 =
[λC1s
µMv+µn3+ λC2s
µMv+µh3+ λC3s
µMd+µn3+ λC4s
µMd+µh3
]λC1s + λC2s + λC3s + λC4s
, (5.82)
where
λC1s = λsonv (1− PBsonv) + λsohv (1− PBsohv) + λsv (1− PBsv) , λC2s = λshv (1− Pfhsv) ,
λC3s = (λsond + λsohd + λsd) (1− Ptnsd) , and λC4s = λshd (1− Pthsd) .
The handoff call rates for voice and data can be obtained as
λshv =PNv3 [λsv (1− PBsv) + λsonv (1− PBsonv) + λsohv (1− PBsohv)]
1− (1− Pfhsv)PHv3
, (5.83)
λshd =PNd3 (λsond + λsohd + λsd) (1− Ptnsd)
1− (1− Pthsd)PHd3
. (5.84)
The aggregate spotbeam cell call rate is
λst = λsonv + λsond + λsohv + λsohd + λsv + λsd + λshv + λshd
Let λst1 = λst − λsonv, λst2 = λst1 − λsohv, and λst3 = λst2 − λsv .
5.3. Teletraffic Modelling of Voice and Data Services 84
The steady state probability, Pj, is given by
Pj =
λjstj!µjH3
P0,
1 ≤ j ≤ Ns −Nso −Nsh
λNs−Nso−Nshst λ
j−(Ns−Nso−Nsh)st1
j!µjH3
P0
Ns −Nso −Nsh + 1 ≤ j ≤ Ns −Nsh
λNs−Nso−Nshst λNsost1 λ
j−(Ns−Nsh)st2
j!µjH3
P0,
Ns −Nsh + 1 ≤ j ≤ Ns
λNs−Nso−Nshst λNsost1 λ
Nshst2 λj−Nsst3
Ns!µNsH3
∏j−Nsi=1 (NsµH3+iµq2)
P0,
j ≥ Ns + 1
(5.85)
where
P−10 =
∑Ns−Nso−Nshk=0
λkstk!µkH3
+∑Ns−Nsh
k=Ns−Nso−Nsh+1λNs−Nso−Nshst λ
k−(Ns−Nso−Nsh)st1
k!µkH3
+∑Ns
k=Ns−Nsh+1λNs−Nso−Nshst λNsost1 λ
k−(Ns−Nsh)st2
k!µkH3
+∑∞
k=Ns+1λNs−Nso−Nshst λNsost1 λ
Nshst2 λk−Nsst3
Ns!µNsH3
∏k−Nsi=1 (NsµH3+iµq2)
.
(5.86)
The average departure rate of the mixed voice and data can be computed as [41]
µq2 =λshvµqv + (λsond + λsohd + λsd)µn3 + λshdµh3
λshv + λsond + λsohd + λsd + λshd.
The blocking probability of the new and handoff voice calls overflowed from macrocell are,
respectively, given by
PBsonv =∞∑
j=Ns−Nso−Nsh
Pj, (5.87)
PBsohv =∞∑
j=Ns−Nsh
Pj, (5.88)
while the blocking probability of new voice calls originated in the spotbeam cell is given by
PBsv =∞∑
j=Ns
Pj . (5.89)

5.3. Teletraffic Modelling of Voice and Data Services 85
The handoff failure probability of handoff voice calls at the spotbeam cell level is given by
Pfhsv =∞∑
j=Ns
Pj
[1−
{NsµH3
NsµH3 + µqv
j−Ns∏i=1
(1−
(µqv
NsµH3 + µqv
)(1
2
)i)}], (5.90)
while the transfer probability of new and handoff data calls are calculated as follows
Ptnsd =∞∑
j=Ns
Pj
[1−
{NsµH3
NsµH3 + µn3
j−Ns∏i=1
(1−
(µn3
NsµH3 + µn3
)(1
2
)i)}], (5.91)
Pthsd =∞∑
j=Ns
Pj
[1−
{NsµH3
NsµH3 + µh3
j−Ns∏i=1
(1−
(µh3
NsµH3 + µh3
)(1
2
)i)}]. (5.92)

Chapter 6
Results and Discussion
6.1 Numerical Results for Providing Voice Service Only
For the proposed integrated architecture, the radii of the microcells, macrocells, and spot-
beam cells are 1, 5, and 70 km, respectively. Every 10 microcells are overlaid by a macrocell
and every 30 macrocells are embedded in a spotbeam cell. Channels allocated for the micro-
cell, macrocell and spotbeam cell are 16, 32 and 56, respectively. Two channels are reserved
in each microcell for exclusive usage by handoff calls, while 4 channels per macrocell are
privileged to accommodate the handoff traffic overflowed to it from the underlay microcells.
Another 4 channels are reserved for handoff requests in that layer. Similarly 7 channels per
spotbeam cell are privileged for the overflowed handoff traffic from the underlay macrocells
and another 7 channels are reserved for handoff requests in that layer.
The average call duration is 120 s. The average user densities in micro-, macro-, and
spotbeam cells are assumed to be 100, 40, 6 user/km2 respectively. The speed of a mobile
station in a micro- a macro- and a spotbeam cells is assumed to be uniformly distributed
with a mean of 20, 45, and 60 km/hr., respectively. The residing times of new and handoff
calls in a micro- a macro- and a spotbeam cells are obtained as [34]. The mean dwell time
for the handoff attempt in the spotbeam overlapping areas T̄q = 1/µq is assumed to T̄H3/10.
Results for this situation are illustrated in Fig. 6.1. It is noted that PBm is the lowest
because there is no overflow to this layer. The next is PBM , then PBMon because there is some
channels NMo privileged for macrocell new call over that overflowed to it as new calls. Also,
86
6.2. Parametric Effects 87
PBs is lower than PBson for the same reason. In Fig. 6.2 the overall blocking probabilities
for each user type is shown while Fig 6.3 gives the weighted blocking probabilities for each
user type.
Fig. 6.4, Fig. 6.5, and Fig. 6.6 display the effect of using different priority schemes in
each layer represented as handoff failure for each layer, overall, and weighted handoff failure
probabilities for each user type. The forced termination and noncompleted call probabilities
for each user type are given in Fig. 6.7 and Fig. 6.8, respectively. Fig. 6.9 displays the effect
of using SRS on the handoff failure probabilities in the macrocell and spotbeam cell levels.
It can be noted that the probabilities are significantly reduced with SRS.
6.2 Parametric Effects
In this section, the effects of parameters on the performance measures are discussed and
analyzed, to attain the required goals of achieving and enhancing the proposed model and
assist the system designers to reach their high performance with different modifications.
6.2.1 Effects of reserved channel scheme, sub-rating scheme, and
queueing priority scheme
Shown in Fig. 6.10, the effect of reserved channel scheme used in the microcell layer. While
this scheme reduces the handoff failure probability in the microcell layer, it slightly increases
the blocking probability in this layer so it is suitable to use only this scheme in the lowest
hierarchical level (microcell layer).
In Fig. 6.11, both the RCS and the sub-rating scheme are applied to the macrocell
layer. It is shown that the effect of sub-rating is significantly reducing the handoff failure
probability (PfhM) despite of the high load resulting from the overflow traffic. Again the
blocking probability is slightly increased, so it is recommended to use this scheme in relieving
the peak traffic in this layer.
The effects of RCS, SRS, and the queueing priority scheme are shown in Fig. 6.12, it
is noted that the gap between the blocking and handoff failure probabilities in this layer

6.2. Parametric Effects 88
10−6
10−5
10−4
10−3
10−2
10−5
10−4
10−3
10−2
10−1
100
call rate per user (call/sec./user)
Blo
ckin
g P
rob.
PBm
PBMon
PBM
PBson
PBs
Figure 6.1: The blocking and overflow rejection probabilities of each layer as a function of call rate peruser.
10−6
10−5
10−4
10−3
10−2
10−5
10−4
10−3
10−2
10−1
100
call rate per user (call/sec./user)
Ove
rall
Blo
ckin
g P
rob.
PBdo
PBto
PBso
Figure 6.2: The overall blocking probabilities of each user type as a function of call rate per user.

6.2. Parametric Effects 89
10−6
10−5
10−4
10−3
10−2
10−5
10−4
10−3
10−2
10−1
100
call rate per user (call/sec./user)
Wei
ghte
d B
lock
ing
Pro
b.
PBdw
PBtw
PBsw
Figure 6.3: The weighted blocking probabilities of each user type as a function of call rate per user.
10−6
10−5
10−4
10−3
10−2
10−5
10−4
10−3
10−2
10−1
100
call rate per user (call/sec./user)
Han
doff
Fai
lure
Pro
b.
Pfhm
PfhM
Pfhs
Figure 6.4: The handoff failure probabilities of each layer as a function of call rate per user.

6.2. Parametric Effects 90
10−6
10−5
10−4
10−3
10−2
10−5
10−4
10−3
10−2
10−1
100
call rate per user (call/sec./user)
Ove
rall
Han
doff
Fai
lure
Pro
b.
Pfhdo
Pfhto
Pfhso
Figure 6.5: The overflow handoff failure probabilities of each user type as a function of call rate per user.
10−6
10−5
10−4
10−3
10−2
10−5
10−4
10−3
10−2
10−1
100
call rate per user (call/sec./user)
Wei
ghte
d H
ando
ff F
ailu
re P
rob.
Pfhdw
Pfhtw
Pfhsw
Figure 6.6: The weighted handoff failure probabilities of each user type as a function of call rate per user.
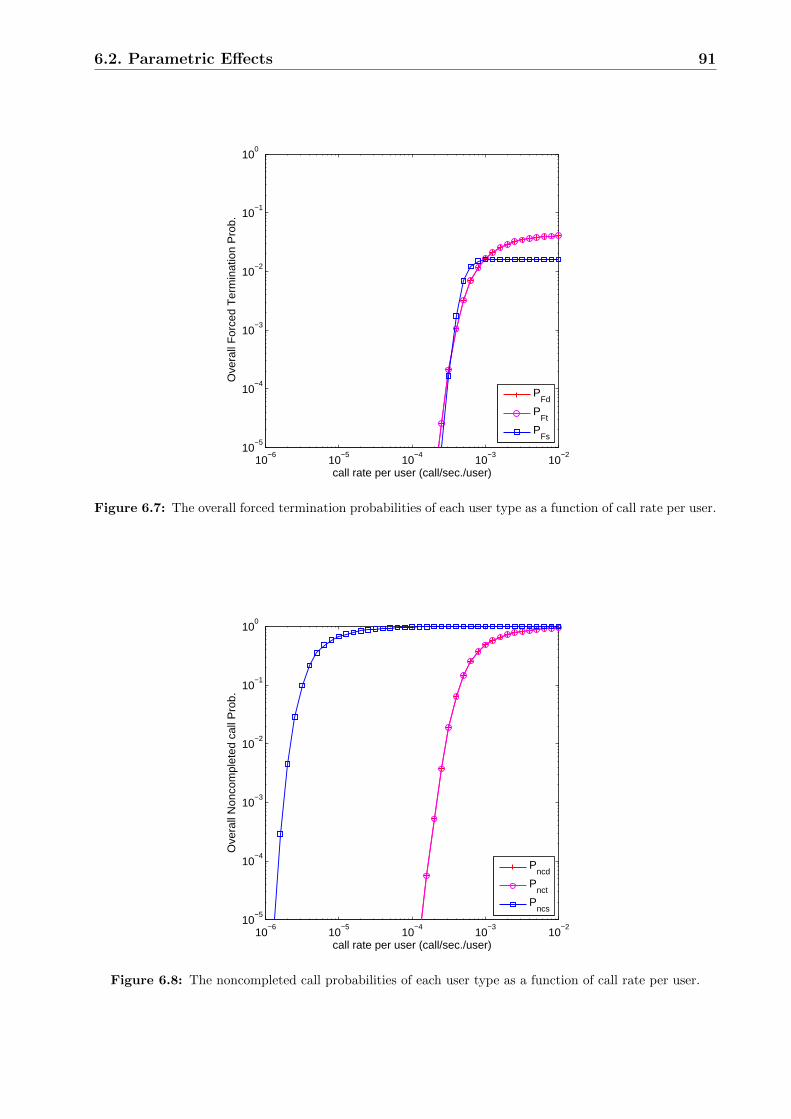
6.2. Parametric Effects 91
10−6
10−5
10−4
10−3
10−2
10−5
10−4
10−3
10−2
10−1
100
call rate per user (call/sec./user)
Ove
rall
For
ced
Ter
min
atio
n P
rob.
PFd
PFt
PFs
Figure 6.7: The overall forced termination probabilities of each user type as a function of call rate per user.
10−6
10−5
10−4
10−3
10−2
10−5
10−4
10−3
10−2
10−1
100
call rate per user (call/sec./user)
Ove
rall
Non
com
plet
ed c
all P
rob.
Pncd
Pnct
Pncs
Figure 6.8: The noncompleted call probabilities of each user type as a function of call rate per user.
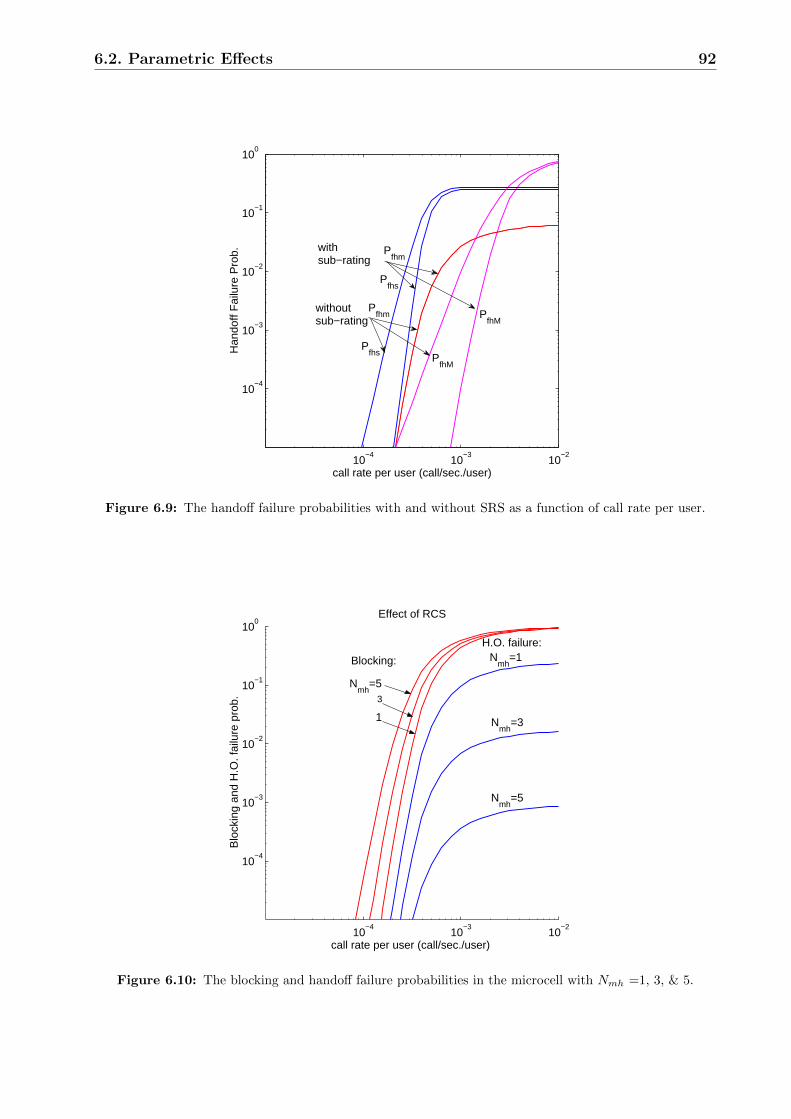
6.2. Parametric Effects 92
10−4
10−3
10−2
10−4
10−3
10−2
10−1
100
call rate per user (call/sec./user)
Han
doff
Fai
lure
Pro
b. with sub−rating
without sub−rating
Pfhs
P
fhM
Pfhm
Pfhm
PfhM
Pfhs
Figure 6.9: The handoff failure probabilities with and without SRS as a function of call rate per user.
10−4
10−3
10−2
10−4
10−3
10−2
10−1
100
call rate per user (call/sec./user)
Blo
ckin
g an
d H
.O. f
ailu
re p
rob.
Effect of RCS
Blocking:
Nmh
=5 3
1
H.O. failure:N
mh=1
Nmh
=3
Nmh
=5
Figure 6.10: The blocking and handoff failure probabilities in the microcell with Nmh =1, 3, & 5.

6.2. Parametric Effects 93
10−4
10−3
10−2
10−4
10−3
10−2
10−1
100
call rate per user (call/sec./user)
Blo
ckin
g an
d H
.O. F
ailu
re P
rob.
Effect of RCS & SRS
Blocking:
NMh
=5 3 1
H.O. failure:
NMh
=1
3 5
Figure 6.11: The blocking and handoff failure probabilities in the macrocell with NMh =1, 3, & 5.
(spotbeam layer) is increased. So by using the different priority schemes as in the above
scenario, we can accommodate the handoff traffic in a superior fashion while handling the
new traffic with an acceptable degree of GOS.
6.2.2 Effect of number of overlaid microcells
Fig. 6.13 and Fig. 6.14, indicate the effect of varying the number of microcells overlaid by a
macrocell Cm on both the blocking and handoff failure probabilities respectively. It is shown
that both PBm and Pfhm are not affected, because there is no change occurs for the microcell
layer. But as Cm increases from 5, 10, and 15 microcells per macrocell, all of PBM , PfhM ,
PBs and Pfhs are increased.
6.2.3 Effect of number of overlaid macrocells
Fig. 6.15 and Fig. 6.16 show the effect of varying the number of macrocells embedded in a
spotbeam cell CM on both the blocking and handoff failure probabilities respectively. It is
shown that all of PBm, Pfhm, PBM and PfhM are not affected, because there is no change for
these two layers (microcell and macrocell layers). But as CM increases from 20, 30, and 40
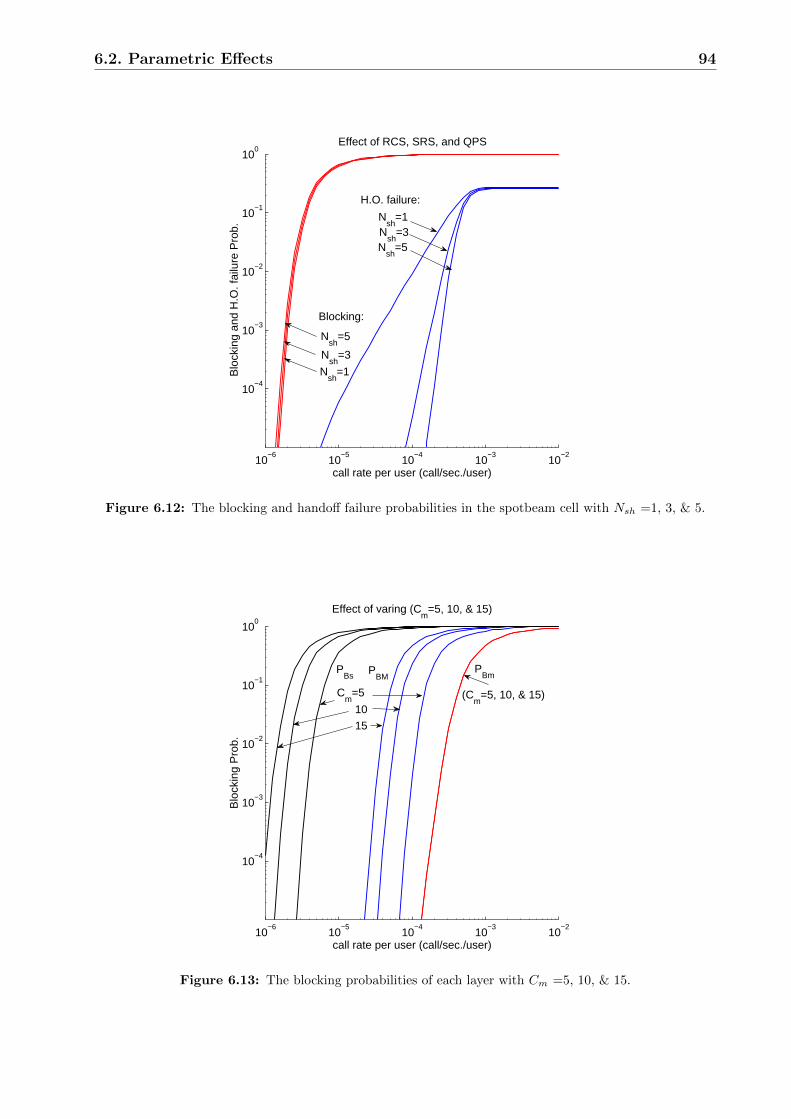
6.2. Parametric Effects 94
10−6
10−5
10−4
10−3
10−2
10−4
10−3
10−2
10−1
100
call rate per user (call/sec./user)
Blo
ckin
g an
d H
.O. f
ailu
re P
rob.
Effect of RCS, SRS, and QPS
Blocking:
H.O. failure:
Nsh
=5
Nsh
=3
Nsh
=1
Nsh
=1 N
sh=3
Nsh
=5
Figure 6.12: The blocking and handoff failure probabilities in the spotbeam cell with Nsh =1, 3, & 5.
10−6
10−5
10−4
10−3
10−2
10−4
10−3
10−2
10−1
100
call rate per user (call/sec./user)
Blo
ckin
g P
rob.
Effect of varing (Cm
=5, 10, & 15)
PBm
(Cm
=5, 10, & 15)
PBM
PBs
10
15
Cm
=5
Figure 6.13: The blocking probabilities of each layer with Cm =5, 10, & 15.

6.2. Parametric Effects 95
10−4
10−3
10−2
10−4
10−3
10−2
10−1
100
call rate per user (call/sec./user)
H.O
. fai
lure
Pro
b.
Effect of varying (Cm
=5, 10, & 15)
Pfhm
PfhM
Pfhs
Cm
=5
Cm
=10
Cm
=15
Figure 6.14: The handoff failure probabilities of each layer with Cm =5, 10, & 15.
macrocells per spotbeam cell, both PBs and Pfhs are increased.
6.2.4 Effect of infinite queue
It is shown in Fig. 6.17, the effect of implementing an infinite queue in the spotbeam cell
layer on the handoff failure probability Pfhs. If we put Nsh=0, then the effect of the queue
appears. It highly reduces the failure handoff probability in the spotbeam cell while, the
blocking probability PBs is not affected.
6.2.5 Effect of handoff area size
Fig. 6.18 shows the effect of handoff area size, T̄q on the handoff failure probability Pfhs.
As the average residing time in the overlapping area increases from T̄H3/6, T̄H3/4, to T̄H3/2, the
handoff failure probability in the spotbeam cell layer is decreased.

6.2. Parametric Effects 96
10−6
10−5
10−4
10−3
10−2
10−4
10−3
10−2
10−1
100
call rate per user (call/sec./user)
Blo
ckin
g P
rob.
Effect of varing (CM
=20, 30, & 40)
PBm P
BM P
Bs
(CM
=20, 30, & 40)
CM
=20
30
40
Figure 6.15: The blocking probabilities of each layer with CM =20, 30, & 40.
10−4
10−3
10−2
10−4
10−3
10−2
10−1
100
call rate per user (call/sec./user)
H.O
. fai
lure
Pro
b.
Effect of varying (CM
=20, 30, & 40)
Pfhm
PfhM
Pfhs
CM
=20
30
40
Figure 6.16: The handoff failure probabilities of each layer with CM =20, 30, & 40.
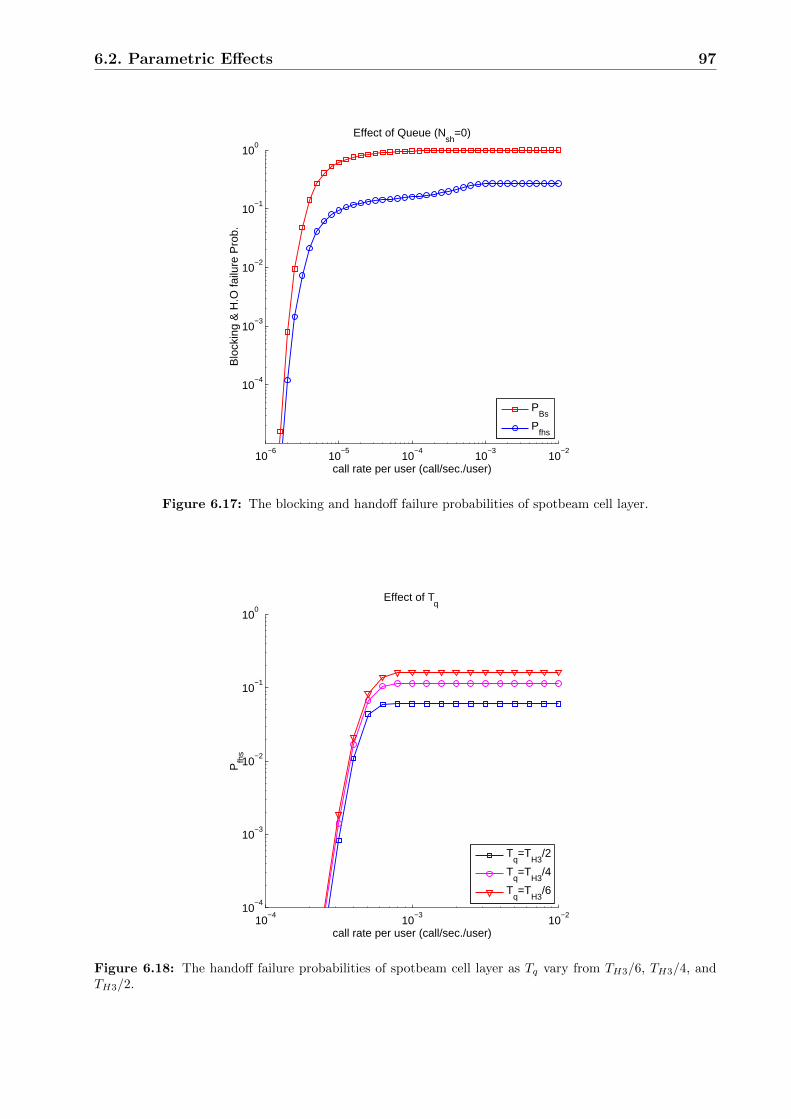
6.2. Parametric Effects 97
10−6
10−5
10−4
10−3
10−2
10−4
10−3
10−2
10−1
100
call rate per user (call/sec./user)
Blo
ckin
g &
H.O
failu
re P
rob.
Effect of Queue (Nsh
=0)
PBs
Pfhs
Figure 6.17: The blocking and handoff failure probabilities of spotbeam cell layer.
10−4
10−3
10−2
10−4
10−3
10−2
10−1
100
call rate per user (call/sec./user)
Pfh
s
Tq=T
H3/2
Tq=T
H3/4
Tq=T
H3/6
Effect of Tq
Figure 6.18: The handoff failure probabilities of spotbeam cell layer as Tq vary from TH3/6, TH3/4, andTH3/2.

6.3. Numerical Results for Voice/Data Integration 98
6.3 Numerical Results for Voice/Data Integration
The results of the integrated voice/data model are given in this section, indicating the per-
formance of these services as the blocking probabilities and the handoff failure probabilities.
All the system parameters are as that of the voice only model, with 10 s average data call
duration. The number of waiting positions per macrocell is assumed to be 5. The average
fraction of voice users is 0.7 and the average fraction of data users is 0.3.
Results for this situation are illustrated in Fig. 6.19, Fig. 6.20 and Fig. 6.21 for micro-,
macro-, and spotbeam cell respectively.
10−6
10−5
10−4
10−3
10−2
10−10
10−8
10−6
10−4
10−2
100
voice call rate per user (call/sec./user)
Mic
roce
ll B
lock
ing
Pro
b.
PBM
Pfhm
Figure 6.19: The blocking probabilities of the microcell layer.
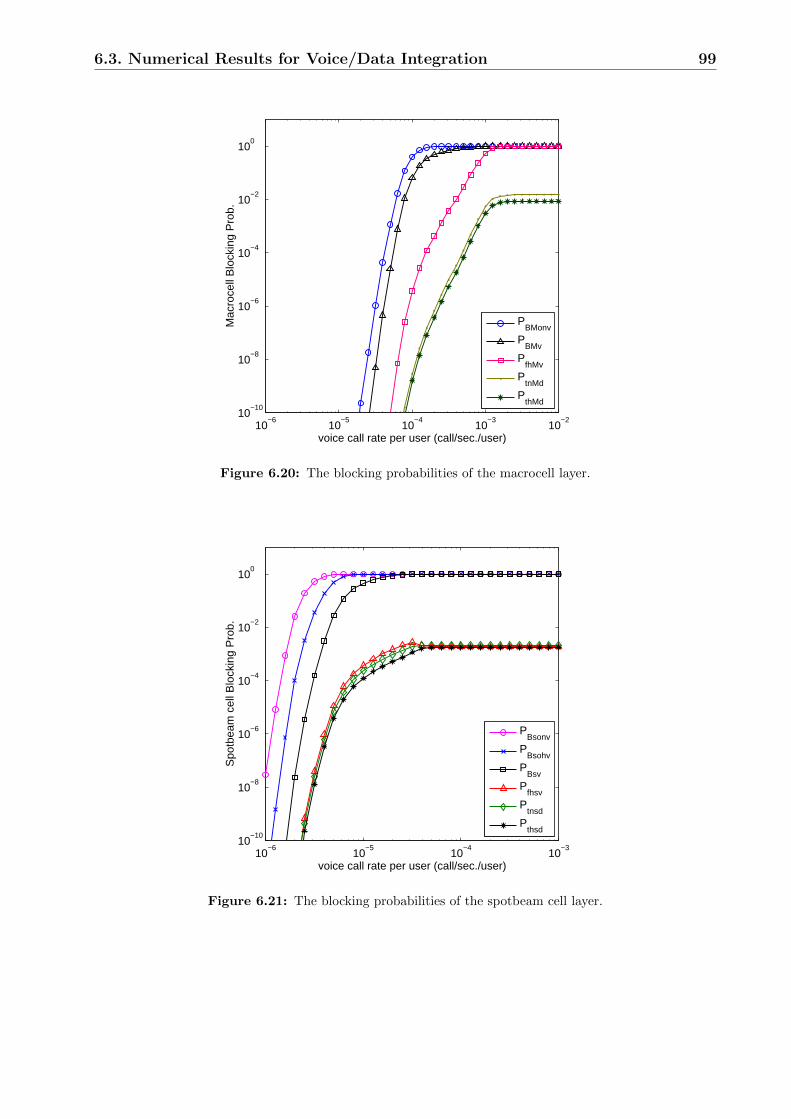
6.3. Numerical Results for Voice/Data Integration 99
10−6
10−5
10−4
10−3
10−2
10−10
10−8
10−6
10−4
10−2
100
voice call rate per user (call/sec./user)
Mac
roce
ll B
lock
ing
Pro
b.
PBMonv
PBMv
PfhMv
PtnMd
PthMd
Figure 6.20: The blocking probabilities of the macrocell layer.
10−6
10−5
10−4
10−3
10−10
10−8
10−6
10−4
10−2
100
voice call rate per user (call/sec./user)
Spo
tbea
m c
ell B
lock
ing
Pro
b.
PBsonv
PBsohv
PBsv
Pfhsv
Ptnsd
Pthsd
Figure 6.21: The blocking probabilities of the spotbeam cell layer.

Chapter 7
Conclusion and Future Work
7.1 Conclusion
The merits of the next-generation network are colored by the moving nature of the human
activities and the explosive growth in information technology. The future next-generation
network should provide global coverage and mixed media services. Terrestrial networks have
limited coverage and may be economically infeasible while satellite systems play an excellent
role in global coverage to provide wireless connection everywhere. The future next-generation
network should be an integrated terrestrial/satellite network. Handling the teletraffic load
in this multilayer network needs intelligent protocol architecture.
A teletraffic model was established for a multi-layer terrestrial/satellite global commu-
nication network. The teletraffic performance of the structure was analyzed and inspected
for nominal system parameters. The architecture is flexible to accommodate different traffic
intensities generated by different user categories. Varieties of handoff priority schemes were
proposed in order to improve the performance of the system. The presented analysis will
help network designers to implement the future global network based on sound concepts.
7.2 Future Work
Software radio is a revolutionary concept to face the problem of different standards for mobile
networks around the world. Instead of building separate hardware for different systems, a
100

7.2. Future Work 101
single general-purpose platform is used to perform these different functions by simply running
a different program. In other words, a software radio is a wireless communications device in
which some or all of the physical layer functions are implemented in software.
The flexibility provided by the software implementation enables a single device to inter-
operate with other devices using different wireless physical technology, by simply invoking the
appropriate software. This would not only enable seamless anytime, anywhere connectivity,
but also provide users the flexibility of choosing from the available connectivity options the
best suit price/performance requirements.
For example, a generic receiver can inter-operate with multiple different cellular systems
by running different programs. In other words, software radios would enable travelers to
overcome the difficulties in going through areas that use different standards. As you go into
an area that uses a different cellular telephone, the infrastructure could notify your phone
about the local requirements, and the phone would automatically reconfigure for use in that
area. This allows different regions to adopt the standards that best suit their environment.
In the near future, there is no doubt that software radios can freely mix analog and
digital technology to achieve optimum performance, cost and reliability. The “future proof”
structure of software radio structure would enable consumers to upgrade their phones with
new applications–much like purchasing new programs for their computers.

List of Figures
2.1 Evolution of terrestrial and satellite-based networks. . . . . . . . . . . . . . . 92.2 The K-cell reuse pattern. . . . . . . . . . . . . . . . . . . . . . . . . . . . . . 102.3 The original cell site is used in the Fig. to the left while isn’t in the Fig. to
the (right). . . . . . . . . . . . . . . . . . . . . . . . . . . . . . . . . . . . . . 122.4 Omnidirectional sectorized cellular system and cochannel interferers. . . . . . 142.5 General view of cellular communication system. . . . . . . . . . . . . . . . . 152.6 The relative amounts of earth coverage afforded by satellites. . . . . . . . . . 172.7 The coverage area of the earth’s surface within the visibility of LEO satellite. 202.8 The coverage area in km2 versus the orbit altitude in km for different minimum
elevation angles. . . . . . . . . . . . . . . . . . . . . . . . . . . . . . . . . . . 202.9 Multipath propagation in urban area. . . . . . . . . . . . . . . . . . . . . . . 232.10 The Raleigh fading envelope . . . . . . . . . . . . . . . . . . . . . . . . . . . 23
3.1 State transition diagram for general birth-death process. . . . . . . . . . . . 333.2 Blocked calls cleared BCC system. . . . . . . . . . . . . . . . . . . . . . . . 353.3 Blocked calls delayed BCD system. . . . . . . . . . . . . . . . . . . . . . . . 373.4 Blocked calls held BCH system. . . . . . . . . . . . . . . . . . . . . . . . . . 39
4.1 Location registration procedures. . . . . . . . . . . . . . . . . . . . . . . . . 474.2 Call delivery procedures. . . . . . . . . . . . . . . . . . . . . . . . . . . . . . 484.3 Pointer forwarding scheme. . . . . . . . . . . . . . . . . . . . . . . . . . . . . 554.4 Distributed hierarchical tree database. . . . . . . . . . . . . . . . . . . . . . 564.5 Partitioning scheme. . . . . . . . . . . . . . . . . . . . . . . . . . . . . . . . 57
5.1 Hierarchical multilayer architecture. . . . . . . . . . . . . . . . . . . . . . . . 625.2 Channel allocation for new and handoff calls in each layer. . . . . . . . . . . 625.3 Flow chart for a call initiated in the microcell layer. . . . . . . . . . . . . . . 645.4 Flow chart for a call initiated in the macrocell layer. . . . . . . . . . . . . . . 655.5 Flow chart for a call initiated in the spotbeam cell layer. . . . . . . . . . . . 665.6 State transition diagram for microcell. . . . . . . . . . . . . . . . . . . . . . 685.7 State transition diagram for macrocell. . . . . . . . . . . . . . . . . . . . . . 715.8 State transition diagram for spotbeam cell. . . . . . . . . . . . . . . . . . . . 735.9 Channel allocation for new and handoff calls in each layer. . . . . . . . . . . 78
6.1 The blocking and overflow rejection probabilities of each layer as a functionof call rate per user. . . . . . . . . . . . . . . . . . . . . . . . . . . . . . . . 88
6.2 The overall blocking probabilities of each user type as a function of call rateper user. . . . . . . . . . . . . . . . . . . . . . . . . . . . . . . . . . . . . . . 88
102
LIST OF FIGURES 103
6.3 The weighted blocking probabilities of each user type as a function of call rateper user. . . . . . . . . . . . . . . . . . . . . . . . . . . . . . . . . . . . . . . 89
6.4 The handoff failure probabilities of each layer as a function of call rate per user. 896.5 The overflow handoff failure probabilities of each user type as a function of
call rate per user. . . . . . . . . . . . . . . . . . . . . . . . . . . . . . . . . . 906.6 The weighted handoff failure probabilities of each user type as a function of
call rate per user. . . . . . . . . . . . . . . . . . . . . . . . . . . . . . . . . . 906.7 The overall forced termination probabilities of each user type as a function of
call rate per user. . . . . . . . . . . . . . . . . . . . . . . . . . . . . . . . . . 916.8 The noncompleted call probabilities of each user type as a function of call rate
per user. . . . . . . . . . . . . . . . . . . . . . . . . . . . . . . . . . . . . . . 916.9 The handoff failure probabilities with and without SRS as a function of call
rate per user. . . . . . . . . . . . . . . . . . . . . . . . . . . . . . . . . . . . 926.10 The blocking and handoff failure probabilities in the microcell with Nmh =1,
3, & 5. . . . . . . . . . . . . . . . . . . . . . . . . . . . . . . . . . . . . . . . 926.11 The blocking and handoff failure probabilities in the macrocell with NMh =1,
3, & 5. . . . . . . . . . . . . . . . . . . . . . . . . . . . . . . . . . . . . . . . 936.12 The blocking and handoff failure probabilities in the spotbeam cell with Nsh
=1, 3, & 5. . . . . . . . . . . . . . . . . . . . . . . . . . . . . . . . . . . . . 946.13 The blocking probabilities of each layer with Cm =5, 10, & 15. . . . . . . . . 946.14 The handoff failure probabilities of each layer with Cm =5, 10, & 15. . . . . 956.15 The blocking probabilities of each layer with CM =20, 30, & 40. . . . . . . . 966.16 The handoff failure probabilities of each layer with CM =20, 30, & 40. . . . . 966.17 The blocking and handoff failure probabilities of spotbeam cell layer. . . . . 976.18 The handoff failure probabilities of spotbeam cell layer as Tq vary from TH3/6,
TH3/4, and TH3/2. . . . . . . . . . . . . . . . . . . . . . . . . . . . . . . . . 976.19 The blocking probabilities of the microcell layer. . . . . . . . . . . . . . . . . 986.20 The blocking probabilities of the macrocell layer. . . . . . . . . . . . . . . . 996.21 The blocking probabilities of the spotbeam cell layer. . . . . . . . . . . . . . 99

References
[1] J. D. Gibson, The Mobile Communications Handbook. CRC Press Inc., 1996.
[2] R. Steele, “Communications ++: Do we know what we are creating?” in EPMCC’99,
VDE-VERLAG GMBH, Berlin, Sept. 1997, pp. 19–23.
[3] V. O. K. Li and X. Qiu, “Personal communication systems (PCS),” Proc. IEEE, vol. 83,
no. 9, pp. 1208–1243, Sept. 1995.
[4] F. Ananasso and F. D. Priscoli, “The role of satellites in personal communication ser-
vices,” IEEE J. Select. Areas in Commun., vol. 13, no. 2, pp. 180–196, Feb. 1995.
[5] “Cellular Communications,” The International Engineering Consortium,
http://www.iec.org.
[6] W. C. Y. Lee, Mobile Cellular Telecommunications Systems. New York: McGraw-Hill,
1989.
[7] G. K. Chan,“Effects of sectorization on the spectrum efficiency of cellular radio systems,”
IEEE Trans. Vehic. Technol., vol. 41, no. 3, pp. 217–225, Aug. 1992.
[8] K. Spindler, “The German cellular radio telephone system C,” IEEE Commun. Mag.,
vol. 24, no. 2, pp. 30–39, Feb. 1986.
[9] G. P. Pollini, “Trends in handover design,” IEEE Commun. Mag., vol. 34, no. 3, pp.
82–90, Mar. 1996.
[10] G. Losquadro and R. E. Sheriff, “Requirements of multiregional mobile broadband sa-
tellite networks,” IEEE Personal Communications, vol. 5, no. 2, pp. 26–30, 1998.
104
REFERENCES 105
[11] B. Pattan, Satellite-Based Global Cellular Communications. New York: McGraw-Hill,
1998.
[12] M. Nofal, “Engineering aspects and performance evaluation of a multi-service low earth
orbit mobile satellite communication system,” in IEEE Vehic. Technol. Conf. Fall 2000,
VTC’2000, Boston, Massachusetts, USA, Sept. 2000, pp. 1879–1886.
[13] W. W. Wu, E. F. Miller, W. L. Pritchard, and R. L. Pickholtz, “Mobile satellite com-
munications,” Proc. IEEE, vol. 82, no. 9, pp. 1431–1447, Sept. 1994.
[14] S. C. Gupta, R. Viswanathan, and R. Muammar,“Land mobile radio systems—a tutorial
exposition,” IEEE Commun. Mag., vol. 23, no. 6, pp. 34–45, Jun. 1985.
[15] S.-H. Oh and D.-W. Tcha, “Prioritized channel assignment in a cellular radio network,”
IEEE Trans. Commun., vol. 40, no. 7, pp. 1259–1269, Jul. 1992.
[16] L. G. Anderson, “A simulation study of some dynamic channel assignment algorithms
in a high capacity mobile telecommunications system,” IEEE Trans. Vehic. Technol.,
vol. vt-22, no. 4, pp. 210–217, Nov. 1973.
[17] D. C. Cox and D. O. Reudink, “Comparison of some channel assignment strategies in
large-scale mobile communications systems,” IEEE Trans. Commun., vol. com-20, no. 2,
pp. 190–195, Apr. 1972.
[18] J. S. Engel and M. M. Peritsky, “Statistically-optimum dynamic server assignment in
systems with interfering servers,” IEEE Trans. Vehic. Technol., vol. vt-22, no. 4, pp.
203–209, Nov. 1973.
[19] D. C. Cox and D. O. Reudink, “Increasing channel occupancy in large scale mobile radio
systems: dynamic channel reassignment,” IEEE Trans. Vehic. Technol., vol. vt-22, no. 4,
pp. 218–222, Nov. 1973.
[20] T. J. Kahwa and N. D. Georganas, “A hybrid channel assignment scheme in large-
scale, cellular-structured mobile communication systems,” IEEE Trans. Commun., vol.
Com-26, no. 4, pp. 430–438, Apr. 1978.
REFERENCES 106
[21] Y. Akaiwa, Introduction to Digital Mobile Communication. New York: John Wiley &
Sons Inc., 1997.
[22] C. Chang, C.-J. Chang, and K.-R. Lo, “Analysis of a hierarchical cellular system with
reneging and dropping for waiting new and handoff calls,” IEEE Trans. Vehic. Technol.,
vol. 48, no. 4, pp. 1080–1091, Jul. 1999.
[23] Chih-Lin, L. J. Greenstein, and R. D. Gitlin,“A microcell/macrocell cellular architecture
for low- and high-mobility wireless users,” IEEE J. Select. Areas in Commun., vol. 11,
no. 6, pp. 885–891, Aug. 1993.
[24] E. D. Re, “A coordinated European effort for the definition of a satellite integrated
environment for future mobile communications,” IEEE Commun. Mag., pp. 98–104,
Feb. 1996.
[25] E. D. Re and P. lannucci, “The GSM procedures in an integrated cellular/satellite
system,” IEEE J. Select. Areas in Commun., vol. 13, no. 2, pp. 421–430, Feb. 1995.
[26] I. F. Akyildiz, J. Mcnair, J. S. M. Ho, H. Uzunalioglu, and W. Wang, “Mobility mana-
gement in next-generation wireless systems,” Proc. IEEE, vol. 87, no. 8, pp. 1347–1383,
Aug. 1999.
[27] B. Liang and Z. J. Haas, “Predictive distance-based mobility management for PCS
networks,” in IEEE INFOCOM’99, New York, Mar. 1999.
[28] N. Efthymiou, Y. F. Hu, and R. E. Sheriff, “Performance of intersegment handover
protocols in an integrated space/terrestrial-UMTS environment,” IEEE Trans. Vehic.
Technol., vol. 47, no. 4, pp. 1179–1199, Nov. 1998.
[29] W. Li and A. S. Alfa, “Channel reservation for handoff calls in a PCS network,” IEEE
Trans. Vehic. Technol., vol. 49, no. 1, pp. 95–104, Jan. 2000.
[30] Y.-B. Lin, S. Mohan, and A. Noerpel, “PCS channel assignment startegies for hand-off
and initial access,” IEEE Pers. Commun., vol. 3rd quarter, pp. 47–56, 1994.

REFERENCES 107
[31] L.-R. Hu and S. S. Rappaport, “Adaptive location management scheme for global per-
sonal communications,” IEE Proc.-Commun., vol. 144, no. 1, pp. 54–60, Feb. 1997.
[32] B. C. Kim, J. S. Choi, and C. K. Un,“A new distributed location management algorithm
for broadband personal communication networks,” IEEE Trans. Vehic. Technol., vol. 44,
no. 3, pp. 516–524, Aug. 1995.
[33] B. Jabbari and W. F. Fuhrmann, “Teletraffic modeling and analysis of flexible hierar-
chical cellular networks with speed-sensitive handoff strategy,” IEEE J. Select. Areas in
Commun., vol. 15, no. 8, pp. 1539–1548, Oct. 1997.
[34] K. L. Yeung and S. Nanda, “Channel management in microcell/macrocell cellular radio
systems,” IEEE Trans. Vehic. Technol., vol. 45, no. 4, pp. 601–612, Nov. 1996.
[35] G. Ruiz, T. L. Doumi, and J. G. Gardiner, “Teletraffic analysis of an integrated satel-
lite/terrestrial mobile radio system based on nongeostationary satellites,” IEE Proc.-
Commun., vol. 145, no. 5, pp. 378–387, Oct. 1998.
[36] L.-R. Hu and S. S. Rappaport, “Personal communication systems using multiple hierar-
chical cellular overlays,” IEEE J. Select. Areas in Commun., vol. 13, no. 2, pp. 406–415,
Feb. 1995.
[37] E. D. Re, R. Fantacci, and G. Giambene, “Different queuing policies for handoff requests
in low earth orbit mobile satellite systems,” IEEE Trans. Vehic. Technol., vol. 48, no. 2,
pp. 448–458, Mar. 1999.
[38] D. Hong and S. S. Rappaport, “Traffic model and performance analysis for celllar mobile
radio telephone systems with prioritized and nonprioritized handoff procedures,” IEEE
Trans. Vehic. Technol., vol. VT-35, no. 3, pp. 77–92, Aug. 1986.
[39] ——, “Priority oriented channel access for cellular systems serving vehicular and por-
table radio telephones,” IEE Proceedings, vol. 136, no. 5, pp. 339–346, Oct. 1989.
[40] X. Lagrange and B. Jabbari, “Fairness in wireless microcellular networks,” IEEE Trans.
Vehic. Technol., vol. 47, no. 2, pp. 472–479, May 1998.

REFERENCES 108
[41] M. Nofal, N. El-fishawy, and S. A. El-atty, “A queuing priority channel access protocol
for voice/data integration on the air interface of microcellular mobile radio networks,” in
IEEE Vehic. Technol. Conf., Fall 2000, VTC’2000, Boston, Massachusetts, USA, Sep.
2000, pp. 229–236.