Embed Size (px)
Citation preview

Telenor Group Jon Fredrik Baksaas, CEO Handelsbanken Large Cap Seminar – September 2013

Disclaimer
The following presentation is being made only to, and is only directed at, persons to whom such
presentation may lawfully be communicated (’relevant persons’). Any person who is not a relevant
person should not act or rely on this presentation or any of its contents. Information in the following
presentation relating to the price at which relevant investments have been bought or sold in the past
or the yield on such investments cannot be relied upon as a guide to the future performance of such
investments.
This presentation does not constitute an offering of securities or otherwise constitute an invitation or
inducement to any person to underwrite, subscribe for or otherwise acquire securities in any
company within the Telenor Group. The release, publication or distribution of this presentation in
certain jurisdictions may be restricted by law, and therefore persons in such jurisdictions into which
this presentation is released, published or distributed should inform themselves about, and observe,
such restrictions.
This presentation contains statements regarding the future in connection with the Telenor Group’s
growth initiatives, profit figures, outlook, strategies and objectives. All statements regarding the future
are subject to inherent risks and uncertainties, and many factors can lead to actual profits and
developments deviating substantially from what has been expressed or implied in such statements.
2
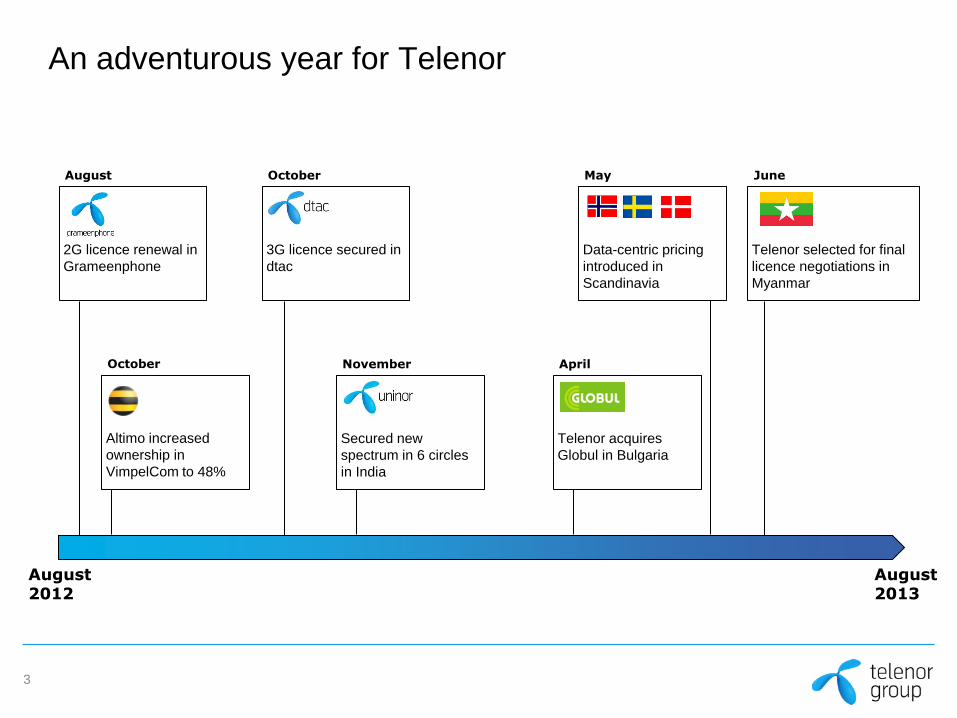
An adventurous year for Telenor
3
August 2012
August 2013
Altimo increased
ownership in
VimpelCom to 48%
October
Data-centric pricing
introduced in
Scandinavia
May
2G licence renewal in
Grameenphone
August
Secured new
spectrum in 6 circles
in India
November
3G licence secured in
dtac
October
Telenor acquires
Globul in Bulgaria
April
Telenor selected for final
licence negotiations in
Myanmar
June
Growth and efficiency: Execution of strategy
4
Efficient operator Internet for all Preferred by customers

Positioning Telenor Norway for the future
• Significant investments in mobile and
fibre networks
• Moving to data-centric pricing
• Building a future-proof operating model
• Targeting gross opex savings of NOK
2.0 bn in 2015
5 EBITDA margin before other items
25.2 25.5 25.3
0.0
10.0
20.0
30.0
40.0
50.0
60.0
70.0
80.0
0
5
10
15
20
25
30
LTM
43.7
2012
41.5
2011
39.6
10.0 10.8
3.7 4.1 4.3
2011 2012 LTM
EBITDA CAPEX
EBITDA and capex (NOK bn)
Revenues (NOK bn) and EBITDA margin (%)
11.0
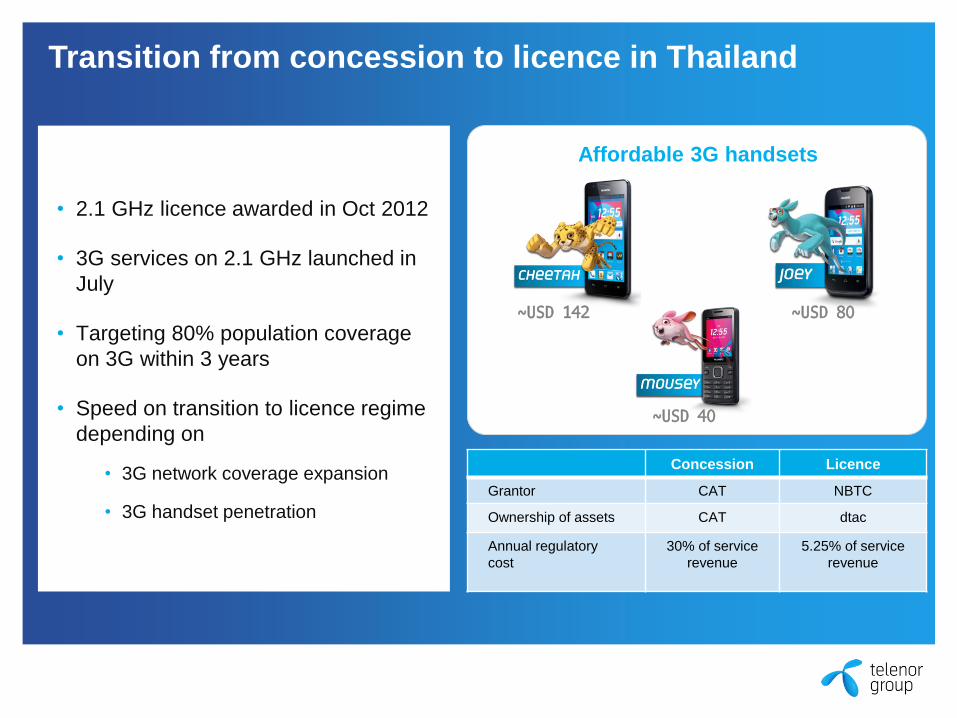
Transition from concession to licence in Thailand
Concession Licence
Grantor CAT NBTC
Ownership of assets CAT dtac
Annual regulatory
cost
30% of service
revenue
5.25% of service
revenue
• 2.1 GHz licence awarded in Oct 2012
• 3G services on 2.1 GHz launched in
July
• Targeting 80% population coverage
on 3G within 3 years
• Speed on transition to licence regime
depending on
• 3G network coverage expansion
• 3G handset penetration
Affordable 3G handsets
~USD 142 ~USD 80
~USD 40
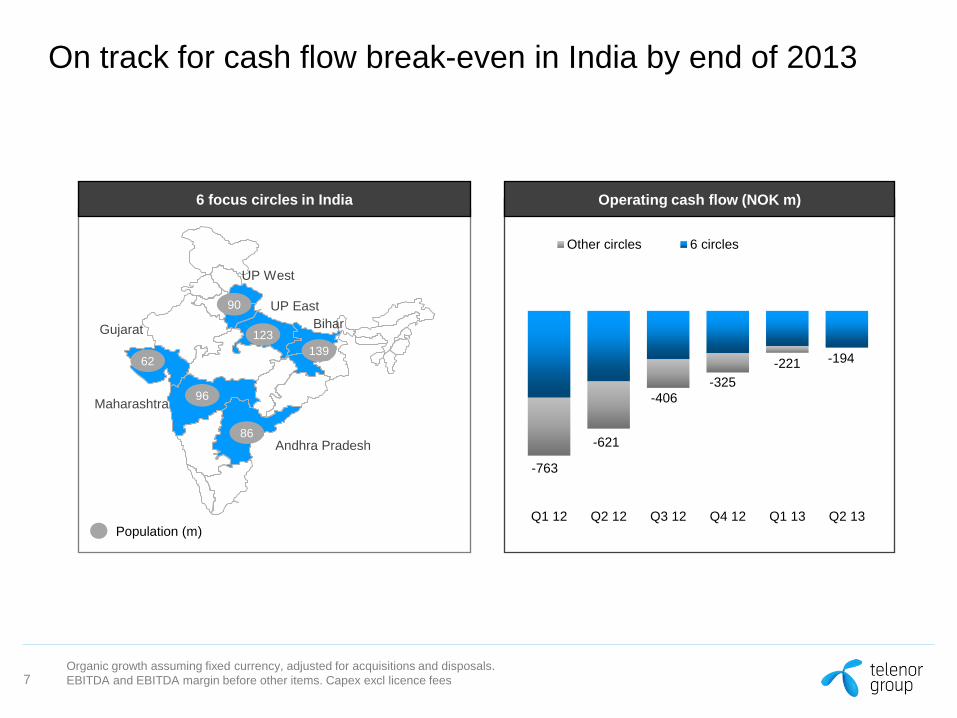
On track for cash flow break-even in India by end of 2013
Operating cash flow (NOK m)
Q1 12 Q2 12 Q3 12 Q4 12 Q1 13 Q2 13
Other circles 6 circles
-763
-621
-406
-325
-221 -194
Organic growth assuming fixed currency, adjusted for acquisitions and disposals.
EBITDA and EBITDA margin before other items. Capex excl licence fees 7
6 focus circles in India
Maharasht
ra
Gujarat
Maharashtra
Andhra Pradesh
UP West
UP East
Bihar
Population (m)
62
96
86
90
123
139

Successful applicant for
licence in Myanmar
• Offered nationwide telecommunication
licence
• 900 MHz and 2100 MHz spectrum
• 15 years licence duration
• Technology neutral spectrum
• Population of 60 million with less than
10% mobile penetration
• Awaiting telecom law and final licence
conditions
8

Priorities for capital allocation remain firm
Maintain a solid balance sheet
Competitive shareholder remuneration
Disciplined and selective M&A
1
2
3
Net debt/EBITDA below 2.0x
50-80% dividend payout of
normalised net income
Aim for YoY growth in dividends
Value driven, within core
assets and regions
9
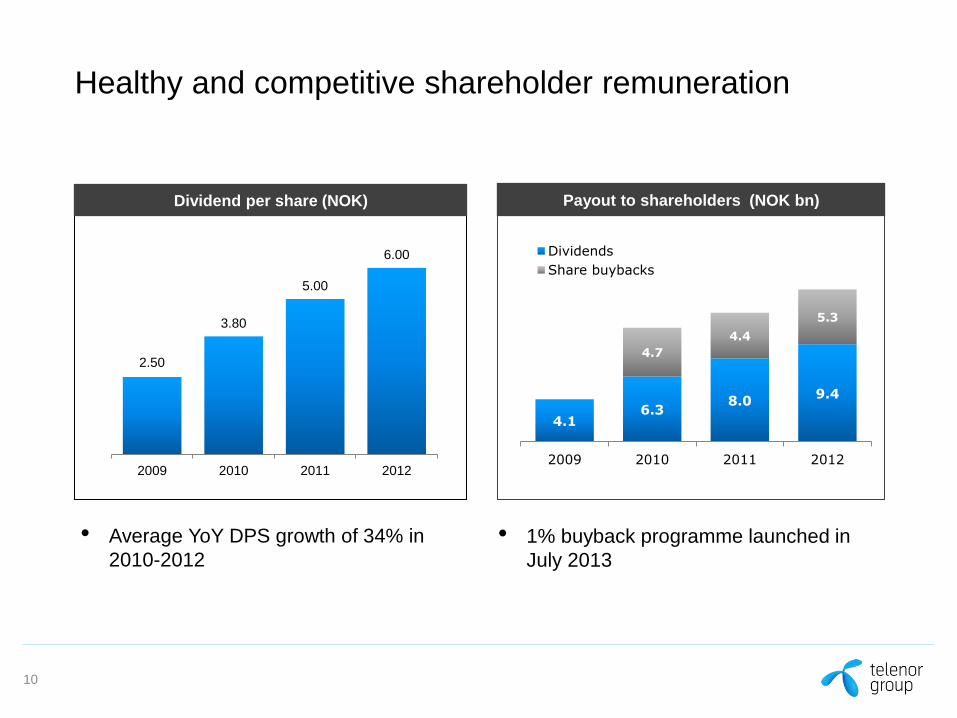
Healthy and competitive shareholder remuneration
Payout to shareholders (NOK bn)
4.1 6.3
8.0 9.4
4.7
4.4
5.3
2009 2010 2011 2012
Dividends
Share buybacks
10
2.50
3.80
5.00
6.00
2009 2010 2011 2012
Dividend per share (NOK)
• Average YoY DPS growth of 34% in
2010-2012
• 1% buyback programme launched in
July 2013

Executing on strategy to drive value creation
11
Efficient operator Internet for all
Operating cash flow defined as EBITDA before other items and capex excluding licence and spectrum fees
Preferred by customers
Targeting operating cash flow of NOK 28-30 bn in 2015

Capital Markets Day
17 September 2013
Telenor Group’s head office at Fornebu
12

Thank you

Telenor Group
Norway
Sweden
Denmark
Europe
Hungary
Serbia
Montenegro
Globul
Asia
Thailand
Malaysia
Bangladesh
Pakistan
India
VimpelCom Ltd.
Telenor Group holds 33.0% economic and
43.0% voting stake in VimpelCom Ltd.
153 million consolidated mobile subscribers
Revenues in 2012: NOK 102 bn (USD 18 bn)
Market cap: NOK 200 bn (USD 34 bn)
14
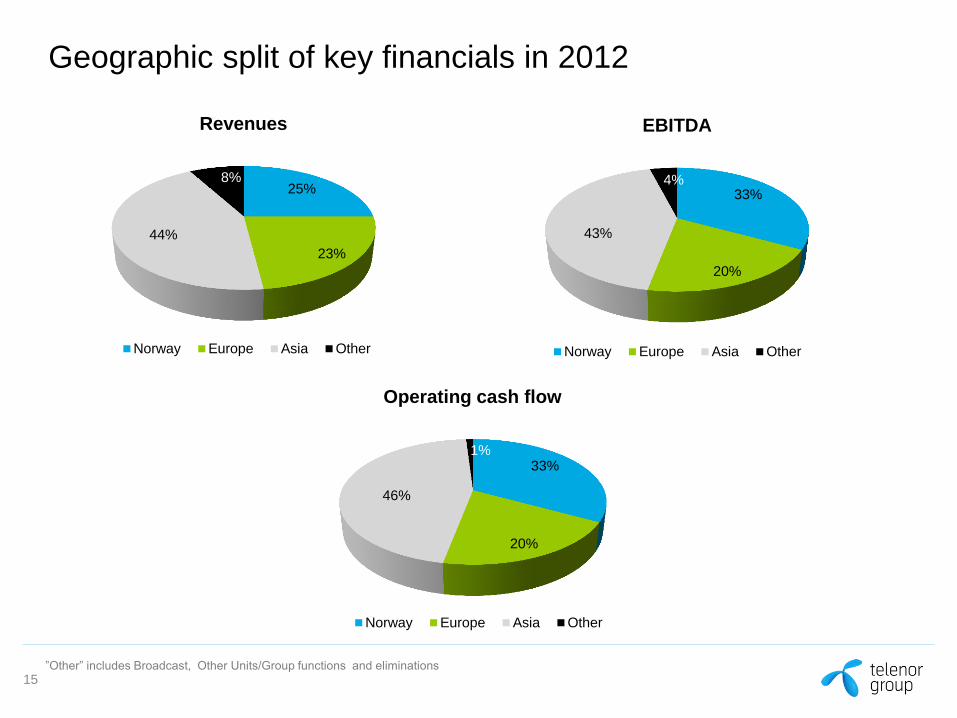
Geographic split of key financials in 2012
25%
23%
44%
8%
Revenues
Norway Europe Asia Other
33%
20%
43%
4%
EBITDA
Norway Europe Asia Other
33%
20%
46%
1%
Operating cash flow
Norway Europe Asia Other
”Other” includes Broadcast, Other Units/Group functions and eliminations
15
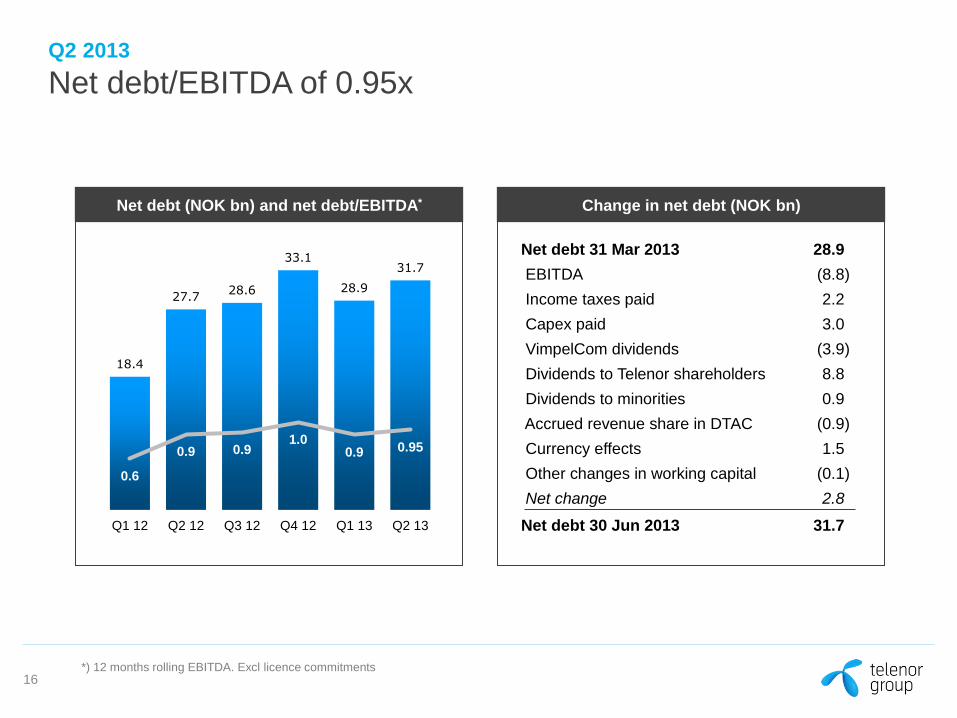
Q2 2013
Net debt/EBITDA of 0.95x
*) 12 months rolling EBITDA. Excl licence commitments
Net debt 31 Mar 2013 28.9
EBITDA (8.8)
Income taxes paid 2.2
Capex paid 3.0
VimpelCom dividends (3.9)
Dividends to Telenor shareholders 8.8
Dividends to minorities 0.9
Accrued revenue share in DTAC (0.9)
Currency effects 1.5
Other changes in working capital (0.1)
Net change 2.8
Net debt 30 Jun 2013 31.7
Change in net debt (NOK bn)
18.4
27.7 28.6
33.1
28.9
31.7
0.6
0.9 0.9 1.0
0.9 0.95
Q1 12 Q2 12 Q3 12 Q4 12 Q1 13 Q2 13
Net debt (NOK bn) and net debt/EBITDA*
16

Q2 2013
Outlook for 2013
2013 2013 YTD
Organic revenue growth 2%-4% 1.0%
EBITDA margin Around 34% 34.2%
Capex / sales 12%-14% 12.6%
Outlook as of Q2 2013. Assuming Group structure incl. India 6 circles.
EBITDA before other items. Capex excl. licence fees.
Exchange rates as of 30 June 2013.
17