Embed Size (px)
Citation preview
Proceedings of the 12th International Conference on Artificial Reality and Telexistence (ICAT 2002), The University of Tokyo, Japan, December 3-6, 2002, to be published by Ohmsha/IOS Press, <http://www.ic-at.org/>.
Teleimmersion and Visualization with the OptIPuter
Thomas A. DEFANTI, Jason LEIGH, Maxine D. BROWN, Daniel J. SANDIN,
Oliver YU, Chong ZHANG, Rajvikram SINGH, Eric HE, Javid ALIMOHIDEEN and Naveen K. KRISHNAPRASAD, Electronic Visualization Laboratory
Robert GROSSMAN, Marco MAZZUCCO, Laboratory for Advanced Computing University of Illinois at Chicago
Larry SMARR, Mark ELLISMAN and Phil PAPADOPOULOS, California
Institute for Telecommunications and Information Technology, National Center for Microscopy and Imaging Research and San Diego Supercomputer Center
Andrew CHIEN, Computer Science Department John ORCUTT, Scripps Institution of Oceanography
University of California, San Diego
Abstract. The OptIPuter is a radical distributed visualization, teleimmersion, data mining and computing architecture. Observing that the exponential growth rates in bandwidth and storage are now much higher than Moore’s Law, this major new project of several US universities in Southern California and Illinois “goes to the end of the rainbow” to exploit a new world in which the central architectural element is optical networking, not computers. This transition is caused by the use of parallelism, as in supercomputing a decade ago. However, this time the parallelism is in multiple wavelengths of light, or lambdas, on single optical fibers, creating supernetworks. The OptIPuter project aims to re-optimize the entire Grid stack of software abstractions, to learn how, as George Gilder suggests, to “waste” bandwidth and storage in order to conserve increasingly “scarce” high-end computing and people time in this new world of inverted values.
Introduction
This paper describes the OptIPuter strategy, but focuses on an overview of visualization and teleimmersion issues, leaving the intricate details of the networking controls, operating system optimizations, data-mining strategies, visualization algorithms and so on, to current and forthcoming papers.
The OptIPuter project is driven by applications leadership of two scientific communities, the US National Science Foundation (NSF) EarthScope and the US National Institutes of Health (NIH) Biomedical Imaging Research Network
Teleimmersion and Visualization with the OptIPuter 2
(BIRN), both of which are beginning to produce a flood of data that will be stored in distributed federated data repositories. One characteristic blocking such science is that the individual data objects (a 3D brain image or a terrain dataset) are large (gigabytes) compared to what can be interactively manipulated or visualized over today’s networks. What these scientists require are ultra-high-speed predictable clear-channel networks that link PC clusters, storage and visualization systems, and enable collaborating scientists to explore interactively massive amounts of previously uncorrelated data. This is a non-trivial requirement.
Essentially, the OptIPuter is a virtual parallel computer in which the individual processors are widely distributed clusters; the backplane is provided by Internet Protocol (IP) delivered over multiple dedicated 1-10Gbps optical wavelengths (called lambdas); and, the mass storage systems are large distributed scientific data repositories, fed by scientific instruments as OptIPuter peripheral devices, operated in near real-time. Collaboration, visualization and teleimmersion tools are provided on super-high-definition, tiled, mono- or stereo-screens directly connected to the OptIPuter. In order to do this, displays coupled to the local OptIPuter cluster need to be optically connected by a LambdaGrid to other OptIPuter clusters, providing a means for collaboration with other people, as well as accessing remote data and heterogeneous computing. All of this interconnectivity needs to be scheduled to maximize throughput, a feature common to supercomputers, high-end science instruments, and even teleimmersion and collaboration devices, but not bandwidth. The OptIPuter provides sufficient bandwidth and middleware between its elements such that networking can be scheduled and relieved of its historical characterization as the chief non-deterministic element in distance computing. Latency, of course, still has to be managed, but in a metropolitan-scale OptIPuter, speed-of-light latency is less than disk seek time, and can be quite predictable in an optically-switched LambdaGrid.
The near-term goal of the OptIPuter is to increase visualization power tenfold or more through a new architecture for distributed information infrastructure, one that optimizes the use of screens, clusters, storage and networks in parallel. A major coordinated effort is underway to deliver this order of magnitude improvement in visualization and teleimmersion. The five-year goal is two orders of magnitude improvement over 2002-vintage high-end single PCs, graphics cards, storage and networks. To reach these goals, the following strategy is being pursued in a coordinated fashion, keeping in mind the large amount of parallelism that occurs at every level and between levels:
• Understand and address the needs of the applications and users • Implement new visualization and teleimmersion devices and software • Develop coordinated data-mining and storage capabilities • Write the schedulers for the OptIPuter operating system • Invent new protocols for uncongested high-performance networks • Construct the LambdaGrid network wavelength schedulers • Build the optical network
The OptIPuter project aims to explore improvements in visualization systems (network to application) that can be made when bandwidth is not the bottleneck.
Teleimmersion and Visualization with the OptIPuter 3
Sections 1-4 motivate building the OptIPuter, describe its large-scale science drivers in Earth science and bioscience data analysis, its components and operating system considerations, and a middleware strategy for controlling the networks from the application in a way that hides the management details from the user. Section 5 describes OptIPuter approaches to teleimmersion and high-end visualization, including methods to interactively visualize massive datasets, remotely and locally generate very-high-resolution graphics, and produce teleimmersive displays with auto-tracked, autostereo capabilities. 1. Building the OptIPuter: Taking Advantage of
Accelerating Commodity Technologies
Consider a 6000x3000-pixel display connected in real time to massive computing and storage resources over a 100 Gigabit-per-second (Gbps) network. Computing and storage vendors have long embraced parallelism as the way to gain speed and capability from commodity parts, so it is natural, given the current absence of 6000x3000 native displays and 100Gbps network interfaces, to use commodity-based parallelism for visualization and networking. The OptIPuter can be thought of as an array of PC processors connected to an array of PC graphics cards and giant disks via a system bus that happens to be a multi-channel high-speed optical network.
The integration of parallelized visualization, storage, computing and networking is a massive multi-year task involving scores of researchers, students and staff. OptIPuter experiments are underway in San Diego using campus and metro-area testbeds and in Chicago using metro and national/international-scale networks, as affordable high-speed bandwidth becomes available over progressively longer distances. Northwestern University (NU) and the University of Illinois at Chicago (UIC) are building the StarLight facility to switch dozens of 10 Gigabit Ethernet (GigE) and hundreds of 1GigE circuits. I-WIRE is a project that provides wavelengths over dark fiber to major Illinois universities and government laboratories. California’s CENIC is building CalREN-XD to provide wavelengths to California researchers [1].
The opportunity to build and experiment with an OptIPuter has arisen because of major technology changes that occurred over the last five years. In the early ‘90s, Moore’s Law growth curves for CPU processing dominated the growth of storage and bandwidth. Instruction rates were the important metric, while storage and bandwidth were the tail of the computing dog. Computing carefully conserved scarce bandwidth and storage, since they were slow peripherals to the computer. Now, in contrast, the growth rate of optical bandwidth and storage capacity is much higher than Moore’s Law. The fact that the bandwidth and storage exponentials are crossing Moore’s Law turns the old computing paradigm on its head: that which was scarce is now abundant and vice versa. The OptIPuter is being built from commercially available PC clusters that are bandwidth-matched to rapidly increasing numbers of predicted lambdas on the Grid. Newer
Teleimmersion and Visualization with the OptIPuter 4
clusters added to the OptIPuter over the next five years will push the lambda transport as close to the individual processor endpoints as possible by upgrading the internal PCI bus from AGP8X to 3GIO, the 1GigE network interface cards to 10GigE, and the attached 1Gbps lambdas to 10Gbps.
The OptIPuter is similar to lambda-linked cluster computers like the US NSF-sponsored TeraGrid [2] in that both are built of commodity components, and both use Dense Wavelength Division Multiplexing (DWDM) in the core of the network. However, the OptIPuter focuses on the optical networking extreme rather than on the aggregate processor count. Whereas the OptIPuter assumes full bisection bandwidth, the TeraGrid has a 20:1 ratio of local to wide-area bisection, and whereas the OptIPuter needs specialized and novel high-speed network stacks that are suitable for uncongested full-bisection networks, the TeraGrid relies on known and working protocols like TCP and FTP. The OptIPuter strategy will reach its first milestone when the cost of adding wavelengths on fiber between processors is less than procuring the processors, storage and/or visualization devices. (The cost of the fiber itself is not included, as we consider it the same as providing other physical facilities, such as the buildings in which the computers are housed. However, the cost of equipment to light up the fiber is part of the equation.)
The OptIPuter capitalizes on the rapid advances in network bandwidth made available by DWDM. In the OptIPuter model, endpoints and lambdas are dynamically configured in response to the needs of an application. Contemporary telecom network management today involves largely static configurations shared via higher-level multiplexing protocols (i.e., the packet-switched Internet). Capturing the promise of dynamically configured lambdas, connected in real time at an application’s request, requires advances in infrastructure, middleware and network protocols. Details on such protocols and middleware are outside the scope of this paper and will appear in optical-network-oriented publications [3].
The OptIPuter counts on plentiful storage capacity and bandwidth richly interconnecting data into a nearly uniform resource. To achieve its objectives, the current mismatch between native-storage data-transfer rates and optical networks must be directly addressed. The OptIPuter is also re-examining efficient analysis and mining techniques of distributed data. Fundamental questions arise as to whether to move the data or move the analysis. Data mining presents another opportunity to move the model, or other intermediate computation, where the model is seen as the result of data-analysis or data-mining operations [4].
Time-varying volume-visualization techniques can use commodity clusters with high-performance graphics cards (including 3D texture mapping for hardware-assisted voxel-based volume rendering). The OptIPuter is designed to simultaneously apply multiple distributed volume rendering algorithms (voxel-, isosurface- and point-cloud-based) to present the same data in multiple ways, as different transfer functions highlight different features in a data volume [5, 6].
The OptIPuter is possible now because certain technological advances in networking, including 1Gbps and 10Gbps networks, have become available to researchers. Also, disk storage is getting more and more inexpensive, clusters are becoming commonplace, and the videogame market has produced 3D graphics boards for PCs that are extremely powerful, yet cheap.
Teleimmersion and Visualization with the OptIPuter 5
After many years of increasing bandwidth on single paths on fiber, industry is at a crossroads. While the long-haul sector has substantial momentum to continue to increase lambda capacity (i.e., from 10-40Gbps) and use moderate parallelism to handle bulk traffic, the metro arena seems to have more interest in standardizing on 1Gbps or 10Gbps lambdas, while using many parallel lambdas on the same fiber to create clear-channel optical circuits. While both approaches can continue, the situation is analogous to the last decade of computing, in which market momentum shifted from a focus on ever-faster specialized single-vector processors to commodity processors for parallel computers.
A critical driver of the OptIPuter project is that while DWDM optical networks have vastly increased the capacity of Wide Area Network (WAN) telecom networks, equally dramatic developments have taken place in Local Area Network (LAN) and server-interconnect technologies, as evidenced by the IEEE P802.3ae 10GigE standard and the InfiniBand specification for server-interconnect networks. InfiniBand [7] is an example of server-interconnect technology; its architecture design is based on an industry-wide effort to standardize the advantages of cluster communications, namely: operating system (OS) bypass, hardware-managed multiplexing, demultiplexing, memory protection, segmentation and reassembly, and credit-based flow control on packet-switched networks with multiple priority levels.
By developing a hybrid approach to lambdas and InfiniBand-style techniques, high bandwidth comes ever closer to the processors and memory. Steve Wallach [8] predicts that, by the end of the decade, there will be direct on-die optical interconnects into microprocessor cores; lambdas will move from switch interconnects to endpoint interconnects.
The use of InfiniBand-style OS-bypass link flow control mechanisms over DWDM links enables high-bandwidth, low-processor overhead and nearly lossless networks to be extended well beyond the currently available high-performance cluster fabrics. High-speed, low-latency, OS-bypass system-area networks (Fast Messages, Active Messages, Basic Interface for Parallelism [BIP], GM, PMv2, cLAN, QSW, SCI, SP switch) use credit-based flow control to ensure that sufficient receiver-side resources are available on every message. The OptIPuter extends these ideas over DWDM to the campus and metro areas.
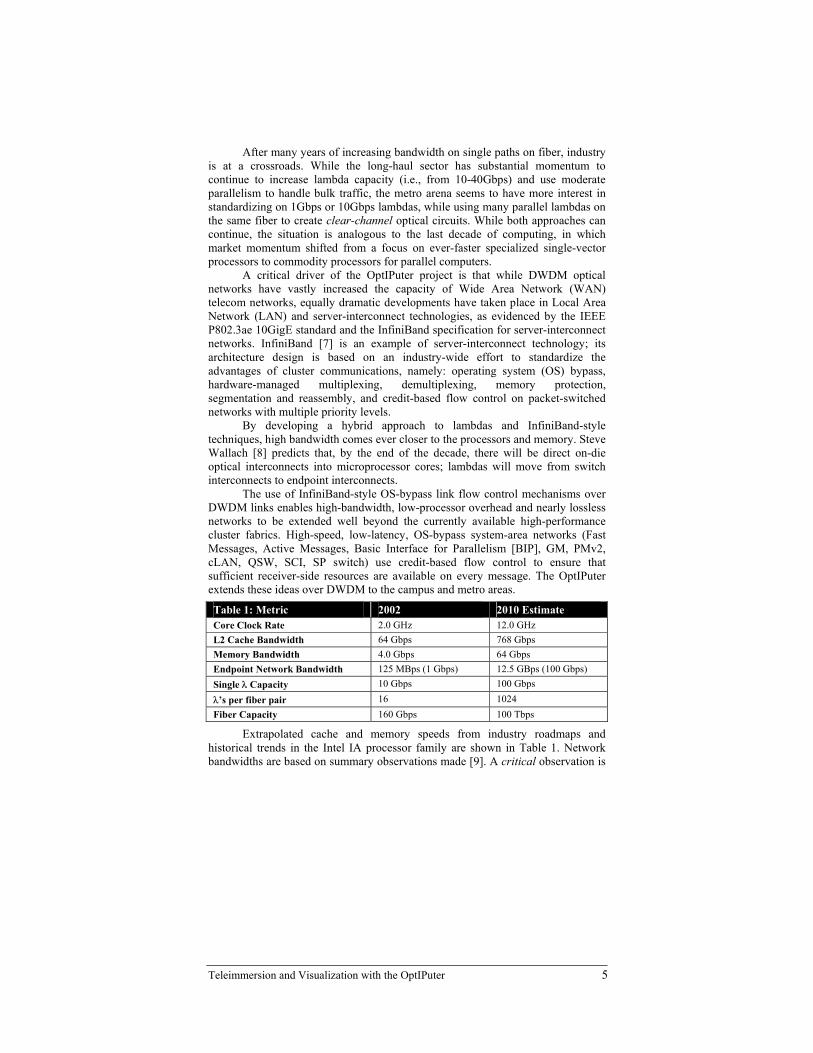
Extrapolated cache and memory speeds from industry roadmaps and historical trends in the Intel IA processor family are shown in Table 1. Network bandwidths are based on summary observations made [9]. A critical observation is
Table 1: Metric 2002 2010 Estimate Core Clock Rate 2.0 GHz 12.0 GHz L2 Cache Bandwidth 64 Gbps 768 Gbps Memory Bandwidth 4.0 Gbps 64 Gbps Endpoint Network Bandwidth 125 MBps (1 Gbps) 12.5 GBps (100 Gbps) Single λ Capacity 10 Gbps 100 Gbps λ’s per fiber pair 16 1024 Fiber Capacity 160 Gbps 100 Tbps
Teleimmersion and Visualization with the OptIPuter 6
that the ratio of microprocessor memory to network bandwidth is 32:1 today in GigE-connected clusters. In contrast, by decade’s end, this ratio (conservatively) changes to 5:1 and could possibly be ~1:1 a few years later. This change dramatically reverses the roles of computers and networks; the computer becomes a service to the network. Network devices will reside directly on the memory bus by 2005, a step towards Wallach’s on-die prediction. This inversion of computer bandwidth hierarchy this next decade is the defining feature of the OptIPuter.
The advent of personal computing in the early 1980s triggered a technological revolution in data storage: the compound growth rate (CGR) in areal storage density of hard disk drives was an impressive 25% per annum. However, in the 1990s, major technical advances in nano-magnetic materials, read-write head designs, accurate servo positioning, mechanical interfaces and signal processing and coding propelled the CGR from 25% to 60% to over 100% per year. The areal density went from 12Mb/square-inch in 1980 to more than 30Gb/square-inch today [10, 11]. The data-storage industry is now gearing up for products with 100Gb/square-inch, and the National Storage Industry Consortium is sponsoring research on approaches to achieving 1Tb/square-inch, with data transfer rates in excess of 3Gbps [12, 13, 14]. Storage as well as bandwidth should be appropriately wasted in the service of valuable computing in the future. 2. OptIPuter Drivers: Earth Sciences and Biosciences
Data, from distributed sensors, research instruments and data caches, has enhanced understanding of Earth and biomedical systems. Two research activities led by UCSD researchers provide the applications pull for the OptIPuter. Both involve large distributed data grids and intend to use the OptIPuter to interactively analyze and collaboratively visualize large data objects. From the e-Science point of view, the scientist in the lab interacts with extremely high-resolution visualizations, and perhaps with other remotely located scientists or technicians.
Data-mining techniques, such as classification and clustering, are increasingly being used by scientists. These techniques reduce massive volumes of stream data to more manageable proportions and focus the scientist’s attention [15]. In contrast to a conventional supercomputer in which data is naturally at rest, in the OptIPuter, data is also naturally in motion, streaming over lambdas. Data mining of such data streams poses significant research challenges compared to more traditional data-mining algorithms that mostly view data as a static entity.
Scripps Institution of Oceanography’s Institute of Geophysics and Planetary Physics’ (IGPP) work in Earth Sciences data analysis includes acquisition, processing and scientific interpretation of satellite-derived remote sensing, near-real-time environmental and active seismic source data. Collaborative visualization of very-large remote-sensing datasets across distributed sites is becoming increasingly important to geophysics.
Earth science applications become possible when 3D time-stepped computation and display of large datasets and models are facilitated by the
Teleimmersion and Visualization with the OptIPuter 7
transport of images and data within the OptIPuter. Today, using data archived by the Western North America Interferometric Synthetic Aperature Radar (SAR) Consortium [16], it is possible for scientists to focus on interferograms of individual scenes (~100km square) for deformation studies (e.g., earthquake strain, volcanoes and glacier flow). However, a digital terrain dataset of California comprises more than a billion points. Repeat SAR images of ground deformation from the IGPP-proposed Earth Change and Hazard Observatory (ECHO) SAR mission [17], a component of the NSF EarthScope program, requires about 60 of these full-resolution maps. An interferometric survey of California by the SAR satellite requires a grid spacing of 20m x 5m and the raw data (hundreds of scenes) comprises 16GB requiring a computational time of 100 hours on a single, modern processor. A typical computation comparing several prior SAR maps would consume 8000 CPU hours, and 4D visualizations must move 32GB of data to the Visualization Center at Scripps in 0.5 sec! The huge parallel bandwidth and computation provided by the OptIPuter makes this possible.
With today’s explosive growth in real-time data collection using wireless and satellite methods, it is possible to detect and locate an earthquake in many parts of California before fast-moving compressional waves hit urban areas and well before (15s-30s) major ground shaking associated with shear and surface waves occurs. In the near future, a public warning system could protect people from the dangers associated with natural disasters. Computational methods to follow ground motion dynamically into urban areas could, within minutes, predict areas of major damage, as well as provide a more accurate estimate of subsurface structure. Enormous quantities of memory are needed; the OptIPuter LambdaRAM (described below) is invaluable for these computations and the assimilation of data from seismology, GPS geodesy, strainmeter and IKONOS 1-m imagery.
Modern 3D seismic volumes of Earth’s substructure can easily exceed 50GB (derived from raw datasets that are nearly 1000x larger). However, even simple manipulation of these data volumes, such as a “diff” operation of two time-lapsed volumes or a “cat” of several adjoining volumes, is currently difficult if not impossible given the size limitations of these datasets. The OptIPuter design makes both data and computational data volumes usable on interconnected collaborative visualization systems.
The Biomedical Informatics Research Network (BIRN), funded in Fall 2001, is a pioneering large NIH project establishing a networked federated repository of multi-scale and multi-dimensional images, with the first two years of challenges related to neuro-imaging. These images, currently totaling more than 200TB, are generated by a wide variety of neurosciences imaging instruments into local data collections maintained by research teams participating in BIRN (Harvard, Duke, California Institute of Technology, University of New Mexico, University of California Irvine, University of California San Diego, Stanford University, University of California Los Angeles, University of Iowa, University of North Carolina and University of Minnesota). By the end of 2004, the BIRN network is expected to grow to 500TB of sanitized data located at more than 20 sites. The cumulative data-generation rate can be as high as 100GB/day at a steady rate, with burst loads exceeding 500GB/day. NIH expects to add additional neuro-

Teleimmersion and Visualization with the OptIPuter 8
imaging partnering groups over the next 18 months and then expand to other organ systems and disease loci (heart, liver, diabetes, cancer, etc.), creating a projected 100x data rate growth over the next five years.
BIRN is exploring the use of a virtual data grid to support multi-scale brain mapping. Specifically, BIRN is focused on creating a distributed data repository that enables interactive visualization of brain-mapping databases. The data rates from PET, MRI, histological, laser microscopy and 3D electron microscopy of partnering institutions is quite large. This, plus the diversity of data types, the geographical distribution of acquisition instruments, and the massive sizes of data accruing exceed the capability and capacity of the sites’ current information infrastructure and technologies. For example, multi-wavelength 4D datasets from a single high-speed multi-photon laser-scanning microscope are projected to grow to 50GB/hour in a few years, producing single datasets on the order of multiple TBs. To address this need, one early experiment uses distributed WAN storage in a multi-lambda OptIPuter.
A major issue within medical imaging is the simultaneous need to increase 3D resolution while maximizing field-of-view. The dream is to study structures at the highest magnifications, across large fields, and from extremely thick samples. Currently, single volumetric datasets acquired using electron tomography are common at 2048x2048x512. New energy-filtered microscopes allow for correction of chromatic aberration and consequently the use of much thicker specimens. With these technologies, within two years single datasets will exceed 4Kx4Kx2K, and within five-to-seven years, will exceed 12Kx12Kx2K. While the process of reconstructing volumes from raw projection data can be addressed with current parallel supercomputers, it is not yet possible to interactively explore, segment and analyze the resultant volumes. Thus, these needs are a key driver of the OptIPuter visualization systems. BIRN is gaining valuable experience with practical issues, ranging from privacy/security to how doctors can best couple to OptIPuter interactive displays. 3. Components of the OptIPuter
The OptIPuter is a giant visualization, storage, computing system tied together by uncongested networks. Optimizing the removal of the bottleneck of bandwidth to distributed visualization and teleimmersion clusters involves not only network protocol work, but also a redesign of operating systems, middleware and visualization paradigms. Current abstractions and access mechanisms for computing, networking and storage have evolved in an era of cheap computing and relatively low-bandwidth storage and networks. Today, complex network protocols are used to share networks and many compute operations (per byte of data) are required to optimize and manipulate storage access [18, 19, 20]. Tightly-coupled clusters in the late 1990s built from commodity systems [21, 22, 23, 24, 25, 26, 27, 28, 29] approximated the memory/network bandwidth ratios that are now the goal in the OptIPuter; these clusters required radical new structures that streamlined
Teleimmersion and Visualization with the OptIPuter 9
data handling and drove scheduling from the network up through the operating system. For clusters, the application model of tightly coupled synchronous message passing was well established early on, but no analogous model exists yet for distributed applications on architectures like the OptIPuter.
The OptIPuter explores the implications of allowing lambda paths to form uncongested networks from source to destination. It requires new protocols to enable tightly-coupled cluster computers to use a judicious integration of IP/optical and server-interconnect technologies, and novel communication structures and application communication abstractions that reflect the relative costs of compute/memory versus network/disk and deliver these new capabilities to distributed applications.
Such unprecedented bandwidth availability, in principle, allows for an optically interconnected Network Memory strategy. All prior work in this area has been restricted to LANs or system-area networks, because there has not yet been sufficient availability of bandwidth over a metro-scale area to carry data from memory to memory at rates close to memory access rates [30, 31, 32, 33, 34, 35]. Network Memory (see LambdaRAM below) uses the OptIPuter to provide a massive pool of physical memory across geographically distributed sites. In most current computers, when a program runs out of physical memory, it swaps data from physical memory to disk-based virtual memory as needed. LambdaRAM changes this paradigm by instead swapping data to memory in a remote computer. The idea is not to provide a storage system that is as fast as memory; but, rather, to provide a massive cache to minimize the impedance mismatch between disk and memory access speeds.
The capacity of OptIPuter links and a plethora of lambdas may make it possible in a few years to test out Gilder’s [36] “storewidth” model, in which the network controls data-movement policy, priority, routing and security. Applications like replication, backup, content delivery and software distribution will write to the network through open Application Programmer Interfaces (APIs), communicate via Extensible Markup Language (XML) and use Lightweight Directory Access Protocol (LDAP) directories for authentication and access control. Using these open standards, enterprises will be able to plug and unplug applications and rich content in this environment with relative ease. Since the OptIPuter blurs the distinctions between local data versus remote data, and between data at rest (in disk and memory) versus data in motion (in streams), previous research in caching and pre-fetching file-based data, in optimizing database queries, in materializing data warehouse views, and in distributing computations over data grids and data webs is being revisited.
The OptIPuter design orchestrates the use of computation, data and network resources, ensuring their efficient utilization while minimizing the need for asynchronous decoupling. High-bandwidth streams, whether originating from a remote computer or sea of disks, present significant challenges for the OptIPuter software architecture. If no receiver is waiting when a terabit stream arrives, buffering the data, even if possible, incurs major performance losses as the data must transit the limited memory bandwidth several times [37, 18, 21, 22]. It is no exaggeration to say that these losses can easily negate the entire benefit of faster
Teleimmersion and Visualization with the OptIPuter 10
networks, so the cost of asynchronous or decoupled operations is dramatically higher in an OptIPuter environment.
The OptIPuter offers bundles of network endpoints, each with bandwidths approaching local computer memory bandwidth connected to clusters of computers or storage devices. In this model, parallel clusters, computing or storage, are seamlessly scaled to match the advances in network technology. Today’s typical system configurations involve multiple network connections per computer, router or other endpoint, and do not provide for automatic distribution, matching and scaling. Critically important, the OptIPuter includes the development of a high-level programming framework that simultaneously allows descriptions of these novel bundle compositions and achieves their efficient mapping, scheduling and implementation. Significant research is required to achieve these capabilities, all of which are essential prerequisites for broad use by applications communities.
The OptIPuter requires the distribution of the parts of a computer, today mostly confined to a physical cabinet or a machine room. The OptIPuter model further complicates the picture by positing the flexible sharing of the parts of the computer by users from different organizations, communities and, eventually, different countries. Such sharing inevitably exposes a wide range of security risks that must be addressed. Therefore, another focus of OptIPuter research is on security; challenges to be addressed include managing storewidth optical Storage Area Networks (SANs), dealing with endpoint failure, and integrating with deeply embedded security paradigms. 4. Middleware for the OptIPuter: Quanta
In order to optimize data delivery in OptIPuter applications, advances need to be made at several of the Open Source Initiative (OSI) network layers. At the physical layer, the shared packet-switched Internet will be augmented by photonic-switched networks to guarantee schedulable high bandwidth. The Photonic Inter-domain Negotiator (PIN), a signaling framework currently under development, supports this capability. At the data-link layer, Multiple Protocol Label Switching (MPLS) or Virtual LAN (VLAN) replaces slow and inefficient layer 3 switching, while at the same time providing quality of service (QoS). The Internet Protocol (IP) is still used at layer 3 in order to maintain compatibility with the Internet. At the transport layer, there is already consensus among network researchers that the current TCP implementations are not suitable for long-distance high-performance data transfer.
Quanta is middleware to address this data transport problem. Quanta is a cross-platform adaptive networking toolkit for supporting the diverse networking requirements of interactive and data-intensive OptIPuter applications. It is an easy-to-use system that allows programmers to specify the data-transfer characteristics of their application at a high level. Quanta transparently translates these requirements into appropriate networking decisions, which include making necessary QoS reservations and adaptively utilizing the transport protocols to

Teleimmersion and Visualization with the OptIPuter 11
fulfill the user’s data transfer requirements. Quanta uses an algorithm for aggressive bulk data transfer called Reliable Blast UDP (RBUDP).
Each fiber-optic wavelength channel can be pushed to 10-40Gbps. Wavelength division multiplexing gives scores of channels per fiber, resulting in a combined bandwidth approaching 1Tbps. Straightforward use of the BSD socket library cannot take advantage of such high bandwidth, making commonly used networking protocols unsuitable for high-end applications. Even if networked applications could make gigabit lambda reservations, it is not guaranteed they would make full use of that bandwidth. This problem is particularly evident when one attempts to perform large bulk data transfers over long-distance, high-speed networks (often referred to as long fat networks or LFNs) [38] for visualization.
LFNs, such as those between the US and Europe or Asia, have high round-trip latencies (~120-200ms). This latency results in gross bandwidth under-utilization when TCP is used for data delivery because TCP’s windowing mechanism imposes a limit on the amount of data it will send before it waits for an acknowledgement. International networks have long delays causing TCP to spend an inordinate amount of time waiting for acknowledgments. Consequently, the client’s data transmission can never reach the peak available capacity of the network. Traditionally this is remedied by adjusting TCP’s window and buffer sizes to match the bandwidth*delay product (or capacity) of the network. For example, for a 1Gbps connection between Chicago and Amsterdam, with an average round trip time of 110ms, the capacity is 1024*0.11/8 = 14.1MBytes. Adjusting TCP window size is problematic for several reasons: first, on some operating systems (such as IRIX for the SGI,) the window size can only be modified by building a new version of the kernel; hence, this is not an operation a user-level application can invoke. Second, one needs to know the current capacity of the network in order to set the window size correctly. The current capacity varies with the amount of background traffic already on the network and the path to the destination, so dynamic window size changing is required.
As a consequence, there is now great interest in developing UDP-based protocols to improve bandwidth use. Simple Available Bandwidth Utilization Library (SABUL) [39] and Tsunami [40] are two recent examples. The Reliable Blast UDP (RBUDP) protocol is another [41]. The unique contribution of RBUDP is that it provides an analytical model to predict its performance. This kind of predictability is important for data-intensive, interactive applications.
Quanta emerged from almost a decade’s experience in connecting immersive CAVE systems [42] to each other and to supercomputers, a technique now called teleimmersion [43]. Quanta’s predecessor is CAVERNsoft [44], which has been widely used by the CAVE community of users to develop advanced teleimmersive applications. Consequently, Quanta inherited all of the data sharing abstractions that were found useful for developing these teleimmersive applications, and networked applications in general.
Work is currently underway to develop a software infrastructure for light path provisioning on photonic networks. While Quanta can ensure that data is optimally delivered over these light paths, it presently does not have the ability to allocate these dedicated light paths. This is the role of PIN, the inter-domain
Teleimmersion and Visualization with the OptIPuter 12
negotiator mentioned above. An application wishing to allocate a light path between two end points contacts its local PIN, which dispatches generic light-path signaling messages to neighboring PINs until the final destination is reached. Each PIN translates the generic light-path signaling message into a native photonic signaling message that is understood by the local intra-domain light-path signaling facility. This facility then signals the photonic switch to make adjustments to its internal MEMS switches to establish a connection. A prototype of PIN is now being developed.
RBUDP [45] has two main goals. The first goal is to keep the network pipe as full as possible during bulk data transfer. The second is to avoid TCP’s per-packet interaction so that acknowledgments are not sent per window of transmitted data, but instead aggregated and delivered at the end of a transmission phase. In RBUDP, the most important input parameter is the sending rate of the UDP blasts. To minimize loss, the sending rate should not be larger than the available bandwidth of the bottleneck link. Tools such as Iperf and netperf [46, 47] are typically used to measure bottleneck bandwidth. In theory, if one could send data just below this rate, data loss should be near zero. In practice however, other factors must be considered. In the first implementation of RBUDP, a send rate of 5% less than the available network bandwidth predicted by Iperf surprisingly resulted in approximately 33% loss! After further investigation it was found that the problem was in the end host rather than the network. Specifically, the receiver was not fast enough to keep up with the network while moving data from the kernel buffer to application buffers. When a faster computer was used as the receiver, the loss rate decreased to less than 2%. The details of this work are further discussed in a forthcoming paper, QUANTA: A Toolkit for High Performance Data Delivery over Photonic Network, which will include descriptions of experiments that compare these versions of the protocol, and an analytical model of RBUDP. 5. Teleimmersion and Visualization using the OptIPuter 5.1 Teleimmersion and Visualization Requirements
For over a decade, the Electronic Visualization Laboratory (EVL) at the
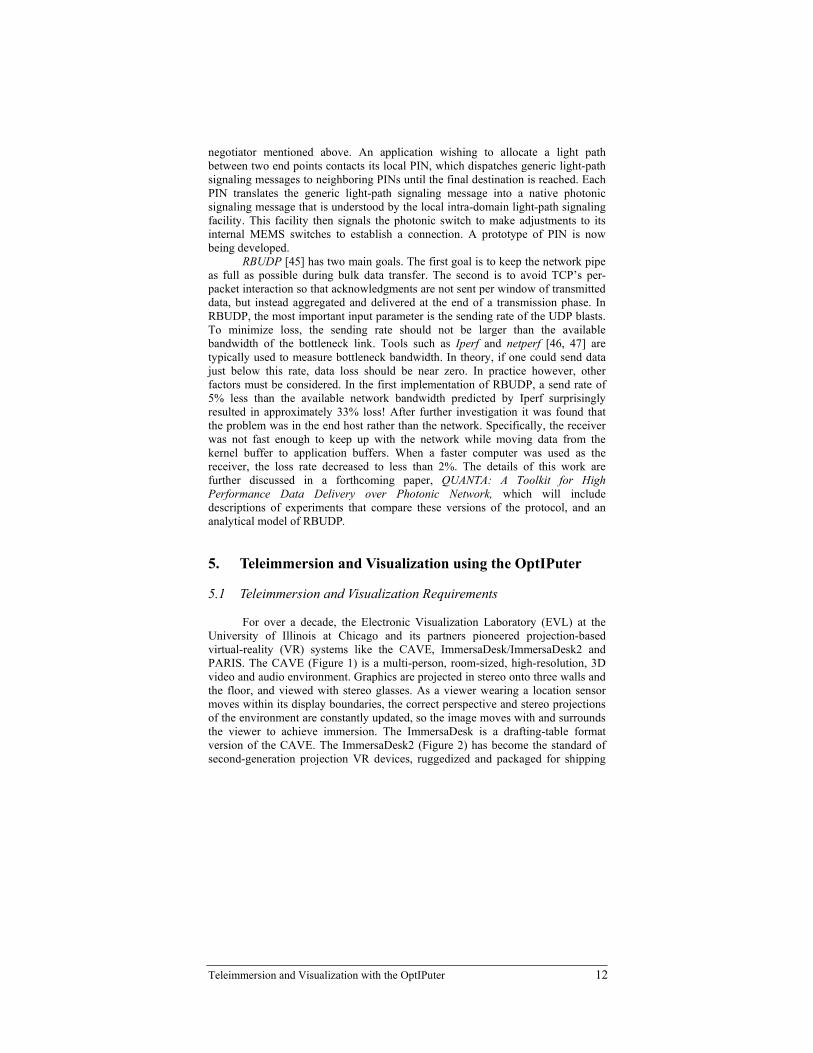
University of Illinois at Chicago and its partners pioneered projection-based virtual-reality (VR) systems like the CAVE, ImmersaDesk/ImmersaDesk2 and PARIS. The CAVE (Figure 1) is a multi-person, room-sized, high-resolution, 3D video and audio environment. Graphics are projected in stereo onto three walls and the floor, and viewed with stereo glasses. As a viewer wearing a location sensor moves within its display boundaries, the correct perspective and stereo projections of the environment are constantly updated, so the image moves with and surrounds the viewer to achieve immersion. The ImmersaDesk is a drafting-table format version of the CAVE. The ImmersaDesk2 (Figure 2) has become the standard of second-generation projection VR devices, ruggedized and packaged for shipping
Teleimmersion and Visualization with the OptIPuter 13
via air or truck. It is ideal to ship to conferences and schools on short-term bases and features a movable display screen allowing variable angles of view as well as height adjustment and improved accessibility by disabled persons. PARIS, the Personal Augmented Reality Immersive System, (Figure 3) is a third-generation VR device that allows augmented reality, incorporates head/hand tracking and uses a SensAble Technologies’ PHANTOM haptics device. Audio support can be used for voice recognition and generation, as well as recording a teleimmersion session.
Figure 1: CAVE Figure 2: ImmersaDesk2 Figure 3: PARIS
Starting in 1995, EVL VR systems were linked together by high-speed local, metro, national and international networks [48, 49, 50], supporting scores of applications in science, engineering, art and cultural heritage. Hundreds of these systems are in place worldwide, but the modality of interaction mostly involves pre-staging the data by shipping it in advance, and sending only the few bytes of user-generated control parameters in real time. Any substantial use of networking to ship video avatars or share large models has been frustrated by the inability to get adequate throughput on demand.
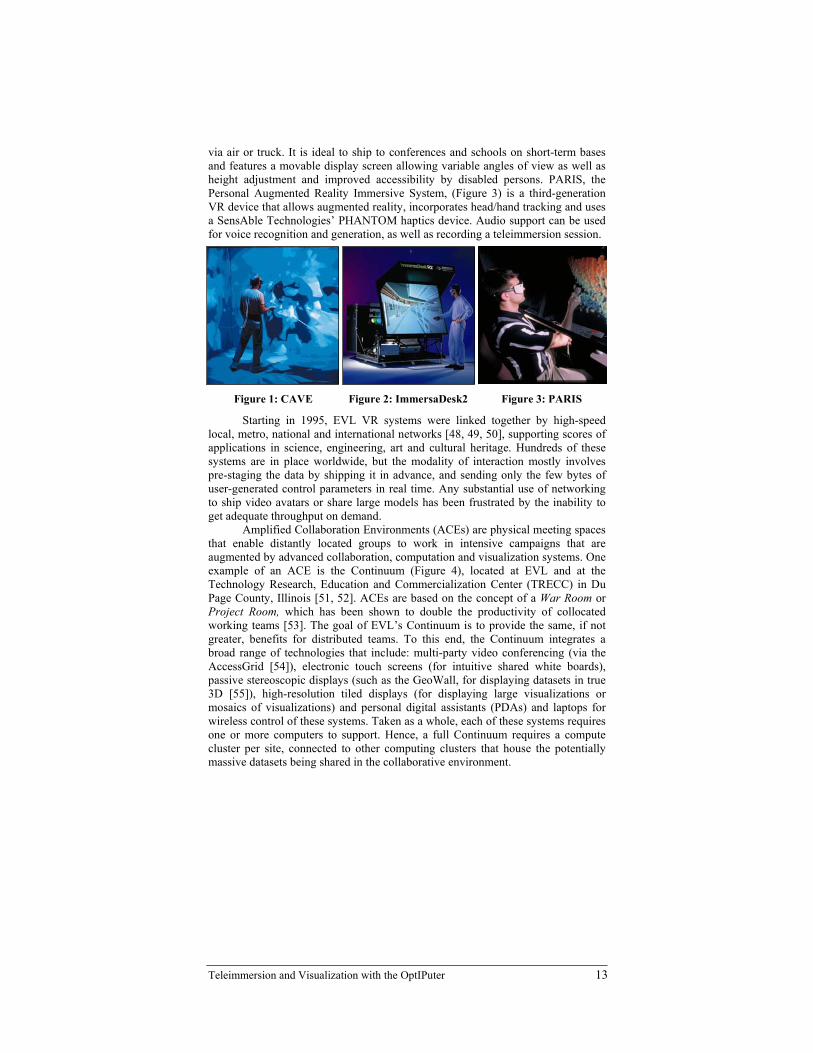
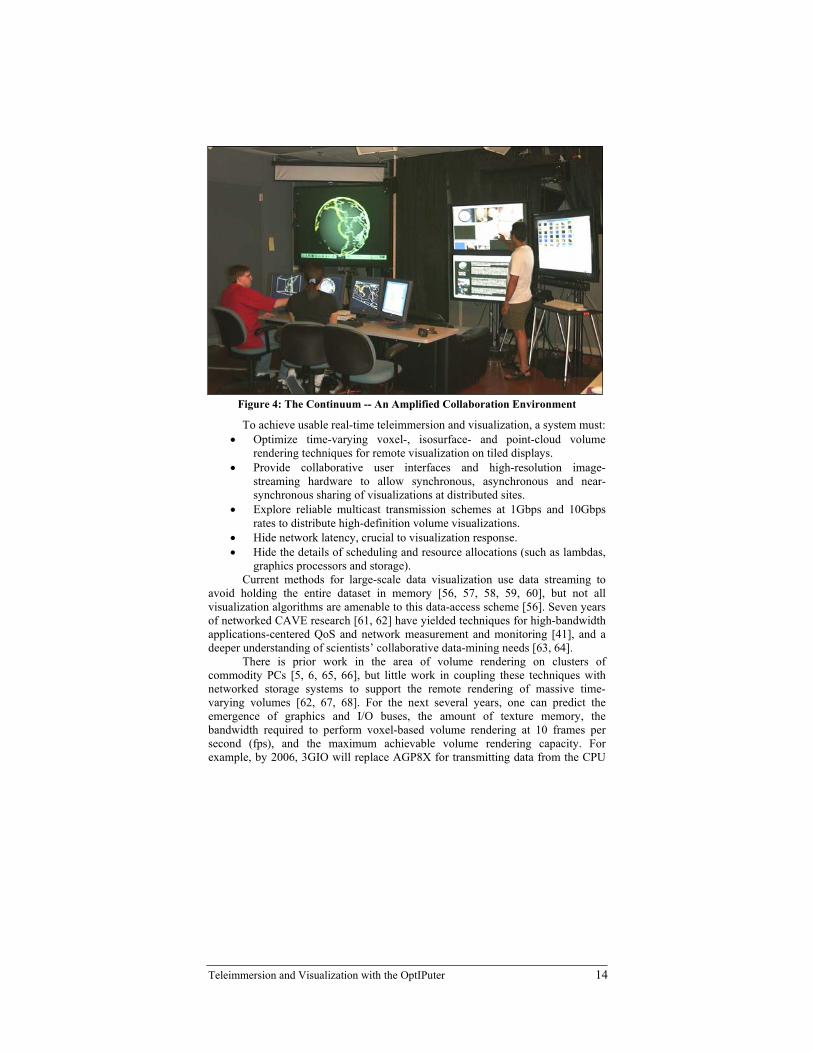
Amplified Collaboration Environments (ACEs) are physical meeting spaces that enable distantly located groups to work in intensive campaigns that are augmented by advanced collaboration, computation and visualization systems. One example of an ACE is the Continuum (Figure 4), located at EVL and at the Technology Research, Education and Commercialization Center (TRECC) in Du Page County, Illinois [51, 52]. ACEs are based on the concept of a War Room or Project Room, which has been shown to double the productivity of collocated working teams [53]. The goal of EVL’s Continuum is to provide the same, if not greater, benefits for distributed teams. To this end, the Continuum integrates a broad range of technologies that include: multi-party video conferencing (via the AccessGrid [54]), electronic touch screens (for intuitive shared white boards), passive stereoscopic displays (such as the GeoWall, for displaying datasets in true 3D [55]), high-resolution tiled displays (for displaying large visualizations or mosaics of visualizations) and personal digital assistants (PDAs) and laptops for wireless control of these systems. Taken as a whole, each of these systems requires one or more computers to support. Hence, a full Continuum requires a compute cluster per site, connected to other computing clusters that house the potentially massive datasets being shared in the collaborative environment.
Teleimmersion and Visualization with the OptIPuter 14
Figure 4: The Continuum -- An Amplified Collaboration Environment
To achieve usable real-time teleimmersion and visualization, a system must: • Optimize time-varying voxel-, isosurface- and point-cloud volume
rendering techniques for remote visualization on tiled displays. • Provide collaborative user interfaces and high-resolution image-
streaming hardware to allow synchronous, asynchronous and near-synchronous sharing of visualizations at distributed sites.
• Explore reliable multicast transmission schemes at 1Gbps and 10Gbps rates to distribute high-definition volume visualizations.
• Hide network latency, crucial to visualization response. • Hide the details of scheduling and resource allocations (such as lambdas,
graphics processors and storage). Current methods for large-scale data visualization use data streaming to
avoid holding the entire dataset in memory [56, 57, 58, 59, 60], but not all visualization algorithms are amenable to this data-access scheme [56]. Seven years of networked CAVE research [61, 62] have yielded techniques for high-bandwidth applications-centered QoS and network measurement and monitoring [41], and a deeper understanding of scientists’ collaborative data-mining needs [63, 64].
There is prior work in the area of volume rendering on clusters of commodity PCs [5, 6, 65, 66], but little work in coupling these techniques with networked storage systems to support the remote rendering of massive time-varying volumes [62, 67, 68]. For the next several years, one can predict the emergence of graphics and I/O buses, the amount of texture memory, the bandwidth required to perform voxel-based volume rendering at 10 frames per second (fps), and the maximum achievable volume rendering capacity. For example, by 2006, 3GIO will replace AGP8X for transmitting data from the CPU

Teleimmersion and Visualization with the OptIPuter 15
to the graphics adapter. By then, it is expected that graphics cards will have 1GB of RAM. In 2006, InfiniBand 12X may be the primary means for processor-to-processor communication within a cluster. These advances imply that in 2006, the OptIPuter will most likely render a volume of 1788x894x892 at 10fps.
The OptIPuter supports three types of teleimmersion: (1) small groups of people working together in a Think Room [69] with electronic media, such as video conferencing, immersive displays, tiled displays, digital white boards and wireless computing devices; (2) working together over distance where distributed rooms are tied together by lambdas; and, (3) people working asynchronously to generate results later shared in synchronous collaborative sessions.
In the first case, OptIPuter visualizations are viewed on tiled displays with user interfaces enabling collaborating scientists to simultaneously create visualizations and post them on one or more tiles of the display [77]. In the second case, the visualizations are directed to more than one site simultaneously; the OptIPuter’s bandwidth and multicast are used for display distribution, allowing the OptIPuter’s graphics rendering system to work at full rate to broadcast visuals to viewers [70]. Hardest to achieve is the third case. Collaborative work is largely asynchronous, punctuated by periods of synchronous activity when results are brought together for common review [53]. In the context of the OptIPuter, scientists either store their visualizations or the parameters that created them, in which case the OptIPuter resources that created the visualizations must also be noted so that they can be automatically re-scheduled and re-allocated for a synchronous collaboration session. The OptIPuter’s TeraVision system allows it to reliably stream and multicast multiple gigabits of high-resolution tiled visualizations to collaborating scientists [70]. 5.2 TeraVision
TeraVision is a way to transmit and remotely display motion graphics or high-definition video over gigabit networks. A basic TeraVision system consists of a PC server with commodity video capture hardware for grabbing high-resolution VGA or DVI inputs, and a PC client that can receive these streams and display them at various resolutions. The client does not require any specialized hardware for displaying the incoming video streams; it needs video capture hardware if and only if it has to act as a video server during a collaborative session. TeraVision is designed to be as easy to use as hooking up a laptop to a projector, something nearly anyone can do nowadays. Two TeraVision servers can be used together to stream stereo imagery to multiple client sites. The two streams (left-eye and right-eye high-resolution video) are synchronized during capture on the servers and then synchronized again on the clients before being sent to the display. Similarly, multiple TeraVision boxes can be used for streaming the component video streams of a tiled display; all the servers synchronize with each other to capture the component streams, and the clients synchronize before displaying all the component streams simultaneously.
Teleimmersion and Visualization with the OptIPuter 16
5.3 TeraScope and LambdaRAM
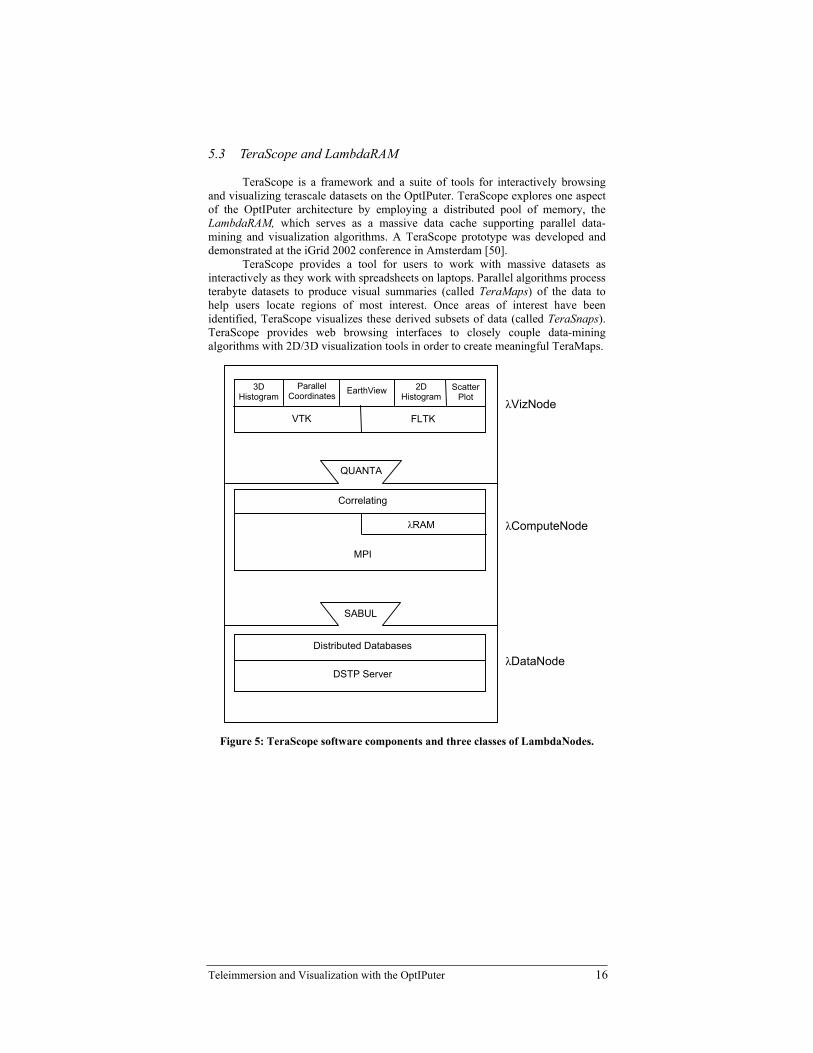
TeraScope is a framework and a suite of tools for interactively browsing and visualizing terascale datasets on the OptIPuter. TeraScope explores one aspect of the OptIPuter architecture by employing a distributed pool of memory, the LambdaRAM, which serves as a massive data cache supporting parallel data-mining and visualization algorithms. A TeraScope prototype was developed and demonstrated at the iGrid 2002 conference in Amsterdam [50].
TeraScope provides a tool for users to work with massive datasets as interactively as they work with spreadsheets on laptops. Parallel algorithms process terabyte datasets to produce visual summaries (called TeraMaps) of the data to help users locate regions of most interest. Once areas of interest have been identified, TeraScope visualizes these derived subsets of data (called TeraSnaps). TeraScope provides web browsing interfaces to closely couple data-mining algorithms with 2D/3D visualization tools in order to create meaningful TeraMaps.
Figure 5: TeraScope software components and three classes of LambdaNodes.
2D Histogram
Scatter Plot
EarthView Parallel Coordinates
3D Histogram
VTK FLTK λVizNode
QUANTA
Correlating
λRAM
MPI
λComputeNode
SABUL
Distributed Databases
DSTP Server λDataNode

Teleimmersion and Visualization with the OptIPuter 17
Figure 5 illustrates three classes of LambdaNodes, all connected using gigabit networks. The LambdaDataNode is primarily a cluster with large RAIDed disks. The LambdaComputeNode is a cluster with large amounts of physical memory and multiple CPUs. The LambdaVisualizationNode is a cluster with high-end commodity graphics cards (such as the Nvidia Geforce 4Ti). All network links are presently 1Gbps.
Just as the caches in a CPU are used to overcome slow data rates and high latencies between RAM and CPU, LambdaRAM performs the same functions in the OptIPuter using metropolitan and international networks.
The LambdaDataNodes are Project Data Space clusters [71]. Project Data Space provides the software infrastructure that allows researchers to publish data on the Web in the same way they publish documents; its Data Space Transport Protocol (DSTP) is analogous to HTTP for the Web [72]. Data retrieved from DSTP servers are streamed at the maximum capacity of the network using an aggressive data transmission scheme called SABUL (Simple Available Bandwidth Utilization Library) [73], which is based on enhancing UDP with negative acknowledgments to provide reliable data transmission. 5.4 TeraScope on the OptIPuter
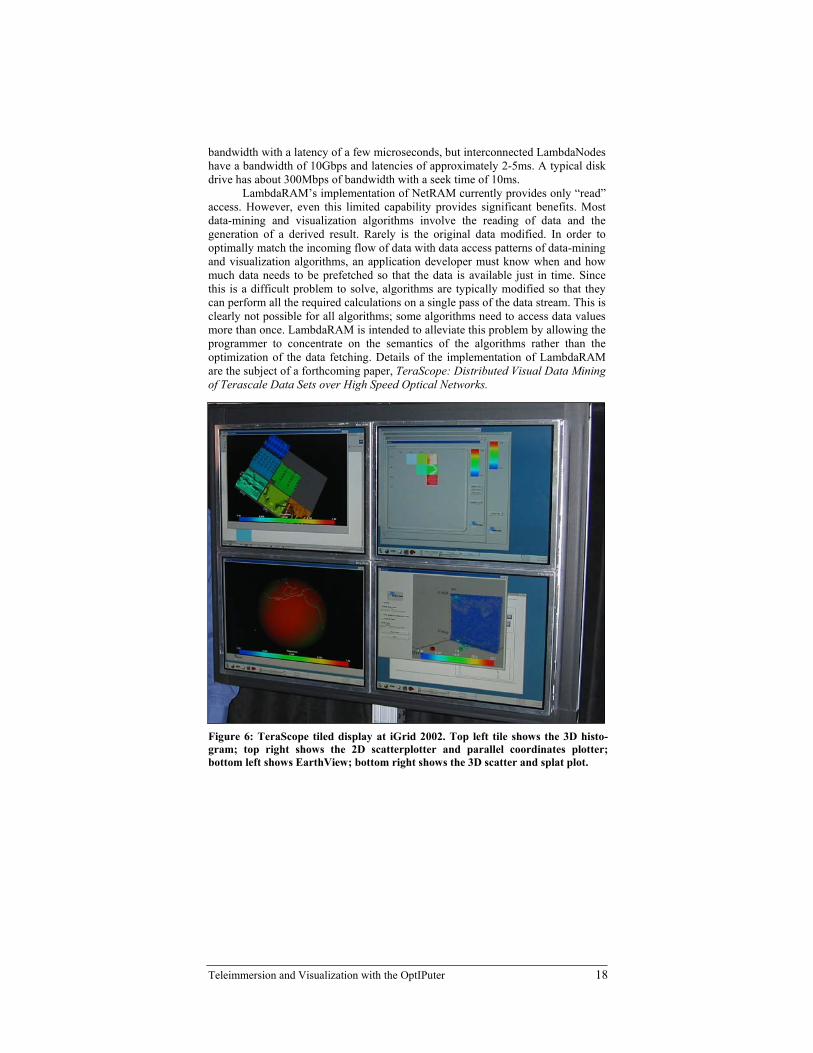
The LambdaVisualizationNode is connected to a tiled display (Figure 6). TeraScope allows the results of a particular query to be displayed on any one of the screens of a tiled display, creating display mosaics so the user can view several visualizations simultaneously, as well as a single high-resolution image.
Using a Web browser, the user submits a query to TeraScope, which then decomposes the query and sends it to multiple nodes on the LambdaComputeNode cluster. Residing on this cluster is a program to perform data-mining operations. For example, the cluster can perform Pearson’s Correlation calculation over all the attributes of the data to rank the correlatedness of pairs of attributes in a multidimensional dataset; to do so, each of the cluster’s nodes sends parallel queries to remote DSTP servers, which in return, streams the subset of the query results back. These subsets are stored in LambdaRAM; the data-mining engine works from the local copy on LambdaRAM. The final results of the correlation are tallied up and sent back to the querying interface that loads the reduced dataset and visualizes it on one of the tiles of the display. The Web interface also allows multiple visualizations to be produced simultaneously, in which case each of the LambdaVisualizationNodes that drives the tiled display receives a copy of the data to visualize it using one of several visualization tools.
LambdaRAM is based on the concept of Network Memory (NetRAM). Prior work in NetRAM mainly focused on LAN or system-area networks because there has never before been sufficient bandwidth over a WAN to carry data from memory to memory at rates close to memory access rates [73]. The OptIPuter’s high-speed optical network makes NetRAM over wide areas practical. For comparison, a cluster network using Myrinet can have as much as a gigabit of
Teleimmersion and Visualization with the OptIPuter 18
bandwidth with a latency of a few microseconds, but interconnected LambdaNodes have a bandwidth of 10Gbps and latencies of approximately 2-5ms. A typical disk drive has about 300Mbps of bandwidth with a seek time of 10ms.
LambdaRAM’s implementation of NetRAM currently provides only “read” access. However, even this limited capability provides significant benefits. Most data-mining and visualization algorithms involve the reading of data and the generation of a derived result. Rarely is the original data modified. In order to optimally match the incoming flow of data with data access patterns of data-mining and visualization algorithms, an application developer must know when and how much data needs to be prefetched so that the data is available just in time. Since this is a difficult problem to solve, algorithms are typically modified so that they can perform all the required calculations on a single pass of the data stream. This is clearly not possible for all algorithms; some algorithms need to access data values more than once. LambdaRAM is intended to alleviate this problem by allowing the programmer to concentrate on the semantics of the algorithms rather than the optimization of the data fetching. Details of the implementation of LambdaRAM are the subject of a forthcoming paper, TeraScope: Distributed Visual Data Mining of Terascale Data Sets over High Speed Optical Networks.
Figure 6: TeraScope tiled display at iGrid 2002. Top left tile shows the 3D histo-gram; top right shows the 2D scatterplotter and parallel coordinates plotter; bottom left shows EarthView; bottom right shows the 3D scatter and splat plot.

Teleimmersion and Visualization with the OptIPuter 19
5.5 TeraScope Visualization Tools
Figure 7: 3D histogram of atmospheric data from the US National Center for Atmospheric Research. Red means there is a high correlation between two attributes along the X and Y axes. The height of the terrain means there are a large number of samples at that particular location in the dataset.
Terascope consists of a variety of information visualization tools that are capable of producing meaningful visual summaries of the data (TeraMaps) from which relevant subsets (TeraSnaps) can be visualized on modest systems. The fast derivation of TeraMaps requires the multi-processor power of an OptIPuter.
• 2D Scatterplot and Parallel Coordinates make use of the Pearson Correlation calculation to color code a 2D scatterplot. Furthermore, the correlation function is used to prioritize the set of attributes that should be placed next to each other in a parallel coordinate plot, which helps untangle the many lines that cross parallel coordinate diagrams.
• 3D Scatterplot – Given four attributes (x, y, z and a scalar attribute), this tool produces both a scatterplot and splat plot highlighting the areas of greatest data concentration.
• 3D Histogram traverses all the requested data points and computes a

Teleimmersion and Visualization with the OptIPuter 20
correlation value between every pair of attributes (Pearson Correlation) in a multidimensional dataset. The correlation is then used to color code an overview map of the dataset, a collection of 3D histograms that shows the relationship of one attribute to another. (Figure 7)
• EarthView – This is analogous to a 2D scatterplot except that the scalar values are plotted on a sphere.
Work is underway now to benchmark TeraScope to determine how much time it takes for each phase of the process (from data retrieval to visualization), and to determine the effectiveness of LambdaRAM. 5.6 Autostereo on Tiled OptIPuter Displays
The CAVE was the first widely adopted stereo tiled display driven by multiple processors; other large-format multi-projector display walls are also commercially available. For stereo, displays generally require the user to wear polarized or shutter glasses, but these are not welcomed in office or lab environments.
Autostereo is a class of techniques that enables humans to see visual stereo without relying on special glasses. In the barrier-strip method, a left-eye and a right-eye image are generated and interleaved and a barrier-strip screen positioned in front of the image separates the images appropriately for viewing; one’s brain fuses the two images into a 3D picture. In the mid-1980s, EVL and (Art)n Laboratory developed computer-generated autostereo static images using high-resolution printing techniques. The prints provided stable images at the ~10,000-pixel horizontal resolution needed to achieve good 3D fidelity. Generically known as barrier-strip autostereograms, (Art)n Laboratory refers to its implementation as phscolograms [74].
Barrier-strip techniques capture images of a scene from a predetermined set of viewpoints and interleave them as vertical strips. This interleaved image is bonded to one side of a sheet of clear plastic, and a line screen is attached to the other. The resulting image sandwich is backlit by fluorescent tubes in a light box. The viewer sees the stereo image through the slits of a line-screen space, each eye receiving a different image in correct stereo. An essentially equivalent technique is to employ vertical cylindrical lenses like those used in 3D postcards. These lenticular screens are more difficult and expensive to produce for large images, although they are much more light efficient. The line screen is the pinhole version of the lenticular screen, so to speak, and we consider them to be interchangeable from a technical discussion point of view. Most people have seen barrier-strip autostereograms in public places, and they are somewhat akin to lenticular 3D postcards, although the latter are not back-lit.
Computer CRT-based monitors and projectors do not have enough resolution or image stability for usable barrier-strip autostereography, but the newer displays (LCD and plasma panels) are suitably stable digital devices. LCD barrier-strip techniques have been demonstrated [75]; they work just like the
Teleimmersion and Visualization with the OptIPuter 21
printed versions, but the image can be changed electronically. However, in both the print and digital cases to date, the user is not tracked, and the angle of view is small, so immersion is very limited. The Varrier approach [76], described below, trades resolution for stereo, but, given multi-screen tiling techniques, high resolution is still achievable. Not specifically addressed by Varrier is the problem of borders around current display devices since the market will eventually create a solution to this packaging problem. Several companies now make 2x2 arrays without internal borders; Varrier and the rest of the visualization community would benefit greatly from the availability of borderless NxM arrays.
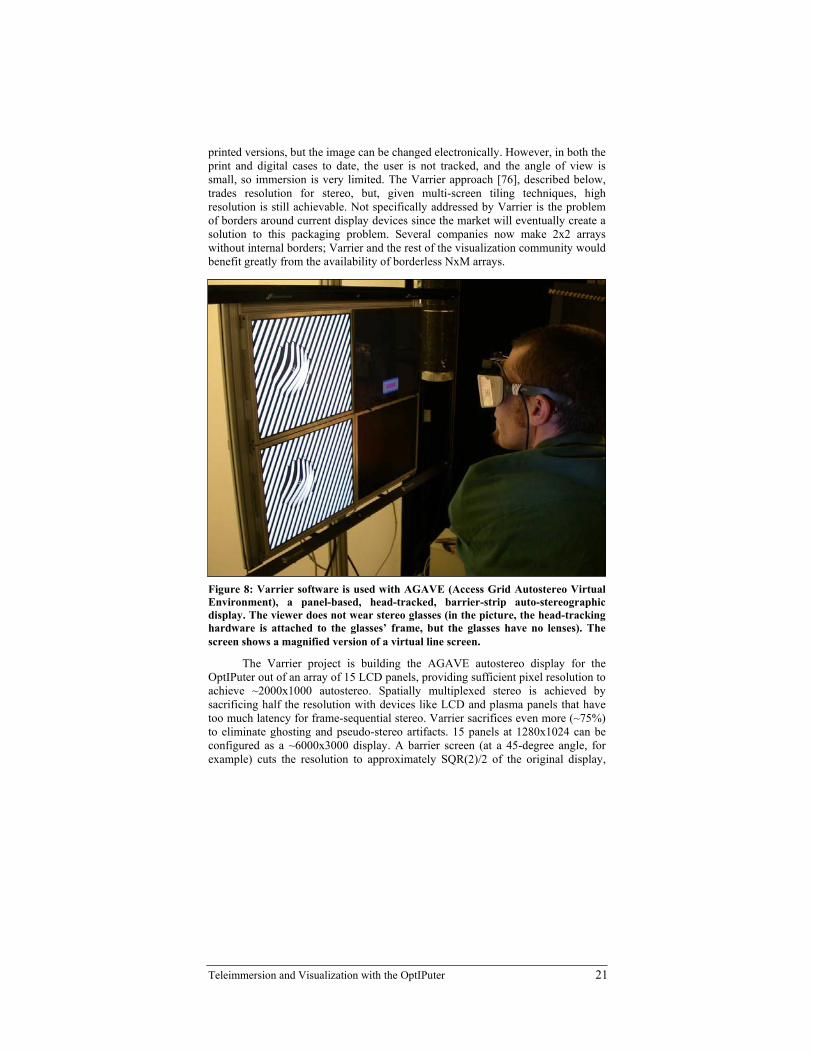
Figure 8: Varrier software is used with AGAVE (Access Grid Autostereo Virtual Environment), a panel-based, head-tracked, barrier-strip auto-stereographic display. The viewer does not wear stereo glasses (in the picture, the head-tracking hardware is attached to the glasses’ frame, but the glasses have no lenses). The screen shows a magnified version of a virtual line screen.
The Varrier project is building the AGAVE autostereo display for the OptIPuter out of an array of 15 LCD panels, providing sufficient pixel resolution to achieve ~2000x1000 autostereo. Spatially multiplexed stereo is achieved by sacrificing half the resolution with devices like LCD and plasma panels that have too much latency for frame-sequential stereo. Varrier sacrifices even more (~75%) to eliminate ghosting and pseudo-stereo artifacts. 15 panels at 1280x1024 can be configured as a ~6000x3000 display. A barrier screen (at a 45-degree angle, for example) cuts the resolution to approximately SQR(2)/2 of the original display,
Teleimmersion and Visualization with the OptIPuter 22
hence the ~2000x1000 resulting image. Panels are particularly desirable display devices for laptops and offices
because they are flat and self-illuminating. This makes them particularly usable in compact VR installations since there is no projection distance involved. (Autostereo without tracking on monitors has been around for more than 10 years. However, immersion benefits greatly from user-tracked, real-time, 3D graphics and a wide angle of view. Small-screen, non-tracked stereo is mostly unhelpful in the lab and unsuccessful in the marketplace.)
Varrier depends on real-time interleaved image generation driven by dynamic tracking of the user’s viewpoint. (Since the interleaved scene is varied with tracking, the term Varrier was coined.) It interleaves the perspective projections of the left and right eye in the computed image rather than sorting them into strips and printing them onto film or displaying them on a panel. When doing the projections of a scene from a user’s point of view, the technique integrates the line screen in the scene and displays the resulting image on the projection plane for each eye. An interleaved picture on the screen can thus be viewed without glasses through a barrier strip attached to the panel, as shown in Figure 8. This display is suitable for only one accurately tracked person at a time. Multiple people in the same space could conceivably use separate sections of a large AGAVE display, assuming each was tracked. Teleimmersion over distance can be straightforwardly achieved with multiple AGAVE displays.
The sole hardware modification needed for AGAVE panel arrays is the strategic placement of photographically produced line screens. Thus, a non-stereo OptIPuter-driven display can be transformed into a teleimmersion system that fits in an office by snapping in line screens. A variant of PARIS that uses Varrier technology is planned so that augmented reality can be supported. 6. Conclusion
The OptIPuter is a complex project that seeks to dramatically advance the capabilities of visualization and teleimmersion through coordinated parallelized networking, storage, computing and visualization technologies. The OptIPuter relies on relatively inexpensive component visualization parts, modest computer clusters, appropriate remote data mining and computing and extreme enough bandwidth to allow the user to favor other resources than networking. This is not to say, however, that networking is not the hardest part or that procuring the network bandwidth alone is sufficient or trivial; making the bandwidth work in the context of the OptIPuter involves the scheduling of lambdas on the fly, doable if and only if the OptIPuter middleware owns a suitable amount of networking. Bandwidth is fortunately getting cheaper much faster than disk space, which is getting cheaper faster than computers, which are, of course, cheaper than people. Teleimmersive applications that can help save lives, help monitor and improve the environment, create new products and services, and assist in disaster response justify wider bandwidth utilization and improvements in visualization, storage and computing.
Teleimmersion and Visualization with the OptIPuter 23
7. Acknowledgments
The virtual reality and advanced networking research, collaborations and outreach programs at the Electronic Visualization Laboratory (EVL) at the University of Illinois at Chicago are made possible by major funding from the National Science Foundation (NSF), awards EIA-9802090, EIA-0115809, ANI-9980480, ANI-0229642, ANI-9730202, ANI-0123399, ANI-0129527 and EAR-0218918, as well as the NSF Partnerships for Advanced Computational Infrastructure (PACI) cooperative agreement (ACI-9619019) to the National Computational Science Alliance. EVL also receives funding from the US Department of Energy ASCI VIEWS program. In addition, EVL receives funding from the State of Illinois, Microsoft Research, General Motors Research and Pacific Interface on behalf of NTT Optical Network Systems Laboratory in Japan.
The University of California, San Diego (UCSD) and the University of Illinois at Chicago (UIC), with the University of Southern California (USC), the University of California, Irvine (UCI), Northwestern University (NU) and San Diego State University (SDSU) are collaborating institutions under the NSF Information Technology Research (ITR) Cooperative Agreement (ANI-0225642) to UCSD for The OptIPuter.
Overall OptIPuter management is provided by principal investigator Larry Smarr (Cal-(IT)2/UCSD), co-principal investigators Tom DeFanti (UIC), Mark Ellisman (UCSD), Jason Leigh (UIC) and Phil Papdopoulos (Cal-(IT)2 and SDSC), and project manager Maxine Brown (UIC). Research teams have been formed in networking [Joe Bannister (USC), Shaya Fainman (UCSD), Sadik Esener (UCSD), Ron Graham (UCSD), Oliver Yu (UIC), Joe Mambretti (NU)]; clusters and storage [Philip Papadopoulos (Cal-(IT)2 and SDSC), Paul Siegel (UCSD), Phil Andrews (SDSC)]; software systems, middleware, data and security [Andrew Chien (UCSD), Carl Kesselman (USC), Kane Kim (UCI), Bob Grossman (UIC), Padhraic Smyth (UCI), Sid Karin (UCSD), Michael Goodrich (UCI), Valerie Taylor (NU)]; visualization and collaboration [Jason Leigh (UIC), Sheldon Brown (UCSD), Marcus Thiébaux (USC)]; applications [Mark Ellisman (UCSD), John Orcutt (UCSD), Graham Kent (UCSD), Eric Frost (SDSU)]; and education [Tom Moher (UIC), Gabriele Wienhausen (UCSD), Rozeanne Steckler (SDSC)].
CAVE and ImmersaDesk are registered trademarks of the Board of Trustees of the University of Illinois. PARIS, GeoWall, Varrier and AGAVE are trademarks of the Board of Trustees of the University of Illinois. STAR TAP and StarLight are service marks of the Board of Trustees of the University of Illinois.

Teleimmersion and Visualization with the OptIPuter 24
8. References [1] http://www.startap.net/starlight, http://www.iwire.org, http://www.cenic.net,
http://www.calit2.net [2] http://www.teragrid.org [3] http://www.evl.uic.edu [4] R.L. Grossman and A. Turinsky, “A Framework for Finding Distributed
Data Mining Strategies That Are Intermediate Between Centralized Strategies and In-Place Strategies,” KDD 2000 Workshop on Distributed Data Mining, 2001.
[5] C. Rezk-Salama, K.Engel, M. Bauer, G. Greiner and T. Ertl, “Interactive Volume Rendering on Standard PC Graphics Hardware Using Multi-Textures and Multi-Stage Rasterization,” SIGGRAPH/Eurographics Workshop on Graphics Hardware 2000, ACM SIGGRAPH, 2000, <http://wwwvis.informatik.uni-stuttgart.de/eng/research/fields/current/pcvolvis>.
[6] Joe Kniss, Gordon Kindlmann and Charles Hansen, “Interactive Volume Rendering Using Multi-Dimensional Transfer Functions and Direct Manipulation Widgets,” IEEE Visualization 2001.
[7] http://www.InfiniBandta.org/home [8] Steve Wallach, “Petaflops in the Year 2009,” SC’2000 keynote
presentation, 2000, <http://www.sc2000.org, http://www.tgc.com/freehpc/65195.html>
[9] Gary Stix, “Triumph of the Light,” Scientific American, January 2001, <http://www.sciam.com/2001/0101issue/0101stix.html>
[10] E. Grochowski, “IBM Magnetic Hard Disk Drive Technology,” 2001, <http://www.storage.ibm.com/hdd/technolo/grochows/grocho01.htm>
[11] M. David Stone, “Future Storage: The View from 2001,” ExtremeTech, October 31, 2001.
[12] Roger Wood, “Recording Technologies for Terabit per square inch Systems,” First North American Perpendicular Magnetic Recording Conference, Coral Gables, Florida, Jan. 7-9, 2002.
[13] M. Mallary, A. Torabi, M. Benakli, “1 Tb/in2 Perpendicular Recording Conceptual Design,” First North American Perpendicular Magnetic Recording Conference, Coral Gables, Florida, January 7-9, 2002.
[14] National Storage Industry Consortium (NSIC) <http://www.nsic.org>. [15] U. Fayyad and P. Smyth, “Cataloging and Mining Massive Databases for
Science Data Analysis,” Journal of Computational Graphics and Statistics, Vol. 8, No. 3, 1999, pp. 589-610.
[16] WInSAR Archive at SIO, 2000 <http://topex.ucsd.edu/SAR/sar.html, http://www.winsar.scec.org>
[17] J.-B. Minter, Earth Change and Hazard Observatory (ECHO), a proposal to NASA Earth Systems Science Pathfinder Program at NASA and Geosciences at NSF, 1999.
[18] Larry Peterson and Bruce Davie, Computer Networks: A Systems

Teleimmersion and Visualization with the OptIPuter 25
Approach, 2nd Edition, Morgan-Kaufmann, 1999. [19] Marshall K. McKusick, William N. Joy, Samuel J. Leffler and Robert S.
Fabry, “A Fast File System for UNIX. ACM Transactions on Computer Systems,” Vol. 2, No. 3, 1984, pp. 181-197.
[20] David Solomon and Mark Russinovich, Inside Microsoft Windows 2000, Third Edition, Microsoft Press, 2000.
[21] Scott Pakin, Mario Lauria and Andrew A. Chien, “High Performance Messaging on Workstations: Illinois Fast Messages (FM) for Myrinet,” IEEE Conference on Supercomputing, 1995.
[22] Mario Lauria and Andrew A. Chien, “MPI-FM: High Performance MPI on Workstation Clusters,” Journal of Parallel and Distributed Computing, Vol. 40, No. 1, 1997, pp. 4-18.
[23] A. Chien, M. Lauria, R. Pennington, M. Showerman, G. Iannello, M. Buchanan, K. Connelly, L. Giannini, G. Koenig, S. Krishnamurthy, Q. Liu, S. Pakin, and G. Sampemane, “Design and Evaluation of an HPVM-based Windows NT Supercomputer,” The International Journal of High-Performance Computing Applications, Vol. 13, No. 3, Fall 1999, pp. 201-219.
[24] David E. Culler, “High Performance Clusters: State of the Art and Challenges Ahead,” ACM Conference on Principles of Distributed Computing, 1998.
[25] Frederick C. Wong, Andrea C. Arpaci-Dusseau and David E. Culler, “Building MPI for Multi-Programming Systems Using Implicit Information,” PVM/MPI, 1999, pp. 215-222.
[26] Alan M. Mainwaring and David E. Culler, “Design Challenges of Virtual Networks: Fast, General-Purpose Communication,” PPOPP, 1999, pp. 119-130.
[27] Thorsten von Eicken, Werner Vogels, “Evolution of the Virtual Interface Architecture,” IEEE Computer, Vol. 31, No. 11, 1998, pp. 61-68.
[28] Virtual Interface Architecture, a standard user-level networking infrastructure, 1999, <http://www.viarch.org>.
[29] <http://www.infinibandta.org/home> [30] Y. Zhou, et. al., “Thread Scheduling for Out-of-Core Applications with
Memory Server on Multicomputers,” IOPADS ‘99, 1999. [31] L. Xiao, et. al., “Incorporating Job Migration and Network RAM to Share
Cluster Memory Resources,” Proceedings of the Ninth IEEE International Symposium on High-Performance Distributed Computing (HPDC-9), 2000.
[32] D. Comer and J. Griffioen, “A New Design for Distributed Systems: The Remote Memory Model,” Proceedings of the 1990 Summer USENIX Conference, 1990.
[33] E.P. Markatos, et. al., “Implementation and Evaluation of a Remote Memory Pager,” Institute of Computer Science, Foundation for Research & Technology―Hellas, Technical Report FORTH/ICS 129, Greece, 1995.
[34] M.J. Feeley, et. al., “Implementing Global Memory Management in a Workstation Cluster,” Proceedings of the Symposium on Operating Systems Principles, 1995.
Teleimmersion and Visualization with the OptIPuter 26
[35] I. McDonald, “Remote Paging in a Single Address Space Operating System supporting Quality of Service,” Technical Report, Department of Computer Science, University of Glasgow, Scotland, UK, 1999.
[36] George Gilder, TELECOSM: How Infinite Bandwidth will Revolutionize Our World, Free Press, September 2000, ISBN: 0-684-80930-3.
[37] Gregory D. Buzzard, David Jacobson, Milon Mackey, Scott Marovich and John Wilkes, “An Implementation of the Hamlyn Sender-Managed Interface Architecture,” OSDI, 1996, pp. 245-259.
[38] W.R. Stevens, TCP/IP Illustrated, Vol. 1, Addison Wesley, 1994, pp. 344-350.
[39] Sivakumar Harinath, Data Management Support for Distributed Data Mining of Large Datasets over High Speed Wide Area Networks, PhD Thesis, Department of Mathematics, Statistics and Computer Science, University of Illinois at Chicago, 2002.
[40] <http://www.indiana.edu/~anml/anmlresearch.html>. [41] Jason Leigh, Oliver Yu, Dan Schonfeld, Rashid Ansari, Eric He, Atul
Nayak, Jinghua Ge, Naveen Krishnapasad, Kyoung Park, Yong-joo Cho, Liujia Hu, Ray Fang, Alan Verlo, Linda Winkler, Thomas DeFanti, “Adaptive Networking for Tele-Immersion,” Proc. of the 5th Immersive Projection Technology/ 7th Eurographics Virtual Environments Conference (IPT/EGVE), May 16-18, 2001, Stuttgart, Germany, pp.199-208.
[42] C. Cruz-Neira, D. Sandin, T.A. DeFanti, “Virtual Reality: The Design and Implementation of the CAVE,” Proc. SIGGRAPH 93 Computer Graphics Conference, August 1993, ACM SIGGRAPH, pp. 135-142.
[43] J. Leigh, T. A. DeFanti, A. Johnson, M. Brown, D. Sandin, “Global Tele-Immersion: Better than Being There,” Proc. 7th International Conference on Artificial Reality and Tele-Existence, Tokyo, Japan, Dec 1997, pp. 10-17.
[44] K. Park, Y. Cho, N. Krishnaprasad, C. Scharver, M. Lewis, J. Leigh, A. Johnson, “CAVERNsoft G2: A Toolkit for High Performance Tele-Immersive Collaboration,” Proceedings of the ACM Symposium on Virtual Reality Software and Technology 2000, October 22-25, 2000, Seoul, Korea, pp. 8-15.
[45] E. He, J. Leigh, O. Yu, T. DeFanti, “Reliable Blast UDP: Predictable High Performance Bulk Data Transfer,” Proc. IEEE Cluster Computing 2002, Chicago, Illinois, Sep, 2002.
[46] <http://dast.nlanr.net/Projects/Iperf/>. [47] <http://netperf.org/netperf/NetperfPage.html>. [48] T. DeFanti, I. Foster, M. Papka, R. Stevens, and T. Kuhfuss, “Overview of
the I-WAY: Wide area visual supercomputing,” International Journal of Supercomputer Applications and High Performance Computing, Vol. 10, No. 2/3, Summer/Fall 1996.
[49] M. Brown, T. DeFanti, M. McRobbie, A. Verlo, D. Plepys, D.F. McMullen, K. Adams, J. Leigh, A. Johnson, I. Foster, C. Kesselman, A. Schmidt, S. Goldstein, “The International Grid (iGrid): Empowering Global Research Community Networking Using High Performance International Internet Services,” INET ‘99, San Jose, June 22-25, 1998, San Jose, California.
Teleimmersion and Visualization with the OptIPuter 27
[50] <http://www.igrid2002.org> [51] <http://www.evl.uic.edu/cavern/continuum/indexmain.html> [52] <http://www.trecc.org> [53] J.S. Olson, L. Covi, E. Rocco, W.J. Miller and P. Allie, “A Room of Your
Own: What Would It Take to Help Remote Groups Work as Well as Collocated Groups?” (short paper), Conference on Human Factors in Computing Systems (CHI’98), 1998, pp. 279-280.
[54] <http://www-fp.mcs.anl.gov/fl/accessgrid/> [55] J. Leigh, G. Dawe, J. Talandis, E. He. S. Venkataraman, J. Ge, D. Sandin,
T.A. DeFanti, “AGAVE : Access Grid Augmented Virtual Environment,” Proc. AccessGrid Retreat, Argonne, Illinois, January 16, 2001.
[56] J. Ahrens, K. Brislawn, K. Martin, B. Geveci, C. Law, M. Papka, “Large-Scale Data Visualization Using Parallel Data Streaming,” IEEE Computer Graphics and Applications, Vol. 21, No. 4, 2001, pp. 34-41.
[57] M. Cox and D. Ellsworth, “Application-Controlled Demand Paging for Out-Of-Core Visualization,” Proceedings of IEEE Visualization 1997, ACM Press, New York, 1997, pp. 235-244.
[58] Y.J. Chiang, C.T. Silva, “Interactive Out-of-Core Isosurface Extraction,” Proc. IEEE Visualization 1998, ACM Press, New York, 1998, pp. 167-174.
[59] T.A. Funkhouser, et. al., “Database Management for Models Larger Than Main Memory,” Interactive Walkthrough of Large Geometric Databases, Course Notes 32, SIGGRAPH 95, ACM Press, New York, 1995.
[60] S.K. Ueng, K. Sikorski, K.-L. Ma, “Out-of-Core Stream-line Visualization on Large Unstructured Meshes,” IEEE Trans. Visualization and Computer Graphics, Vol. 3, No. 4, October-December 1997, pp. 370-380.
[61] Jason Leigh, Andy Johnson, Maxine Brown, Dan Sandin, Tom DeFanti, “Tele-Immersion: Collaborative Visualization in Immersive Environments,” IEEE Computer, December 1999, pp. 66-73.
[62] K. Park, A. Kapoor, J. Leigh, “Lessons Learned from Employing Multiple Perspectives In a Collaborative Virtual Environment for Visualizing Scientific Data,” Proceedings of ACM CVE 2000, San Francisco, CA, September 10-12, 2000, pp. 73-82.
[63] J. Leigh, A. Johnson, T. DeFanti, S. Bailey, R. Grossman, “ A Methodology for Supporting Collaborative Exploratory Analysis of Massive Data Sets in Tele-Immersive Environments,” 8th IEEE International Symposium on High Performance and Distributed Computing, Redondo Beach, California, Aug 3-6, 1999.
[64] N. Sawant, C. Scharver, J. Leigh, A. Johnson, G. Reinhart, E. Creel, S. Batchu, S. Bailey, R. Grossman, “The Tele-Immersive Data Explorer: A Distributed Architecture for Collaborative Interactive Visualization of Large Datasets,” 4th International Immersive Projection Technology Workshop, Ames, Iowa, June 19-20, 2000.
[65] Klaus Engel, Martin Kraus and Thomas Ertl, “High-Quality Pre-Integrated Volume Rendering Using Hardware-Accelerated Pixel Shading,” SIGGRAPH/Eurographics Workshop on Graphics Hardware 2001, ACM SIGGRAPH, 2001.
Teleimmersion and Visualization with the OptIPuter 28
[66] Joe Kniss, Patrick S. McCormick, Allen McPherson, James Ahrens, Jamie Painter, Alan Keahey and Charles Hansen, “Interactive Texture-Based Volume Rendering for Large Data Sets,” IEEE Computer Graphics and Applications, Vol. 21, No. 4, July/August 2001, pp. 52-61.
[67] W. Bethel, B. Tierney, J. Lee, D. Gunter and S. Lau, “Using High-Speed WANs and Network Data Caches to Enable Remote and Distributed Visualization,” Supercomputing 2000 Proceedings, November 2000, CD-ROM.
[68] J. Leigh, T. DeFanti, et al. “Large-Scale Data Visualization in Tele-Immersive Environments,” Proceedings of the AT&T Visualization Days 2001 Forum, <http://www.visdays.com>, AT&T Florham Park, New Jersey, May 30-June 1, 2001.
[69] L.M. Covi, J.S. Olson, E. Rocco, “A Room of your Own: What do We Learn about Support of Teamwork from Assessing Teams in Dedicated Project Rooms?” In N. Streitz, S. Konomi, and H. J. Burkhardt (eds.) Cooperative Buildings, Amsterdam: Springer-Verlag, 1998, pp. 53-65.
[70] J. Leigh, J. Girado, R. Singh, A. Johnson, K. Park and T. DeFanti, “TeraVision: A Platform and Software Independent Solution for Real Time Display Distribution in Advanced Collaborative Environments,” Proceedings of the Access Grid Retreat, La Jolla, California, 2002.
[71] <http://www.dataspaceweb.org>. [72] S. Bailey, R.Grossman, S. Gutti and H. Sivakumar, “A High Performance
Implementation of the Data Space Transfer Protocol (DSTP),” Proceedings of the KDD 1999 Workshop on High Performance Data Mining, 1999.
[73] H. Sivakumar, R.L.Grossman, M. Mazzucco, Y. Pan, Q. Zhang, “Simple Available Bandwidth Utilization Library for High speed Wide Area Networks,” to be submitted to Journal of Supercomputing, 2002
[73] K. Li, “IVY: A Shared Virtual Memory System for Parallel Computing,” Proceedings of the International Conference on Parallel Processing, 1988
[74] D.J. Sandin, E., Sandor, W.T. Cunnally, M. Resch, T.A. DeFanti, M.D. Brown, “Computer-generated barrier-strip autostereography,” Proc. SPIE Vol. 1083, Three-Dimensional Visualization and Display Technologies, Scott S. Fisher; Woodrow E. Robbins; Eds., 1989, pp. 65-75.
[75] C. van Berkel, “Image Preparation for 3D-LCD,” Stereoscopic Displays and Virtual Reality Systems VI, SPIE Vol. 3639, 1999, pp. 84-91.
[76] Daniel J. Sandin, Todd Margolis, Greg Dawe, Jason Leigh, Thomas A. DeFanti, “The VarrierTM Auto-Stereographic Display,” Proceedings of Photonics West 2001: Electronics Imaging, SPIE, San Jose, CA, January 20-26, 2001, <http://spie.org/web/meetings/programs/pw01/home.html>.
[77] K. Park, A. Kapoor, J. Leigh, “Lessons Learned from Employing Multiple Perspectives In a Collaborative Virtual Environment for Visualizing Scientific Data,” Proceedings of ACM CVE 2000, San Francisco, CA, September 10-12, 2000, pp. 73-82.