Embed Size (px)
Citation preview

ANNOUNCES THE MANAGEMENT REPORT TRANSLATED INTO ENGLISH
April 03, 2002. (61 pages) For more information, contact:
Charles E. Allen TELESP, São Paulo, Brazil Tel.: (55-11) 3549-7200 Fax: (55-11) 3549-7202 [email protected] http://www.telefonica.net.br
(São Paulo - Brazil), (April 03, 2002) - The administration of Telecomunicações de São Paulo S.A. - Telesp hereby informs the shareholders: In accordance to the legal requirements and Company bylaws, the Management of TELECOMUNICAÇÕES DE SÃO PAULO S/A - TELESP submits the Business Report and Consolidated Financial Statements for the year ended on December 31, 2001, dully reviewed by the Independent Public Auditors and the Council Members. 1. Presentation The goal of achieving Anatel’s targets for December 2003 has always been one of the top priorities of the Company. Thus, in September 2001, two years and three months ahead of time, the Company announced the accomplishment of such targets. Therefore, Telesp became the first operator to file the corresponding documents, dully audited by independent auditors, in October 2001. The period of public consultation started in November and finished in December. Once the process is completed, Telesp will be allowed to request new authorizations to extend the services currently offered. During the year 2001, Telesp reached 1,198 LIS/employee, an outstanding efficiency indicator according to international levels. From the 12,616 thousand lines in service on December 31, 2001, more than 2,020 thousand lines were activated during the year, representing a 19% growth compared to last year. The local traffic reached 33,686 million of pulses, or a 12.5% increase in relation to year 2000. Likewise, a 7.36% increase in the intra-state traffic resulted in 13,729,606 thousand minutes, keeping the 75% market share. Telsp maintained high quality standards by using state-of-the-art technology, providing its customers with a wide range of additional services such as voice mail, conference, caller ID, etc. The company has already 4,815,759 customers that are using these intelligent line features. Market segmentation also allowed the company to offer
TELECOMUNICAÇÕES DE SÃO PAULO S.A. - TELESP

adequate products to the different and specific telecommunication needs, including the ADSL service, branded as Speedy. The growth experienced by Telesp was possible due to an investment of R$ 4.5 billion. It’s worth noting that the Telefónica Group, through its companies in Brazil, Telesp included, became the major foreign investor in the country. Telesp, the second largest private company in Brazil, paid during 2001 R$ 3.7 billion to the Federal, State and Local Governments in terms of taxes and contributions. Telesp, through Telefónica Foundation, contributed to improve the quality of life of the lower end of the population, exerting its social responsibility in two areas: education and social development. 2. Macroeconomic environment The year 2001, despite being affected by adverse external factors, showed an increase of the GDP estimated at 1.9%, while the growth for last year was 4.2%. The unemployment rate, estimated at 6.3% in 2001, will represent a decrease compared with the 7.8% registered last year. In spite of an evolution of 18.5% in the exchange rate between December 29, 2000 (R$ 1.9554) and December 31, 2001 (R$ 2.3105), the average inflation measured by the IGP-M (General Price Index – Market) was stable at 10.372% while the IGP-DI (General Price Index – Inflation Measurement), an important benchmark for the telecom industry, registered an increase of 10.402% during the year. The economic environment in 2002 will be influenced by the foreign economics, considering the world slowdown and the Argentine crisis. The Brazilian politic scenario will be hectic, with alliances and agreements, being made due to the presidential elections. The latest information published by the official entities state that the energetic situation would not cause the previously estimated impacts, since the possibility of a supply shortage is almost non-existent and possibilities of rationing are now weak, thus helping increase the productive activity and the employment level. Therefore, the perspectives point to a stable inflation, aided by the decrease in prices of fuel, and as a consequence, interest rates at similar levels to the current ones, with a downward trend and a positive economic growth rate.

3. Business Performance
MAIN STATISTICS OR INDICATORS 1995 1996 1997 1998 1999 2000 (**) 2001 (**) Installed Fixed Lines (*)
4,936,993 5,371,968 5,935,670 6,877,081 9,548,289 12,485,717 14,346,848
Lines in service (basic + ISDN)
4,480,634 4,994,771 5,428,612 6,247,558 8,049,213 10,361,409 12,282,863
Public Telephones
126,581 146,706 168,787 179,653 217,316 248,039
342,753
Number of local Pulses (registered) (***)
19,949 21,193 20,776 23,124 24,722 29,938 33,686
Penetration (LIS/100 inhab.)
14 15 17 19 24 29,4 33,8
% Digitalization of the local network
38 44 56
73 87 94 96
(*) Total in the installment phase (**) Ceterp Incorporated area is included (***) In million Basic Telephony In 2001, the fixed network of São Paulo State grew 15% with the addition of more than 2.0 million lines, reaching one of the highest line densities of South America: 33.8 telephones per 100 inhabitants. Anatel’s goal for the year 2001 (corresponding to 8.3 million installed lines) was largely surpassed.

453282
435514 564
434
941817
2.671
1.802
2.937
2.310
1.8611.921
-
300
600
900
1.200
1.500
1.800
2.100
2.400
2.700
3.000
1995 1996 1997 1998 1999 2000 2001
Gained lines (thousand)
Installed Lines Lines in Service (Basic+ISDN)
The public telephone network grew 38.19%, reaching 342,753 telephones, or 94,714 more than in 2000. Currently, 96.8% of Public Telephones (TUPs) use inductive cards. In addition, there are 1,073 pay phones using cellular technology and 2,359 use WLL technology. From the towns identified as “without STFC service”, 247 have now at least 1 TUP installed, available round the clock and capable of sending and receiving DLD and ILD calls. All the towns have at least 3 TUPs per 1,000 inhabitants. São Paulo is the State with the highest penetration rate of this service, with an average of 9.18 public telephones per 1,000 inhabitants.

127147
169180
217
248
343
-
50
100
150
200
250
300
350
400
1995 1996 1997 1998 1999 2000 2001
Public Telephones (thousand)
Telesp keeps promoting the installation of TUPs specially devised to be used by the hearing and speaking impaired. During 2001, 103 TDD (Telecommunications Device for the Deaf) equipment were installed, meaning a 245.2% increase compared to year 2000. Currently, 8,672 TUPs to deaf-mute people or the ones in need of wheelchairs are in use, representing a 46.65% increase compared to year 2000. The company achieved a higher level of quality. This improvement is proven by a decrease in reported malfunctions and by an increase in the speed to react to complaints. The said reduction is the product of a new collection system recently implemented. Billing complaints stabilized at lower levels (2.15 complaints per 1,000 bills issued). The mark that was reached by Telesp in December 2001 surpassed Anatel’s target (maximum 4.0).

3,03
2,76
3,253,48
3,73
3,32
3,583,78
3,26 3,23
2,34 2,31
-
0,50
1,00
1,50
2,00
2,50
3,00
3,50
4,00
JAN FEB MAR APR MAY JUN JUL AUG SEP OCT NOV DEC
Complaints per 100 STFC Accesses (2001)
94,00 94,0193,03
91,74
89,78
95,1594,04
96,39
91,96
84,12
95,90
97,96
80,00
85,00
90,00
95,00
100,00
JAN FEB MAR APR MAY JUN JUL AUG SEP OCT NOV DEC
Repair request attention rate (2001)

2,873,18
4,38
3,23
4,324,37
3,213,59
3,39 3,25
2,64
2,30
-
1,00
2,00
3,00
4,00
5,00
JAN FEB MAR APR MAY JUN JUL AUG SEP OCT NOV DEC
Complaints about billing errors per 100 issued bills
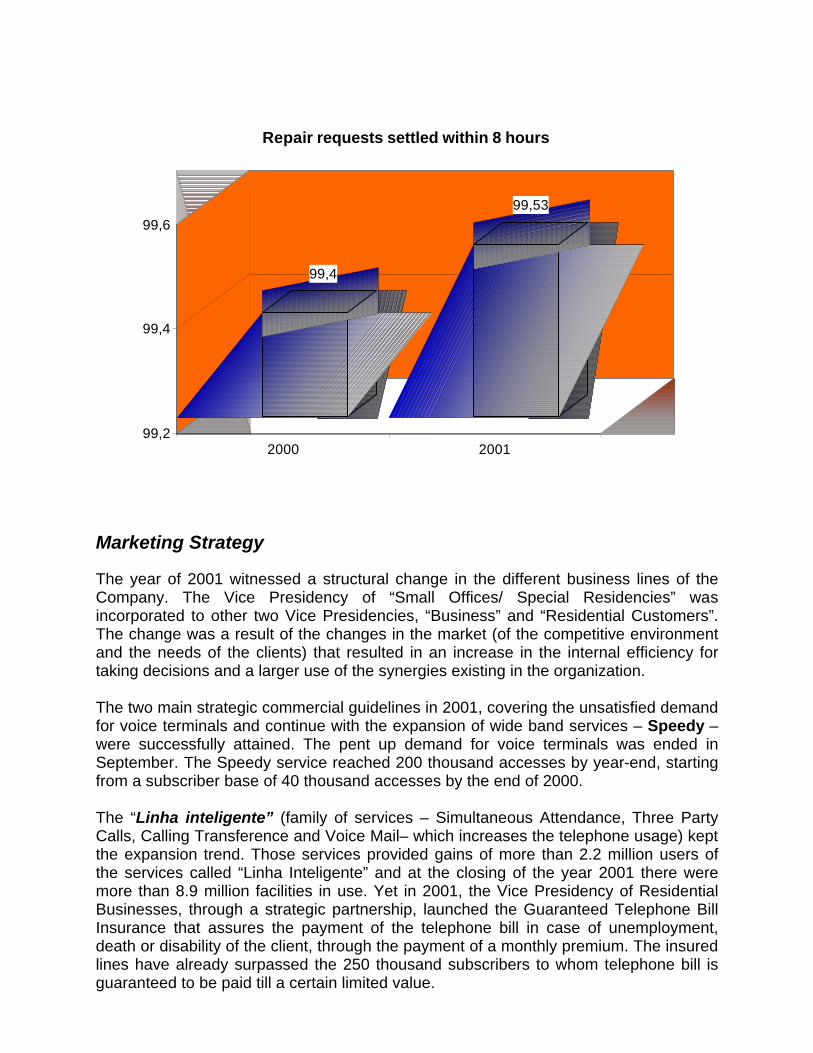
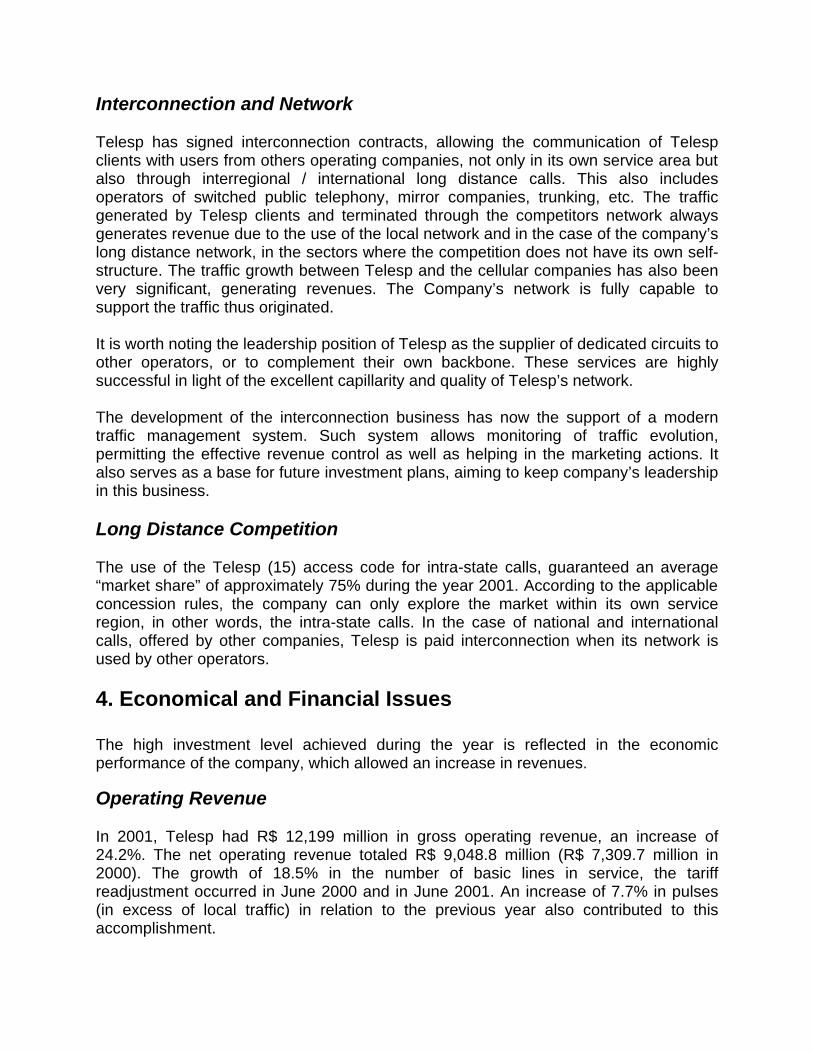
Public Telephony has also shown improvements in the quality of its services, surpassing Anatel’s goals for 2003 (maximum of 12 requests for repairs per 100 TUPs ) and a minimum of 96% of the repair requests attended to within 8 hours of the complaint.
11,18
9,13
0
4
8
12
2000 2001
TUP Repair requests per 100 TUPs
99,4
99,53
99,2
99,4
99,6
2000 2001
Repair requests settled within 8 hours
Marketing Strategy The year of 2001 witnessed a structural change in the different business lines of the Company. The Vice Presidency of “Small Offices/ Special Residencies” was incorporated to other two Vice Presidencies, “Business” and “Residential Customers”. The change was a result of the changes in the market (of the competitive environment and the needs of the clients) that resulted in an increase in the internal efficiency for taking decisions and a larger use of the synergies existing in the organization. The two main strategic commercial guidelines in 2001, covering the unsatisfied demand for voice terminals and continue with the expansion of wide band services – Speedy – were successfully attained. The pent up demand for voice terminals was ended in September. The Speedy service reached 200 thousand accesses by year-end, starting from a subscriber base of 40 thousand accesses by the end of 2000. The “Linha inteligente” (family of services – Simultaneous Attendance, Three Party Calls, Calling Transference and Voice Mail– which increases the telephone usage) kept the expansion trend. Those services provided gains of more than 2.2 million users of the services called “Linha Inteligente” and at the closing of the year 2001 there were more than 8.9 million facilities in use. Yet in 2001, the Vice Presidency of Residential Businesses, through a strategic partnership, launched the Guaranteed Telephone Bill Insurance that assures the payment of the telephone bill in case of unemployment, death or disability of the client, through the payment of a monthly premium. The insured lines have already surpassed the 250 thousand subscribers to whom telephone bill is guaranteed to be paid till a certain limited value.

The present year was a milestone for the Business segment by the consolidation of its strategy of making the client base profitable through the increase in the penetration of products like “Dados” and “Voz Avançado”. These products, besides of revenue generation, guarantee a better relationship of the Company with its client, once it frees them from investing in infrastructure using instead the network of Telefonica, that guarantees the quality and safety of the information there stored.
2.426.450
2.609.492
2.250.000
2.400.000
2.550.000
2.700.000
2000 2001
Business Lines
In order to assure an increase in revenues of 16.7%, there was a large expansion on the number of corporate terminals (a 7.5% over last year – see graphic). There was also a remarkable effort of the Commercial area to sell traffic generating products, like the DDR, which plant grew 14% compared to year 2000. Another product that deserves to be highlighted, because of its sales performance during 2001, is the “Speedy Business”. It grew 301% compared to last year, confirming the broad band market potential. Targeting the increase in the user base of “Portal ViaCorp” a business partnership was signed with CRECI (Real State Regional Council for the State of São Paulo). The partnership will allow the associates of CRECI to use a state-of-the-art portal at a suitable cost. During 2001, the Company kept the same Churn levels of 2000 with only a 5.5% turndown on the proposals presented to the clients, consolidating the shielding strategy in spite of the increase in the competition in São Paulo.
Interconnection and Network Telesp has signed interconnection contracts, allowing the communication of Telesp clients with users from others operating companies, not only in its own service area but also through interregional / international long distance calls. This also includes operators of switched public telephony, mirror companies, trunking, etc. The traffic generated by Telesp clients and terminated through the competitors network always generates revenue due to the use of the local network and in the case of the company’s long distance network, in the sectors where the competition does not have its own self-structure. The traffic growth between Telesp and the cellular companies has also been very significant, generating revenues. The Company’s network is fully capable to support the traffic thus originated. It is worth noting the leadership position of Telesp as the supplier of dedicated circuits to other operators, or to complement their own backbone. These services are highly successful in light of the excellent capillarity and quality of Telesp’s network. The development of the interconnection business has now the support of a modern traffic management system. Such system allows monitoring of traffic evolution, permitting the effective revenue control as well as helping in the marketing actions. It also serves as a base for future investment plans, aiming to keep company’s leadership in this business. Long Distance Competition The use of the Telesp (15) access code for intra-state calls, guaranteed an average “market share” of approximately 75% during the year 2001. According to the applicable concession rules, the company can only explore the market within its own service region, in other words, the intra-state calls. In the case of national and international calls, offered by other companies, Telesp is paid interconnection when its network is used by other operators. 4. Economical and Financial Issues The high investment level achieved during the year is reflected in the economic performance of the company, which allowed an increase in revenues.
Operating Revenue In 2001, Telesp had R$ 12,199 million in gross operating revenue, an increase of 24.2%. The net operating revenue totaled R$ 9,048.8 million (R$ 7,309.7 million in 2000). The growth of 18.5% in the number of basic lines in service, the tariff readjustment occurred in June 2000 and in June 2001. An increase of 7.7% in pulses (in excess of local traffic) in relation to the previous year also contributed to this accomplishment.

Net Operating Result Despite the increase of 55.2% in operating expenses before financial result, due to the increase in operating activities of the company (the highlights in expenses were advertising, transport of goods, data processing and customer services and provisions for delinquent accounts), the consolidated operating result before financial items had an increase of 17.5%, from R$ 1,943.3 million in 2000 to R$ 2,283.6 million in 2001. The gross margin grew from 43.3% to 46.2%. EBITDA The EBITDA, according to the international concept (earnings before interest, taxes, depreciation and amortization), was R$ 4,659.1 million, 17.8% higher than in 2000 (R$ 3,954.0 million). For its part, the EBITDA margin was 51,5% in 2001 (54% in 2000). Financial Result The growth in the debt ratio was caused by the effort to enlarge the operating plant. As a result, there was an increase in the financial expenses in 2001. The consolidated financial results for 2001 (without the effect of the interests over its own capital: R$ 1,060,392 in 2001 and R$ 819,368 in 2000), when compared to the previous year, shows a negative evolution of only R$ 182.3 million in spite of the high amount of investment registered in 2001 and in the net debt over the year. This result, that contributed positively to the good performance of the Company in 2001, stands for the well succeeded efforts dedicated to the financial management of the Company. Net Income The net income in 2001 was R$ 1,576.3 million (R$ 1,470.0 million in 2000), resulting in a net margin of 17.4% (20.1% in 2000). Capital Structure Telesp finished the year 2001 with a net debt of R$ 4,004.0 million, or 27.2% of the shareholder’s equity, compared to R$ 1,902.2 million in 2000, or 13.1% of the shareholder’s equity. The resources where mainly allocated in the expansion and improvement of the offered services. The Company develops a constant and timely effort to shield the liabilities against the effects of the unstable financial market conditions and exchange rate risk. 5. Human Resources Productivity On December 31, 2001, the company reached the 1,198 LIS / employee, an increase of 44.51% regarding the 790 LIS / employee registered on December 31, 2000, and an increase of 347.01% compared to the 268 LIS / employee in July 1998, when Telefónica Group took control of the management of Telesp. This productivity gain is the result of

the increase in the number of lines in service (including basic, public and ISDN lines to a total of 12,616,006) and headcount of 10,529 employees.
181225 239
338
567
829
1.198
-
200
400
600
800
1.000
1.200
1995 1996 1997 1998 1999 2000 2001
Lines in Service (Basic) per Employee
Training Telesp continues to invest heavily in training programs, both to direct employees and to those belonging to third parties. More than 29,000 people were trained, totaling 576 thousand hours/class in 2001. Salaries Telesp maintains the strategy to adopt modern salary policies, widening the range of the variable wages, giving incentives and awards to the professionals that excel, according to their performance and the accomplishment of targets. These policies have allowed the capture and retain of talents in a highly competitive market. Champion’s run (Corrida dos Campeões) During 2001, Telesp implemented a major incentive program seeking the enrollment of the employees in a program to improve the efficiency and productivity in the company, called Corrida dos Campeões (Champion’s run). The program focused on entrepreneurism, care for the resources of the Company and the creativity applied to the simplicity of solutions. More than 4000 employees took part in the program, generating 1,146 inscribed projects/ideas. The second stage of the program is currently under development, and besides enforcing the results of the first stage, it seeks to
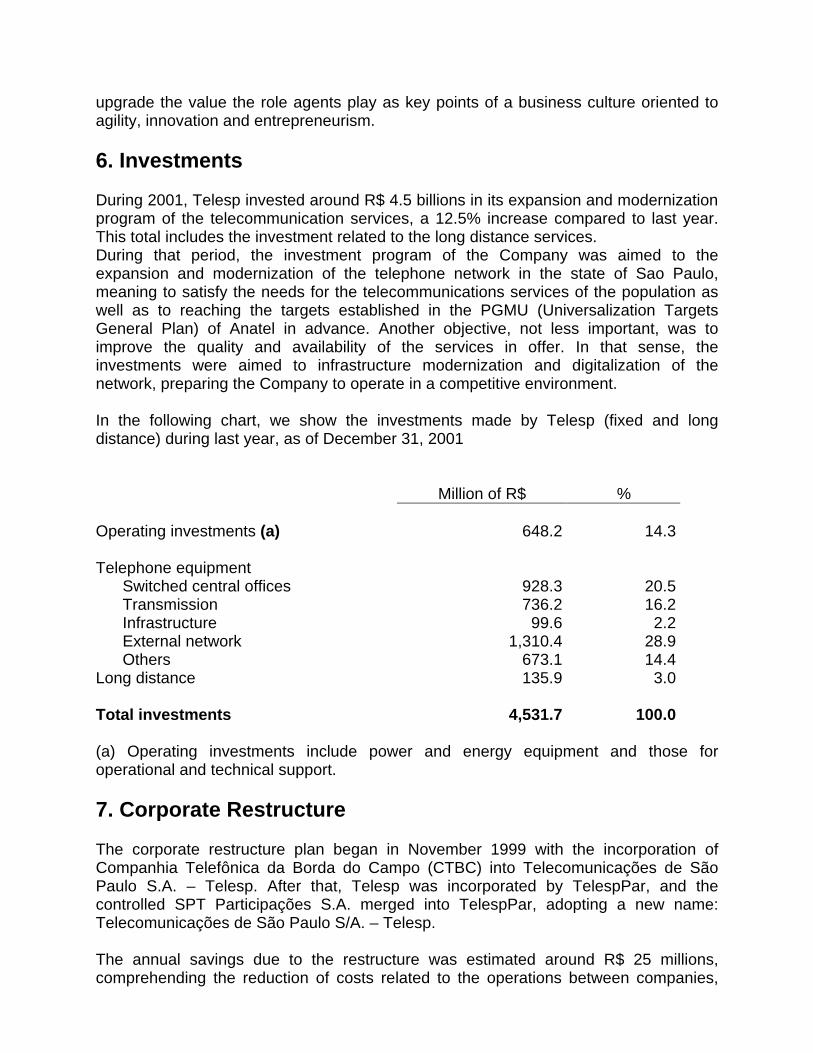
upgrade the value the role agents play as key points of a business culture oriented to agility, innovation and entrepreneurism. 6. Investments During 2001, Telesp invested around R$ 4.5 billions in its expansion and modernization program of the telecommunication services, a 12.5% increase compared to last year. This total includes the investment related to the long distance services. During that period, the investment program of the Company was aimed to the expansion and modernization of the telephone network in the state of Sao Paulo, meaning to satisfy the needs for the telecommunications services of the population as well as to reaching the targets established in the PGMU (Universalization Targets General Plan) of Anatel in advance. Another objective, not less important, was to improve the quality and availability of the services in offer. In that sense, the investments were aimed to infrastructure modernization and digitalization of the network, preparing the Company to operate in a competitive environment. In the following chart, we show the investments made by Telesp (fixed and long distance) during last year, as of December 31, 2001 Million of R$ % Operating investments (a) 648.2 14.3 Telephone equipment Switched central offices 928.3 20.5 Transmission 736.2 16.2 Infrastructure 99.6 2.2 External network 1,310.4 28.9 Others 673.1 14.4 Long distance 135.9 3.0 Total investments 4,531.7 100.0 (a) Operating investments include power and energy equipment and those for operational and technical support. 7. Corporate Restructure The corporate restructure plan began in November 1999 with the incorporation of Companhia Telefônica da Borda do Campo (CTBC) into Telecomunicações de São Paulo S.A. – Telesp. After that, Telesp was incorporated by TelespPar, and the controlled SPT Participações S.A. merged into TelespPar, adopting a new name: Telecomunicações de São Paulo S/A. – Telesp. The annual savings due to the restructure was estimated around R$ 25 millions, comprehending the reduction of costs related to the operations between companies,

elimination of administrative redundancies, expenses with the publishing of financial statements, expenses with the independent auditing and with the open company register fee at the official agencies and at the stock exchange. Continuing the Company restructuring program and aiming to rationalize operations between the companies, administrative redundancies, and a consequent cost reduction, the General Extraordinary Meeting approved on November 27, 2000, the merger of Centrais Telefônicas de Ribeirão Preto S.A. – Ceterp into Telesp. On January 30, 2001, the Company had a partial spin off represented by the investments and interests in Telefónica Empresas S.A., resulting in a new company: Telefónica Data Brasil Holding S.A. The main objective of this operation was the segregation of the operating activities related to the switched package network. With this operation, Telefónica Data Brasil Holding S.A. has as its objective to make the needed investments for the development of the operating activities related to the switched package network. This aims to leverage the strategic and competitive position of Telefónica Empresas S.A. 8- Ownership structure Along the year 2001, the ownership structure of the controlling group suffered some modifications. At the start of the year, Telefónica S.A. (TESA) had 30.30% of the common shares and 77.93% of the preferred shares of the Company. SP Telecomunicações Holding S.A. together with Tele Ibero Americana Ltda. (controlled by Telefónica Internacional S.A. – TISA) had 54.04% of the common shares and 9.19% of the preferred shares of the Company. The ownership stake of Telefónica S.A. (TESA), resulted from the tender offer in exchange for BDRs (process that concluded on June 30, 2000), was transferred to Telefónica Internacional S.A. (TISA) on February 6, 2001. The reason of this transfer was to give continuity to the business reorganization, allowing the operating and management consolidation by business lines, according to is strategic and competitive position. At the end of 2001, Telefónica Internacional S.A. (TISA) has 30.30% of the common shares and 79.68% of the preferred shares of the Company. SP Telecomunicações Holding S.A. together with Tele Ibero Americana Ltda. (controlled by Telefónica Internacional S.A. – TISA) have 54.04% of the common shares and 9.19% of the preferred shares of the Company.
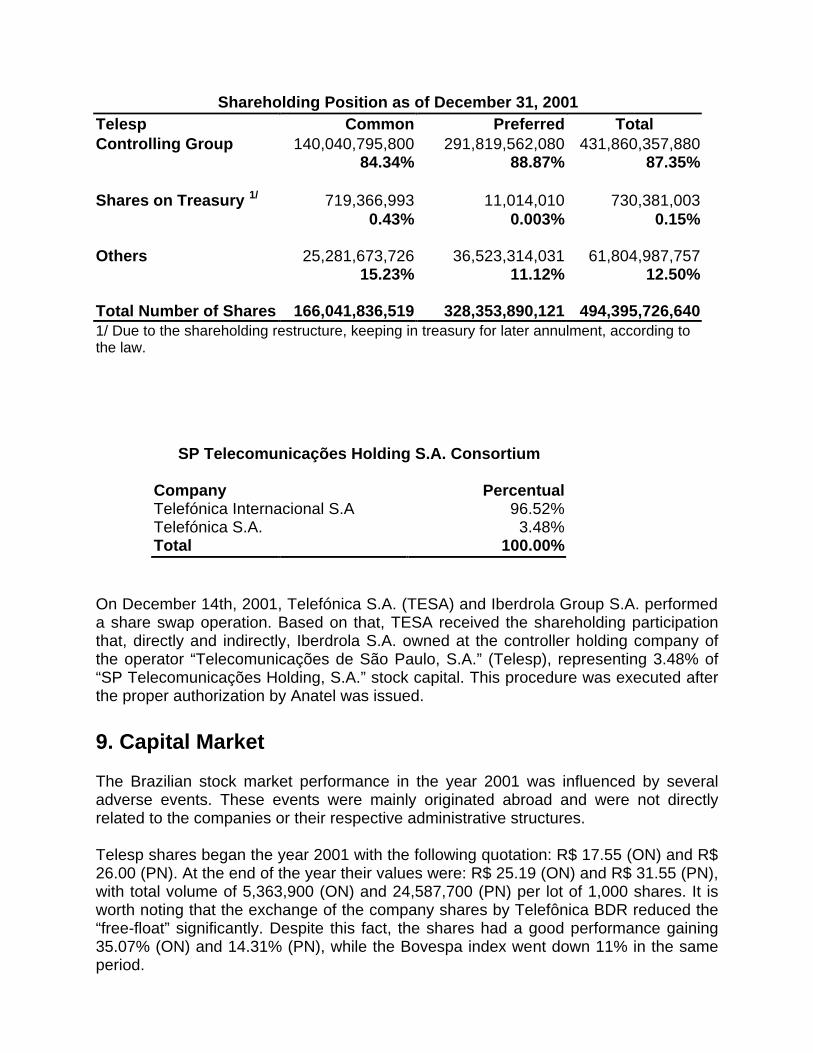
Shareholding Position as of December 31, 2001 Telesp Common Preferred Total Controlling Group 140,040,795,800 291,819,562,080 431,860,357,880
84.34% 88.87% 87.35%
Shares on Treasury 1/ 719,366,993 11,014,010 730,381,003 0.43% 0.003% 0.15%
Others 25,281,673,726 36,523,314,031 61,804,987,757 15.23% 11.12% 12.50%
Total Number of Shares 166,041,836,519 328,353,890,121 494,395,726,640 1/ Due to the shareholding restructure, keeping in treasury for later annulment, according to the law.
SP Telecomunicações Holding S.A. Consortium Company Percentual Telefónica Internacional S.A 96.52% Telefónica S.A. 3.48% Total 100.00%
On December 14th, 2001, Telefónica S.A. (TESA) and Iberdrola Group S.A. performed a share swap operation. Based on that, TESA received the shareholding participation that, directly and indirectly, Iberdrola S.A. owned at the controller holding company of the operator “Telecomunicações de São Paulo, S.A.” (Telesp), representing 3.48% of “SP Telecomunicações Holding, S.A.” stock capital. This procedure was executed after the proper authorization by Anatel was issued. 9. Capital Market The Brazilian stock market performance in the year 2001 was influenced by several adverse events. These events were mainly originated abroad and were not directly related to the companies or their respective administrative structures. Telesp shares began the year 2001 with the following quotation: R$ 17.55 (ON) and R$ 26.00 (PN). At the end of the year their values were: R$ 25.19 (ON) and R$ 31.55 (PN), with total volume of 5,363,900 (ON) and 24,587,700 (PN) per lot of 1,000 shares. It is worth noting that the exchange of the company shares by Telefônica BDR reduced the “free-float” significantly. Despite this fact, the shares had a good performance gaining 35.07% (ON) and 14.31% (PN), while the Bovespa index went down 11% in the same period.

At the New York Stock Exchange (NYSE), the ADRs (American Depositary Receipts) finished the year quoted at US$ 13.20 with a total volume of 6,931 thousand ADRs. The ADRs dropped 1.31% while the NYSE fell 7.1%. 10. Interest on the Company’s Net Worth From December 21, 2001 on, the Company paid dividends regarding the 1999 fiscal year to Telesp shareholders as of March 3, 2000 an amount of R$ 0.136421. It also paid interests on company’s own capital related to the 2nd quote of the 1999 fiscal year to the former Telesp Participações S.A. (TelespPar) shares, on the gross value of R$ 1.371319 and on the net value of R$ 1.165621, and to the former CTBC/Telesp shares, incorporated and extinguished, on the gross value of R$ 0.342829 and on the net value of R$ 0.291405. On the same date, the Company paid interests on company’s own capital related to the 1st quote of the 2000 fiscal year to Telesp shares, on the gross value of R$ 0.835724 and on the net value of R$ 0.710365, and to the former Ceterp shares, incorporated and extinguished, on the gross value of R$ 0.069643 and on the net value of R$ 0.059197. The Company’s Management approved in December 2001, “ad referendum” of the General Shareholders’ Meeting, the payment of interests on the Company’s own capital in accordance with Article 9 of Law 9.249/95 and Edict No. 207/96 of the CVM (the Brazilian Securities and Exchange Commission) for a total of R$ 1,060,392,000.00, as income tax retention, resulting in net interests of R$ 901,333,000.00. The total gross value of interests on the Company’s own capital, per lot of 1,000 shares, is R$ 2.147997645. Interest on the Company’s own capital is subject to a 15% withholding tax, except for those entities that are income tax exempt, resulting in the following net value of R$ 1.825797998 per lot of 1,000 shares. The corresponding credit will be registered on the Company’s accounting records on December 31, 2001, individually to each shareholder, based on their shareholding position as of December 31, 2001. A payment date will be decided at the Company’s General Shareholders’ Meeting. On December 31, 2001, it was reverted the balance of the Special Reserve for Dividends, constituted in the 2000 exercise, on the amount of R$ 346,247,000, for the payment until the end of the 2002 exercise, in benefit of those shareholders with a shareholding position on December 31, 2000 (ICNW). Likewise, it was set a new Special Reserve for Dividends payment, on the amount of R$ 346,247,000, related to the declared dividends based on the balance ended on 12/31/2001. The aim is to assure the economical-financial balance of the Company.

11. Telefónica Foundation On January 1999, Telecomunicações de São Paulo S.A., Telesp, together with Telesudeste Celular Participações S.A. and Telefónica Foundation from Spain inaugurated the Telefónica Foundation. The Foundation has the mission to contribute in the improvement of the quality of life of the lower end population within the regions that the Company operates in, supporting the companies of the Telefónica Group in their social responsibility duties. During the year of 2001, the Foundation consolidated its operating strategy, investing in programs and projects dedicated to children and young people. It privileges the application of telecommunications and information technology to social projects. Additionally, it invested in projects for impaired people, programs for people in situations of personal or social risk, and in cultural projects based in the telecommunications expertise of Telesp. More than 330 public schools within the state of São Paulo, 66 municipal public libraries and 17 public telecenters were connected to the broad band Internet. 12. Perspectives and Future Plans Telefónica, after achieving the targets for the universalization, consolidated its large footprint, serving its clients with quality and efficiency within the state of São Paulo. To increase the satisfaction level of its customers, Telefónica will develop services available to all its large installed network, while offering more value for current and future customers. Another important point resulting from the anticipation of the Anatel’s targets will be the opportunity to extend into other concession areas of the country. Telefónica understands that it will be possible to serve the new markets with a wide range of services providing the same quality and competence already available in the state of São Paulo. Telefónica is working with people, methodologies and processes focused on the identification and development of new opportunities in order to guarantee profitability and, mainly, quality of implementation. 13. Acknowledgement Finally, the management of Telecomunicações de São Paulo S/A – Telesp thanks all the shareholders, clients, suppliers and financial institutions for their support and trust, and especially to the employees, for their dedication and effort. Thanks to our people, we managed to achieve the results presented hereby.

Telecomunicações de São Paulo S.A. - Telesp Financial Statements Together with Report of Independent Public Accountants
December 31, 2001 and 2000

Report of Independent Public Accountants (Translation of the report originally issued in Portuguese. See Note 33 to the financial statements.) To the Management and Shareholders of Telecomunicações de São Paulo S.A. - Telesp: (1) We have audited the individual (Company) and consolidated balance sheets of TELECOMUNICAÇÕES DE SÃO PAULO S.A. - TELESP (a Brazilian corporation) and ubsidiaries as of December 31, 2001 and 2000, and the related statements of income, changes in shareholders’ equity, and changes in financial position for the years then ended, prepared under the responsibility of the Company’s management. Our responsibility is to express an opinion on these financial statements. (2) Our audits were conducted in accordance with auditing standards in Brazil and comprised: (a) planning of the work, taking into consideration the significance of the balances, volume of transactions, and the accounting and internal control systems of the Company and its subsidiaries, (b) checking, on a test basis, the evidence and records that support the amounts and accounting information disclosed, and (c) evaluating the significant accounting practices and estimates adopted by management, as well as the presentation of the financial statements taken as a whole. (3) In our opinion, the financial statements referred to above present fairly, in all material respects, the individual and consolidated financial positions of Telecomunicações de São Paulo S.A. - Telesp and subsidiaries as of December 31, 2001 and 2000, and the results of their operations, the changes in shareholders’ equity, and the changes in their financial positions for the years then ended in accordance with accounting practices emanating from Brazilian corporate law. São Paulo, January 30, 2002 ARTHUR ANDERSEN S/C Taiki Hirashima Engagement Partner

TELECOMUNICAÇÕES DE SÃO PAULO S.A. - TELESP
BALANCE SHEETS--DECEMBER 31, 2001 AND 2000
(In thousands of Brazilian reais)
(Translation of the original in Portuguese)
A S S E T S Company Consolidated 2001 2000 2001 2000
CURRENT ASSETS 3,605,374 2,733,923 3,665,493 2,859,630 --------------- --------------- --------------- --------------- Cash and cash equivalents 202,614 39,781 206,298 97,036 Trade accounts receivable, net 1,758,603 1,570,485 1,781,382 1,618,507 Deferred and recoverable taxes 1,060,811 697,139 1,074,054 701,301 Other recoverable amounts 38,183 113,885 38,753 114,522 Loans and marketable securities 2,108 1,777 2,108 1,777 Inventories 434,032 200,737 454,624 215,511 Other 109,023 110,119 108,274 110,976 NONCURRENT ASSETS 1,315,427 1,136,727 1,324,051 1,116,654 --------------- --------------- --------------- --------------- Deferred and recoverable taxes 954,439 1,000,292 963,449 1,002,468 Loans and marketable securities 28,922 28,302 28,922 28,302 Other recoverable amounts 144,349 67,186 144,374 67,186 Amounts for capitalization 84,905 84 84,905 84 Other 102,812 40,863 102,401 18,614 PERMANENT ASSETS 17,879,171 16,008,299 17,838,369 16,002,624 --------------- --------------- --------------- --------------- Investments 186,168 333,715 142,193 128,243
Property, plant and equipment, net 17,512,039 15,517,114 17,515,212 15,715,327 Deferred charges 180,964 157,470 180,964 159,054 --------------- --------------- --------------- --------------- Total assets 22,799,972 19,878,949 22,827,913 19,978,908 ======== ======== ======== ========
The accompanying notes are an integral part of these balance sheets.

TELECOMUNICAÇÕES DE SÃO PAULO S.A. - TELESP
BALANCE SHEETS--DECEMBER 31, 2001 AND 2000
(In thousands of Brazilian reais)
(Translation of the original in Portuguese)
LIABILITIES AND SHAREHOLDERS’ EQUITY
Company Consolidated 2001 2000 2001 2000
CURRENT LIABILITIES 6,090,588 4,321,460 6,125,558 4,440,234 --------------- --------------- --------------- --------------- Payroll and related charges 93,960 98,915 94,399 107,064 Accounts payable and accrued expenses 1,274,621 1,532,636 1,277,457 1,589,077 Indirect taxes 443,402 284,349 445,784 293,589 Taxes on income 135,070 53,178 135,586 53,321 Profit participation 1,108,948 1,046,407 1,109,296 1,051,990 Loans and financing 2,608,736 1,158,514 2,636,228 1,193,776 Reserve for contingencies 7,882 6,449 7,882 6,449 Other 417,969 141,012 418,926 144,968 LONG-TERM LIABILITIES 2,008,435 1,091,443 2,001,406 1,072,628 --------------- --------------- --------------- --------------- Taxes on income 43,773 144,537 43,800 144,537 Loans and financing 1,367,804 704,584 1,367,804 704,584 Reserve for contingencies 374,679 167,042 374,679 167,042 Other 222,179 75,280 215,123 56,465 SHAREHOLDERS’ EQUITY 14,699,323 14,464,420 14,699,323 14,464,420 --------------- --------------- --------------- --------------- Capital 5,640,184 5,847,983 5,640,184 5,847,983 Capital reserves 2,743,176 2,742,268 2,743,176 2,742,268 Income reserves 763,551 684,380 763,551 684,380 Retained earnings 5,552,412 5,189,789 5,552,412 5,189,789 FUNDS FOR CAPITALIZATION 1,626 1,626 1,626 1,626 --------------- --------------- --------------- --------------- total liabilities and shareholders’ equity 22,799,972 19,878,949 22,827,913 19,978,908 ======== ======== ======== ========
The accompanying notes are an integral part of these balance sheets.

TELECOMUNICAÇÕES DE SÃO PAULO S.A. - TELESP
STATEMENTS OF INCOME
FOR THE YEARS ENDED DECEMBER 31, 2001 AND 2000
(In thousands of Brazilian reais)
(Translation of the original in Portuguese)
Company Consolidated 2001 2000 2001 2000 GROSS OPERATING REVENUE 12,119,180 9,598,014 12,198,987 9,820,879 --------------- -------------- ---------------- -------------- Telecommunication services/sales revenue 12,119,180 9,598,014 12,198,987 9,820,879 Revenue deductions (3,136,102) (2,460,551) (3,150,139) (2,511,196) --------------- -------------- ---------------- -------------- NET OPERATING REVENUE 8,983,078 7,137,463 9,048,848 7,309,683 Cost of services provided and of sales (4,818,320) (4,044,446) (4,865,254) (4,142,002) --------------- -------------- ---------------- -------------- GROSS PROFIT 4,164,758 3,093,017 4,183,594 3,167,681 OPERATING (EXPENSE) INCOME: (1,879,708) (1,106,708) (1,900,034) (1,224,378) --------------- -------------- ---------------- -------------- Selling (800,680) (548,268) (815,617) (572,221) General and administrative (801,461) (644,364) (826,715) (667,754) Investment gains (losses) (21,330) 82,759 4,540 14,598 Other, net (256,237) 3,165 (262,242) 999 --------------- -------------- ---------------- -------------- INCOME FROM OPERATIONS BEFORE FINANCIAL EXPENSE 2,285,050 1,986,309 2,283,560 1,943,303 Financial expense, net (1,385,307) (970,528) (1,396,130) (972,795) INCOME FROM OPERATIONS 899,743 1,015,781 887,430 970,508 Nonoperating income (expense), net (16,850) (14,719) (16,828) 68,055 --------------- -------------- ---------------- -------------- INCOME BEFORE TAXES, PROFIT SHARING AND MINORITY INTEREST 882,893 1,001,062 870,602 1,038,563 Income and social contribution taxes (282,776) (295,385) (269,453) (330,365) Employees’ profit sharing (84,204) (54,978) (85,236) (56,144) Minority interest - - - (1,360) Reversal of interest on capital 1,060,392 819,368 1,060,392 819,368 --------------- -------------- ---------------- -------------- NET INCOME 1,576,305 1,470,067 1,576,305 1,470,062 ======== ======== ========= ======== NUMBER OF SHARES OUTSTANDING AT THE BALANCE SHEET DATE (IN THOUSANDS) 494,395,727 494,395,727 ========== ========== EARNINGS PER THOUSAND SHARES - R$ 3.19 2.97 === ===
The accompanying notes are an integral part of these statements.

1/2
TELECOMUNICAÇÕES DE SÃO PAULO S.A. - TELESP
STATEMENTS OF CHANGES IN SHAREHOLDERS’ EQUITY
FOR THE YEARS ENDED DECEMBER 31, 2001 AND 2000
(In thousands of Brazilian reais)
(Translation of the original in Portuguese)
Capital reserves Income reserves Other Special Share Investment capital Legal reserve for Retained Capital premium grants reserves reserve dividends earnings Total BALANCES DECEMBER 31, 1999 5,709,195 2,708,337 311 188 264,985 494,704 4,599,543 13,777,263 Capital increase on August 29, 2000: Funds for capitalization 133,176 83,927 - - - - - 217,103 Shareholders’ funds 8 5 - - - - - 13 Reversal of income tax on interest on capital - tax exempt - - - - - 9,291 - 9,291 Reduction for insufficiency in issue of shares - (33,443) - - - - - (33,443) Investment grants - - 1,026 - - - - 1,026 Public offering of shares - (76) - - - - - (76) Transfer of Ceterp net assets 5,604 - - - - - - 5,604 Dissident shareholders of CTBC - (18,007) - - - - - (18,007) Unclaimed dividends - - - - - - 13,050 13,050 Net income - - - - - - 1,470,067 1,470,067 Reversal of reserve for dividends - - - - - (503,995) - (503,995) Proposed allocation of income: Legal reserve - - - - 73,503 - (73,503) - Interest on capital - - - - - 345,892 (696,463) (350,571) Income tax on interest on capital - - - - - - (122,905) (122,905) ------------- ------------- ------- ---- ---------- ----------- ------------- --------------- BALANCES DECEMBER 31, 2000 5,847,983 2,740,743 1,337 188 338,488 345,892 5,189,789 14,464,420 ======== ======== ===== === ====== ====== ======== =========

2/2
Capital reserves Income reserves Other Special Share Investment capital Legal reserve for Retained Capital premium grants reserves reserve dividends earnings Total BALANCES DECEMBER 31, 2000 5,847,983 2,740,743 1,337 188 338,488 345,892 5,189,789 14,464,420 Capital decrease from spin-off - Telefônica Data Brasil Holding S.A. (207,799) - - - - - - (207,799) Addition to special reserve for dividends - - - - - 356 - 356 Investment grants - - 1,702 - - - - 1,702 Public offering of shares - (794) - - - - - (794) Unclaimed dividends - - - - - - 22,070 22,070 Adjustments to retained earnings: Post-retirement benefit plans accruals - CVM Instruction No. 371 of December 13, 2000 - - - - - - (144,096) (144,096) Income and social contribution taxes on post-retirement benefit plans accruals - - - - - - 47,551 47,551 Net income - - - - - - 1,576,305 1,576,305 Reversal of reserve for dividends - - - - - (346,248) - (346,248) Proposed allocation of income: Legal reserve - - - - 78,815 - (78,815) - Interest on capital - - - - - 346,248 (901,333) (555,085) Income tax on interest on capital - - - - - - (159,059) (159,059) ------------- ------------- ------- ---- ---------- ----------- ------------- --------------- BALANCES DECEMBER 31, 2001 5,640,184 2,739,949 3,039 188 417,303 346,248 5,552,412 14,699,323 ======== ======== ==== === ====== ====== ======== =========
The accompanying notes are an integral part of these statements.

1/2
TELECOMUNICAÇÕES DE SÃO PAULO S.A. - TELESP
STATEMENTS OF CHANGES IN FINANCIAL POSITION
FOR THE YEARS ENDED DECEMBER 31, 2001 AND 2000
(In thousands of Brazilian reais)
(Translation of the original in Portuguese) Company Consolidated 2001 2000 2001 2000 SOURCES OF FUNDS: From operations- Net income 1,576,305 1,470,067 1,576,305 1,470,062 Minority interest - - - 1,360 Items not affecting working capital 2,719,279 2,060,779 2,692,846 2,075,440 -------------- -------------- -------------- -------------- Depreciation and amortization of property, plant and equipment and deferred charges 2,343,047 1,946,026 2,343,529 1,978,848 Monetary and exchange variations on noncurrent items, net 218,872 75,862 218,872 81,187 Equity in subsidiaries, net of dividends 22,364 (69,092) (4,540) (14,598) Disposal of permanent assets 39,369 3,019 39,358 (80,263) Provision for contingencies 64,890 73,096 64,890 78,398 Amortization of goodwill - investment 32,043 31,868 32,043 31,868 Other (1,306) - (1,306) - -------------- -------------- -------------- -------------- Funds provided by operations 4,295,584 3,530,846 4,269,151 3,546,862 Increase in long-term liabilities 866,939 159,323 868,252 140,978 -------------- -------------- -------------- -------------- Taxes 40 92,066 68 92,066 Loans and financing 673,493 - 673,493 - Payable to related companies 48,187 32,614 49,554 14,269 Post-retirement benefit plans accruals - CVM Instruction No. 371 of December 13, 2000 144,178 - 144,096 - Other 1,041 34,643 1,041 34,643 Increase in funds for capitalization/capital - 250,572 - 250,572 Other sources 1,114,636 1,486,731 1,117,230 1,418,254 -------------- -------------- -------------- -------------- Spin-off - Telefônica Data Brasil Holding S.A. 207,799 - 207,799 - Investment grants, net of taxes on income 1,702 1,026 1,702 1,031 Transfer from noncurrent to current assets 434,059 848,397 436,305 870,996 Transfer of property, plant and equipment to capitalizable amounts 94,505 105,895 94,505 - Proceeds from sale of property, plant and equipment and investments 7,897 26,887 8,056 176,277 Working capital merged - 135,319 - - Unclaimed dividends 22,070 13,050 22,070 13,050 Income tax on interest on capital 356 9,291 356 9,291 Special reserve for dividends 346,248 345,892 346,248 345,892 Other - 974 189 1,717 -------------- -------------- -------------- -------------- Total sources 6,277,159 5,427,472 6,254,633 5,356,666 -------------- -------------- -------------- --------------
2/2
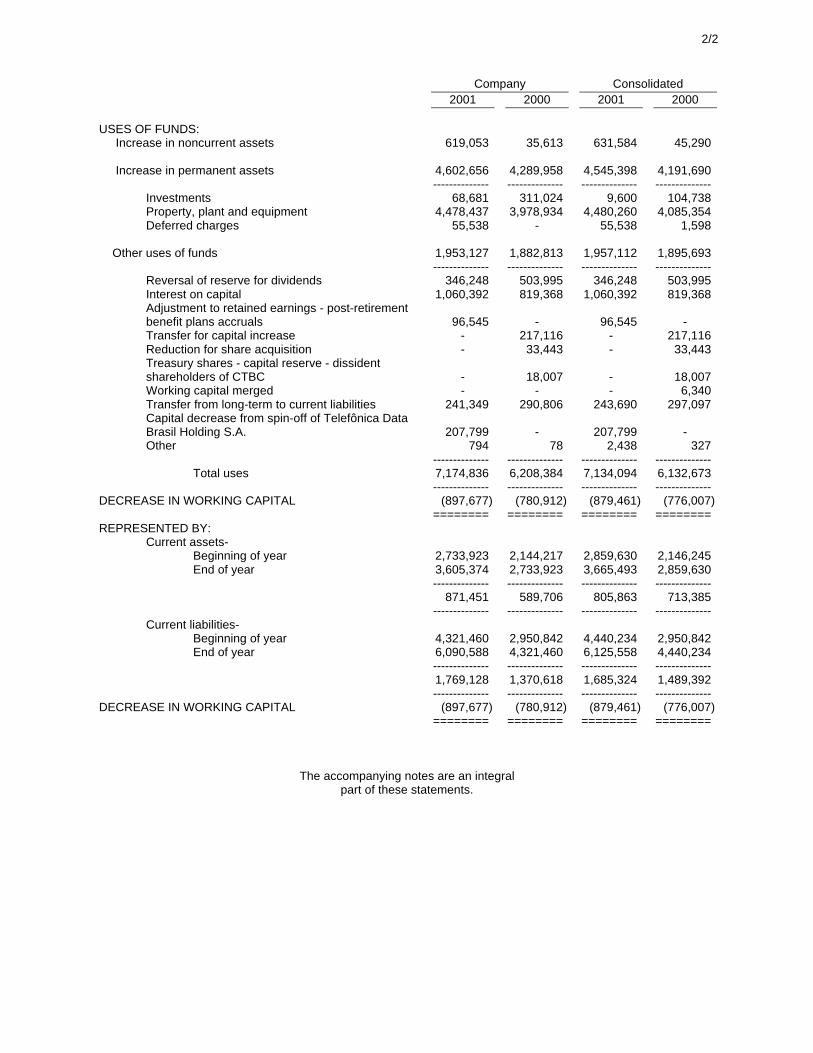
Company Consolidated 2001 2000 2001 2000 USES OF FUNDS: Increase in noncurrent assets 619,053 35,613 631,584 45,290 Increase in permanent assets 4,602,656 4,289,958 4,545,398 4,191,690 -------------- -------------- -------------- -------------- Investments 68,681 311,024 9,600 104,738 Property, plant and equipment 4,478,437 3,978,934 4,480,260 4,085,354 Deferred charges 55,538 - 55,538 1,598 Other uses of funds 1,953,127 1,882,813 1,957,112 1,895,693 -------------- -------------- -------------- -------------- Reversal of reserve for dividends 346,248 503,995 346,248 503,995 Interest on capital 1,060,392 819,368 1,060,392 819,368 Adjustment to retained earnings - post-retirement benefit plans accruals 96,545 - 96,545 - Transfer for capital increase - 217,116 - 217,116 Reduction for share acquisition - 33,443 - 33,443 Treasury shares - capital reserve - dissident shareholders of CTBC - 18,007 - 18,007 Working capital merged - - - 6,340 Transfer from long-term to current liabilities 241,349 290,806 243,690 297,097 Capital decrease from spin-off of Telefônica Data Brasil Holding S.A. 207,799 - 207,799 - Other 794 78 2,438 327 -------------- -------------- -------------- -------------- Total uses 7,174,836 6,208,384 7,134,094 6,132,673 -------------- -------------- -------------- -------------- DECREASE IN WORKING CAPITAL (897,677) (780,912) (879,461) (776,007) ======== ======== ======== ======== REPRESENTED BY: Current assets- Beginning of year 2,733,923 2,144,217 2,859,630 2,146,245 End of year 3,605,374 2,733,923 3,665,493 2,859,630 -------------- -------------- -------------- -------------- 871,451 589,706 805,863 713,385 -------------- -------------- -------------- -------------- Current liabilities- Beginning of year 4,321,460 2,950,842 4,440,234 2,950,842 End of year 6,090,588 4,321,460 6,125,558 4,440,234 -------------- -------------- -------------- -------------- 1,769,128 1,370,618 1,685,324 1,489,392 -------------- -------------- -------------- -------------- DECREASE IN WORKING CAPITAL (897,677) (780,912) (879,461) (776,007) ======== ======== ======== ========
The accompanying notes are an integral part of these statements.

TELECOMUNICAÇÕES DE SÃO PAULO S.A. - TELESP
NOTES TO THE FINANCIAL STATEMENTS
AS OF DECEMBER 31, 2001 AND 2000
(Amounts in thousands of Brazilian reais, unless otherwise indicated)
(Translation of the original in Portuguese) 1. OPERATIONS AND BACKGROUND a. Formation of the Company, its Controlling Shareholders and Restructuring Telecomunicações de São Paulo S.A. - Telesp (formerly Telesp Participações S.A. - TelespPar) (“TelespPar”), denominated as “Company” or “Telesp”, was formed pursuant to article 189 of Law No. 9,472/97 of the General Telecommunications Law based on Decree No. 2,546 on April 14, 1998, as part of the spin-off of TELEBRÁS. On July 29, 1998, the Federal Government sold, in a public auction held at the Rio de Janeiro Stock Exchange (BOVERJ), the TelespPar (holding company of Telecomunicações de São Paulo S.A. - Telesp and Companhia Telefônica da Borda do Campo - CTBC) controlling shares which were purchased by Tele Brasil Sul Participações S.A. - TBS, a consortium controlled by Telefónica Internacional S.A. - TISA (controlled by Telefônica S.A.). As a result of subsequent mergers in this consortium, on January 10, 1999, SPT Participações S.A. (“SPT”) now holds TelespPar’s controlling shares. On November 30, 1999, as previously approved by the National Telecommunications Agency (ANATEL), the Brazilian telecommunication regulatory agency, TelespPar’s restructuring was completed, through successive mergers, as follows: (i) merger of CTBC into Telesp; (ii) merger of Telesp into TelespPar; and (iii) merger of SPT into TelespPar. After these mergers, SP Telecomunicações Holding S.A. (controlled by TISA) became the controlling shareholder of TelespPar. The name of TelespPar was changed to Telecomunicações de São Paulo S.A. - Telesp. On June 30, 2000, the public offering for the exchange of all outstanding shares of the Company for BDRs (Brazilian Depositary Receipts) representing shares of Telefónica S.A. was concluded. As a result of this public offering and subsequent changes, on December 31, 2001, Telefónica S.A. holds, directly and indirectly, 84.34% of the common shares and 88.87% of the preferred shares of the Company. The Company is registered with the Brazilian Securities Commission (CVM) as a publicly-held company and its shares are traded on Brazil’s principal stock exchanges. The Company is also registered with the Securities and Exchange Commission - SEC, in the United States of America, and its American Depositary Shares - ADSs, level II, are traded on the New York Stock Exchange - NYSE.

b. The Telecommunications Services Subsidiaries Up to November 30, 1999, the subsidiaries Telesp and CTBC were the principal providers of local fixed line telecommunications services in the State of São Paulo, under a Federal Government concession, which will expire on December 31, 2005, renewable for another period of 20 years. Due to the corporate restructuring mentioned above on November 30, 1999 and the extinction of the subsidiaries Telesp and CTBC, their operations were assumed by the Company from that date. On October 29, 1999, the subsidiary Assist Telefônica S.A. was formed; its business is to provide technical assistance services. On December 22, 1999, the Company acquired from the Municipality of Ribeirão Preto, in a public auction, the controlling shares of Centrais Telefônicas de Ribeirão Preto S.A. - Ceterp (“Ceterp”), and its subsidiary Ceterp Celular S.A. On October 4, 2000, in accordance with the rules established in the privatization process, the Company concluded the acquisition, through public offering, of the common and preferred shares from minority shareholders. After these acquisitions, the Company held 96.97% of the preferred shares and 99.85% of the common shares of Ceterp. On November 27, 2000, in accordance with the rules applicable to the Brazilian telecommunications market, Ceterp sold its subsidiary Ceterp Celular S.A. Additionally, on November 30, 2000, Ceterp was merged into the Company. On August 3, 2000, the wholly-owned subsidiary Telefônica Empresas S.A. was formed, with operations related to packet-switched data network service. On November 24, 2000, the Company made a capital increase in the subsidiary with cash and through fixed assets related to the packet-switched data network service, including the transfer of the authorization to explore this service. On January 30, 2001, Telefônica Data Brasil Holding S.A. was formed, resulting from a partial spin-off of the Company’s net assets. These assets were represented by the investment in the wholly-owned subsidiary Telefônica Empresas S.A. and accounts receivable. The objective of the formation of Telefônica Data Brasil Holding S.A. is to segregate operating activities related to packet-switched data network services, due to the operating and administrative restructuring in 2000. 2. PRESENTATION OF THE FINANCIAL STATEMENTS The individual (Company) and consolidated financial statements as of December 31, 2001 and 2000 were prepared in accordance with accounting practices emanating from Brazilian corporate law, rules applicable to concessionaires of public telecommunications services, and standards and accounting procedures established by CVM.
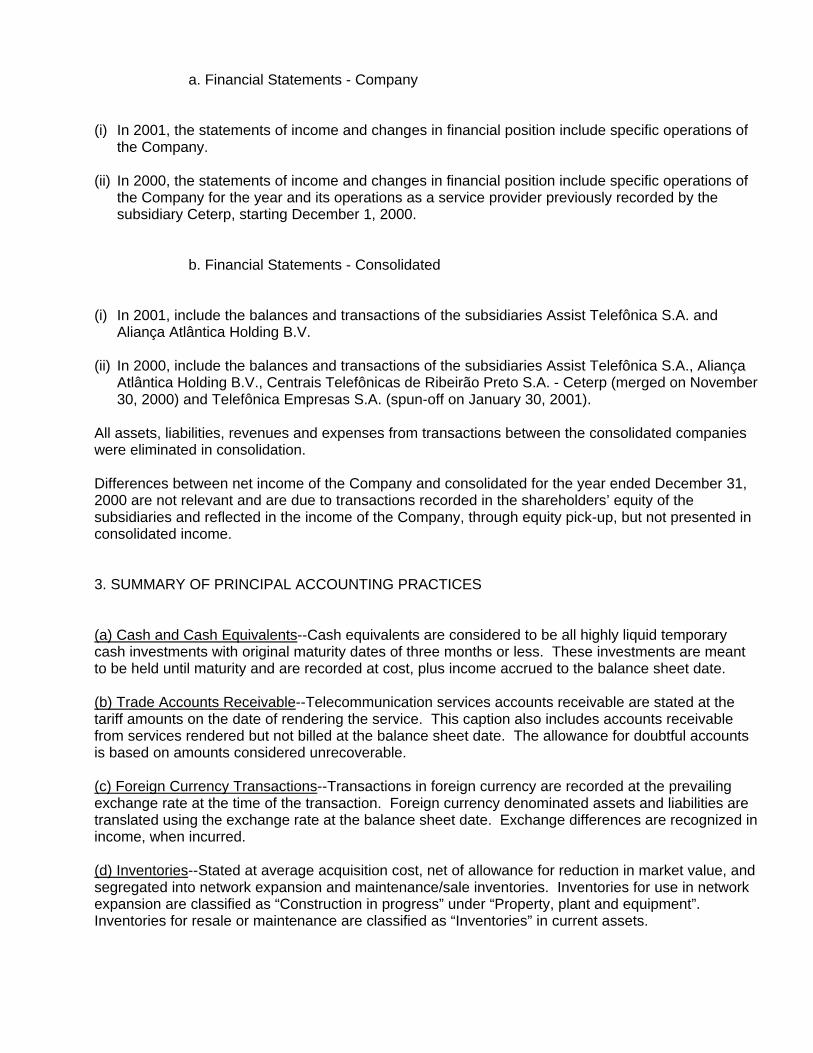
a. Financial Statements - Company (i) In 2001, the statements of income and changes in financial position include specific operations of
the Company. (ii) In 2000, the statements of income and changes in financial position include specific operations of
the Company for the year and its operations as a service provider previously recorded by the subsidiary Ceterp, starting December 1, 2000.
b. Financial Statements - Consolidated (i) In 2001, include the balances and transactions of the subsidiaries Assist Telefônica S.A. and
Aliança Atlântica Holding B.V. (ii) In 2000, include the balances and transactions of the subsidiaries Assist Telefônica S.A., Aliança
Atlântica Holding B.V., Centrais Telefônicas de Ribeirão Preto S.A. - Ceterp (merged on November 30, 2000) and Telefônica Empresas S.A. (spun-off on January 30, 2001).
All assets, liabilities, revenues and expenses from transactions between the consolidated companies were eliminated in consolidation. Differences between net income of the Company and consolidated for the year ended December 31, 2000 are not relevant and are due to transactions recorded in the shareholders’ equity of the subsidiaries and reflected in the income of the Company, through equity pick-up, but not presented in consolidated income. 3. SUMMARY OF PRINCIPAL ACCOUNTING PRACTICES (a) Cash and Cash Equivalents--Cash equivalents are considered to be all highly liquid temporary cash investments with original maturity dates of three months or less. These investments are meant to be held until maturity and are recorded at cost, plus income accrued to the balance sheet date. (b) Trade Accounts Receivable--Telecommunication services accounts receivable are stated at the tariff amounts on the date of rendering the service. This caption also includes accounts receivable from services rendered but not billed at the balance sheet date. The allowance for doubtful accounts is based on amounts considered unrecoverable. (c) Foreign Currency Transactions--Transactions in foreign currency are recorded at the prevailing exchange rate at the time of the transaction. Foreign currency denominated assets and liabilities are translated using the exchange rate at the balance sheet date. Exchange differences are recognized in income, when incurred. (d) Inventories--Stated at average acquisition cost, net of allowance for reduction in market value, and segregated into network expansion and maintenance/sale inventories. Inventories for use in network expansion are classified as “Construction in progress” under “Property, plant and equipment”. Inventories for resale or maintenance are classified as “Inventories” in current assets.

(e) Investments--Investments in subsidiaries are carried under the equity method. In the consolidated financial statements, all subsidiaries are consolidated. Other investments are recorded at cost, less a reserve for probable losses, when considered necessary. (f) Property, Plant and Equipment--Stated at acquisition and/or construction cost, less accumulated depreciation. Improvement and repair costs when increasing installed capacity or operating life are capitalized; otherwise, these costs are charged to expense in the statements of income, as incurred. Depreciation is calculated under the straight-line method based on the estimated useful lives of the assets and as determined by the public telecommunications service regulations. The principal depreciation rates are shown in Note 18. (g) Deferred Charges--Represented by preoperating costs stated at acquisition cost for which amortization will occur after the beginning of the operations, and by merged goodwill, being amortized over a period of five years. (h) Accrued Vacations--Amounts related to vacations due to employees are accrued in proportion to the period the employee is entitled to vacation. (i) Income and Social Contribution Taxes--Corporate income and social contribution taxes are accounted for on the accrual basis. Deferred taxes attributable to temporary differences and tax loss carryforwards are recognized as assets on the assumption of future realization. (j) Reserve for Contingencies--Updated to the balance sheet date based on the probable amount of the loss, taking into consideration the nature of each contingency. The bases and nature of the reserves are described in Note 25. (k) Revenue Recognition--Revenues related to services rendered are accounted for on the accrual basis. Revenues from public telephone tokens and prepaid card sales are recorded upon sale, as well as the related costs. (l) Financial Income (Expense), Net--Represents interest, monetary and exchange variations arising from financial investments, loans and financing obtained and granted, as well as results on hedge operations. Interest on capital credited/charged is also included in this caption, and for financial statement purposes, the amounts to be paid are reversed to shareholders’ equity, as a charge to retained earnings. (m) Post-retirement Benefit Plans--The Company sponsors an entity that provides pension and other post-retirement benefits to employees through a multisponsored plan. Actuarial liabilities were calculated using the projected unit credit method, as provided by CVM Instruction No. 371/00. Other considerations related to these plans are described in Note 28. (n) Employees’ Profit Sharing--The Company recognized an accrual for employees’ profit sharing which is subject to approval at the Annual Shareholders’ Meeting.

(o) Derivatives--In exchange options, the premium paid is amortized over the period of validity of the contract, with temporary results recognized in the financial statements based on the expectation of continuation until maturity. The results and balances of derivative operations (exchange swaps and exchange options) are presented in Notes 7 and 26. (p) Earnings per Thousand Shares--Calculated based on the number of shares outstanding at the balance sheet date. 4. OPERATING REVENUE, NET
Company Consolidated 2001 2000 2001 2000
Monthly changes 3,205,500 2,214,908 3,205,500 2,252,761 Installation 242,858 171,294 242,858 171,665 Local service 2,439,430 2,071,803 2,439,430 2,110,817 Domestic long distance 3,714,981 2,967,461 3,714,981 3,016,641 --------------- ------------- --------------- ------------- Intraregional 1,208,827 1,038,957 1,208,827 1,056,523 Interregional 2,506,154 1,928,504 2,506,154 1,960,118 Use of network 1,378,209 1,198,720 1,378,209 1,229,369 Public telephone 175,948 202,643 175,948 208,944 Business communication 372,127 351,009 372,127 365,465 Sales revenue - - 50,323 29,342 Other 590,127 420,176 619,611 435,875 --------------- ------------- --------------- ------------- Gross operating revenue 12,119,180 9,598,014 12,198,987 9,820,879 Taxes on gross revenue (3,107,138) (2,361,401) (3,121,175) (2,412,015) Discounts (28,964) (99,150) (28,964) (99,181) --------------- ------------- --------------- ------------- Net operating revenue 8,983,078 7,137,463 9,048,848 7,309,683 ========= ======== ========= ========
On June 21, 2001, through Notices No. 17,149 and No. 17,150, the National Telecommunications Agency (ANATEL) approved tariff adjustments for fixed-switch telephone service (STFC), according to criteria established in the local and domestic long-distance concession contracts, effective June 24, 2001. The local basic plan had an average increase of 10.4%, including the productivity gain of 0.41%, while the maximum net tariffs for the long-distance services basic plan had an average increase of 7.75%, including the productivity gain of 2.8%, as established in the concession contract. The net amounts of other STFC services and products were adjusted 10.9% on average. On June 19, 2000, through Notices No. 9,444, No. 9,445 and No. 9,447, ANATEL approved tariff adjustments for fixed-switch telephone service (STFC), according to criteria established in the local and domestic long-distance concession contracts, effective June 22, 2000. The local basic plan had an average increase of 14.2%, while the maximum net tariffs for the long- distance services basic plan had an average increase of 11.9%, including the productivity gain of 2%, as established in the concession contract.
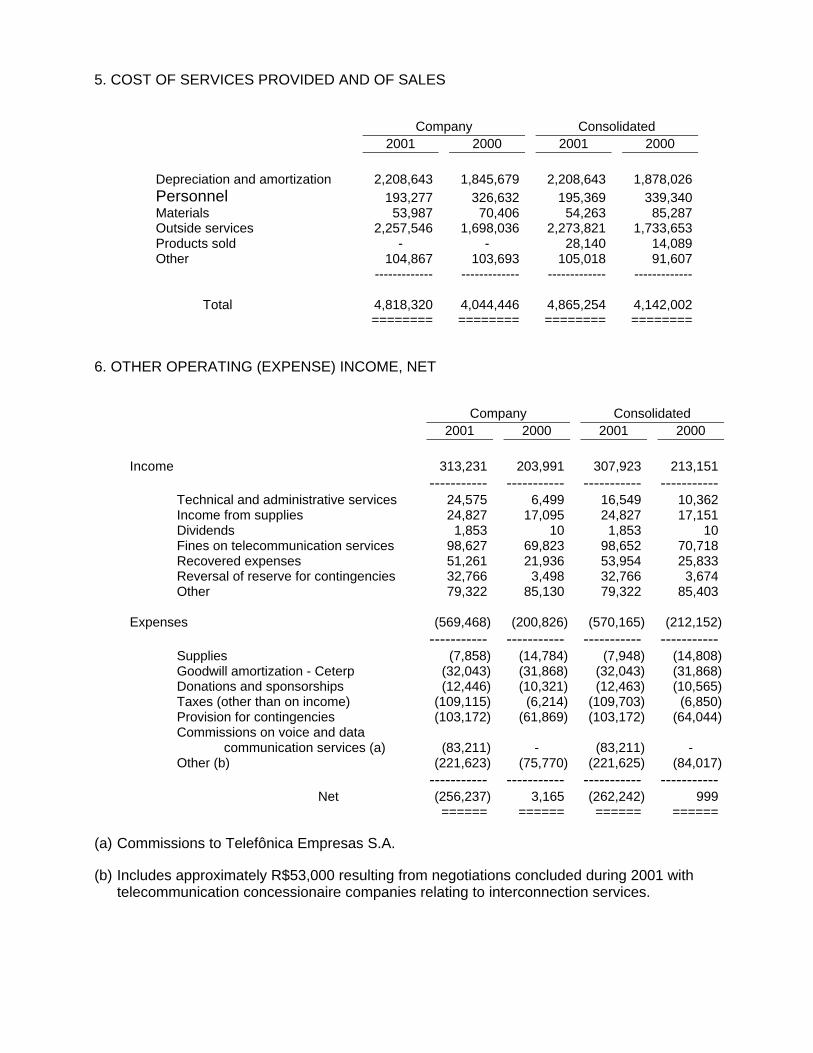
5. COST OF SERVICES PROVIDED AND OF SALES
Company Consolidated 2001 2000 2001 2000
Depreciation and amortization 2,208,643 1,845,679 2,208,643 1,878,026 Personnel 193,277 326,632 195,369 339,340 Materials 53,987 70,406 54,263 85,287 Outside services 2,257,546 1,698,036 2,273,821 1,733,653 Products sold - - 28,140 14,089 Other 104,867 103,693 105,018 91,607 ------------- ------------- ------------- ------------- Total 4,818,320 4,044,446 4,865,254 4,142,002 ======== ======== ======== ========
6. OTHER OPERATING (EXPENSE) INCOME, NET
Company Consolidated 2001 2000 2001 2000
Income 313,231 203,991 307,923 213,151 ----------- ----------- ----------- ----------- Technical and administrative services 24,575 6,499 16,549 10,362 Income from supplies 24,827 17,095 24,827 17,151 Dividends 1,853 10 1,853 10 Fines on telecommunication services 98,627 69,823 98,652 70,718 Recovered expenses 51,261 21,936 53,954 25,833 Reversal of reserve for contingencies 32,766 3,498 32,766 3,674 Other 79,322 85,130 79,322 85,403 Expenses (569,468) (200,826) (570,165) (212,152) ----------- ----------- ----------- ----------- Supplies (7,858) (14,784) (7,948) (14,808) Goodwill amortization - Ceterp (32,043) (31,868) (32,043) (31,868) Donations and sponsorships (12,446) (10,321) (12,463) (10,565) Taxes (other than on income) (109,115) (6,214) (109,703) (6,850) Provision for contingencies (103,172) (61,869) (103,172) (64,044) Commissions on voice and data communication services (a) (83,211) - (83,211) - Other (b) (221,623) (75,770) (221,625) (84,017) ----------- ----------- ----------- ----------- Net (256,237) 3,165 (262,242) 999 ====== ====== ====== ======
(a) Commissions to Telefônica Empresas S.A. (b) Includes approximately R$53,000 resulting from negotiations concluded during 2001 with
telecommunication concessionaire companies relating to interconnection services.
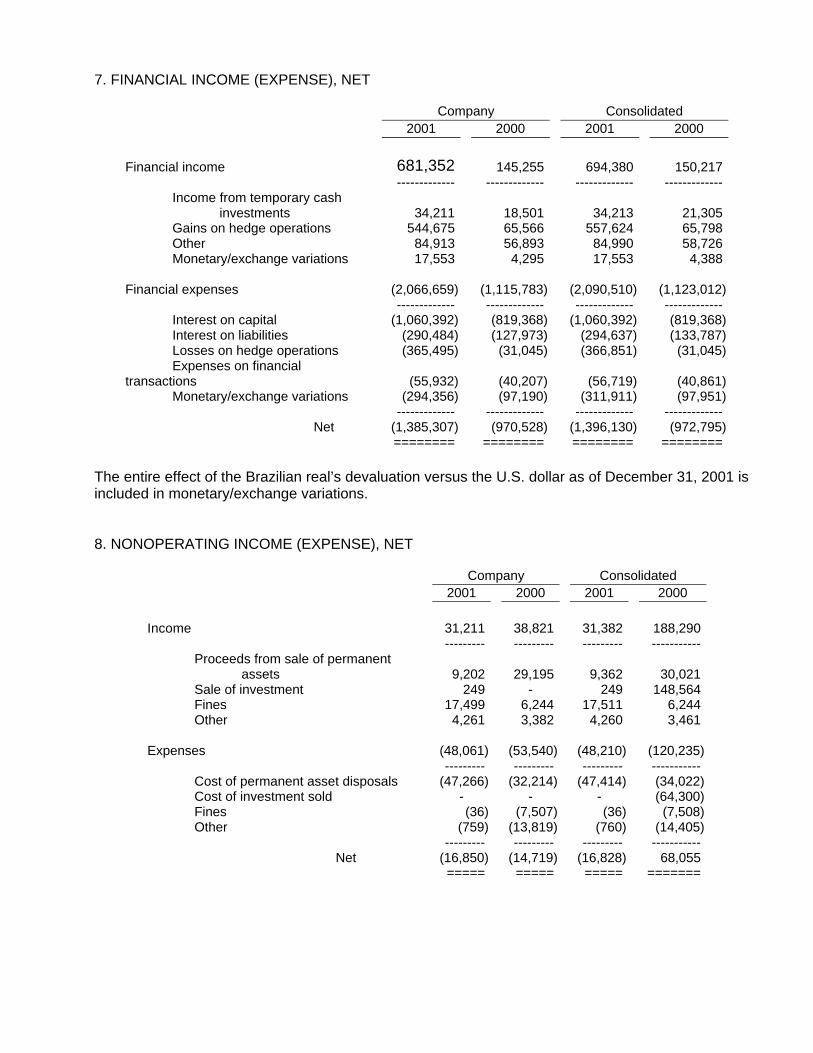
7. FINANCIAL INCOME (EXPENSE), NET
Company Consolidated 2001 2000 2001 2000
Financial income 681,352 145,255 694,380 150,217 ------------- ------------- ------------- ------------- Income from temporary cash investments 34,211 18,501 34,213 21,305 Gains on hedge operations 544,675 65,566 557,624 65,798 Other 84,913 56,893 84,990 58,726 Monetary/exchange variations 17,553 4,295 17,553 4,388 Financial expenses (2,066,659) (1,115,783) (2,090,510) (1,123,012) ------------- ------------- ------------- ------------- Interest on capital (1,060,392) (819,368) (1,060,392) (819,368) Interest on liabilities (290,484) (127,973) (294,637) (133,787) Losses on hedge operations (365,495) (31,045) (366,851) (31,045) Expenses on financial transactions (55,932) (40,207) (56,719) (40,861) Monetary/exchange variations (294,356) (97,190) (311,911) (97,951) ------------- ------------- ------------- ------------- Net (1,385,307) (970,528) (1,396,130) (972,795) ======== ======== ======== ========
The entire effect of the Brazilian real’s devaluation versus the U.S. dollar as of December 31, 2001 is included in monetary/exchange variations. 8. NONOPERATING INCOME (EXPENSE), NET
Company Consolidated 2001 2000 2001 2000
Income 31,211 38,821 31,382 188,290 --------- --------- --------- ----------- Proceeds from sale of permanent assets 9,202 29,195 9,362 30,021 Sale of investment 249 - 249 148,564 Fines 17,499 6,244 17,511 6,244 Other 4,261 3,382 4,260 3,461 Expenses (48,061) (53,540) (48,210) (120,235) --------- --------- --------- ----------- Cost of permanent asset disposals (47,266) (32,214) (47,414) (34,022) Cost of investment sold - - - (64,300) Fines (36) (7,507) (36) (7,508) Other (759) (13,819) (760) (14,405) --------- --------- --------- ----------- Net (16,850) (14,719) (16,828) 68,055 ===== ===== ===== =======
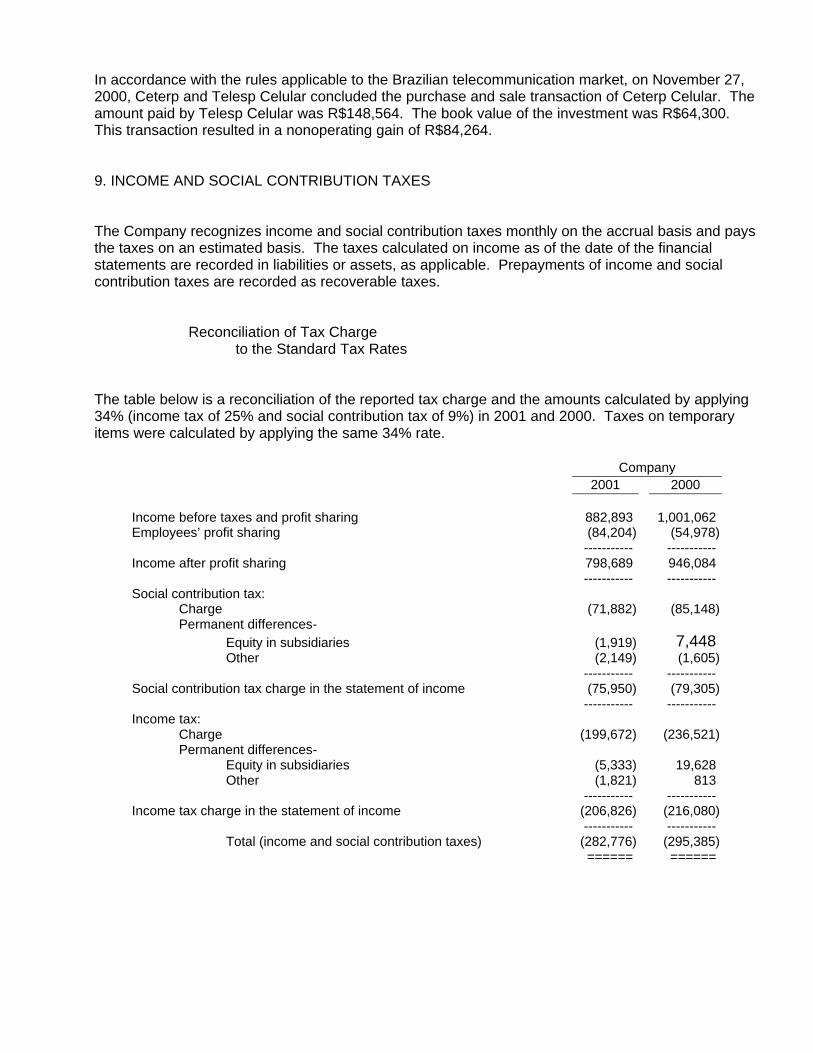
In accordance with the rules applicable to the Brazilian telecommunication market, on November 27, 2000, Ceterp and Telesp Celular concluded the purchase and sale transaction of Ceterp Celular. The amount paid by Telesp Celular was R$148,564. The book value of the investment was R$64,300. This transaction resulted in a nonoperating gain of R$84,264. 9. INCOME AND SOCIAL CONTRIBUTION TAXES The Company recognizes income and social contribution taxes monthly on the accrual basis and pays the taxes on an estimated basis. The taxes calculated on income as of the date of the financial statements are recorded in liabilities or assets, as applicable. Prepayments of income and social contribution taxes are recorded as recoverable taxes. Reconciliation of Tax Charge to the Standard Tax Rates The table below is a reconciliation of the reported tax charge and the amounts calculated by applying 34% (income tax of 25% and social contribution tax of 9%) in 2001 and 2000. Taxes on temporary items were calculated by applying the same 34% rate.
Company 2001 2000 Income before taxes and profit sharing 882,893 1,001,062 Employees’ profit sharing (84,204) (54,978) ----------- ----------- Income after profit sharing 798,689 946,084 ----------- ----------- Social contribution tax: Charge (71,882) (85,148) Permanent differences- Equity in subsidiaries (1,919) 7,448 Other (2,149) (1,605) ----------- ----------- Social contribution tax charge in the statement of income (75,950) (79,305) ----------- ----------- Income tax: Charge (199,672) (236,521) Permanent differences- Equity in subsidiaries (5,333) 19,628 Other (1,821) 813 ----------- ----------- Income tax charge in the statement of income (206,826) (216,080) ----------- ----------- Total (income and social contribution taxes) (282,776) (295,385) ====== ======
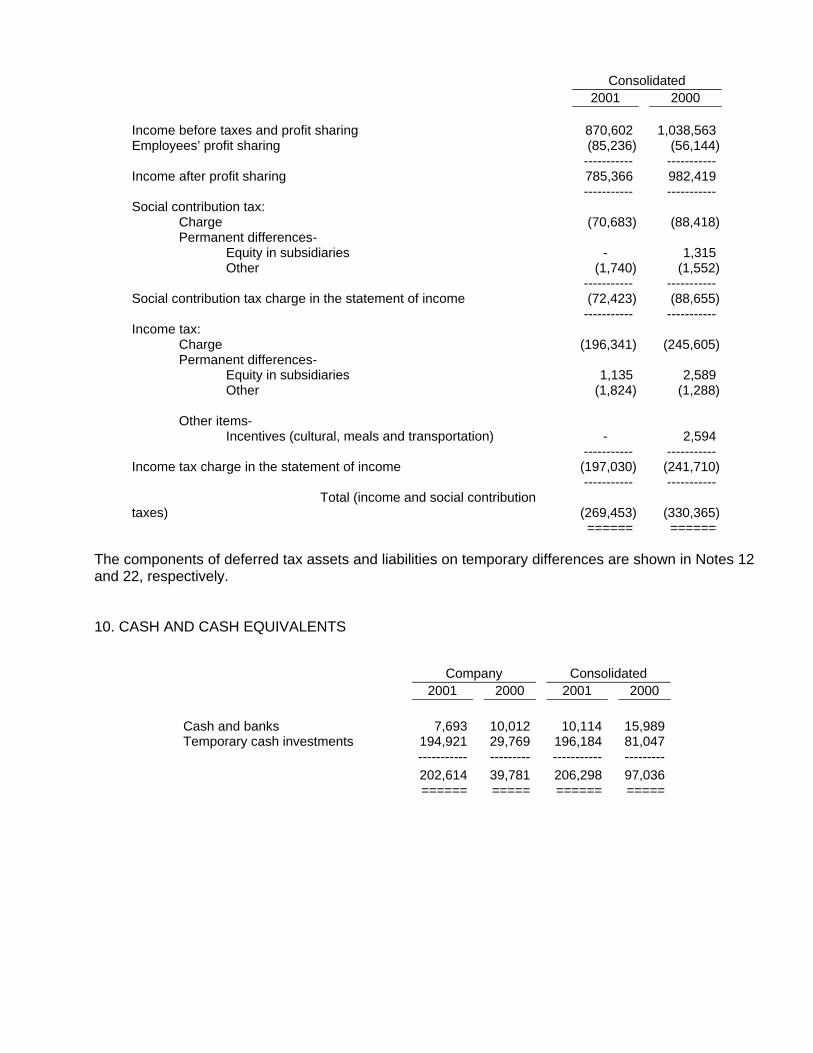
Consolidated 2001 2000 Income before taxes and profit sharing 870,602 1,038,563 Employees’ profit sharing (85,236) (56,144) ----------- ----------- Income after profit sharing 785,366 982,419 ----------- ----------- Social contribution tax: Charge (70,683) (88,418) Permanent differences- Equity in subsidiaries - 1,315 Other (1,740) (1,552) ----------- ----------- Social contribution tax charge in the statement of income (72,423) (88,655) ----------- ----------- Income tax: Charge (196,341) (245,605) Permanent differences- Equity in subsidiaries 1,135 2,589 Other (1,824) (1,288) Other items- Incentives (cultural, meals and transportation) - 2,594 ----------- ----------- Income tax charge in the statement of income (197,030) (241,710) ----------- ----------- Total (income and social contribution taxes) (269,453) (330,365) ====== ======
The components of deferred tax assets and liabilities on temporary differences are shown in Notes 12 and 22, respectively. 10. CASH AND CASH EQUIVALENTS
Company Consolidated 2001 2000 2001 2000
Cash and banks 7,693 10,012 10,114 15,989 Temporary cash investments 194,921 29,769 196,184 81,047 ----------- --------- ----------- --------- 202,614 39,781 206,298 97,036 ====== ===== ====== =====
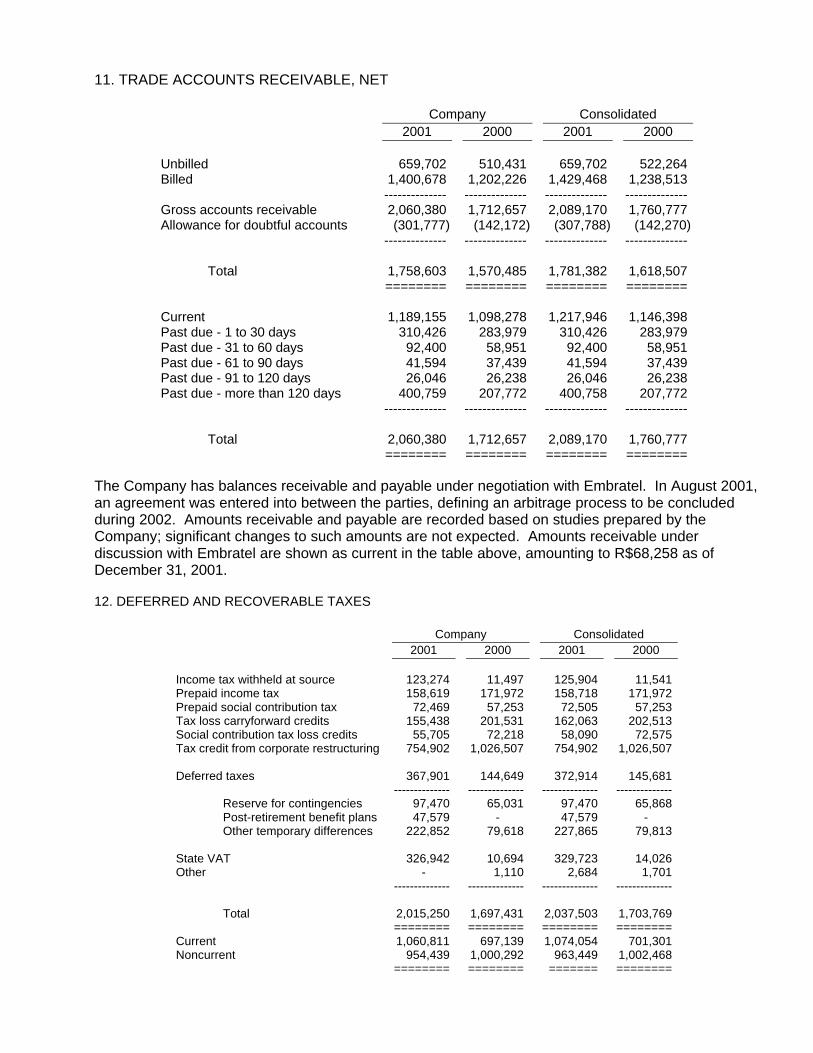
11. TRADE ACCOUNTS RECEIVABLE, NET
Company Consolidated 2001 2000 2001 2000 Unbilled 659,702 510,431 659,702 522,264 Billed 1,400,678 1,202,226 1,429,468 1,238,513 -------------- -------------- -------------- -------------- Gross accounts receivable 2,060,380 1,712,657 2,089,170 1,760,777 Allowance for doubtful accounts (301,777) (142,172) (307,788) (142,270) -------------- -------------- -------------- -------------- Total 1,758,603 1,570,485 1,781,382 1,618,507 ======== ======== ======== ======== Current 1,189,155 1,098,278 1,217,946 1,146,398 Past due - 1 to 30 days 310,426 283,979 310,426 283,979 Past due - 31 to 60 days 92,400 58,951 92,400 58,951 Past due - 61 to 90 days 41,594 37,439 41,594 37,439 Past due - 91 to 120 days 26,046 26,238 26,046 26,238 Past due - more than 120 days 400,759 207,772 400,758 207,772 -------------- -------------- -------------- -------------- Total 2,060,380 1,712,657 2,089,170 1,760,777 ======== ======== ======== ========
The Company has balances receivable and payable under negotiation with Embratel. In August 2001, an agreement was entered into between the parties, defining an arbitrage process to be concluded during 2002. Amounts receivable and payable are recorded based on studies prepared by the Company; significant changes to such amounts are not expected. Amounts receivable under discussion with Embratel are shown as current in the table above, amounting to R$68,258 as of December 31, 2001. 12. DEFERRED AND RECOVERABLE TAXES
Company Consolidated 2001 2000 2001 2000 Income tax withheld at source 123,274 11,497 125,904 11,541 Prepaid income tax 158,619 171,972 158,718 171,972 Prepaid social contribution tax 72,469 57,253 72,505 57,253 Tax loss carryforward credits 155,438 201,531 162,063 202,513 Social contribution tax loss credits 55,705 72,218 58,090 72,575 Tax credit from corporate restructuring 754,902 1,026,507 754,902 1,026,507 Deferred taxes 367,901 144,649 372,914 145,681 -------------- -------------- -------------- -------------- Reserve for contingencies 97,470 65,031 97,470 65,868 Post-retirement benefit plans 47,579 - 47,579 - Other temporary differences 222,852 79,618 227,865 79,813 State VAT 326,942 10,694 329,723 14,026 Other - 1,110 2,684 1,701 -------------- -------------- -------------- -------------- Total 2,015,250 1,697,431 2,037,503 1,703,769 ======== ======== ======== ======== Current 1,060,811 697,139 1,074,054 701,301 Noncurrent 954,439 1,000,292 963,449 1,002,468 ======== ======== ======= ========
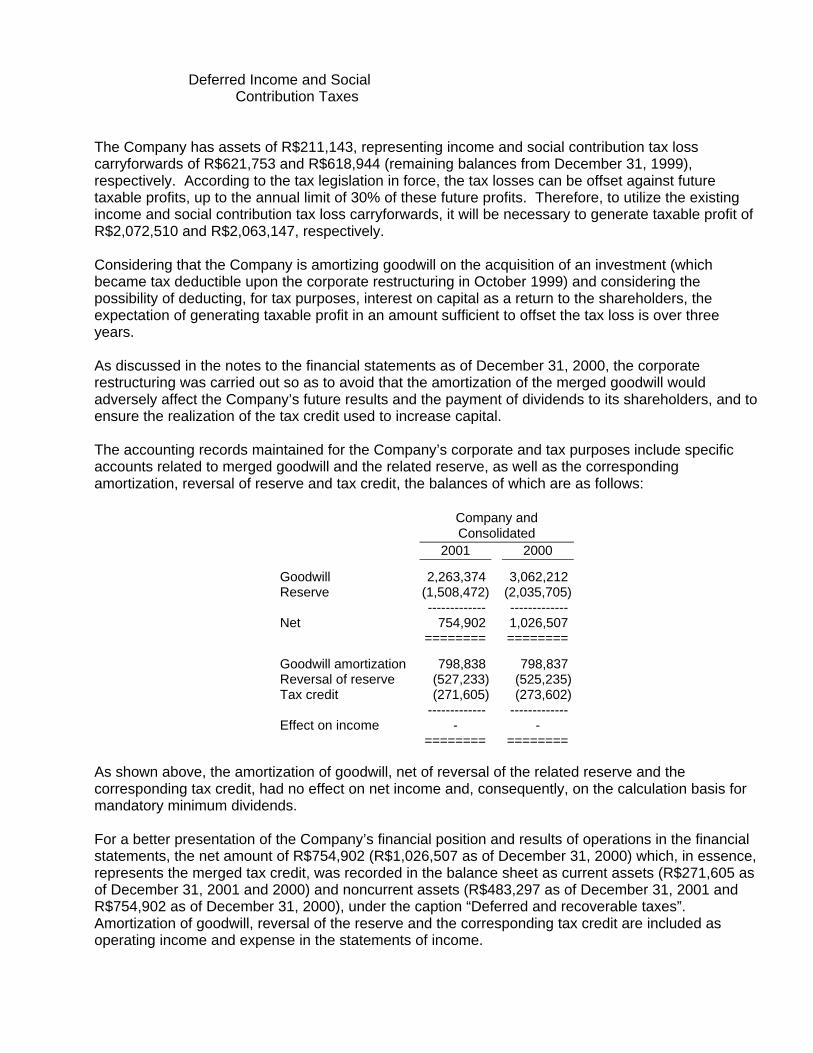
Deferred Income and Social Contribution Taxes The Company has assets of R$211,143, representing income and social contribution tax loss carryforwards of R$621,753 and R$618,944 (remaining balances from December 31, 1999), respectively. According to the tax legislation in force, the tax losses can be offset against future taxable profits, up to the annual limit of 30% of these future profits. Therefore, to utilize the existing income and social contribution tax loss carryforwards, it will be necessary to generate taxable profit of R$2,072,510 and R$2,063,147, respectively. Considering that the Company is amortizing goodwill on the acquisition of an investment (which became tax deductible upon the corporate restructuring in October 1999) and considering the possibility of deducting, for tax purposes, interest on capital as a return to the shareholders, the expectation of generating taxable profit in an amount sufficient to offset the tax loss is over three years. As discussed in the notes to the financial statements as of December 31, 2000, the corporate restructuring was carried out so as to avoid that the amortization of the merged goodwill would adversely affect the Company’s future results and the payment of dividends to its shareholders, and to ensure the realization of the tax credit used to increase capital. The accounting records maintained for the Company’s corporate and tax purposes include specific accounts related to merged goodwill and the related reserve, as well as the corresponding amortization, reversal of reserve and tax credit, the balances of which are as follows:
Company and Consolidated 2001 2000
Goodwill 2,263,374 3,062,212 Reserve (1,508,472) (2,035,705) ------------- ------------- Net 754,902 1,026,507 ======== ========
Goodwill amortization 798,838 798,837 Reversal of reserve (527,233) (525,235) Tax credit (271,605) (273,602) ------------- ------------- Effect on income - - ======== ========
As shown above, the amortization of goodwill, net of reversal of the related reserve and the corresponding tax credit, had no effect on net income and, consequently, on the calculation basis for mandatory minimum dividends. For a better presentation of the Company’s financial position and results of operations in the financial statements, the net amount of R$754,902 (R$1,026,507 as of December 31, 2000) which, in essence, represents the merged tax credit, was recorded in the balance sheet as current assets (R$271,605 as of December 31, 2001 and 2000) and noncurrent assets (R$483,297 as of December 31, 2001 and R$754,902 as of December 31, 2000), under the caption “Deferred and recoverable taxes”. Amortization of goodwill, reversal of the reserve and the corresponding tax credit are included as operating income and expense in the statements of income.

13. LOANS AND MARKETABLE SECURITIES
Company Consolidated 2001 2000 2001 2000
Repassed loans in foreign currency 4,068 3,573 4,068 3,573 Tax incentives, net of allowance 20,771 20,771 20,771 20,771 Amounts linked to National Treasury securities 6,187 5,732 6,187 5,732 Other 4 3 4 3 ===== ===== ===== ===== Total 31,030 30,079 31,030 30,079 ===== ===== ===== ===== Current 2,108 1,777 2,108 1,777 Noncurrent 28,922 28,302 28,922 28,302 ===== ===== ===== =====
14. OTHER RECOVERABLE AMOUNTS
Company Consolidated 2001 2000 2001 2000 Advances to employees 9,319 10,219 9,430 10,848 Advances to suppliers 1,350 28,333 1,790 28,333 Escrow deposits 144,182 116,552 144,207 116,552 Other advances 25,001 24,935 25,001 24,942 Other 2,680 1,032 2,699 1,033 ----------- ----------- ----------- ----------- Total 182,532 181,071 183,127 181,708 ====== ====== ====== ====== Current 38,183 113,885 38,753 114,522 Noncurrent 144,349 67,186 144,374 67,186 ====== ====== ====== ======
15. INVENTORY OF MATERIALS
Company Consolidated 2001 2000 2001 2000
Consumable stores 203,97
7 198,514 204,050 200,228 Resale items 226,269 - 246,811 3,692 Scrap 1,168 1,287 1,168 1,287 Public telephone prepaid cards 3,490 1,808 3,490 1,808 Imports in transit - - - 9,368 Allowance for reduction to market value (872) (872) (895) (872) ----------- ----------- ----------- ----------- Total 434,032 200,737 454,624 215,511 ====== ====== ====== ======

16. OTHER ASSETS
Company Consolidated 2001 2000 2001 2000 Prepaid expenses 79,929 13,688 79,935 13,690 Receivables from related companies 97,043 52,600 95,516 30,351 Other 34,863 84,694 35,224 85,549 ----------- ----------- ----------- ----------- Total 211,835 150,982 210,675 129,590 ====== ====== ====== ====== Current 109,023 110,119 108,274 110,976 Noncurrent 102,812 40,863 102,401 18,614 ====== ====== ====== ======
17. INVESTMENTS
Company Consolidated 2001 2000 2001 2000 In subsidiaries carried under the equity method 94,036 241,584 9,600 - ----------- ----------- ----------- ----------- Aliança Atlântica Holding B.V. 41,272 37,747 - - Assist Telefônica S.A. 43,164 9,972 - - Telefônica Empresas S.A. - 193,865 - - Companhia AIX de Participações 9,600 - 9,600 - Investments carried at cost 92,132 92,131 132,593 128,243 ----------- ----------- ----------- ----------- Portugal Telecom 75,362 75,362 115,823 111,474 Other companies 35,722 35,736 35,722 35,736 Other investments 3,360 3,360 3,360 3,360 Tax incentives 77,934 77,934 77,934 77,934 Allowance for losses (100,246) (100,261) (100,246) (100,261) ----------- ----------- ----------- ----------- Total 186,168 333,715 142,193 128,243 ====== ====== ====== ======

The principal financial information on the subsidiaries, as of December 31, 2001 and 2000, is as follows: 2001 2000 Aliança Assist Companhia Aliança Assist Telefônica Atlântica Telefônica AIX Atlântica Telefônica Empresas Capital 82,544 69,027 30,000 73,670 10,000 198,286 Retained earnings (accumulated deficit) - (25,863) - 1,824 (28) (4,421) ---------- ---------- ---------- ---------- ---------- ----------- Shareholders’ equity 82,544 43,164 30,000 75,494 9,972 193,865 ====== ====== ====== ====== ====== ====== Number of subscribed shares 88,148 94,000 9,600 88,148 10,000 198,286 Number of unpaid shares - (24,974) - - - - ---------- ---------- ---------- ---------- ---------- ----------- Number of paid-up shares 88,148 69,026 9,600 88,148 10,000 198,286 Number of shares owned 44,074 69,026 9,600 44,074 10,000 198,286 ---------- ---------- ---------- ---------- ---------- ----------- Common 44,074 69,026 9,600 44,074 10,000 198,286 Ownership: Common - % 50 100 32 50 100 100 Total - % 50 100 32 50 100 100 The equity pick-up of the Company is as follows:
2001 2000
Ceterp - 74,793 Aliança Atlântica 4,560 12,333 Assist Telefônica (25,890) 54 Telefônica Empresas - (4,421) --------- --------- Total (21,330) 82,759 ====== =====
On August 3, 2000, a wholly-owned subsidiary Telefônica Empresas S.A. was formed, in order to provide packet-switched data network services. On November 24, 2000, the Company made a capital increase in its wholly-owned subsidiary, in cash and through property items related to the packet-switched data network service, including the transfer of the authorization to explore this service. Net operating revenue and net loss for the period ended December 31, 2000 of Telefônica Empresas S.A. were R$9,267 and R$4,421, respectively. On January 30, 2001, as a result of a spin-off of the Company’s net assets, Telefônica Data Brasil Holding S.A. was formed, and the spun-off amount represented the investment in Telefônica Empresas S.A. The book value was based on an appraisal report prepared by a specialized company, in accordance with the provisions of corporate law, as of December 31, 2000, represented by:
Investment as of December 31, 2000 193,865 Accounts receivable from Telefônica Empresas S.A. 13,934 ----------- Spun-off amount 207,799 ======
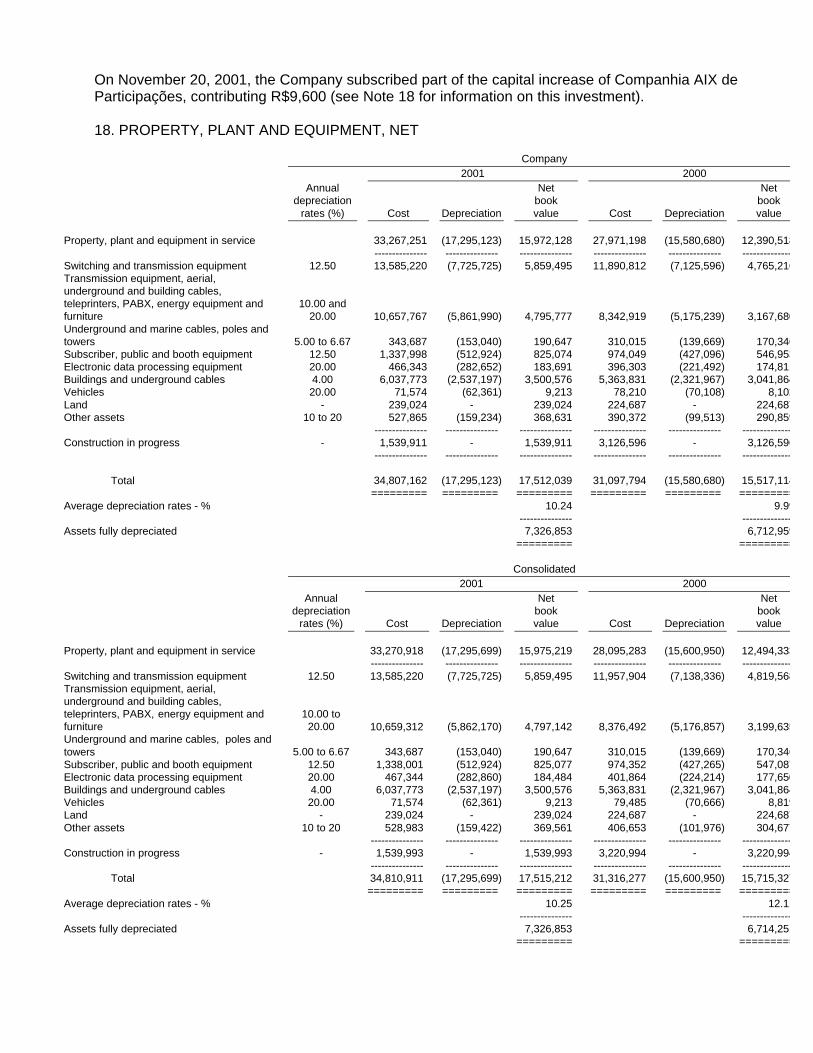
On November 20, 2001, the Company subscribed part of the capital increase of Companhia AIX de Participações, contributing R$9,600 (see Note 18 for information on this investment). 18. PROPERTY, PLANT AND EQUIPMENT, NET
Company
2001 2000 Annual Net Net depreciation book book rates (%) Cost Depreciation value Cost Depreciation value Property, plant and equipment in service 33,267,251 (17,295,123) 15,972,128 27,971,198 (15,580,680) 12,390,518 --------------- --------------- --------------- --------------- --------------- ---------------Switching and transmission equipment 12.50 13,585,220 (7,725,725) 5,859,495 11,890,812 (7,125,596) 4,765,216Transmission equipment, aerial, underground and building cables, teleprinters, PABX, energy equipment and furniture
10.00 and 20.00 10,657,767 (5,861,990) 4,795,777 8,342,919 (5,175,239) 3,167,680
Underground and marine cables, poles and towers 5.00 to 6.67 343,687 (153,040) 190,647 310,015 (139,669) 170,346Subscriber, public and booth equipment 12.50 1,337,998 (512,924) 825,074 974,049 (427,096) 546,953Electronic data processing equipment 20.00 466,343 (282,652) 183,691 396,303 (221,492) 174,811Buildings and underground cables 4.00 6,037,773 (2,537,197) 3,500,576 5,363,831 (2,321,967) 3,041,864Vehicles 20.00 71,574 (62,361) 9,213 78,210 (70,108) 8,102Land - 239,024 - 239,024 224,687 - 224,687Other assets 10 to 20 527,865 (159,234) 368,631 390,372 (99,513) 290,859 --------------- --------------- --------------- --------------- --------------- ---------------Construction in progress - 1,539,911 - 1,539,911 3,126,596 - 3,126,596 --------------- --------------- --------------- --------------- --------------- --------------- Total 34,807,162 (17,295,123) 17,512,039 31,097,794 (15,580,680) 15,517,114 ========= ========= ========= ========= ========= =========Average depreciation rates - % 10.24 9.99 --------------- ---------------Assets fully depreciated 7,326,853 6,712,959 ========= ========= Consolidated
2001 2000 Annual Net Net depreciation book book rates (%) Cost Depreciation value Cost Depreciation value Property, plant and equipment in service 33,270,918 (17,295,699) 15,975,219 28,095,283 (15,600,950) 12,494,333 --------------- --------------- --------------- --------------- --------------- ---------------Switching and transmission equipment 12.50 13,585,220 (7,725,725) 5,859,495 11,957,904 (7,138,336) 4,819,568Transmission equipment, aerial, underground and building cables, teleprinters, PABX, energy equipment and furniture
10.00 to 20.00 10,659,312 (5,862,170) 4,797,142 8,376,492 (5,176,857) 3,199,635
Underground and marine cables, poles and towers 5.00 to 6.67 343,687 (153,040) 190,647 310,015 (139,669) 170,346Subscriber, public and booth equipment 12.50 1,338,001 (512,924) 825,077 974,352 (427,265) 547,087Electronic data processing equipment 20.00 467,344 (282,860) 184,484 401,864 (224,214) 177,650Buildings and underground cables 4.00 6,037,773 (2,537,197) 3,500,576 5,363,831 (2,321,967) 3,041,864Vehicles 20.00 71,574 (62,361) 9,213 79,485 (70,666) 8,819Land - 239,024 - 239,024 224,687 - 224,687Other assets 10 to 20 528,983 (159,422) 369,561 406,653 (101,976) 304,677 --------------- --------------- --------------- --------------- --------------- ---------------Construction in progress - 1,539,993 - 1,539,993 3,220,994 - 3,220,994 --------------- --------------- --------------- --------------- --------------- --------------- Total 34,810,911 (17,295,699) 17,515,212 31,316,277 (15,600,950) 15,715,327 ========= ========= ========= ========= ========= =========Average depreciation rates - % 10.25 12.11 --------------- ---------------Assets fully depreciated 7,326,853 6,714,251 ========= =========

As of June 30, 2001, construction in progress included amounts related to advances to Barramar for cable passageway rights. In August 2001, a Private Instrument for Assignment of Credits and Other Covenants was entered into, under which credits amounting to R$94,505 of the Company are now due from Companhia AIX de Participações, payable with shares to be issued by that company; on November 20, 2001, a capital increase of R$30,000 was approved, of which R$9,600 represents the Company’s portion (see Note 17). As a result, the remaining net portion of R$84,905 is recorded as “Amounts for capitalization” in noncurrent assets. An additional balance of R$30,240 was settled by the transfer of highway passageway cable rights, and continues to be classified in the property accounts, being amortized over 20 years. 19. DEFERRED CHARGES As of December 31, 2001 and 2000, deferred charges were represented principally by the goodwill paid on the acquisition of Ceterp S.A., presented in this account due to that company’s subsequent merger. The period for amortization of the goodwill, based on the expectation of future profitability, is 60 months.
Company Consolidated 2001 2000 2001 2000
Preoperating expenses 55,537 - 55,537 - Other - - - 1,584 Merged goodwill - Ceterp S.A. 125,427 157,470 125,427 157,470 ---------- ---------- ---------- ---------- Cost 187,951 187,951 187,951 187,951 Accumulated amortization (62,524) (30,481) (62,524) (30,481) ---------- ---------- ---------- ---------- Total 180,964 157,470 180,964 159,054 ====== ====== ====== ======
Preoperating expenses refer to costs incurred during the preoperating stage for long-distance services; amortization will start when the respective service is placed in commercial operation. 20. PAYROLL AND RELATED CHARGES
Company Consolidated 2001 2000 2001 2000
Salaries and other compensation 19,27
4 24,444 19,422 26,758 Payroll charges 60,532 58,212 60,774 62,799 Benefits 14,154 16,259 14,203 17,507 --------- --------- --------- ----------- Total 93,960 98,915 94,399 107,064 ===== ===== ===== ======

21. ACCOUNTS PAYABLE AND ACCRUED EXPENSES
Company Consolidated 2001 2000 2001 2000
Suppliers 997,230 1,307,321 999,929 1,362,936 Third-party retentions 277,391 225,315 277,528 226,141 ------------- ------------- ------------- ------------- Total 1,274,621 1,532,636 1,277,457 1,589,077 ======== ======== ======== ========
22. TAXES a. Indirect Taxes
Company Consolidated 2001 2000 2001 2000 State VAT 390,424 250,739 390,970 258,601 PIS and COFINS (taxes on sales) 40,317 32,931 40,463 34,272 Other 12,661 679 14,351 716 ----------- ----------- ----------- ---------- Total - current 443,402 284,349 445,784 293,589 ====== ====== ====== ======
b. Taxes on Income
Company Consolidated 2001 2000 2001 2000
Income tax payable 130,495 148,831 130,896 148,931 Social contribution tax payable 48,348 48,884 48,490 48,927 ---------- ---------- ---------- ---------- Total 178,843 197,715 179,386 197,858 ---------- ---------- ---------- ---------- Current 135,070 53,178 135,586 53,321 Long term 43,773 144,537 43,800 144,537 ====== ====== ====== ======

23. PROFIT PARTICIPATION
Company Consolidated 2001 2000 2001 2000
Interest on capital 1,051,925 899,312 1,051,925 899,312 ------------- ------------- ------------- ------------- Telefónica S.A. 214,619 217,522 214,619 217,522 Telefónica Internacional S.A. 344,309 - 344,309 - SP Telecomunicações Holding S.A. 183,807 150,131 183,807 150,131 Tele Ibero Americana Ltda. 35,060 26,461 35,060 26,461 Minority shareholders 274,130 505,198 274,130 505,198 Dividends 11,817 94,904 11,817 94,904 ------------- ------------- ------------- ------------- SP Telecomunicações Holding S.A. - 13,738 - 13,738 Tele Ibero Americana Ltda. - 2,620 - 2,620 Minority shareholders 11,817 78,546 11,817 78,546 Employees’ profit sharing 45,206 52,191 45,554 57,774 ------------- ------------- ------------- ------------- Total 1,108,948 1,046,407 1,109,296 1,051,990 ======= ======= ======= =======
24. LOANS AND FINANCING Composition
Consolidated balance Annual as of December 31, 2001 interest Long Currency rate - % Maturity Current term Total Mediocrédito US$ 1.75 2014 7,605 80,261 87,866 CIDA CAN$ 3.0 2005 341 644 985 Comtel US$ 10.75 2004 22,425 719,324 741,749 EDC II US$ LIBOR + 1.0 2002 13,941 - 13,941 EDC III US$ LIBOR + 1.0 2002 14,716 - 14,716 Loans with related companies (Note 29) 1,032,826 - 1,032,826 Other loans in foreign currency To 2004 1,544,374 567,575 2,111,949 -------------- -------------- -------------- Total 2,636,228 1,367,804 4,004,032 ======== ======== ========

Consolidated balance Annual as of December 31, 2000 interest Long Currency rate - % Maturity Current term Total Mediocrédito US$ 1.75 2014 6,444 73,517 79,961 CIDA CAN$ 3.00 2005 306 775 1,081 Comtel US$ 10.75 2004 18,538 606,175 624,713 EDC I A US$ 11.55 2001 1,020 - 1,020 EDC I B US$ LIBOR + 1.50 2001 207 - 207 EDC II US$ LIBOR + 1.00 2002 23,586 11,733 35,319 EDC III US$ LIBOR + 1.00 2002 12,469 12,384 24,853 Other loans in foreign currency To 2001 1,131,206 - 1,131,206 -------------- ----------- -------------- Total 1,193,776 704,584 1,898,360 ======== ====== ========
The composition of other loans in foreign currency is as follows:
Consolidated balance as of Currency Annual interest rate - % December 31, 2001 Resolution No. 2,770 US$ 2.84 to 12.00 1,084,795 Resolution No. 2,770 JPY 0.80 to 4.50 253,971 Resolution No. 4,131 US$ LIBOR + 1.00 to 8.50 283,298 Import financing US$ LIBOR + 0.15 to 1.40 165,736 Debt assumption US$ LIBOR + 0.50 to 11.68 324,149 ------------- 2,111,949 ======== Consolidated balance as of Currency Annual interest rate - % December 31, 2000 Resolution No. 2,770 US$ 5.40 to 11.00 973,355 Resolution No. 4,131 JPY 1.88 138,234 Resolution No. 4,131 US$ 8.35 19,617 ------------- 1,131,206 ========
The Company has exchange hedge operations in the amount of R$4,002,163, equivalent to 99.9% of its debt in foreign currency as of December 31, 2001, including loans with related companies (see Note 29). As of that date, the Company had recorded a net gain of R$190,773 related to hedge operations, and a liability balance in the amount of R$297,911.

Loans and financing, Company and consolidated, are guaranteed by:
2001 2000
Comtel Guaranteed by Telebrás 741,749 624,713 Mediocrédito Guaranteed by Federal Government 87,866 79,961 ----------- ----------- Total 829,615 704,674 ====== ====== Current 30,030 24,982 Long term 799,585 679,692 ====== ======
25. RESERVE FOR CONTINGENCIES The Company, as an entity and also as the successor to the companies merged, and its subsidiaries are involved in labor, tax and civil proceedings filed with different courts. Company management, based on the opinion of its legal counsel, has recognized reserves for those cases where an unfavorable outcome is considered probable, as follows:
Company/ Consolidated
Nature 2001 2000 Labor 80,140 52,911 Tax 284,116 110,641 Civil 18,305 9,939 ---------- ---------- Total 382,561 173,491 ====== ====== Current 7,882 6,449 Long term 374,679 167,042 ====== ======
25.1. Labor Contingencies The Company has various labor contingencies totaling approximately R$874,509, and has accrued R$80,140 to cover probable losses. 25.2. Tax Contingencies Regarding tax issues, the following aspects should be considered: (i) the possible existence of differences as regards the interpretation of the application of taxes to certain revenue accounts; (ii) recognition of the principal taxes, pending future approval by the tax authorities, is subject to the full extinguishment of the tax obligation after the five-year expiration period from the date of such recognition; (iii) the lack of agreement in the interpretation of tax legislation may generate litigation which, if concluded by the Judiciary in favor of the taxpayer, may result in amounts receivable for the Company.
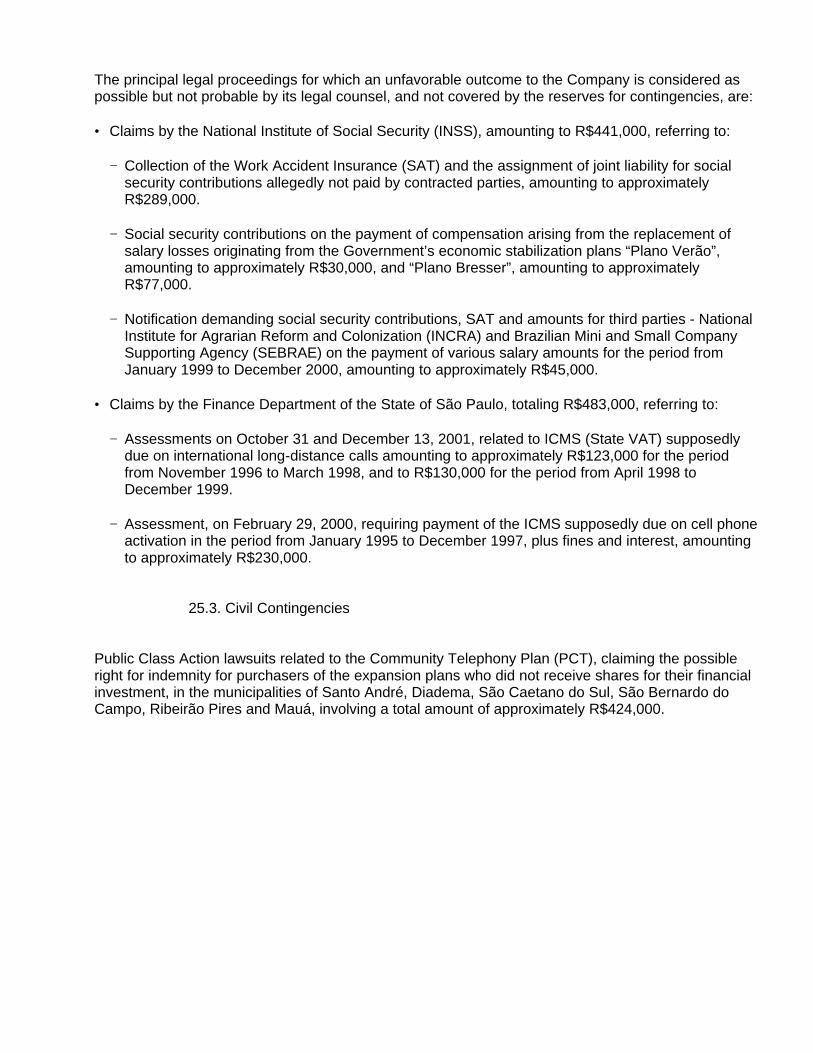
The principal legal proceedings for which an unfavorable outcome to the Company is considered as possible but not probable by its legal counsel, and not covered by the reserves for contingencies, are: • Claims by the National Institute of Social Security (INSS), amounting to R$441,000, referring to:
− Collection of the Work Accident Insurance (SAT) and the assignment of joint liability for social security contributions allegedly not paid by contracted parties, amounting to approximately R$289,000.
− Social security contributions on the payment of compensation arising from the replacement of
salary losses originating from the Government’s economic stabilization plans “Plano Verão”, amounting to approximately R$30,000, and “Plano Bresser”, amounting to approximately R$77,000.
− Notification demanding social security contributions, SAT and amounts for third parties - National
Institute for Agrarian Reform and Colonization (INCRA) and Brazilian Mini and Small Company Supporting Agency (SEBRAE) on the payment of various salary amounts for the period from January 1999 to December 2000, amounting to approximately R$45,000.
• Claims by the Finance Department of the State of São Paulo, totaling R$483,000, referring to:
− Assessments on October 31 and December 13, 2001, related to ICMS (State VAT) supposedly due on international long-distance calls amounting to approximately R$123,000 for the period from November 1996 to March 1998, and to R$130,000 for the period from April 1998 to December 1999.
− Assessment, on February 29, 2000, requiring payment of the ICMS supposedly due on cell phone
activation in the period from January 1995 to December 1997, plus fines and interest, amounting to approximately R$230,000.
25.3. Civil Contingencies Public Class Action lawsuits related to the Community Telephony Plan (PCT), claiming the possible right for indemnity for purchasers of the expansion plans who did not receive shares for their financial investment, in the municipalities of Santo André, Diadema, São Caetano do Sul, São Bernardo do Campo, Ribeirão Pires and Mauá, involving a total amount of approximately R$424,000.

26. OTHER LIABILITIES
Company Consolidated 2001 2000 2001 2000
Liabilities with related companies 149,94
0 116,669 142,884 97,856 Post-retirement benefit plans accruals 144,178 - 144,178 - Temporary losses on payables operations 297,012 - 297,911 - Other payables 49,018 99,623 49,076 103,577 ----------- ----------- ----------- ----------- Total 640,148 216,292 634,049 201,433 ====== ====== ====== ====== Current 417,969 141,012 418,926 144,968 Long term 222,179 75,280 215,123 56,465 ====== ====== ====== ======
27. SHAREHOLDERS’ EQUITY a. Capital Paid-up capital as of December 31, 2001 is R$5,640,184 (R$5,847,983 on December 31, 2000), represented by shares without par value, distributed as follows:
Outstanding shares: Common shares 165,322,469,526 Preferred shares 328,342,876,111 ----------------------- Total outstanding shares 493,665,345,637 ============= Treasury shares: Common shares 719,366,993 Preferred shares 11,014,010 ----------------------- Total treasury shares 730,381,003 ============= Total shares: Common shares 166,041,836,519 Preferred shares 328,353,890,121 ----------------------- Total 494,395,726,640 ============= Book value per thousand shares - R$ 29.73 =============
Preferred shares are nonvoting but have priority in the redemption of capital and payment of noncumulative minimum dividends of 6% of capital.

b. Capital Reserves
• Premium on subscription of shares - This reserve represents the amount exceeding book value of the shares arising from issuance or capitalization on the date of issuance.
• Donations and investment grants - Represents amounts received as donations concerning property additions resulting from plant expansion of telecommunication services.
• Other capital reserves - Represented by tax incentive investments. c. Income Reserves
• Legal reserve - This reserve is mandatorily established by the Company at 5% of annual net income, up to 20% of capital or 30% of capital plus capital reserves. Above these limits, allocation is no longer mandatory. This reserve may only be used to increase capital or to offset an accumulated deficit.
d. Retained Earnings The remaining balance of net income is included in retained earnings and will be used for future capital increases, to provide for the modernization and expansion of the telecommunications system. Under the terms of article 199 of Law No. 6,404/76, management will propose the capitalization of excess reserves from profits, at the Annual Shareholders’ Meeting. e. Special Reserve for Dividends According to the Company’s bylaws, dividends of at least 25% of adjusted net income should be distributed for each year ended December 31, provided the amounts are available. Preferred shares have priority to the annual dividend. Dividends are calculated pursuant to the Company’s bylaws and in conformity with corporate law. For 2001, dividends with the inclusion of interest on capital were calculated considering the pro rata rights of the new shares issued during the year, as follows: e.1. Statutory Minimum Dividends Calculated Based on Capital
2001 2000 Capital 5,640,184 5,847,983 -------------- -------------- Percentage of 6% for mandatory minimum dividends calculated on a pro rata basis 338,411 350,571 ======== ========

e.2. Statutory Minimum Dividends Calculated Based on Adjusted Net Income
2001 2000
Net income 1,576,30
5 1,470,067 Allocation to legal reserve (78,815) (73,503) ------------- ------------- Adjusted net income 1,497,490 1,396,564 ======== ======== Statutory minimum dividends of 25% 374,372 349,141 ------------- ------------- Common shares 125,373 116,956 Preferred shares 248,999 232,185
2001 Gross Net Dividends (interest on capital) per thousand shares - R$ 2.147997645 1.825797998 2000 Gross Net
Dividends per thousand shares - R$: Shares outstanding before the restructuring 1.660295053 1.411250795 Shares issued on the merger of Ceterp 0.138357921 0.117604233 2001 2000 Number of shares - in thousands 494,395,727 494,395,727 ----------------- ----------------- Common shares 166,041,837 166,041,837 Preferred shares 328,353,890 328,353,890
f. Interest on Capital As proposed by management, as of December 31, 2001 and 2000, interest on capital was recognized to be included in full in dividends, pursuant to article 9 of Law No. 9,249/95, net of withholding tax at source, after approval at the Annual Shareholders’ Meeting.

This was determined as follows:
2001 2000 Interest on capital 1,060,392 819,368 ------------- ----------- Common shares 355,112 275,183 Preferred shares 705,280 544,185 Withholding tax at source (159,059) (122,905) ------------- ----------- Interest on capital included in dividends 901,333 696,463 ======== ======
Exempt shareholders will receive interest on capital in full, not subject to withholding tax. In relation to the amount of R$1,060,392 of interest on capital proposed for 2001, the amount of R$346,248 is being maintained in the special reserve for dividends. Interest on capital credited in 2001 is over the minimum dividend established by the Company’s bylaws and article 202 of Law No. 6,404/76. g. Payment of Dividends Management is proposing that the balance of the “Special reserve for dividends”, recognized in 2000, in the amount of R$345,892 increased by withholding tax on exempt shares, for a total of R$346,248, be reversed and paid by the end of the year 2002, to registered shareholders as of December 31, 2000, as it is proposing the formation of a new special reserve for the payment of dividends in the amount of R$346,248, related to a portion of the dividends declared based on the financial statements as of December 31, 2001, in order to ensure the Company’s economic and financial stability. 28. POST-RETIREMENT BENEFIT PLANS Telesp, together with other companies of the former Telebrás System, sponsors private benefit plans and health care plans for retirees, managed by Fundação Sistel de Seguridade Social (Sistel). Until December 1999, all sponsors of the plans managed by Sistel were unified as to all plans then existent. On December 28, 1999, the sponsors of the plans managed by Sistel negotiated the conditions for the creation of plans separated by sponsor and the continuation of participation in the unified plans only for participants who were already retired on January 31, 2000 (PBS-A), resulting in a proposal for restructuring the statutes and regulations of Sistel, which was approved by the Supplementary Pension Plan Secretariat on January 13, 2000. Due to the break in unification in December 1999, Telesp individually sponsors a defined retirement benefit plan (PBS Telesp Plan) which covers approximately 2% of the Company’s employees. In addition to the supplemental pension benefit, health care (PAMA) is provided to retired employees and their dependents, at shared costs. Contributions for the PBS Telesp Plan are determined based on actuarial valuations prepared by independent actuaries, in accordance with the rules in force in Brazil. The method used to determine costing is the capitalization method and the contribution by the sponsoring entity is 13.5% of payroll of employees covered by the plan, of which 12% is allocated to costing of the PBS Telesp Plan and 1.5% to costing of the PAMA Plan.

For the other 98% of Telesp’s employees, there is an individual defined contribution plan - Visão Telesp Benefit Plan, established by Sistel in August 2000. The Visão Telesp Plan is supported by contributions made by the participants (employees) and by the sponsor which are credited to participants’ individual accounts. Telesp is responsible for the costing of all administrative expenses and plan maintenance, including participant’s death and disability risks. The employees participating in the defined benefit plan (PBS Telesp) were granted the option of migrating to the Visão Telesp Plan, for which the deadline was October 31, 2000. The Visão Telesp Plan was also offered to the other employees who did not participate in the PBS Telesp Plan, as well as to new employees. The Company’s contributions to the Visão Telesp Plan are equal to the employee’s, varying from 2% to 9% of salary, based on the percentage chosen by the participant. During 2001, the Company made contributions to the PBS Telesp Plan of R$216 (R$40,618 in 2000) and to the Visão Telesp Plan of R$17,534 (R$4,585 in 2000). Assist individually sponsors a defined contribution plan, similar to the Telesp Plan, the Visão Assist Benefit Plan, which covers approximately 34% of the Company’s employees. Company contributions to this plan in 2001 were R$85. As provided under CVM Resolution No. 371, of December 13, 2000, the Company elected to recognize the actuarial liabilities directly in shareholders’ equity as of December 31, 2001, net of related tax effects. Regarding the actuarial valuation of the plans, the Company established the projected unit credit method, considering the plans’ assets as of November 30, 2001, as permitted by Technical Interpretation No. 01/01 of IBRACON (Brazilian Institute of Independent Auditors), ratified by CVM. For the multisponsored plans (PAMA and PBS-A), the apportionment of the plans’ assets was made in accordance with the Company’s actuarial liabilities, in relation to the plan’s total liabilities. As of December 31, 2001, the composition of the accrual for defined pension benefit plans and the retirees’ health care plans, as well as further information required by CVM Instruction No. 371 on these plans, are shown below:
Plan 12.31.01 PBS - Telesp 4,559 PAMA 139,619 ----------- Total Company (Note 26) 144,178 Visão Assist - Equity effect (82) ----------- Total charge to shareholders’ equity 144,096 Deferred tax (47,551) ----------- Total, net of tax effects 96,545 ======

a. PBS/Visão - Telesp and Visão Assist Plan Reconciliation Between Assets and Liabilities
PBS/Visão Visão TELESP (*) Assist (*) Total actuarial liabilities 73,248 32 Fair value of assets 68,689 114 --------- ----- Liabilities (assets) recognized in balance sheet, net 4,559 (82) ===== ===
(*) Even though Visão Telesp and Visão Assist are defined contribution plans, there is an actuarial
risk of death and disability of participants, which is defrayed by the sponsors, requiring an actuarial calculation of those risks.
Projected Expense for 2002
PBS/Visão Visão TELESP Assist Cost of service 2,691 8 Interest cost 4,194 2 Expected return on assets (4,011) (7) Employees’ contributions (281) - ------- --- Total 2,593 3 ==== ==
Actuarial Assumptions
12.31.01 Rate used for present value discount of actuarial liabilities 6% per year Expected return on plan assets 6% per year Future salary increase rate 2% per year Mortality rate GAM-71 Disability mortality rate RRB1944 Disability rate RRB1944 Married active participants on retirement date 95% Number of PBS - Telesp Plan active participants 218 Number of PBS - Telesp Plan retired participants 279 Number of dependent groups of retirees - PBS - Telesp 16 Number of Visão Telesp Plan active participants 10,478 Number of Visão Telesp Plan retired participants 424 Number of dependent groups of retirees - Visão Telesp 10 Number of PBS - Assist Plan active participants 47
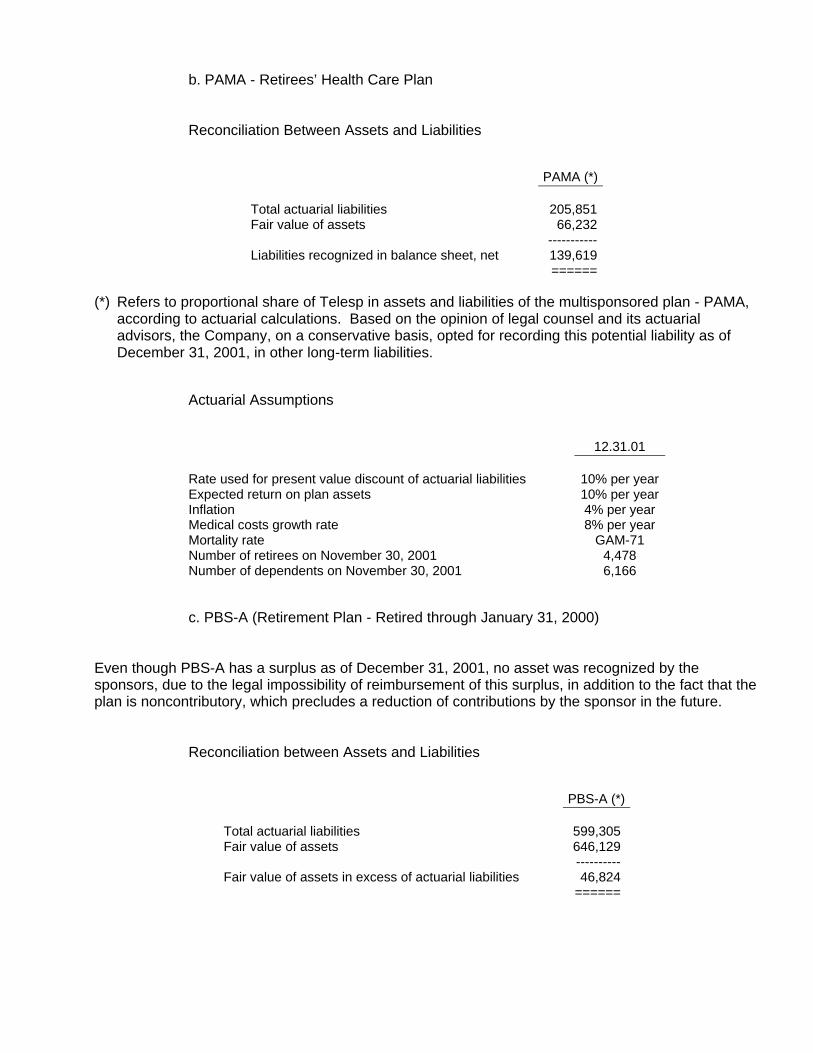
b. PAMA - Retirees’ Health Care Plan Reconciliation Between Assets and Liabilities
PAMA (*) Total actuarial liabilities 205,851 Fair value of assets 66,232 ----------- Liabilities recognized in balance sheet, net 139,619 ======
(*) Refers to proportional share of Telesp in assets and liabilities of the multisponsored plan - PAMA,
according to actuarial calculations. Based on the opinion of legal counsel and its actuarial advisors, the Company, on a conservative basis, opted for recording this potential liability as of December 31, 2001, in other long-term liabilities.
Actuarial Assumptions
12.31.01 Rate used for present value discount of actuarial liabilities 10% per year Expected return on plan assets 10% per year Inflation 4% per year Medical costs growth rate 8% per year Mortality rate GAM-71 Number of retirees on November 30, 2001 4,478 Number of dependents on November 30, 2001 6,166
c. PBS-A (Retirement Plan - Retired through January 31, 2000) Even though PBS-A has a surplus as of December 31, 2001, no asset was recognized by the sponsors, due to the legal impossibility of reimbursement of this surplus, in addition to the fact that the plan is noncontributory, which precludes a reduction of contributions by the sponsor in the future. Reconciliation between Assets and Liabilities
PBS-A (*) Total actuarial liabilities 599,305 Fair value of assets 646,129 ---------- Fair value of assets in excess of actuarial liabilities 46,824 ======

(*) Refers to proportional share of Telesp in assets and liabilities of the multisponsored plan - PBS-A, based on actuarial calculations.
Projected Expense (Income) for 2002
PBS-A Interest cost 65,104 Expected return on assets (90,043) --------- Total (24,939) =====
Actuarial Assumptions
12.31.01 Rate used for present value discount of actuarial liabilities 6% per year Expected return on plan assets 9% per year Salary increase rate 3% per year Benefit growth rate - Mortality rate UP84 with one year severity Disability rate Mercer’s indexes Number of participants 5,432
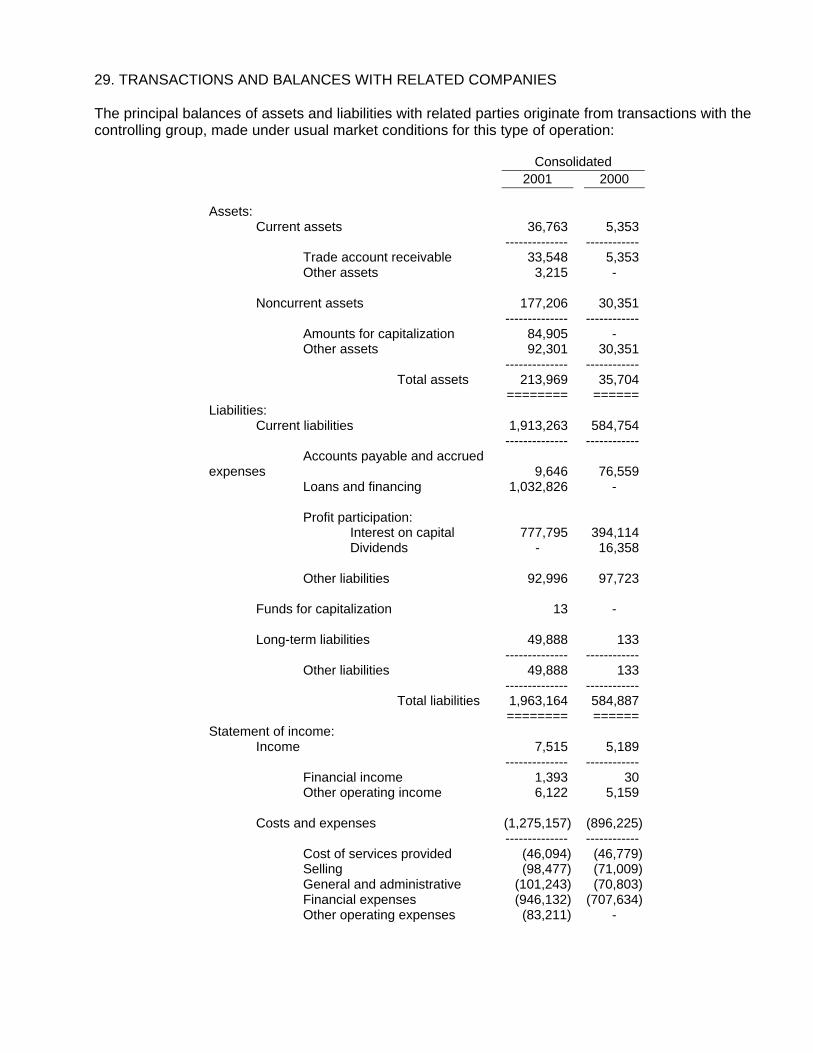
29. TRANSACTIONS AND BALANCES WITH RELATED COMPANIES The principal balances of assets and liabilities with related parties originate from transactions with the controlling group, made under usual market conditions for this type of operation:
Consolidated 2001 2000 Assets: Current assets 36,763 5,353 -------------- ------------ Trade account receivable 33,548 5,353 Other assets 3,215 - Noncurrent assets 177,206 30,351 -------------- ------------ Amounts for capitalization 84,905 - Other assets 92,301 30,351 -------------- ------------ Total assets 213,969 35,704 ======== ====== Liabilities: Current liabilities 1,913,263 584,754 -------------- ------------ Accounts payable and accrued expenses 9,646 76,559 Loans and financing 1,032,826 - Profit participation: Interest on capital 777,795 394,114 Dividends - 16,358 Other liabilities 92,996 97,723 Funds for capitalization 13 - Long-term liabilities 49,888 133 -------------- ------------ Other liabilities 49,888 133 -------------- ------------ Total liabilities 1,963,164 584,887 ======== ====== Statement of income: Income 7,515 5,189 -------------- ------------ Financial income 1,393 30 Other operating income 6,122 5,159 Costs and expenses (1,275,157) (896,225) -------------- ------------ Cost of services provided (46,094) (46,779) Selling (98,477) (71,009) General and administrative (101,243) (70,803) Financial expenses (946,132) (707,634) Other operating expenses (83,211) -

Accounts receivable refer to receivables for telecommunications services, principally from Atento Brasil S.A., Telefônica Empresas S.A., Terra Networks Brasil S.A., Emergia Brasil Ltda. and Telefônica Gestão de Serviços Compartilhados do Brasil Ltda. Other current and noncurrent assets are composed principally of receivables from Telefônica Empresas S.A., Telefónica Internacional S.A., Telefónica S.A., Tele Sudeste, Emergia Brasil Ltda., Telefônica Publicidade e Informação Ltda., Telefônica Gestão de Serviços Compartilhados do Brasil Ltda., Companhia AIX de Participações and other companies of the Group, for services rendered, consulting fees, salaries, travel and other expenses paid by the Company, to be reimbursed by the respective companies. Amounts for capitalization comprise an advance for a future capital increase in Companhia AIX de Participações (see Notes 17 and 18). Loans and financing are composed by loans from: a. Telefónica S.A., guaranteed by Telefónica Internacional S.A.
Contract Annual US$ R$ date Maturity interest rate - % (thousands) December 2001
05.22.01 05.21.02 LIBOR + 2.715 220,000 513,596 06.18.01 06.17.02 LIBOR + 2.715 40,000 93,049 08.31.01 08.31.02 LIBOR + 2.715 12,000 27,981 ----------- ----------- 272,000 634,626 ====== ======
b. Telefónica Internacional S.A.
Contract Annual US$ R$ date Maturity Interest rate - % (thousands) December 2001
12.20.01 12.20.02 LIBOR + 3 171,304 398,200
Other payables in current and long-term liabilities are composed of amounts payable for consulting and commissions with Telefónica Internacional S.A., telephone book production services from Telefônica Publicidade e Informação Ltda., administrative services for accounting, financial, human resources, assets, logistics and computer technology from Telefônica Gestão de Serviços Compartilhados do Brasil Ltda., voice communication and data services from Telefônica Empresas S.A. and call center services from Atento Brasil S.A. The cost of services provided and selling expenses refer mainly to services provided by Atento Brasil S.A., related to customer service and administrative services rendered by Telefônica Gestão de Serviços Compartilhados do Brasil Ltda. General and administrative expenses refer principally to consulting services provided by Telefónica Internacional S.A. and administrative services rendered by Telefônica Gestão de Serviços Compartilhados do Brasil Ltda. Financial expenses are represented principally by exchange variations arising from the loans with Telefónica S.A., as well as expenses for interest on capital.

Other operating expenses refer to commissions on voice services and data communications rendered by Telefônica Empresas S.A. 30. COMMITMENTS a. Capital Expenditures (*) The capital expenditure budget for 2002, amounting to R$1,800,000, was submitted for approval by the Board of Directors, for subsequent ratification at the Annual Shareholders’ Meeting, in conformity with article 196 of Law No. 6.404/76. (*) Unaudited. b. ANATEL Commitments Quality and universalization targets for fixed switch telephone service are available to follow the Company at ANATEL’s website: www.anatel.gov.br. 31. INSURANCE (*) Telefônica Gestão de Serviços Compartilhados do Brasil Ltda., through the Group’s broker, presently contracts and manages all insurance policies for the Company. The principal policies cover: • Operating risks, covering physical damages and business interruption for the entire plant. • General civil liability (RCG) and car fleet (RCF-V). • ANATEL guarantee insurance. • Other risks. • Domestic and international freight. • Group life insurance. • Health insurance. The policy of the Company and its subsidiaries, as well as of Group Telefónica, includes the maintenance of insurance coverage for all assets and responsibilities involving significant amounts and high risks according to management’s judgment, following Telefónica S.A.’s corporate program guidelines. (*) Unaudited.

32. FINANCIAL INSTRUMENTS In compliance with the terms of CVM Instruction No. 235/95, the Company and its wholly-owned subsidiary made an evaluation of the book values of their assets and liabilities in relation to market values, based on available information and appropriate valuation methodologies. However, the interpretation of market information, as well as the selection of methodologies, requires considerable judgment and reasonable estimates in order to produce adequate realization values. As a result, the estimates presented do not necessarily indicate the amounts which might be realized in the current market. The use of different market approaches and/or methodologies for the estimates may have a significant effect on the estimated realizable values. The Company has investments carried under both the cost and equity methods. The net assets of the subsidiary, Aliança Atlântica, are represented principally by an equity participation of 0.25% in the company Portugal Telecom. Additionally, the Company has a direct interest of 0.75% in that company, carried under the cost method. The investment, at market value, is based on the last quotation of 2001 at the Lisboa Stock Exchange for Portugal Telecom, equivalent to 8.75 euros (11.75 euros in 2000):
Consolidated 2001 2000 Book Market Book Market value value value value
Portugal Telecom - direct interest 75,362 139,112 75,362 167,047 Portugal Telecom - indirect interest through Aliança Atlântica 40,461 47,057 36,112 55,682 ----------- ----------- ----------- ----------- Total 115,823 186,169 111,474 222,729 ====== ====== ====== ======
The principal market risk factors that affect the Company’s business are detailed below: a. Exchange Rate Risk This risk arises from the possibility that the Company may incur losses due to exchange rate fluctuations, which would increase the balances of loans and financing denominated in foreign currency and related financial expenses. To reduce this type of risk, the Company enters into hedge contracts (swaps and options) with financial institutions. The Company’s indebtedness and the results of operations are significantly affected by foreign exchange rate risk. As of December 31, 2001, all the Company’s debt was denominated in foreign currency (U.S. dollars, Canadian dollars and Japanese yen), and 100% of the indebtedness was covered by asset positions for exchange hedge operations (swaps based on interbank deposit rates - CDIs and options). Hedge operations were made to fully cover the future maturities of the debts in foreign currency, subject to LIBOR, and fixed or variable interest. Gains or losses on these operations are recorded in income. In 2001, these transactions generated a consolidated gain of R$190,773, with a liability on December 31, 2001 of R$297,911 to recognize temporary losses.

As of December 31, 2001 and 2000, the Company’s net exposure to exchange rate risk, at book and market values, is as follows:
Consolidated 2001 2000 Book Market Book Market value value value value Loans and financing 4,004,032 4,090,102 1,898,360 1,895,933 Asset position on swaps 2,974,226 3,077,006 1,786,144 1,829,419 Asset position on options 1,027,937 (*) 68,439 ------------- ------------- Net exposure 1,869 43,777 ======== ========
(*) As of December 31, 2001, the Company had US$443,300,000.00 of notional amounts for various
options operations, including calls, call spreads and “informal desk operations”. On that date, the market value of the options operations was an asset of R$23,600 in case the Company was to cancel while the asset book value was R$32,600. The Black & Scholes model was used in the valuation of options at market value.
The valuation method used to calculate the market value of loans, financing and hedge instruments was the discounted cash flow method, considering settlement or realization expectations of liabilities and assets, at market rates prevailing on the balance sheet date. b. Interest Rate Risk This risk originates from the possibility that the Company may incur losses due to interest rate fluctuations, which would increase the financial expenses related to loans and financing obtained in the foreign market. The Company has not made any derivative hedge operation to protect itself from this risk. However, the Company continually monitors market interest rates, aiming at evaluating the possible need for a derivative operation, so as to protect itself against the risk of volatility in these rates. As of December 31, 2001, the Company had R$4,004,032 in loans and financing, of which R$2,198,023 bore interest at fixed rates and R$1,806,009 bore interest at floating rates (LIBOR). Although part of the debt was contracted at fixed rates, the entire debt was effectively converted to floating rates, as a result of swap contracts for CDIs. The Company invests its excess cash and temporary cash investments of R$206,298 as of December 31, 2001, mainly in short-term instruments, based on the CDI. The book value of these instruments approximates market value, due to their short-term maturity. The potential annual loss for the Company generated by a hypothetical and instantaneous unfavorable change of 1% in the interest rates applicable to its financial assets and liabilities as of December 31, 2001 would be approximately R$41,000. Another risk to which the Company is exposed is the nonmatching of the monetary restatement indices for its debt and for accounts receivable. Telephone tariff adjustments do not necessarily follow increases in local interest rates, which affect the Company’s debt.

c. Debt Acceleration Risk The Company’s loan and financing agreements contain clauses that, if not observed, allow the creditor to accelerate the maturities. The spin-off from Telebrás on May 22, 1998, and the privatization of the Company constituted an event of noncompliance with the contractually established obligations (“default”). As of December 31, 2001, COMTEL’s debt in the amount of R$741,749 was in this condition, and the Company is currently under negotiation with its creditors. Although none of the creditors has so far requested the debt acceleration, it cannot be assured that the Company will obtain waivers or that the creditors will not enforce their rights regarding such noncompliance. d. Credit Risk This risk arises from the possibility that the Company may incur losses from the difficulty of receiving amounts billed to its customers. The credit risk on accounts receivable is diversified. To reduce this type of risk, the Company performs credit analysis to assist in managing the risk of default, and limit the indebtedness, interrupting access to telephone lines in case the customer does not pay the related bills in 30 days. Exceptions are made for telecommunications services that should be maintained for security or national defense reasons. As of December 31, 2001, the Company’s customer portfolio had no records for subscribers whose receivables were, individually, higher than 1% of the total accounts receivable from services. 33. EXPLANATION ADDED FOR TRANSLATION TO ENGLISH The accompanying financial statements are presented on the basis of accounting practices emanating from corporate law in Brazil. Certain accounting practices applied by the Company and its subsidiaries that conform with those accounting practices in Brazil may not conform with generally accepted accounting principles in the countries where these financial statements may be used.
* * * * * * * * * * * * L2094.DOC