Embed Size (px)
Citation preview

Staff Working Paper ERSD-2006-10 November 2006
World Trade Organization Economic Research and Statistics Division
Telecommunications Services in Africa: The Impact of Multilateral Commitments and Unilateral Reform on Sector Performance and
Economic Growth
Alexander Keck WTO
Calvin Djiofack-Zebaze PhD candidate (CERDI)
Manuscript date November 2006
Disclaimer: This is a working paper, and hence it represents research in progress. This paper represents the opinions of the authors, and is the product of professional research. It is not meant to represent the position or opinions of the WTO or its Members, nor the official position of any staff members. Any errors are the fault of the authors. Copies of working papers can be requested from the divisional secretariat by writing to: Economic Research and Statistics Division, World Trade Organization, Rue de Lausanne 154, CH 1211 Geneva 21, Switzerland. Please request papers by number and title.

2

3
Telecommunications Services in Africa: The Impact of Multilateral Commitments and Unilateral Reform on Sector Performance and Economic Growth
Calvin Djiofack-Zebaze* and Alexander Keck§
November 2006
Abstract This paper examines the impact of telecommunications liberalization in Africa on both sectoral performance and economic growth. Besides unilateral measures, we account for WTO commitments fostering the credibility of reforms. Actual regulatory quality plays a major role in bringing down prices and in improving access to telecommunication services in Africa. Competition, notably in the mobile telephony segment, also improves sector performance. Increasing access to mobile networks by 1 per cent translates into a 0.5 per cent increase in real GDP per capita. In Africa, multilateral commitments do not reflect recent reforms. However, at the global level, adherence to the WTO Reference Paper entails lower prices. Keywords: Telecommunications services, liberalization, Africa, WTO, GATS. JEL classification: F13, L96, C23, O55, O14.
* PhD candidate, Centre d’Etudes et de Recherches sur le Développement International (CERDI),
University of Clermont-Ferrand, 65 Boulevard F. Mitterand, Boite postale 320, 63009 Clermont-Ferrand, France, e-mail: [email protected].
§ Counsellor, Economic Research and Statistics Division, World Trade Organization (WTO), 154 Rue de Lausanne, 1211 Geneva 21, Switzerland, e-mail: [email protected].
Disclaimer and acknowledgements: The opinions expressed in this paper should be attributed to the authors. The paper is not meant to represent the positions or opinions of the WTO and its Members, nor the official position of any staff members, and it is without prejudice to Members' rights and obligations under the WTO.
The authors would like to thank Stéphane Calipel, Jaime De Melo, Hildegunn Kyvik Nordås, Patrick Low, Stephen Tokarick, Lee Tuthill as well as participants at the Global Trade Analysis Project (GTAP) Annual Conference 2006 for their comments on earlier drafts of the paper. All remaining errors and omissions are the fault of the authors.

4
I. INTRODUCTION .................................................................................................................... 5 II. TELECOMMUNICATION SERVICES AND THE GATS ................................................. 5 III. TELECOMMUNICATIONS LIBERALIZATION IN AFRICA......................................... 7 IV. LIBERALIZATION INDICATORS..................................................................................... 10 V. MODEL AND DATA ............................................................................................................. 11 A. EMPIRICAL MODELS................................................................................................................... 11 1. Sectoral performance regressions.......................................................................................... 12 2. Growth regressions ................................................................................................................. 14 B. DATA ......................................................................................................................................... 16 VI. RESULTS ................................................................................................................................ 17 A. PRICE......................................................................................................................................... 19 1. Openness to competition......................................................................................................... 20 2. Regulation................................................................................................................................ 20 B. PENETRATION............................................................................................................................ 21 1. Openness to competition......................................................................................................... 21 2. Regulation................................................................................................................................ 22 C. GROWTH.................................................................................................................................... 22 VII. CONCLUSIONS ..................................................................................................................... 23

5
I. INTRODUCTION
The United Nations Millenium Declaration has identified access to information and communication technologies (ICT) in general and telecommunications in particular as a goal in itself and as a key instrument in achieving some of the other objectives (ITU, 2004). A dynamic telecommunications sector plays an important role in economic development both in terms of employment creation (Hodge and Njinkeu, 2002) and as an input in the production of other goods and services (Doumbouya and ILEAP, 2004). This is certainly the case in African countries, where, especially since 2000, the telecommunications sector has boomed, in particular in the mobile telephony and internet market segments. While up to 1995, there were less the 10 million mobile phone users in Africa, more than 13 million joined African networks in 2003 alone, carrying the total number of users to about 52 million. ITU (2004) estimates that African telecommunications operators in 2003 realized more than $10 billion in revenues and about $1 billion in earnings. To a large extent, these developments are a consequence of telecommunications reforms carried out over the last seven or eight years. Many African countries abolished traditional monopolies, privatized state-owned firms, allowed new telecommunications operators (at least partially) to compete and created a regulatory authority overseeing developments in the sector. The reforms led to a considerable expansion of the types of services offered, such as pre-paid cards and GSM technology (ITU, 2004). Despite these encouraging developments the African telecommunications sector continues to lack behind other regions. According to ITU (2004) data for 2003, mobile phone penetration in Africa was about 6 per cent compared to a global average of 22 per cent. Furthermore, telecommunication charges remain higher than the world average, and more than half of the population in Sub-Saharan Africa (SSA) are not covered by mobile networks, the lowest share of all regions in the world. So far, the unilateral reform efforts by African countries have not translated into significant liberalization commitments under the WTO General Agreement on Trade in Services (GATS) or a stronger involvement in the ongoing services negotiations under the Doha Development Agenda which is in its final stage. At this juncture, we consider it to be particularly important to determine to which extent multilateral commitments to liberalization and further reform can be expected to enhance the performance of the African telecommunications sector. With this objective in mind, the paper is structured as follows: The next Section briefly describes the definition and categorization of telecommunication services under the GATS. Section III characterizes the situation of the telecommunications sector in Africa. The fourth Section introduces our liberalization indicators, while Section V explains our empirical models and data. The main Section (Section VI) discusses the results we obtain regarding the impact of multilateral commitments and unilateral reform of telecommunications services in Africa on sectoral performance and economic growth. The final Section concludes. II. TELECOMMUNICATION SERVICES AND THE GATS
Telecommunication services can be categorized in several ways: Firstly, they can be sub-divided into basic and value-added telecommunications. Basic telecommunications include all telecommunication services, both public and private that involve end-to-end transmission of customer-supplied information, i.e. voice telephone services, packet-switched data transmission services, circuit-switched data transmission services, telex services, telegraph services, facsimile services, private leased circuit services and other services, such as analogue/digital cellular/mobile telephone services, mobile data services, paging, etc. Value-added telecommunication services are telecommunications for which suppliers “add value” to the customer's information by enhancing its form or content or by providing for its storage and retrieval, for instance on-line data processing, on-line data base storage and retrieval, electronic data interchange, email and voice mail.1 This distinction is based on the GATS Services Sectoral Classification List (MTN.GNS/W/120), which breaks down
1 See http://www.wto.org/english/tratop_e/serv_e/telecom_e/telecom_coverage_e.htm.

6
telecommunications services into 14 sub-sectors (a.- n.) and an "other" category (o.). Sub-sectors a. through g. of this list, as well as a variety of "other" services, including mobile communications usually listed under sub-sector o., are generally considered basic telecommunication services. Sub-sectors h. through n. and any "other" services, not supplied on a real-time basis or which transform the form or content of customer's information, are considered value-added telecommunication services.2 Rapid technological advances soon proved the existing GATS classification to be inadequate. During the negotiations on basic telecommunications (which took place after the end of the Uruguay Round) use of the GATS classification list was supplemented with the following four categories: a) geographic distinctions - local, domestic long distance, and international; b) means of technology - wire-based (or fixed infrastructure) and wireless (or radio-based); c) means of delivery - on a resale basis or facilities-based; and d) clientele - for public use, for non-public use (e.g. services sold to closed user groups). These categories have been used, as necessary, to define the scope of a commitment or to indicate different levels of commitments depending on the category concerned. The absence of these category indications signals that the commitment encompasses all possible categories (so-called "technological neutrality" of commitments) (WTO document S/C/W/74). Finally, a distinction can be made according to the mode of supply, like for other services. The GATS distinguishes four modes of supply. Telecommunication services are mostly concerned with modes 1 to 3.3 Mode 1 (cross-border supply) covers, for instance, incoming international phone calls: A telephone operator in, say, Cameroon, "imports" a cross-border service by allowing foreign suppliers to terminate international calls in its territory. Telecommunications services can also be traded cross border via satellite and leased lines (e.g. the internet). Services such as international simple resale, call back and mobile roaming may be considered mode 2 (consumption abroad), or at least a combination of modes 1 and 2. Businesses, as opposed to individuals, may also "consume" abroad when they purchase leased lines in other markets or use international capacity trading to buy minutes from a capacity wholesaler in another market. Hence, limitations on modes 1 and 2, when they exist, often restrict incoming traffic from "bypassing" the facilities-based operator, e.g. when new forms of services, such as voice resale and voice over internet, are not yet permitted. Mode 3 (commercial presence) refers to the establishment of foreign-owned subsidiaries to deliver telecommunications services. Mode 3 commitments may permit foreign companies entry to supply the full gamut of telecommunications services, including outgoing international services, or may permit their participation in only certain services. With the disengagement of governments in the telecommunications sector in Africa in the mid-1990s, foreign companies provided large part of the necessary investment and technological innovations, in particular in the market for mobile telephony, where almost 90 per cent of firms are controlled by foreigners (ITU, 2004). Typical restrictions on mode 3 refer to foreign ownership limitations, limits on the number of suppliers (e.g. monopolies or duopolies) and connectivity policies in relation to networks used to supply closed user group services. All WTO Members are subject to the general provisions of the GATS, notably various transparency obligations. In addition, each Members is bound by its own schedule, which may contain commitments on both value-added telecommunications services (mostly made during the Uruguay Round) and basic telecommunication services (mostly negotiated after the Uruguay Round). Commitments are specified in terms of sub-sectors and modes of supply. In the case of basic telecommunications, liberalization commitments sometimes make reference to the "technology" categories discussed above. A range of WTO Members with commitments on basic telecommunications made additional commitments on regulatory disciplines. Most of them did so by committing to some or all aspects of the so-called "Reference Paper". The Reference Paper contains a
2 While basic telecommunications, notably telephone services, have traditionally been of principal
interest for the African continent, increased attention has recently been paid to value-added services owing to the rapid expansion of the internet.
3 Discussions on mode 4 (temporary movement of natural persons) are more concerned with a number of general issues, such as visa policies, than with sector-specific restrictions.

7
set of principles covering regulatory matters such as competition safeguards, interconnection guarantees, transparent licensing processes and the independence of regulators.4 III. TELECOMMUNICATIONS LIBERALIZATION IN AFRICA
Traditionally, telecommunication systems in Africa were run by the government. The existing telecommunications infrastructure of the colonial area was inherited by the state after its independence. Public ownership of the telecommunications sector also squared with the economic thinking of the 1970s, which favoured large investments in key sectors that were expected to stimulate economic growth. Telecommunications in Africa were often under the control of a specifically created ministry or, for instance in Gabon, due to their "particular strategic importance", they were part of the Ministry of Defence (Ebang and ILEAP, 2005). The debt crisis of the 1980s exposed the poor management of many publicly-owned enterprises. In addition, technological innovations undermined existing protection.5 Numerous privatization and liberalization initiatives were undertaken in the context of structural adjustment programmes by the IMF and World Bank. Some of these developments even led to a coordination of efforts at the sub-regional level, like in the case of the Southern African Development Community (SADC).6 Figure 1 and Figure 2 illustrate the evolution from state monopolies to a more liberal market environment in the African telecommunications sector for both fixed and mobile telephony. Between 1995 and 2004, the share of African countries maintaining a state monopoly in the mobile segment has dropped from 70 per cent to less the 10 per cent. Liberalization in the fixed-line segment has been somewhat slower, but progress has been made over the last five years. While all fixed operators in 1995 were state monopolies, this was still the case in only 44 per cent of African countries by 2004. Table 1 characterizes the level of liberalization in individual African countries in 2004 in terms of the level of competition in different market segments - i.e. mobile telephony, fixed telephony (local, domestic long distance, international) and internet - and the status of the regulatory authority. In short, competition in most African telecom regimes only began to be introduced around the year 2000. Yet, by 2004, Africa had gone from a continent of monopoly control over fixed services to one in which less than half of countries still maintained these monopolies. A number of governments, however, initiated duopolies in fixed telephony, rather than full competition. In mobile telephony, by 2004, the proportion of African countries maintaining monopoly service had shrunk dramatically. In practice, it is not uncommon for an African country to have 3 to 4 suppliers of mobile services. As the monopolies were opened up, foreign investment was generally permitted at one level or another, both in the former monopoly as well as in the new entrant fixed and mobile providers. Formal liberalization of non-facilities based telephony, such as international simple resale and voice over Internet calls, has yet to take hold in Africa, but most countries have now opened up value-added services, such as e-mail and data base access, to competitive forces. In the course of the post-2000 liberalization, African countries have been able to draw on the work of regional and international telecom organizations and secure aid to hire regulatory experts. As a result, the new regulatory frameworks put in place tend to be largely consistent with notions of best practice in the sector, as well as the WTO Reference Paper.
4 See http://www.wto.org/english/tratop_e/serv_e/telecom_e/tel23_e.htm. 5 Modern switching techniques, for instance, led to the spread of call-back services. Call-backs allow
users to circumvent higher prices in the domestic market and benefit from more competitive conditions offered abroad. Voice services over the internet enable users to make international phone calls at the local rate. Technological developments of that nature increasingly undermined the view that basic telecommunications services constituted a natural monopoly. For a more extensive discussion see Doumbouya and ILEAP (2004).
6 The membership of the Telecommunications Regulators Association of Southern Africa (TRASA) comprises the regulatory agencies of each SADC member state. It was established to coordinate regulatory matters with the ultimate objective of promoting the establishment and operation of efficient, adequate and cost-effective telecommunications networks and services in the Southern Africa region. For more see http://www.trasa.org.bw.

8
Figure 1: Evolution of competition in the mobile telephony segment in Africa, selected years (per cent)
0%
20%
40%
60%
80%
1995 (23) 1997 (27) 1999 (33) 2001 (42) 2004 (43)
Monopoly Partial competition Full competition
Source: authors’ calculation from ITU (2004) Notes: Partial competition: two operators; Full competition: more than two operators. Total number of countries in brackets. Figure 2: Evolution of competition in the fixed-line telephony segment in Africa, selected years (per cent)
0%
20%
40%
60%
80%
100%
1995 (35) 1998 (35) 2001 (44) 2002 (45) 2004 (45)
Monopoly Partial competition Full competition
Source: authors’ calculation from ITU (2004) Notes: Partial competition: two operators; Full competition: more than two operators. Total number of countries in brackets. WTO negotiations on basic telecommunications came too early for more than a handful of African governments to contribute.7 As figures 1 and 2 above show, most governments began liberalizing well after the WTO talks ended in early 1997. This is why the WTO commitments reflect so little of the liberalization Africa has accomplished to date. Seven governments committed to market access for foreign telecom suppliers in the basic telecommunications negotiations (Côte d'Ivoire, Ghana, Kenya, Mauritius, Senegal, South Africa and Uganda). Like other developing countries in the negotiations, they generally took so-called "phased-in" commitments to liberalize on a given date, in line with their reform plan. Some, such as Uganda, committed to allow a duopoly (also known as
7 For comparison, Low and Mattoo (1998) analyze the commitments made by Asian countries in the
negotiations on basic telecommunications and the actual reforms that have taken place. Schedules of commitments can be downloaded from the WTO Services Database Online at http://tsdb.wto.org/wto/WTOHomepublic.htm or from WTO Documents Online at http://www.wto.org/english/tratop_e/serv_e/serv_commitments_e.htm.

9
"second national operator"). Six of them (all but Mauritius) added the Reference Paper to their commitments, thus providing a guarantee to investors of a pro-competitive regulatory regime. Earlier, in the context of the Uruguay Round (1986-1994), for example, Nigeria had committed to open its mobile markets and Lesotho, Nigeria, and Zimbabwe had committed on value added services. In the new trade round, called the Doha Development Agenda, none of the recently liberalizing African countries has, as yet, made an offer to take on market access commitments in the telecommunications sector. However, this is in large part due to the LDC guidelines on services, negotiated among WTO Members, that permit LDCs to opt out (i.e. make no GATS offer all) if they so choose. Table 1: Competition and regulation in Africa in 2004
Country Local Long dist. Int'nat. Mobile
digital Internet
Year of creation of regulatory authority
Independence of regulatory
authority
Decisions by committee (if
yes, number of members)
WTO Basic Telecom
Commitments
Angola C C C P C 1999 No Yes: 5 Benin M M M C 2002 Yes Yes: 5
Botswana M C M C C 1996 Yes Yes: 5 Burkina Faso M M M C C 1998 Yes No
Burundi C C C C C 1997 No No Cameroon M M M C C 1998 Yes No Cap-Verde M M M C C 2004 Yes Yes: 3
CAR M M M C Chad M C M C 1998 No No
Congo C C P C C DRC C C C C 2002 Yes Yes: 7 Yes
Côte d'Ivoire P P P P C 1995 Yes Yes: 10 Yes/RP Eritrea M M M C C 1998 No No
Ethiopia M M M M M 1996 Yes No Gabon M C C C C 2001 Yes Yes: 6 Gambia M M M P C 2004 Yes Yes: 6 Yes Ghana P P P P C 1997 Yes Yes: 7 Yes/RP Guinea P P P P C 1992 No No
Guinea-Bissau M M M P C 1999 Yes Yes: 3 Kenya P P P P C 1999 Yes Yes: 11 Yes/RP
Lesotho P P P C C 2000 Yes No (value added only)
Liberia P P C C Madagascar M M C C C 1997 Yes No
Malawi M M P P P 1998 No Yes: 8 Mali P P P P C 1999 Yes Yes: 3
Mauritius C C C C 2002 Yes Yes: 7 Yes Mozambique M M M C C 1992 Yes Yes: 5
Namibia M M M M C 1992 Yes No Niger M M M C M
Nigeria C P P P C 1992 Yes Yes: 9 Yes Rwanda C C C C 2001 Yes Yes: 7
S. Tomé & P. M M Senegal C C C C C Yes No Yes/RP
Seychelles P P P P P Sierra Leone M M P C P South Africa C C C P C 2000 No Yes: 7 Yes/RP Swaziland M M M M Tanzania M M M C C 1994 Yes Yes: 7
Togo P M P P C 1998 Yes Yes: 7 Uganda P P P P 1997 Yes Yes: 7 Yes/RP Zambia M M M P P 1994 No Yes: 8
Zimbabwe C P P C C 2000 Yes Yes: 7 (value added only)
Source: authors’ calculation from ITU (2004) Note: M: Monopoly; P: Partial competition; C: Full Competition; and RP: Reference Paper.

10
IV. LIBERALIZATION INDICATORS
Services trade barriers essentially consist of regulations limiting the access of foreign services providers to the domestic market or subjecting them to less favourable treatment than local providers. The methodologies to measure the degree of trade restrictiveness in the services area are inspired by approaches used to characterize non-tariff barriers on goods. Qualitative data on regulations or the behaviour of economic agents is transformed into a system of scores, which is then used to construct a restrictiveness index. Hoekman (1995) constructs an index rating countries according to the number of sectors and modes committed under the GATS. This index suffers from at least two shortcomings: First, it characterizes liberalization only in terms of GATS commitments, which may be quite different from reality (Chen and Schembri, 2002). Second, the same weight is accorded to each mode (and hence to each restriction), although not every mode is equally significant in each sector and restrictions are of a quite varied nature. Recent approaches have used more sophisticated indexes based on actual regulatory policies that are rated according to their presumed restrictive effects. For instance, the study by Mattoo et al. (2006) on telecommunications assigns a liberalization score to each country on the basis of three criteria: market structure, ownership (FDI) and independent regulator. Several studies examine both the quality of GATS commitments as well as the actual state of liberalization. Such approaches have been pursued by Warran (2001) on telecommunication services, Fink, Mattoo and Neagu (2002), MacGuire et al. (2000) and Kang (2000) on maritime transport services, MacGuire (2002) on financial services, Kemp (2000) on education services and Kalirajan (2000) on distribution services. We adopt an approach that examines both the domestic policies actually applied in the telecommunications sector as well as the level of commitments as specified in WTO Members' GATS schedules. For both the unilaterally implemented as well as multilaterally committed reforms we distinguish two components: degree of competition and regulation. For the level of actual (unilateral) domestic liberalization, like Mattoo et al. (2006), Li and Xu (2004), Fink et al. (2001) and Wallsten (2001), we rely on ITU survey data (ITU, 2005a). However, we go further than these studies in a number of respects. Notably, we measure the degree of competition for each telecommunications segment separately instead of employing only a "hybrid competition score". The latter approach makes it difficult to disentangle the direct effect that competition within each segment has on segment performance. Wallsten (2001), for instance, simply approximates the degree of competition in the fixed-line segment by the number of mobile operators not owned by the incumbent. Li and Xu (2004) employ a dummy variable to describe the competitive situation in the fixed and mobile telephony segments together. Unlike all of these studies, which limit themselves to the existence or not of a regulatory authority (finding no significant effects) or do not take account of regulation at all, we seek to measure regulatory quality. Hence, in this paper, the degree of competition is characterized by the existing market structure in each segment, with a score of "1" indicating a monopoly, "2" a duopoly and "3" three and more operators.8 Regulatory quality is approximated by a combination of two components: The principal element is the degree of independence of the regulatory authority from the government according to a range of criteria, such as legal autonomy (i.e. whether or not it is affiliated with the administration), budgetary dependence and process for appointment of members. "1" is attributed to countries where the regulatory authority is independent, while "0" where it is not. The independence indicator is then
8 As a robustness check, we have also run all the regressions using just a zero-one dummy for
competition and monopoly in order to analyze the impact of a policy shift, where the major regime change is from one to more than one suppliers. This way we account for the possibility that some African countries may be too small for more than two providers to gain economies of scale, notably in the fixed line segment, and that in such cases two operators can generate as much competition as three or more operators in other markets. See, for instance, Tusubira (2006), analyzing Uganda's approach to telecommunications reform. Measuring unilateral openness in this manner does not change our findings.

11
interacted with the number of years for which the regulatory authority has been in existence. This term allows for the fact that the degree of autonomy and its competence (proxied by its years of experience) may depend on one another. Alternatively, we use the size of the regulatory authority in terms of staff numbers (proxy for its overall resource endowments) to measure its competence. Unlike most other studies, we also include multilateral liberalization commitments, which may lead to additional effects not accounted for by unilateral measures.9 In particular in the African context, where political instability and insecurity are major drags on the level of investment, the quasi-irreversible character of external commitments in the GATS framework is expected to enhance the credibility of reforms, namely that the regulatory framework will be consistent, fair and predictable, thus lowering investment risks (Marchetti, 2004).10 The level of multilateral liberalization is equally characterized in a twofold manner and relies on WTO data. Thus, GATS commitments are used as an indicator of a country's openness to foreign competition. It is measured by a dummy variable that takes the value of "1" for a country with at least one commitment under the GATS and "0" otherwise. This variable is quite weak as a liberalization indicator, since it does not contain any information on the type or level of commitments. Moreover, as was said before commitments in the WTO may be far less liberal than actual practice. Adherence to the Reference Paper is taken as an indictor of regulatory quality. A dummy is constructed taking the value of "0" for countries that have not subscribed to any regulatory disciplines in the telecommunications sector (beyond general GATS rules), "1" for countries which have committed themselves in regard to certain regulatory disciplines, but not the Reference Paper, and "2" for countries having adopted the Reference Paper in total or in part. V. MODEL AND DATA
This Section explains the empirical models and data used in this paper. A. EMPIRICAL MODELS
This Section explains the econometric models used to estimate the effect of telecommunications services liberalization on sectoral performance indicators and economic growth. We run these regressions for the mobile telephony market, for the local fixed segment and for the international segment as well as for a sectoral aggregation. Few studies examine both performance and growth effects. Looking at performance effects of telecommunications liberalization, Doumbouya and ILEAP (2004) and Shirley (2001) focus on African countries, Fink et al. (2001) examine Asian countries. Fink, Mattoo and Rathindran (2002) and Wallsten (2001) take a similar approach for a group of developing countries, Boylaud and Nicoletti (2001) as well as OECD (2001) for OECD countries, Hauffman (2002) for the United States, Findlay and Warren (2000) for a range of developed and developing countries and Li and Xu (2004) for a panel of 162 countries. The authors generally find a positive relationship between increased competition/privatization and sectoral performance (as measured by price reductions to consumers, phone line penetration or labour productivity). These results are consistent in regard to both the sample of countries (developing or developed) and the estimation method (cross-country, panel and fixed effects, with or without correction for heteroscedasticity). Mattoo et al. (2006) examine the growth effect of a change in telecommunications policy. Similarly, the study by Norton (1992) looks at improvements of telecommunications infrastructure and their impact on economic growth. Both studies find positive effects of telecommunications reform on economic growth.
9 As a robustness check, we have explored how unilateral and multilateral indicators of openness and
regulation perform separately in the regressions. This change leaves our results unaffected. 10 Marchetti (2004) notes that not every commitment may have the same effect on enhancing investor
confidence. Specific requests by mode and sector in the current negotiations may give an indication of the kind of regulatory assurances investors are looking for.

12
None of these studies is sufficiently detailed or recent in order to allow for an assessment of the specific situation in Africa. To the best of our knowledge, the only quantitative empirical study that exclusively focuses on African countries is the one by Doumbouya and ILEAP (2004) who estimates a fixed effects panel obtaining a significantly positive correlation between the liberalization (as measured by various degrees of competition) and the penetration of telephone services.11 However, the time period under investigation ends in 1999, i.e. at a point in time, as was mentioned above, when much of the liberalization in African countries was still to take place. This is also a problem in Wallsten (2001), who studies a sample of African and Latin American countries between 1984-1997. Our paper seeks to fill this gap. Our sample comprises Sub-Saharan countries and covers the time period from 1997 to 2003, when major reforms in the telecommunications sector in Africa were carried out. As a robustness check and in order to identify possible continent-specific effects, we run the same models on a world sample of countries and compare these results to the ones obtained for Africa. In addition, we address methodological shortcomings of several previous studies suffering from model misspecification, notably by not taking into account endogeneity and by making simplifying assumptions about the error structure. We correct for these biases through instrumental variable estimation.12 In addition, we avoid misattribution of developments in one telecommunications segment to liberalization in another segment by conducting our analysis for the mobile, local fixed and international segments separately as well as for the telecommunications sector as a whole. Finally, since non-inclusion of a technology variable may lead to a serious overestimation of the significance of liberalization measures, we systematically introduce a time trend in our regressions as a proxy for technological progress affecting telecommunications performance. 1. Sectoral performance regressions
Liberalization reforms that change ownership, introduce competition (both foreign and domestic) and secure a competitive market structure through appropriate regulation affect the performance of firms through a variety of channels. A large literature exists that has shown the superiority of private vs. public ownership in terms of firm performance (e.g. Shleifer, 1998), the importance of competition in order to eliminate inefficient practices (e.g. Megginson and Netter, 2001) and the complementarity of privatization and competition, including in the telecommunications sector (e.g. Li and Xu, 2002). A priori more competition is expected to result in higher sectoral performance. However, Nickell (1996) and others emphasize that functioning capital markets are a prerequisite if new entrants are to be able to develop and invest in performance-augmenting technology and challenge the position of the incumbent that may benefit from higher liquidity and lower risk perceptions owing to its initial market power. Therefore, especially in Africa, where financial markets are underdeveloped, the presumption of positive performance effects of telecommunications liberalization remains an empirical question. In order to measure the impact of the various liberalization measures on our performance indicators of the telecommunications sector, we develop a Cournot conjectural variations model under imperfect competition (see Appendix 1). The model yields the following reduced form equation:
[ ] 3,2,1;2003,1997)log()log()log()log(
∈∈++++++=
stCtQLIBwubY s
itsss
itss
itss
itsi
ssit λγβα
where s, i and t indicate the telecommunication services segment, country and time period respectively.
11 Shirley (2001) adopts a descriptive approach presenting case studies of telecommunications reform
in six African countries and various performance statistics. 12 See, for instance, Griffiths et al. (1993).

13
Y sit , the dependent variable, represents the performance indicator (price or penetration) in each of the
segments s (mobile, local fixed, international) in country i at time t.13 LIBs
it denotes the various liberalization indicators. By introducing competition, liberalization should be expected to be negatively correlated with price and positively with telecommunications services penetration. However, at least two factors may counteract such a result: Firstly, liberalization may go hand in hand with a reduction of direct or cross-subsidies formerly enjoyed by the monopolist. Hence, at least in the short-run and for some of the market segments, liberalization may lead to higher prices. The second factor is related to the market situation in many African countries which is still characterized by only two operators on average, a rather weak institutional environment in general and a lack of experience in regulation the telecommunications sector in particular, in short, by a set-up that may be conducive to some degree of collusion. Qs
it denotes the quality of telecommunication services, as measured by the share of digital technology among telecommunications installations. This variable is likely to be positively correlated to price, since it requires additional investments by the operator leading to higher costs.14 Consumers accept to pay a higher price for better service. Furthermore, better services quality is expected to have a positive impact on subscriptions. Cs
it denotes the matrix of control variables, in particular exogenous factors characterizing a country's economic structure (income, population density, population size). We also include the share of a country's GDP in global GDP in order to measures the relative size of the economy and account for possible economies of scale. Some regressions contain additional controls, namely urban population,15 the alternative performance indicator respectively in the price and penetration equations,16 a performance indicator in the competing segment17 as well as segment dummies in the sector equations.18 bs is a constant, while the error term ws
it captures model disturbances, i.e. the combined time series
and cross-section error component, which we assume to be idiosyncratic. usi denotes the individual-
13 The model set-up derived in Appendix 1 for price is similar for penetration. On the demand side,
penetration is a function of prices and income; on the supply side, the same variables apply that characterize production in the telecommunications sector, notably economies of scale and network economies.
14 Digitization is a fixed cost that reduces the marginal cost of telecommunications. If the price is based on average costs (common in regulated markets), the effect could go both ways.
15 In the literature, the standard approach is to use the urban population. However, in the case of Africa, there is a lot of missing data reducing the degrees of freedom by half. Using the total population instead does not alter our results.
16 Price and penetration can have positive and negative partial correlations, with the former being explained by expectations of monopoly profits and the latter by network economies. See Appendix table 1. All data tables are contained in Appendix 2.
17 Mobile and fixed lines may well act as substitutes. For instance, in the case of the price estimation in the fixed telephony segment, we account for the price or the penetration in the mobile segment and vice versa. This variable is endogenous, with performance levels in the different segments influencing each other. Using the Hausman and Taylor (1981) estimator, we obtain an internal instrument that is both consistent and efficient. This is a notable improvement over Fink, Mattoo and Rathindran (2002) who try to correct for endogeneity using a two-stage estimation procedure, whereby fitted values obtained from a first stage regression are substituted for the actual values of the respective performance variable in the second stage. However, instrumenting in such a manner leads to strong multicollinearity given that both equations contain some of the same explanatory variables. We find a positive cross-price elasticity between mobile and international and local fixed prices. Results for our variables of interest are robust to the inclusion of cross-effects.
18 We also take account of the mutual influence of mobile and fixed line markets by comparing our results in the individual segments to overall sectoral performance. The segment dummies allow us to identify the segment, notably mobile telephony, that is responsible for price reductions at the sectoral level.

14
specific error component, which we assume to be correlated with some of the explanatory variables of the model.19 This hypothesis is based on the existence of omitted, non-quantifiable variables which have an effect on both liberalization policies and its results in terms of performance. One such factor is the existence of political will to implement the liberalization measures that a country has committed to. Thus, political will not only has an impact on the ultimate performance of the sector, but also on the timing and type of liberalization measures adopted. In view of the presumed correlation between the country-specific effects and some of the explanatory variables, the within estimator normally used to estimate fixed effects is not efficient. Moreover, the presence of time-invariant dummy variables excludes the possibility to correct for the correlation of country-specific effects by mean-differencing the data. We therefore opt for the Hausman and Taylor (1981) estimator which assumes that a sub-set of the explanatory variables are correlated with the individual-level effects us
i , but that none of the explanatory variables are correlated with the idiosyncratic error ws
it . It corrects for the problem of correlation between the country-specific effects and the explanatory variables by using generalized instrumental variables (Wooldridge, 2002).20 In the performance regressions, the time-varying endogenous regressors are the number of operators, quality of the regulatory authority, penetration and prices; the time-varying exogenous regressors are real GDP per capita, population density, population size, share of digital lines, relative size of the economy and time trend; the time-invariant endogenous regressors are the Reference Paper and the Africa dummy variable; and the time-invariant exogenous regressor is GATS commitments. The model is estimated in regard to the performance at each segment level and for the telecommunications sector as a whole. For each segment, the model is estimated for an African and a global sample. In the latter, an Africa dummy variable is introduced in order to capture continent-specific effects as compared to the rest of the world. For the sector estimation, the data for all three segments are pooled and dummies are introduced to control for the specificity of each segment. 2. Growth regressions
We expect telecommunications liberalization to enhance economic growth through a number of channels. In the literature, their importance as an intermediate input in the production of other goods and services is often stressed.21 An increased variety of telecommunications "inputs" through foreign provision can enhance the productivity of an economy's other resources. In addition, a larger scale of activity in the telecommunications sector as well as technology transfer is likely to generate endogenous growth effects (Röller and Waverman, 2001). However, as highlighted by Rodriguez and Rodrik (2001), trade policy changes in endogenous growth models can affect output growth positively or negatively via resource reallocation effects. The impact of liberalization on long-term growth is therefore an empirical question. Our underlying model of endogenous growth of real GDP per capita follows Barro (1997). Apart from the classic explanatory variables, i.e. production factors (gross fixed capital formation as a proxy for investment, ratio of secondary education as proxy for human capital),22 we introduce control
19 Hausman's specification test (Hausman, 1978) rejects the null hypothesis that the conditional mean
of the disturbances given the regressors is zero. 20 The Hausman-Taylor estimator uses both the between and within variation of the strictly exogenous
variables (i.e. the ones that are neither correlated with the individual effects nor with the disturbances) as instruments. In order to be more efficient than the fixed effects estimator, there must be at least as many time-varying exogenous regressors as there are individual time-invariant endogenous regressors. For more on the choice between fixed effects, random effects and Hausman-Taylor estimators see Baltagi et al. (2003).
21 See, for instance, Nielson and Taglioni (2004). 22 We do not include the labour force in the regressions. With real GDP per capita on the left-hand
side, doing so would have implied an expectation of scale effects. Scale effects have largely been found not to exist in the growth literature. We have confirmed this using a large cross-section of countries.

15
variables for human development (life expectancy),23 macroeconomic policies (inflation),24 openness (exports as a share of GDP)25 and governance (political stability).26 It would explode the size of this paper to conduct our own analysis of additional conditioning variables to be included in growth regressions in the African context (for instance via extreme bounds analysis (EBA) (Sala-i-Martin, 1997) or Bayesian averaging of classical estimates (BACE) (Sala-i-Martin et al., 2004). We, therefore, rely on the selection by Easterly and Levine (1997).27 Hence, we also include dummies for the ethno-linguistic fractionalization (Easterly and Levine, 1997), war (Banks, 2005) and colonial powers (Barro, 1999) as well as a population growth variable (World Bank, 2005).28 In Africa, in particular, it is conceivable that the correlation coefficients between economic growth and our trade liberalization indicators (or actual performance) in the telecommunications sector suffer from simultaneity bias and rather reflect the impact of growth on liberalization policies and not vice versa. In fact, many of the reforms in Africa were inspired by structural adjustment programmes. In order to correct for possible endogeneity problems linked to simultaneity bias, to measurement errors or omitted variables, we run our regressions using the Generalized Method of Moments (GMM) estimator, i.e. we have estimated a dynamic panel in first differences using lagged values of the endogenous variables as instruments. The model specification is a follows:29
( )[ ]2003,1996
,,1
∈= −
tXLIBGDPfGDP i
ti
ti
ti
t
where GDPt
i denotes the log of annual average GDP per capita and itX is a vector of the logs of our
growth controls for Africa. As an alternative technique, in order to conduct a joint estimation of the three equations containing real GDP per capita, the number of operators and penetration in the mobile segment as left-hand side variables respectively, we use the three-stage least squares (3SLS) estimator. Thus, simultaneity bias is corrected for by using internal instruments. The 3SLS estimation procedure is set out in Zellner and Theil (1962): First, the exogenous variables are taken as instruments for the endogenous variables using ordinary least squares (OLS). Then, each endogenous variable is regressed on both the exogenous variables and the predictions of the endogenous variables. This is the common two stage least squares procedure (2SLS). Finally, we calculate the generalized least squares (GLS) estimator. We employ GLS in order to use the additional information of the contemporaneous correlation of the error terms. Because of the endogeneity of some of the variables, we cannot use the
23 In certain African countries, the abrupt decline in life expectancy due to HIV has entailed an increase
in GDP per capita. In addition, particularly affected countries may attract more foreign aid. Moreover, the prevalence of HIV is strong in countries, such as Botswana and South Africa, with relatively high rates of GDP per capita. For instance, life expectancy in Botswana has gone down by 29 years over the past 10 years, while being the third most well-off country in Sub-Saharan Africa (after the Seychelles and Mauritius) in terms of GDP. See World Bank (2005).
24 African countries are heavily dependent on rain-fed agriculture. Inflation also controls for cyclical factors, such a weather conditions, with e.g. food prices increasing in years with bad harvests and vice versa.
25 For the large trade and growth literature see exemplarily Dollar and Kraay (2004). 26 As a measure of "good governance", apart from policy stability, we have included alternatively other
Kaufmann indicators, namely regulatory quality and corruption control. See Kaufmann et al. (2005). 27 Easterly and Levine (1997) use a larger set of variables, but otherwise are in accordance with Sachs
and Warner (1997), who emphasize the importance of trade openness and economic policies. We also use individual dummies for European colonial powers, following Masanjala and Papageorgiou (2006).
28 All of these variables turn out to be insignificant and therefore are not further discussed in the paper. 29 This specification applies to the GMM estimation; the alternative estimation methods do not include
lagged GDP as an explanatory variable.

16
GLS estimator directly, but first have to run the 2SLS procedure replacing the endogenous variables by their predictions.30 B. DATA
Data for the performance indicators are sourced from the ITU (2005), while data on economic structure and growth determinants are taken from the World Development Indicators (WDI) 2005 data base of the World Bank (WB) (World Bank, 2005). Governance indicators are from Kaufman et al. (2005). Liberalization indicators have been developed on the basis of ITU surveys (ITU, 2005a) and WTO schedules of commitments.31 The table below provides an overview of all variables and data sources. As was said before, the dependent performance variables are the price and penetration variables with the former being measured in real constant dollars (at 2000 prices). While the price for international fixed telephony is measured by a three minutes call to the United States, the prices for mobile and local fixed telephony are measured by two indicators each. The first indicator is the official price of a three minutes phone call. However, this price does not account for discounts that are generally available in countries enjoying some level of competition.32 Hence, it is possible that this indicator suffers from a measurement error that is non-homogenous between countries. This may lead to an underestimation of liberalization effects on price. The second indicator seeks to address this shortcoming at the expense of other limitations. It consists of the annual telephone bill by an average subscriber and is calculated by dividing total revenues in each market segment by the number of subscribers. While it reflects the effect of discounts, the quantity of services provided at a given cost is not accounted for. We employ this indicator under the assumption that the individual subscriber does not consume less telephone services when the number of operators and subscribers rise.33 This indicator is also bound to be error-prone in a non-homogenous manner across countries and likely to underestimate the liberalization effect on price to differing degrees.
30 In order to address endogeneity, the GMM estimator is the preferred method in the literature
(Wooldridge, 2002). In the presence of conditional heteroscedasticity, GMM is more efficient than 3SLS. The Hausman-Taylor estimator is the efficient GMM estimator only under the specific assumptions given in Hausman and Taylor (1981). Nevertheless, we have also estimated our growth model using the same techniques as in the performance equations, i.e. fixed effects, fixed effects corrected for heteroscedasticity, random effects and Hausman-Taylor. Variables are categorized in the same way as in the performance equations. For Hausman-Taylor, investment, education, trade openness and governance are considered to be time-varying endogenous regressors, while the labour force and inflation are modelled as time-varying exogenous regressors. These techniques allow us to integrate time-invariant variables, notably our multilateral liberalization indicators, and therefore provide an additional robustness check. The results are not qualitatively different from the dynamic methods of estimation.
31 See footnote 7 for links to schedules of commitments. 32 Boylaud and Nicoletti (2001) estimate that discount prices in OECD countries are on average 25 per
cent lower than regular rates. 33 It is possible that reductions in the annual phone bill are a reflection of lesser consumption (i.e.
accumulation of fewer time units per year) rather than declining prices. However, as our regressions below show, liberalization leads to a strong increase in penetration (i.e. a rising number of providers). As a consequence, with the market expanding the average amount of time units consumed can be assumed to increase, and lower values of this indicator would then reflect an actual decline in prices. Of course, ideally, we would have information on the annual costs for a given communication time or number of units. While the underlying hypothesis that the consumption per subscriber cannot fall when penetration is on the rise may hold in most regions and for the world as a whole, the situation in Africa might be different: With rising penetration, the number of people sharing one telephone line or station goes down. Hence, it is possible that consumption per subscriber declines when previously several households used to share the phone on one neighbour.

17
Table 2: Data description and sources
Variable
Description Source
Price mobile Costs of 3 minutes call from one mobile to another; annual bill of average subscriber
ITU
Price local fixed Costs of 3 minutes call from local fixed line; annual bill of average subscriber
ITU
Prix international fixed
Costs of 3 minutes call to the United States WDI
Penetration mobile Percentage of population subscribed and having telephone service activated within the last 9 months
ITU
Penetration fixed
Percentage of population subscribed ITU
Unilateral openness
Number of operators per segment ITU
Unilateral regulation Independence score of the regulatory authority multiplied by the numbers of years in existence
ITU
Multilateral openness
GATS commitments score WTO
Multilateral regulation
Reference Paper score WTO
Quality of telecom services
Share of digital lines per segment ITU
Income
GDP per capita WDI
Population density
Percentage of population per square kilometre WDI
Population size
Total number of inhabitants, urban population WDI
Governance
Kaufmann governance indicators: regulatory quality, policy stability, corruption control
WB
Other growth determinants
Ratio of secondary schooling, life expectancy, share of exports in GDP, inflation, gross fixed capital formation
WDI
VI. RESULTS
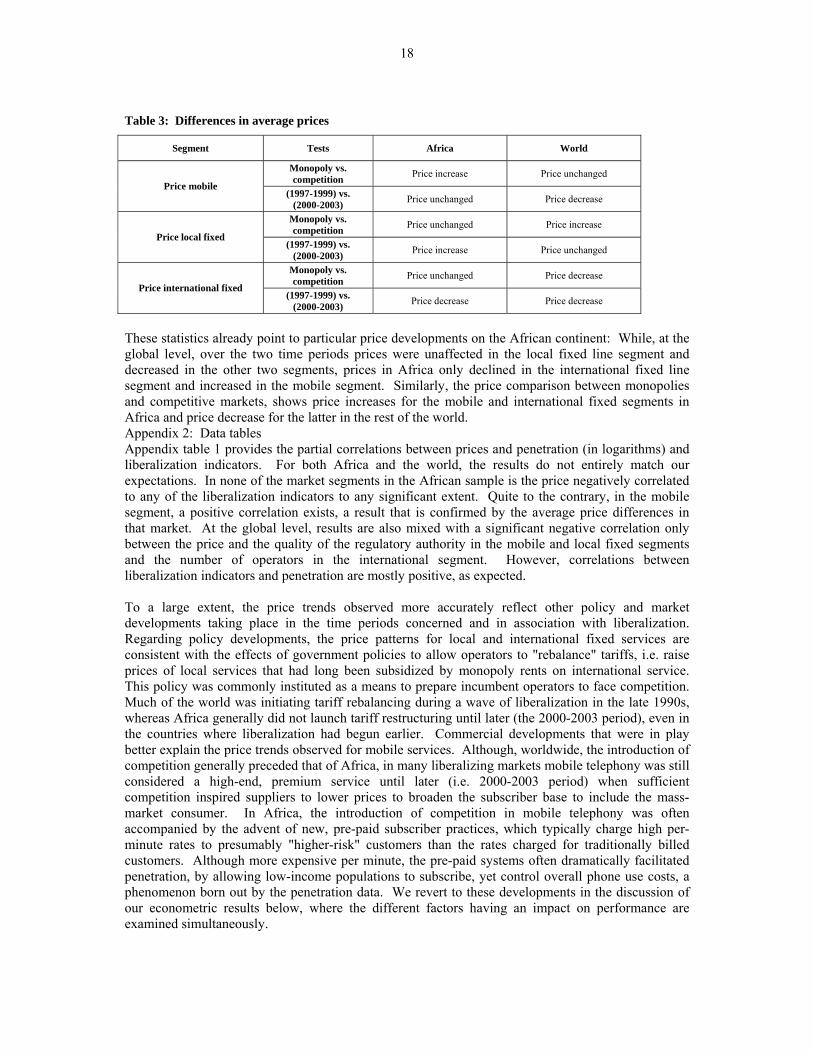
The panel comprises 177 countries and territories (of which 45 from Sub-Saharan Africa) over a 7-year period (1997 to 2003). For each performance regression, four different estimation methods are used (fixed effects, fixed effects corrected for heteroscedasticity, random effects and Hausman-Taylor). For the growth regressions, dynamic GMM and 3SLS estimations are carried out in addition to these approaches.34 Before interpreting the results, it is instructive to examine some descriptive statistics on the evolution of prices over time in relation to variations of the liberalization indicators. Table 3 summarizes the differences in average prices (per 3 minutes call) in each segment between, on the one hand, monopolies and competitive markets (defined as more than one operator) and between the time periods 1997 to 1999 and 2000 to 2003 on the other.
34 Due to space limitations, only the results of Hausman-Taylor for performance and of GMM for the
growth regressions are presented in detail in the paper. The other approaches are robustness checks on our preferred estimation methodologies and do not affect our results. As mentioned in several footnotes above, we have also carried out numerous robustness checks on the inclusion of additional variables, which have not led to a modification of our results. Our major sampling robustness check concerns the discussion of Africa vs. global results. A full set of results for both the Africa and world samples comprising all estimation methods and variables is available from the authors upon request. The detailed results discussed in the paper are presented in the data tables contained in Appendix 2.
18
Table 3: Differences in average prices
Segment Tests Africa World
Monopoly vs. competition Price increase Price unchanged
Price mobile (1997-1999) vs.
(2000-2003) Price unchanged Price decrease
Monopoly vs. competition Price unchanged Price increase
Price local fixed (1997-1999) vs.
(2000-2003) Price increase Price unchanged
Monopoly vs. competition Price unchanged Price decrease
Price international fixed (1997-1999) vs.
(2000-2003) Price decrease Price decrease
These statistics already point to particular price developments on the African continent: While, at the global level, over the two time periods prices were unaffected in the local fixed line segment and decreased in the other two segments, prices in Africa only declined in the international fixed line segment and increased in the mobile segment. Similarly, the price comparison between monopolies and competitive markets, shows price increases for the mobile and international fixed segments in Africa and price decrease for the latter in the rest of the world. Appendix 2: Data tables Appendix table 1 provides the partial correlations between prices and penetration (in logarithms) and liberalization indicators. For both Africa and the world, the results do not entirely match our expectations. In none of the market segments in the African sample is the price negatively correlated to any of the liberalization indicators to any significant extent. Quite to the contrary, in the mobile segment, a positive correlation exists, a result that is confirmed by the average price differences in that market. At the global level, results are also mixed with a significant negative correlation only between the price and the quality of the regulatory authority in the mobile and local fixed segments and the number of operators in the international segment. However, correlations between liberalization indicators and penetration are mostly positive, as expected. To a large extent, the price trends observed more accurately reflect other policy and market developments taking place in the time periods concerned and in association with liberalization. Regarding policy developments, the price patterns for local and international fixed services are consistent with the effects of government policies to allow operators to "rebalance" tariffs, i.e. raise prices of local services that had long been subsidized by monopoly rents on international service. This policy was commonly instituted as a means to prepare incumbent operators to face competition. Much of the world was initiating tariff rebalancing during a wave of liberalization in the late 1990s, whereas Africa generally did not launch tariff restructuring until later (the 2000-2003 period), even in the countries where liberalization had begun earlier. Commercial developments that were in play better explain the price trends observed for mobile services. Although, worldwide, the introduction of competition generally preceded that of Africa, in many liberalizing markets mobile telephony was still considered a high-end, premium service until later (i.e. 2000-2003 period) when sufficient competition inspired suppliers to lower prices to broaden the subscriber base to include the mass-market consumer. In Africa, the introduction of competition in mobile telephony was often accompanied by the advent of new, pre-paid subscriber practices, which typically charge high per-minute rates to presumably "higher-risk" customers than the rates charged for traditionally billed customers. Although more expensive per minute, the pre-paid systems often dramatically facilitated penetration, by allowing low-income populations to subscribe, yet control overall phone use costs, a phenomenon born out by the penetration data. We revert to these developments in the discussion of our econometric results below, where the different factors having an impact on performance are examined simultaneously.
19
A. PRICE
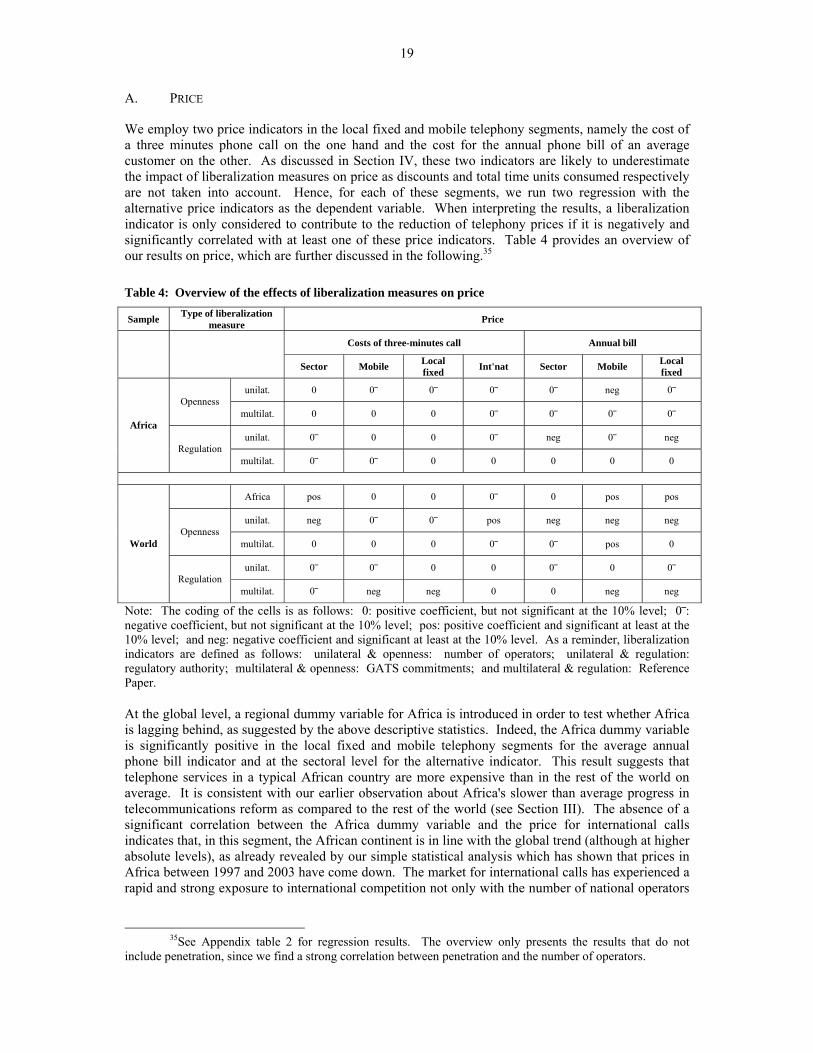
We employ two price indicators in the local fixed and mobile telephony segments, namely the cost of a three minutes phone call on the one hand and the cost for the annual phone bill of an average customer on the other. As discussed in Section IV, these two indicators are likely to underestimate the impact of liberalization measures on price as discounts and total time units consumed respectively are not taken into account. Hence, for each of these segments, we run two regression with the alternative price indicators as the dependent variable. When interpreting the results, a liberalization indicator is only considered to contribute to the reduction of telephony prices if it is negatively and significantly correlated with at least one of these price indicators. Table 4 provides an overview of our results on price, which are further discussed in the following.35
Table 4: Overview of the effects of liberalization measures on price
Sample Type of liberalization measure Price
Costs of three-minutes call Annual bill
Sector Mobile Local fixed Int'nat Sector Mobile Local
fixed
unilat. 0 0⎯ 0⎯ 0⎯ 0⎯ neg 0⎯ Openness
multilat. 0 0 0 0⎯ 0⎯ 0⎯ 0⎯
unilat. 0⎯ 0 0 0⎯ neg 0⎯ neg Africa
Regulation multilat. 0⎯ 0⎯ 0 0 0 0 0
Africa pos 0 0 0⎯ 0 pos pos
unilat. neg 0⎯ 0⎯ pos neg neg neg Openness
multilat. 0 0 0 0⎯ 0⎯ pos 0
unilat. 0⎯ 0⎯ 0 0 0⎯ 0 0⎯
World
Regulation multilat. 0⎯ neg neg 0 0 neg neg
Note: The coding of the cells is as follows: 0: positive coefficient, but not significant at the 10% level; 0⎯: negative coefficient, but not significant at the 10% level; pos: positive coefficient and significant at least at the 10% level; and neg: negative coefficient and significant at least at the 10% level. As a reminder, liberalization indicators are defined as follows: unilateral & openness: number of operators; unilateral & regulation: regulatory authority; multilateral & openness: GATS commitments; and multilateral & regulation: Reference Paper. At the global level, a regional dummy variable for Africa is introduced in order to test whether Africa is lagging behind, as suggested by the above descriptive statistics. Indeed, the Africa dummy variable is significantly positive in the local fixed and mobile telephony segments for the average annual phone bill indicator and at the sectoral level for the alternative indicator. This result suggests that telephone services in a typical African country are more expensive than in the rest of the world on average. It is consistent with our earlier observation about Africa's slower than average progress in telecommunications reform as compared to the rest of the world (see Section III). The absence of a significant correlation between the Africa dummy variable and the price for international calls indicates that, in this segment, the African continent is in line with the global trend (although at higher absolute levels), as already revealed by our simple statistical analysis which has shown that prices in Africa between 1997 and 2003 have come down. The market for international calls has experienced a rapid and strong exposure to international competition not only with the number of national operators
35See Appendix table 2 for regression results. The overview only presents the results that do not
include penetration, since we find a strong correlation between penetration and the number of operators.

20
rising but with the arrival of alternatives such as call-back systems and calls via the internet (e.g. net-phone, Skype-Net), which nowadays are available in most African countries. 1. Openness to competition
Multilateral liberalization as measured by the absence or not of GATS commitments has no effect on price in any one of the three telephony segments in Africa, individually or combined. While this result could be due to the low level of participation by African countries in terms of GATS commitments in the telecommunications sector, it does not change at the global level.36 Again, this indicator does not capture the differences between countries in terms of breadth (e.g. sub-sectors and modes of supply) and quality of commitments. Unilateral openness as measured by the actual number of operators in the market has contributed to price reductions. In the global telecommunications market in both the local fixed and mobile telephony segments the coefficient is negative at the 1% significance level for the average annual bill indicator. It is also significantly negative at the sector level for both price indicators. For Africa, unilateral openness has a weakly significant negative impact on price only in the mobile segment. The local fixed segments features a negative, but not significant coefficient for Africa. This result may be not surprising given the lower importance of fixed as opposed to mobile telephony in Africa. With a highly significant negative coefficient globally in the local fixed telephony segment, the lack of a significant effect on price must, at least in part, be due to specific developments in Africa. One possible explanation relates to the fact that, in many African countries, competition still is limited to two operators, a situation that is particularly conducive to pricing arrangements. For international calls, the coefficient is insignificant for Africa and weakly positive for the global sample. The latter result contradicts our simple descriptive statistical analysis which point to price reductions between 1997 and 2003 whether under monopoly or competitive structures and may therefore not be considered robust. As suggested above, the apparent lack of influence of the number of operators on price can be explained by the exposure to international competition via alternative means, such as call-backs and calls through the internet, which elude control by governments. 2. Regulation
A common regulatory framework agreed at the multilateral level, as measured by adhesion to the Reference Paper, in the world sample leads to highly significant price reductions in the mobile and local fixed line segments for both price indicators. The insignificant results for the African continent were to be expected in view of the fact that only six of them have adopted the Reference Paper. The low number of African participants contrasts with the world sample which contains 69 WTO Members following the principles of the Reference Paper in its entirety or partially, and which can therefore be presumed to produce a more reliable estimate.37 The indicator interacting independence and experience features a highly significant and negative correlation with prices in Africa (as measured by the average annual bill) for both the local fixed segment and the sector as a whole.38 In the mobile telephony segment, it is rather the number of operators that drives prices down. For the world sample, the quality of unilateral regulation does not
36 Results are insignificant with the exception of the mobile segment and average annual bill indicator,
which features a weakly significant positive correlation. This counterintuitive result may be due to a combination of the inherent weaknesses both in the measurement of the quality of GATS commitments and in the average phone bill as a performance indicator, which may simply reflect a higher absolute amount of mobile phone services consumed.
37 In contrast to our multilateral liberalization indicator, the multilateral regulation indicator refers to the same type of obligation (adoption of a common text) with those Members having reserved certain exceptions only obtaining half the score.
38 The unilateral regulation indicator that takes into account the authority's resources has no significant effect on price in any one of the segments.
21
result in price reductions, but rather the application of the Reference Paper. Here, effective implementation of the Reference Paper may act as a substitute for regulatory quality and vice versa. These result leads us to conclude that the autonomy and competence of a regulatory authority and/or implementation of the Reference Paper as well as the number of operators can have complementary roles in bringing about price reductions in the telecommunications market. At the world level, both competition and regulation lead to lower prices ceteris paribus, whereas in Africa the full potential of the interplay of these policies is yet to be realized, with one or the other policy being associated with declining prices depending on the market segment. B. PENETRATION
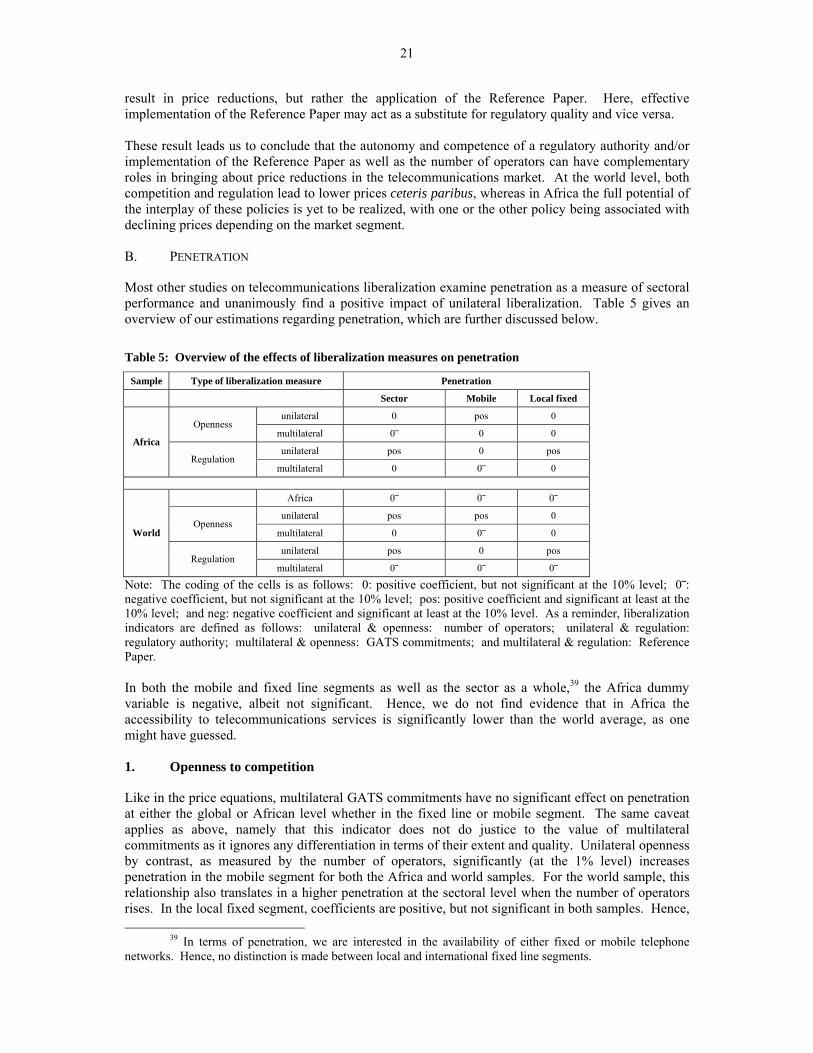
Most other studies on telecommunications liberalization examine penetration as a measure of sectoral performance and unanimously find a positive impact of unilateral liberalization. Table 5 gives an overview of our estimations regarding penetration, which are further discussed below. Table 5: Overview of the effects of liberalization measures on penetration
Sample Type of liberalization measure Penetration
Sector Mobile Local fixed
unilateral 0 pos 0 Openness
multilateral 0⎯ 0 0
unilateral pos 0 pos Africa
Regulation multilateral 0 0⎯ 0
Africa 0⎯ 0⎯ 0⎯
unilateral pos pos 0 Openness
multilateral 0 0⎯ 0
unilateral pos 0 pos
World
Regulation multilateral 0⎯ 0⎯ 0⎯
Note: The coding of the cells is as follows: 0: positive coefficient, but not significant at the 10% level; 0⎯: negative coefficient, but not significant at the 10% level; pos: positive coefficient and significant at least at the 10% level; and neg: negative coefficient and significant at least at the 10% level. As a reminder, liberalization indicators are defined as follows: unilateral & openness: number of operators; unilateral & regulation: regulatory authority; multilateral & openness: GATS commitments; and multilateral & regulation: Reference Paper. In both the mobile and fixed line segments as well as the sector as a whole,39 the Africa dummy variable is negative, albeit not significant. Hence, we do not find evidence that in Africa the accessibility to telecommunications services is significantly lower than the world average, as one might have guessed. 1. Openness to competition
Like in the price equations, multilateral GATS commitments have no significant effect on penetration at either the global or African level whether in the fixed line or mobile segment. The same caveat applies as above, namely that this indicator does not do justice to the value of multilateral commitments as it ignores any differentiation in terms of their extent and quality. Unilateral openness by contrast, as measured by the number of operators, significantly (at the 1% level) increases penetration in the mobile segment for both the Africa and world samples. For the world sample, this relationship also translates in a higher penetration at the sectoral level when the number of operators rises. In the local fixed segment, coefficients are positive, but not significant in both samples. Hence,
39 In terms of penetration, we are interested in the availability of either fixed or mobile telephone networks. Hence, no distinction is made between local and international fixed line segments.

22
more competition does not result in more subscribers in the local fixed segment, but it does in the mobile segment. This result, at least in part, is reflective of the high degree of saturation in the fixed segment, even under previous conditions of state monopolies. In Africa, more than that, it may rather reflect the competitive pressure on fixed network operators exerted by more competition and lower prices in the mobile segment. 2. Regulation
Adoption of the Reference Paper does not lead to any significant effects in terms of penetration. Unilateral regulation, as measured by a regulatory authority's independence and experience, indeed has a highly significant and positive impact on penetration for both Africa and the world in the fixed segment and in the telecommunications sector as a whole. Again, for the telecommunications sector at the global level, separate highly significant positive effects on penetration can be determined for both unilateral openness and regulation. To summarize the results on performance, we find that regulation is a key factor affecting the performance of the telecommunications sector, and especially the local fixed segment. This finding is robust to the use of alternative performance indicators. Similarly, the number of operators crucially affects performance in the mobile telephony segment, improving both penetration and price. At the global level, we have evidence that both openness and regulatory quality improve the performance within the same telephony segment, a potential that is yet to be fully realized by African countries. C. GROWTH
Finally, we are interested in testing whether liberalization beyond better price performance and accessibility of telecommunications services trickles through to have an impact on economic growth. Especially, liberalization of the mobile phone sector and the more widespread availability at reduced costs it entails are often touted as a blessing for Africa, as it allows people in remote locations to communicate with each other at affordable prices. There is also evidence that this has enabled them to establish market relationships, where there were none before.40 World Bank (2006) notes that most of the recent growth in the telecommunications market has involved mobile phones outnumbering fixed ones. In Nigeria, for instance, the number of mobile subscribers jumped from 370,000 in 2001 to 16.8 million in September 2005. The report holds that mobile phones have an especially dramatic impact in developing countries by substituting for scarce fixed connections, increasing mobility, reducing transaction costs, broadening trade networks and facilitating searches for employment, all of which are elements conducive to higher levels of economic growth. As a liberalization indicator we choose the number of operators in the mobile phone market in Africa.41 As discussed above, we correct for simultaneity by using alternatively the GMM and 3SLS estimators. Appendix table 6 shows the results for the former, which are similar to the latter (presented in Appendix table 7) with all control variables having the correct sign. Our liberalization indicator proves insignificant for both estimation techniques. However, if an indicator of actual performance in terms of the number of subscribers (penetration) is substituted for the number of operators (or both are included) in the GMM estimation, we obtain a positive impact on per capita GDP at the 1% (5%) significance level. Enhancing the number of subscribers to mobile telephony services by 1 per cent translates into a 0.6 (0.5) per cent higher level of real GDP per capita in Africa. These results, while probably optimistic, appear more realistic than higher growth estimations, such as Mattoo et al. (2006). Using 3SLS, for a 1 per cent increase in penetration, we obtain a slightly higher impact on real GDP per capita of between 0.7 and 1 per cent (at the 1% and 10% levels of
40 See, for instance, Neue Zürcher Zeitung of 15 January 2006 for a powerful account of "virtual"
agricultural markets being established in Africa. 41 There is also more variation in the number of operators in the mobile than fixed market segments.

23
significance).42 Our system of equations simultaneously takes account of the relationships between unilateral and multilateral regulation and the number of operators (equation (3)), the number of operators and penetration (equation (2)) and penetration and changes in real GDP per capita (equation (1)). The 3SLS results confirm our earlier findings of a significantly positive relationship between regulation/liberalization and penetration. In other words, these policies have an indirect effect on real GDP developments by contributing to an increase in the number of subscribers. VII. CONCLUSIONS
In this paper, we have estimated the impact of telecommunications liberalization on sectoral performance, in terms of price and penetration. To accomplish this, we have examined the effects of introducing competition and of adopting new regulatory frameworks. Finally, we have studied the implications of the reforms for economic growth in Africa. In terms of sector performance, we are able to confirm that more competition and better regulation lead to lower prices and improved availability of telecommunications services in the mobile and fixed-line segments both in Africa and globally. Africa still suffers from higher prices compared to the world average, although reforms are beginning to contribute to a downward trend. Africa also seems to be catching up on overall penetration (mobile and fixed combined) compared to the world average by virtue of competition introduced in the mobile segment. For the African continent, the quality of regulation (at the sectoral level and of fixed line operators in particular) seems to play a major role in bringing down prices and improving access to telecommunication services. Better performance of the African telecommunications sector, in turn, improves real GDP per capita. Our findings on the importance of competition and regulation for sectoral performance are remarkably stable across samples. Globally, we also find evidence of improved performance when increased openness to competition and regulatory quality go hand in hand. As far as multilateral commitments are concerned, adherence to the Reference Paper is associated with price reductions at the world level. However, in Africa, unlike unilateral liberalization, multilateral liberalization measures have no significant impact on performance. These results may reflect the fact that most African reforms are too recent to have been included in the existing GATS commitments (undertaken in 1994 and 1997) and that some of the African commitments that do exist do not fully open the sector to competition. In fact, we observe that although only six African governments have formally committed to the Reference Paper, some of the governments undertaking reforms more recently have adopted "best practice" regulatory frameworks broadly consistent with the Reference Paper disciplines. The data confirm that the reforms in countries that had done so were more successful than the ones in countries that had not.
42 The results vary slightly depending on whether or not the maximum number of variables is
endogenized (beyond the variables already considered as endogenous in the performance equations).

24
References Baltagi, B. H., Bresson, G. and Pirotte, A. (2003) 'Fixed effects, random effects or Hausman-Taylor?: A pretest estimator', Economics Letters 79: 361-369. Banks, A. S. (2005) Cross-National Time-Series Data Archive, 1815-2003, Binghamton, NY: Databanks International. Barro, R. J. (1997) Determinants of Economic Growth: A Cross-Country Empirical Study, Cambridge, MA: MIT Press. Barro, R. J. (1999) "Determinants of Democracy", Journal of Political Economy 107, 6: 158-183. Boylaud, O. and Nicoletti, G. (2001), “Regulation, Market Structure and Performance in Telecommunications”, OECD Economic Studies 32: 99-142.. Chen, Z. and Schembri, L. (2002) 'Measuring the Barriers to Trade in Services: Literature and Methodologies', in Curtis, J. M. and Ciuriak, D. (eds.) Trade Policy Research 2002, Ottawa: Department of Foreign Affairs and International Trade (DFAIT): 219-286. Dollar, D. and Kraay, A. (2004) 'Trade, Growth, and Poverty', Economic Journal 114, 493: F22-F49(1). Doumbouya, S. F. and ILEAP (2004) 'Le Cycle des négociations du Millénaire : L’Afrique et le commerce international des services de télécommunications', mimeo. Ebang, A. and ILEAP (2005) 'La Participation Des Pays D’Afrique Centrale Aux Négociations Sur Le Commerce Des Services A L’OMC: Le Cas Du Gabon', mimeo. Easterly, W. and Levine, R. (1997) 'Africa's Growth Tragedy: Policies and Ethnic Divisions', Quarterly Journal of Economics 112, 4: 1203-1250. Fink, C., Mattoo, A. and Neagu, I. (2002) 'Trade in International Maritime Services: How Much Does Policy Matter', World Bank Economic Review 16, 1: 88-108.. Fink, C., Mattoo, A. and Rathindran, R. (2001) 'Liberalizing Basic Telecommunications: The Asian Experience', World Bank Policy Research Working Paper No. 2718, Washington, D.C.: World Bank. Fink, C., Mattoo, A. and Rathindran, R. (2002) An Assessment of Telecommunications Reform in Developing Countries', World Bank Policy Research Working Paper No. 2909, Washington, D.C.: World Bank. Francois, J. F. and Roland-Holst D. W. (1997) 'Scale Economies and Imperfect Competition', in Francois, J. F. and Reinert, K. A. (eds.) Applied Methods for Trade Policy Analysis: A Handbook, Cambridge University Press: New York: 331-363. Frisch, R. (1933) 'Propagation Problems and Impulse Response Problems in Dynamic Economics', in Economic Essays in Honour of Gustav Cassel: October 20th, 1933, London: George Allen & Unwin. Griffiths, W. E., Hill, R. C. and Judge, G. G. (1993) Learning and Practicing Econometrics, Hoboken, NJ: John Wiley & Sons. Hauffman, J. (2002) 'Mobile telephone', in: Cave, M. E. (ed.) (2002) Handbook of Telecommunications Economics, Amsterdam: Elsevier: 564-603.

25
Hausman, J. A. (1978) 'Specification tests in econometrics', Econometrica 46: 1251-1271. Hausman, J. A. and Taylor, W. E. (1981) 'Panel data and unobservable individual effects', Econometrica 49: 1377-1398. Hoekman, B. (1995) 'Assessing the General Agreement on Trade in Services', in: Martin, W. and Winter, L. A. (eds) The Uruguay Round and the Developing Economies, World Bank Discussion Paper No. 307, Washington, D.C.: The World Bank. Hodge, J. and Njinkeu, D. (2002) 'Télécommunications: Engagements, Politiques, Offres et Demandes éventuelles de l’Afrique', mimeo. International Telecommunications Union (ITU) (2004) Rapport annuel des télécommunications en Afrique, Geneva: ITU. International Telecommunications Union (ITU) (2005) World Telecommunication Indicators Database, 9th edition, Geneva: ITU. International Telecommunications Union (ITU) (2005a) Enquêtes de l’UIT sur la concurrence et les organes de regulations, Geneva: ITU. Available at http://www.itu.int/ITU-D/treg/index.html. Kalirajan, K. (2000), “Restrictions on Trade in Distribution Services”, Productivity Commission Staff Research Paper No. 1638, Ausinfo, Canberra. Kang, J. (2000) 'Price Impact of Restrictions on Maritime Transport Services', in: Findlay, C. and Warren, T. (2000) Impediments to Trade in Services: Measurement and Policy Implication, New York: Routledge: 189-201. Kaufmann, D., Kraay, A. and Mastruzzi, M. (2005) 'Governance Matters IV: Governance Indicators for 1996-2004', World Bank Policy Research Working Paper No. 3630, Washington, D.C.: World Bank. Available at http://www.worldbank.org/wbi/governance/wp-governance.htm Kemp, S. (2000) 'Trade in Education Services and the Impacts of Barriers to Trade', in: Findlay, C. and Warren, T. (2000) Impediments to Trade in Services: Measurement and Policy Implication, New York: Routledge: 231-245 Li, W. and Xu, L. C. (2004) 'The Impact of Privatization and Competition in the Telecommunications Sector around the World', Journal of Law and Economics 47: 395-430. Li, W. and Xu, L. C. (2002) 'The Political Economy of Privatization and Competition: Cross-Country Evidence from the Telecommunications Sector', Journal of Comparative Economics 30: 439-462. Low, P. and Mattoo, A. (1998) 'Reform in Basic Telecommunications and the WTO Negotiations: The Asian Experience, WTO Staff Working Paper No. ERAD-98-01, Geneva: WTO. Marchetti, J. A. (2004) 'Developing countries in the WTO services negotiations', WTO Staff Working Paper ERSD-2004-06, Geneva: WTO. Masanjala, W. H. and Papageorgiou, C. (2006) 'Initial Conditions, European Colonialism and Africa’s Growth', Louisiana State University (LSU) Economics Department Working Paper 2006-01, Baton Rouge, LA: LSU. Mattoo, A., Rathindran, R. and Subramanian, A. (2006) 'Measuring Services Trade Liberalization and Its Impact on Economic Growth: An Illustration', Journal of Economic Integration 21,1: 64-98.

26
McGuire, G. (2002) 'Restrictiveness of International Trade in Banking Services, in: Findlay, C. and Warren, T. (2000) Impediments to Trade in Services: Measurement and Policy Implication, New York: Routledge: 172-189. Megginson, W. L. and Netter, J. (2001) 'From State to Market: A Survey of Empirical Studies on Privatization', Journal of Economic Literature 39: 321-389. Nickell, S. (1996) 'Competition and Corporate Performance', Journal of Political Economy 104: 724-746. Nielson, J. and Taglioni, D. (2004) 'Services Trade Liberalisation: Identifying Opportunities and Gains'; Organization for Economic Co-operation and Development (OECD) Working Paper No.1 Paris: OECD. Norton, S. (1992) 'Transaction Costs, Telecommunications, and the Microeconomics of Macroeconomic Growth', Economic Development and Cultural Change 41(1): 175-196. Re-printed in OECD (2001), Revue économique 32: Paris: OECD. Rodriguez, F. and Rodrik, D. (2001) 'Trade Policy and Economic Growth: A Sceptic's Guide to the Cross-National Evidence', National Bureau for Economic Research (NBER), NBER Macroeconomics Annual 2000, Cambridge, MA: MIT Press: 261–324. Röller, L.-H. and Waverman, L. (2001) 'Telecommunication Infrastructure and Economic Development: A Simultaneous Approach', American Economic Review 91, 4: 909-923. Sachs, J. D. and Warner, A. M. (1997) 'Sources of Slow Growth in African Economies', Journal of African Economies 6, 3: 335-376. Sala-i-Martin, X. (1997) 'I Just Ran 2 Million Regressions', American Economic Review 87, 2: 178-183. Sala-i-Martin, X., Doppelhofer, G. and Miller, R. I. (2004) 'Determinants of Long-Term Growth: A Bayesian Averaging of Classical Estimates (BACE) Approach', American Economic Review 94, 4: 813-835. Shirley, M. M. (2001) 'The Effects of Regulation and Competition on Telecommunications in Africa', mimeo. Available at cbdd.wsu.edu/edev/kpi/shirley. Shleifer, A. (1998) 'State versus Private Ownership', Journal of Economic Perspectives 12: 133-150. Tusubira, F. F. (2006) 'Uganda's Approach to Universal Access to Telecommunications', in: Organization for Economic Co-operation and Development (OECD) and World Bank (2006) Liberalisation and Universal Access to Basic Services: Telecommunications, Water and Sanitation, Financial Services, and Electricity, Paris: OECD: 57-70. Wallsten, S. J. (2001) 'An Empirical Analysis of Telecom Competition, Privatization, and Regulation in Africa and Latin America', Journal of Industrial Economics 49: 1-19. Warren, T. (2000) 'The Impact on Output of Impediments to Trade and Investment in Telecommunications Services' in: Findlay, C. and Warren, T. (2000) Impediments to Trade in Services: Measurement and Policy Implication, New York: Routledge:85-101. Wooldridge, J. M. (2002) Econometric analysis of cross section and panel data, Cambridge, MA: MIT Press.

27
World Bank (2005) 'World Development Indicators', Washington, D.C.: World Bank. Available at http://www.worldbank.org/data/countrydata/countrydata.html World Bank (2006) Information and Communications for Development 2006: Global Trends and Policies, Washington, D.C.: World Bank. Zellner, A. and Theil, H. (1962) 'Three Stage Least Squares: Simultaneous Estimation of Simultaneous Equations', Econometrica 30: 63-68.

28
Appendix 1: Cournot conjectural variations model of the price for telecommunications services under imperfect competition
Telecommunications markets are characterized by oligopolies. To explore oligopoly interactions we use a so-called Cournot conjectural variations model.43 It is assumed that each firm produces a homogeneous product, faces a downward sloping demand curve and adjusts output to maximize profits, with a common market price as the equilibrating variable. The telecommunications industry is assumed to consist of n identical firms producing a collective output X = nXj. Following Frisch (1933), firms anticipate or "conjecture" the output responses of their competitors. When firm j changes its output, its conjecture with respect to the change in industry output is given by
)()(
jt
tjt Xd
Xd=Ω .
Using a representative profit function yields the first order condition for each firm j in period t: j
tj
t MCMR = (1) i.e. marginal revenue MRt
j equals marginal cost MCtj, with
)()(
)()(
jt
t
t
jtj
tj
tj
t XdXd
XdPdXPMR += (2)
where Ptj is the price of telecommunications services in firm j and period t, Xt
j is the quantity supplied by firm j in period t and Xt is the quantity offered by all firms on the market in period t. Given n identical firms, the equilibrium condition (1) can be written as
tt
jt
jt
jt
jt
nPMCP
εΩ=−
(3)
yielding the oligopoly pricing rule, with tε being the price elasticity of demand. (3) can be rewritten as
jt
jt
tt
jt
jtj
t MC
n
MCP λ
ε
=Ω−
=)1(
(4)
with )1(
1
tt
jt
jt
n ε
λΩ−
= representing the mark-up and hence a measure of an operator's market power.
For 0→Ω or ∞→n or ∞→ε , MCP → with the quantity produced by each firm approaching the perfect competition output and rents being eliminated. Conversely, for n=1 or Ω=n, we obtain a monopoly situation (total collusion of firms) with the mark-up corresponding to the inverse demand elasticity. Logarithmic transformation yields the following structural equation:
)log()log()log( it
it
it MCP λ+= (5)
expressing the log of price as the sum of the logs of marginal cost and market power. Market power: Pursuant to (4), market power is a function of the number of operators (n), the price elasticity of demand εt and the conjecture Ωt
j. While the number of operators n can be observed, proxies need to be found for the other two variables. We approximate the demand elasticity with a country's per capita income (GDPt) and the level of competition between telecommunications
43 For an overview of alternative specifications of market structure see also Francois and Roland-Holst
(1997).

29
segments s (sbstts; qp ss ≠ ). The conjecture is proxied by the market saturation satt
s44 and the quality of regulation (regt
s), as measured by unilateral (regulatory authority) and multilateral (GATS, Reference Paper) regulatory quality. In other words
),,,,()log( st
st
stt
st
st regsatsbstGDPng=λ (6)
where g is a log-linear function and the j superscript has been dropped since firms are symmetrical in each segment s. Marginal cost: In the absence of data on production factors, we follow the empirical literature which specifies marginal cost as a function of the quantity (pent
s) and quality of output (Qts). Economies of
scale and network economies are taken into account by introducing variables for market size (sizet) (population size or share of a country's GDP in global GDP) and for the distribution of the population (popdt) (population density or share of urban population). This gives us
),,,()log( ttst
st
st popdsizeQpenfMC = (7)
where f is a log-linear function and the j superscript has been dropped since firms are symmetrical in each segment s. Substituting (6) and (7) into (5) yields the reduced form equation for estimation in Section V.A.1.
44 Market saturation is highly correlated to penetration.

Appendix 2: Data tables
Appendix table 1: Partial correlations between performance (in logs) and liberalization indicators
World Price mobile
Price local fixed
Price int'nat fixed
Penetration mobile
Penetration fixed
Unilateral regulation
Multilateral openness
Multilateral regulation
Local fixed operator
Int'nat fixed operator
Mobile operator
Price mobile 1
Price local fixed 0.7548* 1
Price international fixed -0.3287* -0.4960* 1
Penetration mobile 0.0154 0.1319* -0.5454* 1
Penetration fixed 0.2608* 0.0608* -0.4170* 0.6491* 1
Unilateral regulation -0.1658* -0.1044* 0.1973* -0.0991* -0.0787* 1
Multilateral openness 0.2218* 0.1133* -0.3300* 0.2003* 0.3789* -0.4064* 1
Multilateral regulation 0.2715* 0.1938* -0.3557* 0.2832* 0.4522* -0.2945* 0.7216* 1
Local fixed operator 0.0479 0.0797* -0.3490* 0.3459* 0.2503* -0.1326* 0.3855* 0.4432* 1
International fixed operator 0.1155* 0.1290* -0.3845* 0.4297* 0.3179* -0.1404* 0.3939* 0.4957* 0.8055* 1
Mobile operator 0.0653* 0.0119 -0.0298 0.1992* 0.0347 0.004 0.1856* 0.1663* 0.3290* 0.3300* 1 * Significant at 10%; note: Operator refers to the competition score that forms the unilateral openness indicator.
Africa Price mobile
Price local fixed
Price int'nat fixed
Penetration mobile
Penetration fixed
Unilateral regulation
Multilateral openness
Multilateral regulation
Local fixed operator
Int'nat fixed operator
Mobile operator
Price mobile 1
Price local fixed 0.3758* 1
Price international fixed -0.0226 0.0262 1
Penetration mobile -0.1426 0.2075* -0.2631* 1
Penetration fixed -0.4439* -0.2564* -0.1428 0.6411* 1
Unilateral regulation 0.1086 -0.0768 -0.0385 -0.0658 -0.4770* 1
Multilateral openness 0.1741 -0.1572 -0.1136 0.2965* 0.2262* -0.0082 1
Multilateral regulation 0.1824 -0.0981 -0.1636 0.3254* 0.2249* 0.1076 0.8059* 1
Local fixed operator 0.0136 -0.0558 -0.1172 -0.0374 0.2487* 0.2185* 0.0819 0.0861 1
International fixed operator 0.2893* 0.2060* -0.0998 -0.0201 -0.3233* 0.0779 -0.0486 0.0378 0.6529* 1
Mobile operator 0.3024* 0.1528 -0.1522 0.2587* -0.1045 0.2327* 0.0487 0.2065* 0.1830* 0.4312* 1 * Significant at 10%; note: Operator refers to the competition score that forms the unilateral openness indicator.

31
Appendix table 2: Results Sub-Saharan Africa and world samples, local fixed segment – dependent variable: log of price for three-minutes call, log of average annual bill and log of penetration
Africa World
Price 3 min. call
Price 3 min. call
Average annual bill
Average annual bill
Penetration Penetration Price 3 min. call
Price 3 min. call
Average annual bill
Average annual bill
Penetration Penetration
Number of operators -0.005 -0.010 -0.138 -0.120 -0.005 -0.002 -0.022 -0.008 -0.127 -0.119 0.020 -0.053 (0.04) (0.07) (1.52) (1.32) (0.09) (0.02) (0.37) (0.13) (2.65)*** (2.45)** (0.36) (1.32) Regulatory authority 0.131 0.128 -0.242 -0.243 0.301 0.252 0.000 0.004 -0.027 -0.023 0.108 0.016 (1.29) (1.27) (4.05)*** (4.04)*** (6.92)*** (4.88)*** (0.01) (0.12) (0.94) (0.79) (3.40)*** (0.74) GATS commitments 2.566 2.534 -0.854 -0.771 0.546 -0.570 1.312 1.812 1.195 1.520 0.674 -1.172 (0.32) (0.32) (0.77) (0.86) (0.52) (0.18) (1.02) (1.47) (1.21) (1.44) (0.17) (0.56) Reference Paper 0.495 0.377 0.310 0.350 -0.097 0.764 -1.406 -2.042 -1.642 -2.051 -0.218 0.900 (0.08) (0.06) (0.36) (0.50) (0.14) (0.30) (1.52) (2.38)** (2.34)** (2.91)*** (0.08) (0.64) Africa 0.593 1.064 1.082 1.441 -0.439 -2.155 (0.67) (1.27) (1.56) (2.01)** (0.23) (1.52)
Real GDP/capita 0.276 0.279 -0.670 -0.552 0.730 0.422 0.562 0.578 0.671 0.675 0.238 0.083 (0.48) (0.49) (2.04)** (1.81)* (2.59)** (1.36) (4.65)*** (4.69)*** (6.10)*** (6.06)*** (3.37)*** (1.92)* Population density -0.007 -0.008 -0.002 -0.002 0.457 0.998 -0.000 -0.000 0.000 0.000 1.016 -0.055 (0.54) (0.60) (0.85) (0.76) (1.60) (1.60) (0.69) (0.57) (0.19) (0.26) (2.17)** (0.23) Population size -2.786 -2.714 -0.449 -0.520 -0.174 -0.109 0.040 0.038 0.138 0.460 (1.76)* (1.74)* (1.30) (1.73)* (0.25) (0.45) (0.17) (0.19) (0.68) (1.63) Digital lines(%) -0.127 -0.182 0.276 0.353 -0.126 0.169 -0.006 -0.009 -0.256 -0.252 0.134 0.124 (0.22) (0.33) (0.60) (0.77) (0.56) (0.52) (0.04) (0.06) (1.80)* (1.75)* (0.85) (1.09) Relative size of economy -0.154 -0.150 0.375 0.384 0.347 0.323 0.201 0.190 (0.50) (0.49) (1.81)* (1.84)* (3.15)*** (2.88)*** (1.99)** (1.87)* Time trend 1.338 1.261 -3.340 -3.239 2.764 2.959 -0.052 -0.175 -2.504 -2.585 2.282 2.221 (1.73)* (1.69)* (10.53)*** (10.92)*** (15.18)*** (10.25)*** (0.34) (1.23) (18.74)*** (20.57)*** (14.91)*** (22.08)*** Penetration -0.113 0.220 -0.298 -0.206 (0.40) (1.29) (2.07)** (1.70)* Urban population 0.336 1.119 (0.81) (4.51)*** Price 3 min. call -0.353 -0.125 -0.191 -0.009 (6.93)*** (2.02)** (3.57)*** (0.27) Constant 31.514 30.919 22.330 22.804 -12.171 -9.787 -1.582 -4.558 8.956 6.961 -14.549 -10.080 (1.25) (1.24) (2.80)*** (2.96)*** (6.04)*** (0.92) (0.31) (0.92) (1.99)** (1.56) (4.86)*** (2.31)**
Observations 97 97 85 85 41 97 400 400 344 344 162 400 Number of groups 27 27 24 24 17 27 100 100 90 90 62 100
Note: The dependent variable is taken from ITU (2005). Absolute values of t-statistics are reported in brackets. */**/*** indicate significance at the 10/5/1% level. The Wald χ2 test is significant at the 1% level in all regressions. Estimation technique: Hausman-Taylor (1981).

32
Appendix table 3: Results Sub-Saharan Africa and world samples, mobile segment – dependent variable: log of price for three-minutes call, log of average annual bill and log of penetration Africa World
Price 3 min. call
Price 3 min. call
Average annual bill
Average annual bill
Penetration Penetration Price 3 min. call
Price 3 min. call
Average annual bill
Average annual bill
Penetration Penetration
Number of operators -0.081 -0.067 -0.359 -0.354 0.857 0.783 -0.038 -0.043 -0.042 -0.231 0.474 0.676 (1.03) (1.01) (1.65) (1.93)* (5.79)*** (1.90)* (0.58) (0.70) (0.55) (2.60)*** (6.16)*** (6.14)*** Regulatory authority 0.061 0.066 -0.259 -0.257 0.125 0.088 -0.003 -0.002 -0.031 0.020 -0.007 0.105 (0.96) (1.08) (1.54) (1.57) (0.93) (0.21) (0.05) (0.04) (0.53) (0.29) (0.12) (1.24) GATS commitments 0.470 0.495 -0.912 -0.912 1.873 9.179 3.177 3.085 1.101 1.185 -0.315 12.325 (0.15) (0.17) (0.20) (0.21) (0.10) (1.12) (1.13) (1.19) (0.35) (1.84)* (0.05) (0.94) Reference Paper -1.235 -1.239 0.770 0.792 -9.998 -7.369 -3.913 -3.770 -1.579 -1.789 -1.160 -8.293 (0.45) (0.48) (0.19) (0.20) (0.61) (1.10) (2.06)** (2.15)** (0.81) (4.09)*** (0.28) (0.86) Africa 1.123 1.177 0.251 1.014 -3.215 3.623 (0.56) (0.64) (0.10) (2.11)** (0.76) (0.63) Real GDP/capita 0.376 0.408 -2.907 -2.896 0.562 0.213 0.748 0.744 0.319 0.270 0.150 -0.022 (1.47) (1.73)* (4.71)*** (5.11)*** (2.08)** (0.15) (4.00)*** (3.98)*** (1.56) (1.07) (1.55) (0.11) Population density 0.308 0.302 -0.111 -0.108 3.458 1.690 0.797 0.742 0.200 0.137 -0.078 3.088 (0.55) (0.56) (0.12) (0.13) (1.52) (1.18) (1.96)* (1.91)* (0.44) (1.15) (0.12) (2.00)** Population size 0.469 0.495 -2.579 -2.587 7.317 0.845 0.768 0.109 -0.131 2.649 (0.74) (0.82) (2.32)** (2.43)** (2.65)*** (1.71)* (1.65)* (0.19) (0.49) (3.11)*** Digital lines(%) -0.005 0.001 -0.487 -0.483 0.260 0.106 0.123 0.120 -0.055 -0.187 0.300 -0.336 (0.04) (0.01) (1.55) (1.61) (0.93) (0.11) (1.19) (1.17) (0.39) (1.11) (2.36)** (1.59) Relative size ofeconomy
-0.052 -0.079 2.610 2.602 0.169 0.173 0.572 0.566
(0.23) (0.36) (4.66)*** (4.92)*** (0.96) (0.98) (2.95)*** (2.37)** Time trend -0.059 -0.048 -0.350 -0.345 0.364 0.535 -0.127 -0.131 -0.032 -0.228 0.425 0.469 (1.40) (1.76)* (2.90)*** (5.56)*** (4.54)*** (4.04)*** (4.60)*** (7.12)*** (0.94) (8.87)*** (17.35)*** (12.77)*** Penetration 0.017 0.007 -0.011 -0.425 (0.33) (0.04) (0.24) (7.41)*** Urban population 4.259 3.197 (1.53) (3.95)*** Price 3 min. call 0.018 0.118 -0.037 -0.019 (0.07) (0.13) (0.52) (0.19) Constant -14.290 -15.273 90.852 90.756 -134.244 -27.983 -19.640 -18.164 6.859 12.511 -44.080 -33.503 (1.20) (1.39) (3.83)*** (4.07)*** (3.13)*** (2.66)** (2.08)** (2.01)** (0.64) (1.51) (3.32)*** (3.31)*** Observations 98 98 72 72 98 39 329 329 268 268 329 139 Number of groups 27 27 23 23 27 15 87 87 76 76 87 51 Note: The dependent variable is taken from ITU (2005). Absolute values of t-statistics are reported in brackets. */**/*** indicate significance at the 10/5/1% level. The Wald χ2 test is significant at the 1% level in all regressions. Estimation technique: Hausman-Taylor (1981).

33
Appendix table 4: Results Sub-Saharan Africa and world samples, international segment – dependent variable: log of price for three-minutes call to the US
Africa World Price 3 min.
call to US Price 3 min. call to US
Price 3 min. call to US
Price 3 min. call to US
Number of operators -0.072 -0.070 0.012 0.014 (1.22) (1.27) (1.51) (1.80)* Regulatory authority -0.003 -0.002 0.002 0.002 (0.13) (0.11) (0.59) (0.68)
GATS commitments -0.517 -0.512 -0.094 -0.046 (0.51) (0.50) (1.54) (0.74)
Reference Paper 0.274 0.276 0.086 0.028 (0.40) (0.41) (1.83)* (0.66)
Africa -0.074 -0.014 (1.60) (0.34)
Real GDP/capita 0.452 0.457 0.118 0.117 (2.84)*** (3.01)*** (8.50)*** (8.79)***
Population density -0.001 -0.001 -0.000 -0.000 (0.73) (0.73) (0.52) (0.28)
Population size 0.415 0.414 0.111 0.127 (1.78)* (1.79)* (6.51)*** (8.26)***
Digital lines(%) -0.938 -0.937 -0.008 -0.002 (5.88)*** (5.94)*** (0.46) (0.11)
Relative size of economy -0.396 -0.398 -0.132 -0.134 (4.84)*** (5.15)*** (10.67)*** (11.28)***
Time trend 0.015 0.016 -0.001 -0.003 (1.01) (1.24) (0.74) (1.82)*
Penetration 0.008 -0.031 (0.09) (2.20)**
Constant -9.042 -9.080 -3.774 -4.129 (2.04)** (2.07)** (8.12)*** (9.73)***
Observations 74 74 265 265 Number of groups 25 25 91 91
Note: The dependent variable is taken from ITU (2005). Absolute values of t-statistics are reported in brackets. */**/*** indicate significance at the 10/5/1% level. The Wald χ2 test is significant at the 1% level in all regressions. Estimation technique: Hausman-Taylor (1981).
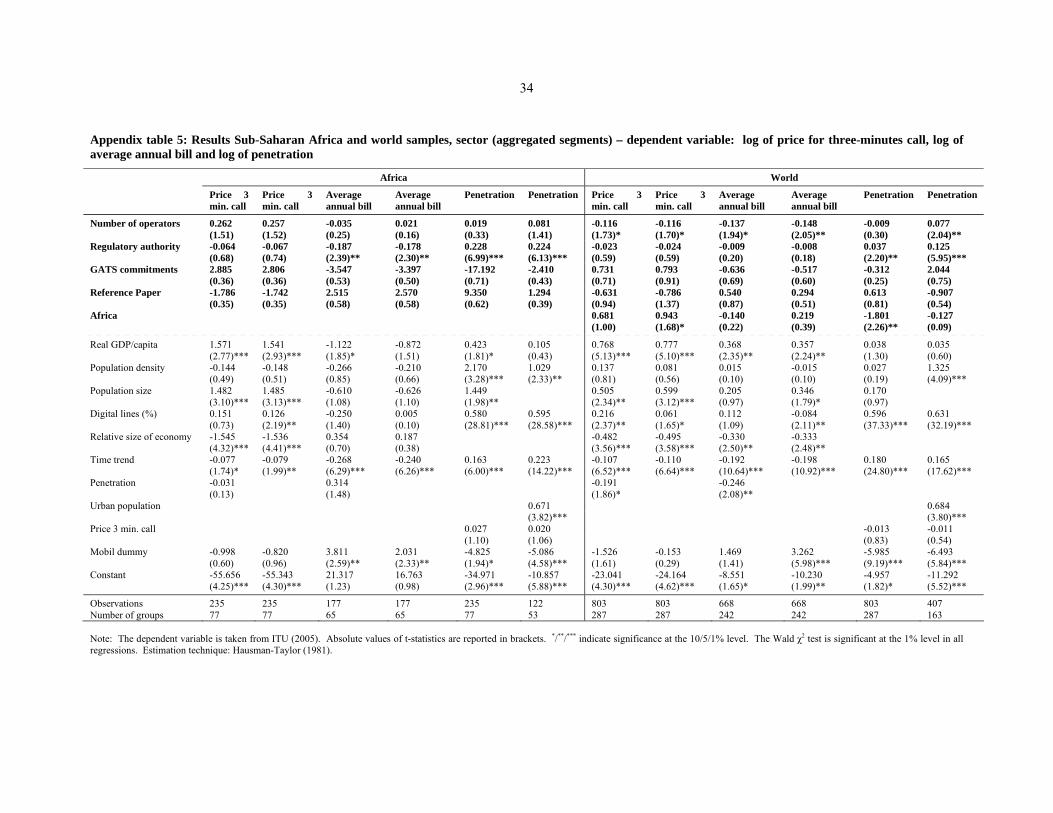
34
Appendix table 5: Results Sub-Saharan Africa and world samples, sector (aggregated segments) – dependent variable: log of price for three-minutes call, log of average annual bill and log of penetration Africa World
Price 3 min. call
Price 3 min. call
Average annual bill
Average annual bill
Penetration Penetration Price 3 min. call
Price 3 min. call
Average annual bill
Average annual bill
Penetration Penetration
Number of operators 0.262 0.257 -0.035 0.021 0.019 0.081 -0.116 -0.116 -0.137 -0.148 -0.009 0.077 (1.51) (1.52) (0.25) (0.16) (0.33) (1.41) (1.73)* (1.70)* (1.94)* (2.05)** (0.30) (2.04)** Regulatory authority -0.064 -0.067 -0.187 -0.178 0.228 0.224 -0.023 -0.024 -0.009 -0.008 0.037 0.125 (0.68) (0.74) (2.39)** (2.30)** (6.99)*** (6.13)*** (0.59) (0.59) (0.20) (0.18) (2.20)** (5.95)*** GATS commitments 2.885 2.806 -3.547 -3.397 -17.192 -2.410 0.731 0.793 -0.636 -0.517 -0.312 2.044 (0.36) (0.36) (0.53) (0.50) (0.71) (0.43) (0.71) (0.91) (0.69) (0.60) (0.25) (0.75) Reference Paper -1.786 -1.742 2.515 2.570 9.350 1.294 -0.631 -0.786 0.540 0.294 0.613 -0.907 (0.35) (0.35) (0.58) (0.58) (0.62) (0.39) (0.94) (1.37) (0.87) (0.51) (0.81) (0.54) Africa 0.681 0.943 -0.140 0.219 -1.801 -0.127 (1.00) (1.68)* (0.22) (0.39) (2.26)** (0.09)
Real GDP/capita 1.571 1.541 -1.122 -0.872 0.423 0.105 0.768 0.777 0.368 0.357 0.038 0.035 (2.77)*** (2.93)*** (1.85)* (1.51) (1.81)* (0.43) (5.13)*** (5.10)*** (2.35)** (2.24)** (1.30) (0.60) Population density -0.144 -0.148 -0.266 -0.210 2.170 1.029 0.137 0.081 0.015 -0.015 0.027 1.325 (0.49) (0.51) (0.85) (0.66) (3.28)*** (2.33)** (0.81) (0.56) (0.10) (0.10) (0.19) (4.09)*** Population size 1.482 1.485 -0.610 -0.626 1.449 0.505 0.599 0.205 0.346 0.170 (3.10)*** (3.13)*** (1.08) (1.10) (1.98)** (2.34)** (3.12)*** (0.97) (1.79)* (0.97) Digital lines (%) 0.151 0.126 -0.250 0.005 0.580 0.595 0.216 0.061 0.112 -0.084 0.596 0.631 (0.73) (2.19)** (1.40) (0.10) (28.81)*** (28.58)*** (2.37)** (1.65)* (1.09) (2.11)** (37.33)*** (32.19)*** Relative size of economy -1.545 -1.536 0.354 0.187 -0.482 -0.495 -0.330 -0.333 (4.32)*** (4.41)*** (0.70) (0.38) (3.56)*** (3.58)*** (2.50)** (2.48)** Time trend -0.077 -0.079 -0.268 -0.240 0.163 0.223 -0.107 -0.110 -0.192 -0.198 0.180 0.165 (1.74)* (1.99)** (6.29)*** (6.26)*** (6.00)*** (14.22)*** (6.52)*** (6.64)*** (10.64)*** (10.92)*** (24.80)*** (17.62)*** Penetration -0.031 0.314 -0.191 -0.246 (0.13) (1.48) (1.86)* (2.08)** Urban population 0.671 0.684 (3.82)*** (3.80)*** Price 3 min. call 0.027 0.020 -0.013 -0.011 (1.10) (1.06) (0.83) (0.54) Mobil dummy -0.998 -0.820 3.811 2.031 -4.825 -5.086 -1.526 -0.153 1.469 3.262 -5.985 -6.493 (0.60) (0.96) (2.59)** (2.33)** (1.94)* (4.58)*** (1.61) (0.29) (1.41) (5.98)*** (9.19)*** (5.84)*** Constant -55.656 -55.343 21.317 16.763 -34.971 -10.857 -23.041 -24.164 -8.551 -10.230 -4.957 -11.292 (4.25)*** (4.30)*** (1.23) (0.98) (2.96)*** (5.88)*** (4.30)*** (4.62)*** (1.65)* (1.99)** (1.82)* (5.52)***
Observations 235 235 177 177 235 122 803 803 668 668 803 407 Number of groups 77 77 65 65 77 53 287 287 242 242 287 163 Note: The dependent variable is taken from ITU (2005). Absolute values of t-statistics are reported in brackets. */**/*** indicate significance at the 10/5/1% level. The Wald χ2 test is significant at the 1% level in all regressions. Estimation technique: Hausman-Taylor (1981).

35
Appendix table 6: Results Sub-Saharan Africa, mobile segment – dependent variable: log of real GDP per capita; estimation method: Generalized Method of Moments (GMM)
Real GDP/capita Real GDP/capita Real GDP/capita
Number of operators 0.015 0.009 (1.31) (1.17) Penetration 0.006 0.005 (3.09)*** (2.11)**
Real GDP/capita (-1) 1.001 0.993 1.000 (118.32)*** (134.86)*** (137.33)*** Investment 0.055 0.044 0.048 (3.81)*** (4.15)*** (4.22)*** Education 0.003 -0.005 -0.011 (0.32) (0.77) (1.45) Life expectancy -0.020 -0.012 -0.004 (0.65) (0.42) (0.10) Inflation -0.009 -0.008 -0.008 (1.96)* (2.24)** (2.17)** Trade openness 0.007 0.006 0.006 (0.60) (0.58) (0.59) Political stability -0.384 -0.268 -0.623 (0.55) (0.51) (1.21) Constant 1.668 1.235 2.769 (0.53) (0.52) (1.20)
Observations 185 183 177 Number of groups 41 41 40
Note: The dependent variable is taken from World Bank (2005). Absolute values of t-statistics are reported in brackets. */**/*** indicate significance at the 10/5/1% level.

36
Appendix table 7: Results Sub-Saharan Africa, mobile segment – dependent variable: log of real GDP per capita; estimation method: Three-stage least squares
Variable endogenous Variable not endogenous
(1) Real GDP/capita
Penetration mobile 0.066 0.100 (1.87)* (3.17)*** Investment 0.873 0.263 (2.16)** (1.96)* Inflation 0.040 0.068 (0.55) (1.98)** Education 0.505 0.497 (7.02)*** (7.90)*** Life expectancy 0.021 0.107 (0.07) (0.36) Trade openness 0.227 0.280 (1.56) (2.70)*** Political stability 3.410 10.267 (0.45) (1.97)** Constant -12.040 -42.264 (0.35) (1.78)*
(2) Penetration mobile
Number of operators 1.134 0.549 (2.00)** (1.77)* Population density -0.032 0.032 (0.51) (0.59) Penetration fixed 1.384 1.074 (12.86)*** (15.27)*** Urban population -0.481 0.084 (1.85)* (0.43) Price mobile 0.555 0.257 (3.34)*** (4.12)*** Time trend 0.714 0.666 (8.55)*** (12.90)*** Constant -1,421.884 -1,332.518 (8.55)*** (12.92)***
(3) Number of operators Relative size of economy -0.026 -0.012 (1.19) (0.64) War -0.302 -0.210 (3.19)*** (2.37)** Population -0.004 0.011 (0.08) (0.26) General regulatory quality -12.450 -7.362 (1.49) (0.99) Regulatory authority 106.015 57.596 (2.48)** (2.68)*** Reference paper 0.172 0.207 (1.50) (2.73)*** GATS commitments 0.126 -0.052 (0.58) (0.47) Constant 57.698 34.224 (1.49) (1.00)
Observations 154 154
Note: The dependent variable is taken from World Bank (2005). Absolute values of z-statistics are reported in brackets. */**/*** indicate significance at the 10/5/1% level. The three equations containing real GDP per capita, the number of operators and penetration in the mobile segment as left-hand side variables respectively are estimated simultaneously. In the third column, investment, price (mobile), penetration (fixed), inflation, regulatory authority and GATS commitments are considered as endogenous (in addition to the explicitly endogenous variables of the model). We consider these variables to represent the most appropriate selection of endogenous variables within the limits imposed by 3SLS taking account of the fact that the column dimension of the matrix of all exogenous variables being equal or greater than the column dimension of the matrix of endogenous and exogenous variables in each equation. See Judge et al. (1993).