Embed Size (px)
Citation preview

Telecom use on a Telecom use on a shoestring:shoestring:
Some findings from a study of the Some findings from a study of the Financially Constrained in South AsiaFinancially Constrained in South Asia
Ayesha Zainudeen, Rohan Samarajiva, Harsha de Silva, Avanti Moonesinghe and
Ayoma Abeysuriya, with thanks to Sriganesh Lokanathan
www.lirneasia.netwww.lirneasia.net
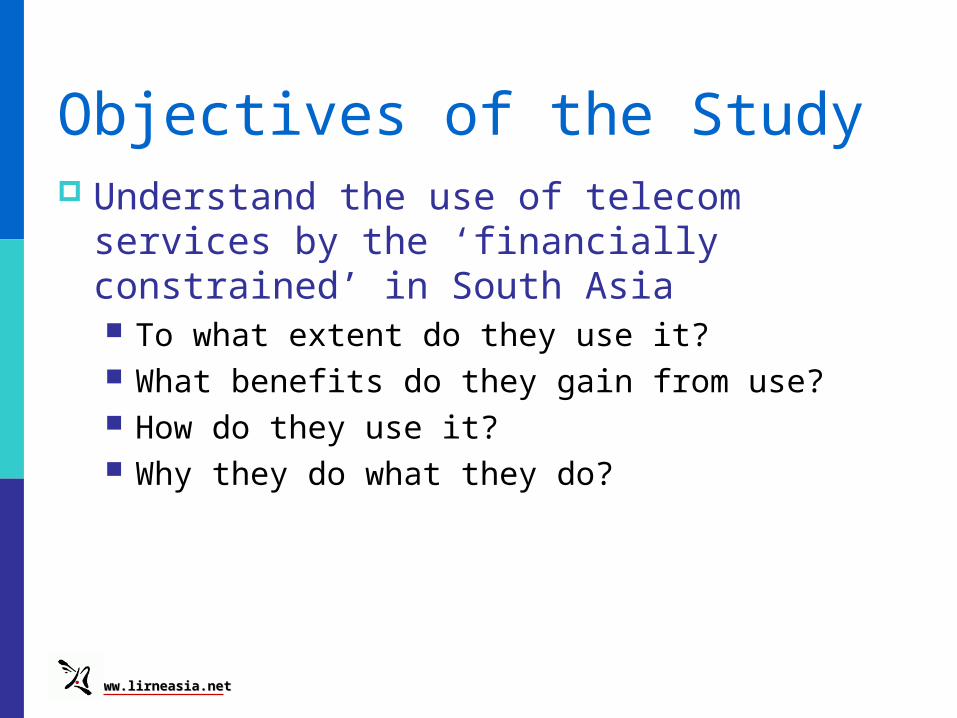
Objectives of the Study Understand the use of telecom services by
the ‘financially constrained’ in South Asia To what extent do they use it? What benefits do they gain from use? How do they use it? Why they do what they do?
www.lirneasia.netwww.lirneasia.net
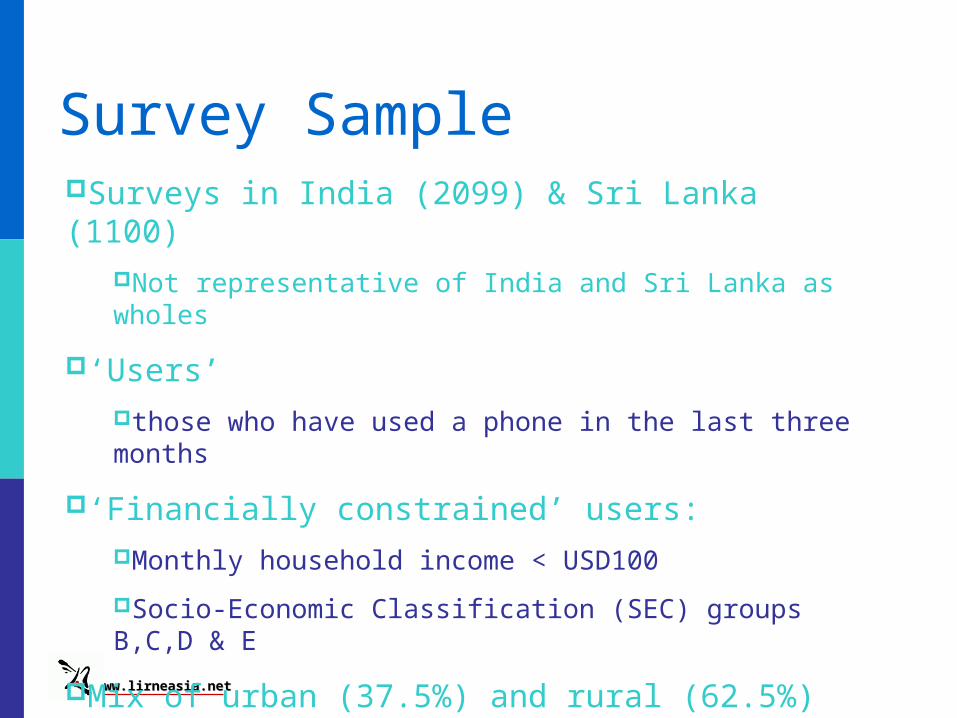
Survey SampleSurveys in India (2099) & Sri Lanka (1100)
Not representative of India and Sri Lanka as wholes
‘Users’those who have used a phone in the last three months
‘Financially constrained’ users:Monthly household income < USD100
Socio-Economic Classification (SEC) groups B,C,D & E
Mix of urban (37.5%) and rural (62.5%) respondents

www.lirneasia.netwww.lirneasia.net
Sri Lanka: 1100 respondents, 4 locations, 2 languages
Colombo - capital city, urban landscape
Badulla – rural, plantation economy, hill country
Jaffna – post conflict area, high migration
Hambantota – rural, tsunami affected
www.lirneasia.netwww.lirneasia.net
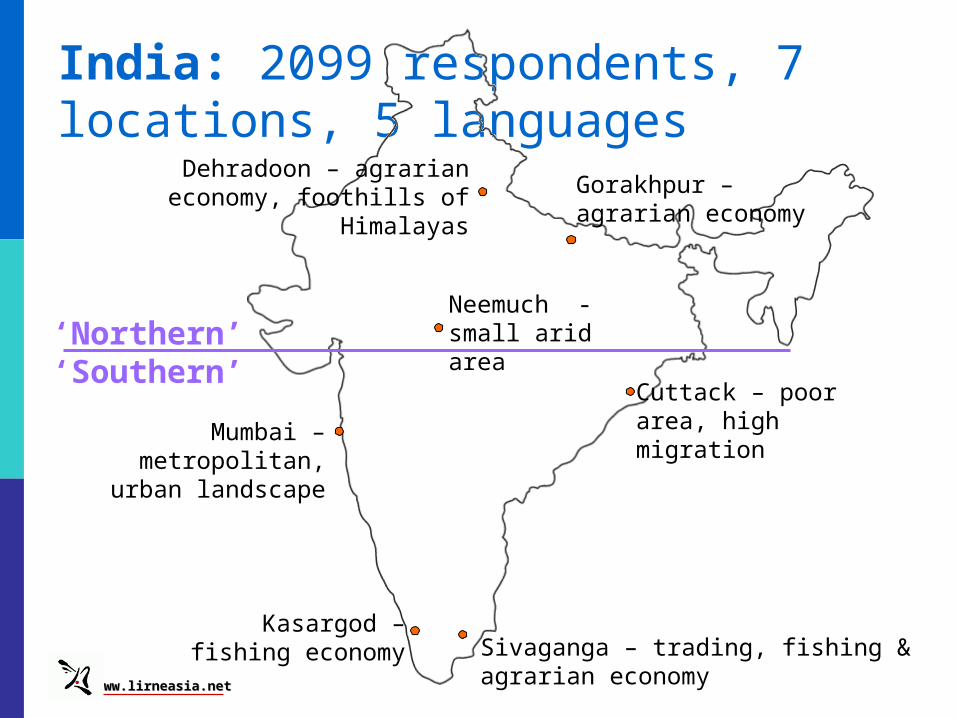
India: 2099 respondents, 7 locations, 5 languages
Dehradoon – agrarian economy, foothills of
Himalayas
Sivaganga – trading, fishing & agrarian economy
Kasargod – fishing economy
Neemuch - small arid area
Cuttack – poor area, high migration
Gorakhpur – agrarian economy
Mumbai – metropolitan, urban
landscape
‘Northern’‘Southern’
www.lirneasia.netwww.lirneasia.net
Survey ‘Mode’ of access:
fixed, mobile, ‘public access’ Reasons for selecting mode What does user do with it Ownership How telecom services are used Difficulties faced Use of Internet & telegrams

www.lirneasia.netwww.lirneasia.net
Ownership patterns by income
24
52
23
51 49
77
49
76
0
10
20
30
40
50
60
70
80
90
SL <50 SL > 50 India <50 India > 50
Own Don't Own
Doubling of phone ownership in the higher income bracket within the survey groups in both India and Sri Lanka
Sri Lanka India
< USD 50 > USD 50 < USD 50 > USD 50
Landline Only
2 20 19 37
Mobile Only
21 28 3 8
Landline and Mobile
1 4 1 6
www.lirneasia.netwww.lirneasia.net
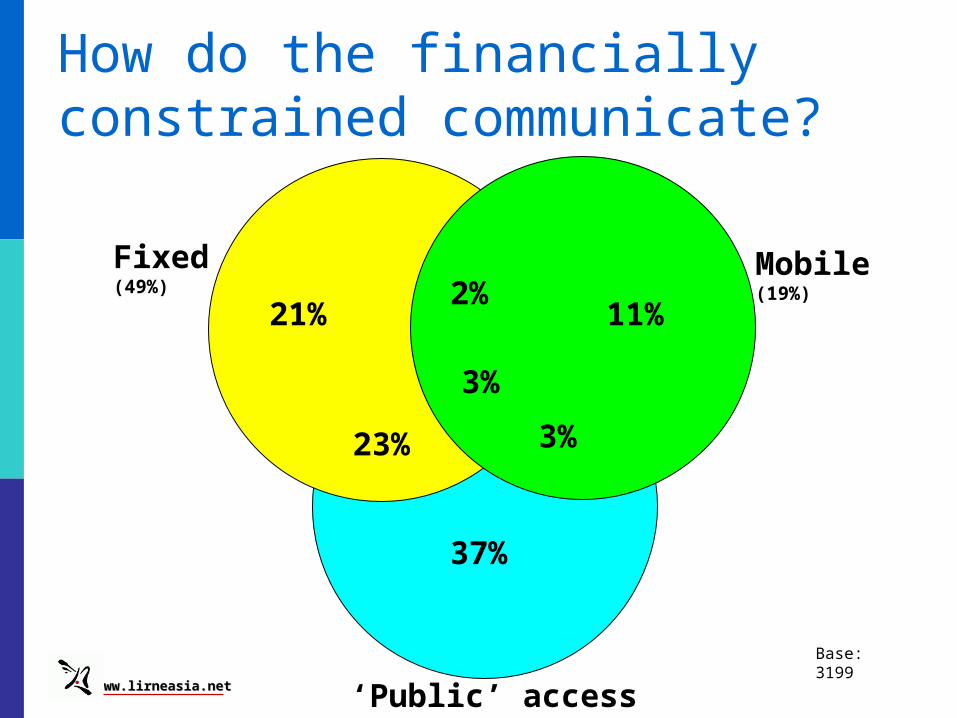
How do the financially constrained communicate?
Fixed(49%)
Mobile(19%)
‘Public’ access (66%)
21%2%
11%
3%23%
3%
37%
Base: 3199

www.lirneasia.netwww.lirneasia.net
Mobile users talk longer than fixed users (incl. public phone users)
0
10
20
30
40
50
60
outgoing incoming outgoing incoming
fixed mobile
aver
age
num
ber
of
calls
per
mo
nth
Sri Lanka Northern India Southern India

www.lirneasia.netwww.lirneasia.net
Mode: still primarily public phones . . .
0
10
20
30
40
50
60
70
80
90
Sri Lanka Northern India Southern India
% o
f re
spo
nd
ents
wh
o u
se...
Public access
Fixed phone
Mobile
Bases :Sri Lanka =1100 North India =1195 South India = 904
www.lirneasia.netwww.lirneasia.net
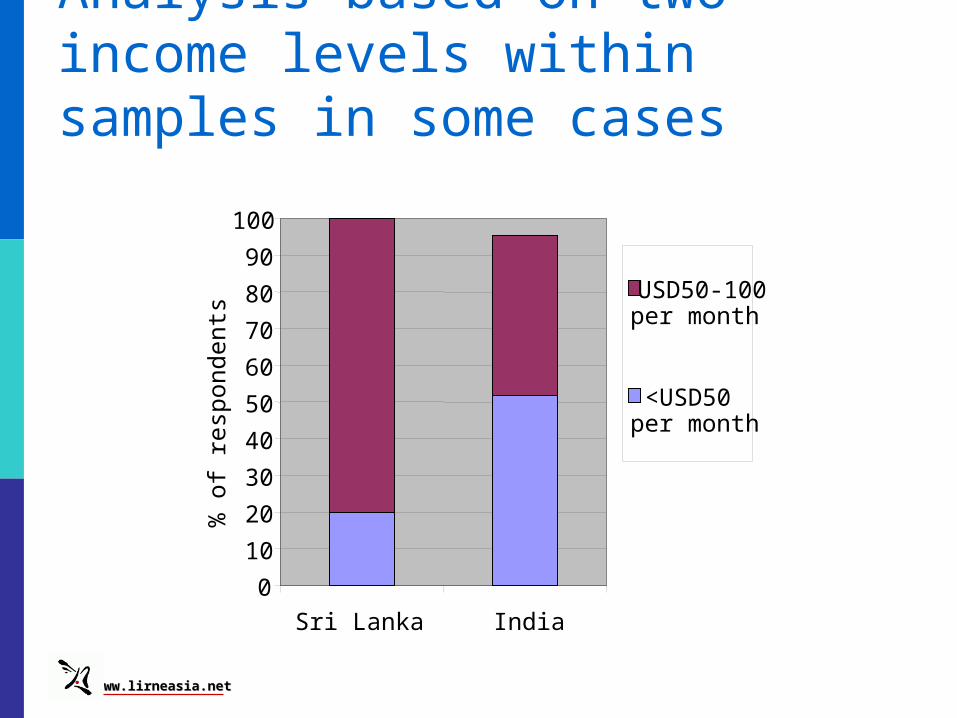
Analysis based on two income levels within samples in some cases
0
10
20
30
40
50
60
70
80
90
100
Sri Lanka India
% o
f re
spon
dent
s
USD50-100per month
<USD50per month
www.lirneasia.netwww.lirneasia.net
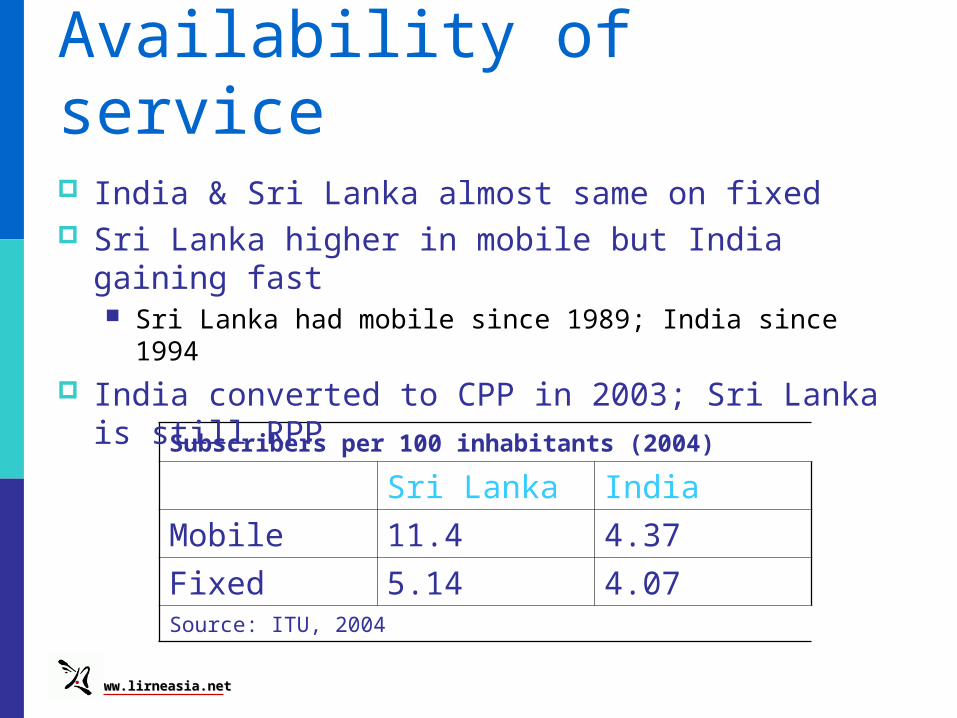
Subscribers per 100 inhabitants (2004)
Sri Lanka India
Mobile 11.4 4.37
Fixed 5.14 4.07Source: ITU, 2004
Availability of service India & Sri Lanka almost same on fixed Sri Lanka higher in mobile but India gaining fast
Sri Lanka had mobile since 1989; India since 1994 India converted to CPP in 2003; Sri Lanka is still
RPP
www.lirneasia.netwww.lirneasia.net
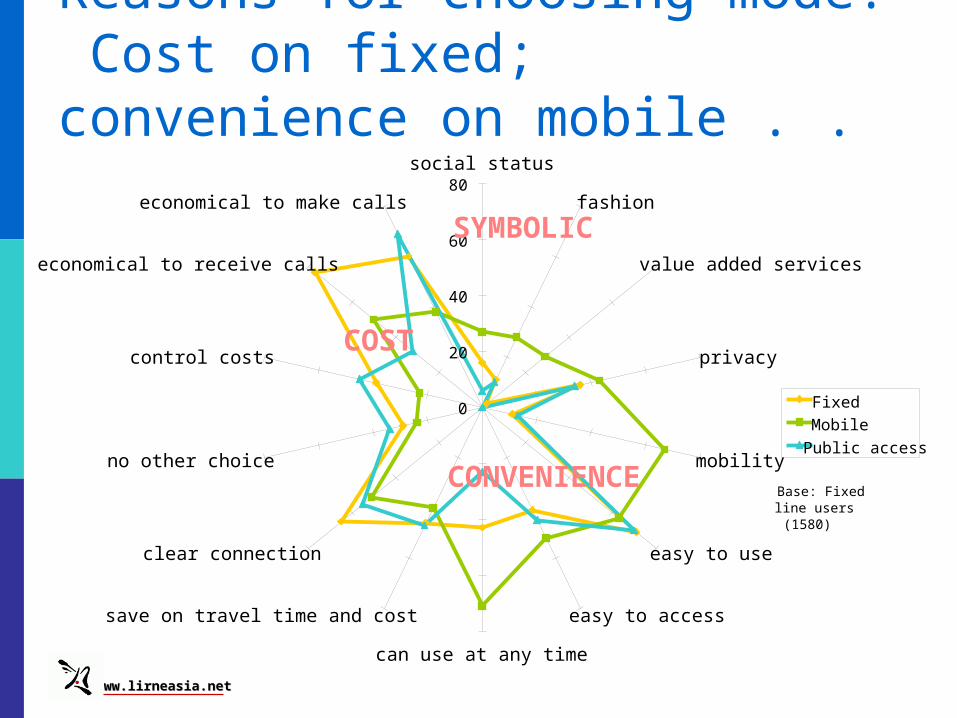
Reasons for choosing mode: Cost on fixed; convenience on mobile . .
0
20
40
60
80social status
fashion
value added services
privacy
mobility
easy to use
easy to access
can use at any time
save on travel time and cost
clear connection
no other choice
control costs
economical to receive calls
economical to make calls
Fixed
Mobile
Public access
COST
CONVENIENCE Base: Fixed line users (1580)
SYMBOLIC

www.lirneasia.netwww.lirneasia.net
Some intra-regional variations Southern India differs from rest of sample: as
though on ‘steroids’ ‘Social status’ (57%) and ‘fashion’ (60%) rated
higher in (South) Indian locations for mobiles (SL: 7%, 7%)
Higher rating of ‘most economical way to receive calls’ on mobiles in Indian locations (72% vs. 35% in SL) Despite India being CPP since 2003!
More concern for mobility and privacy amongst Indian mobile users; ability to call any time is a big concern amongst Northern Indian mobile users

www.lirneasia.netwww.lirneasia.net
0
20
40
60
80
100keeping in touch (national)
keeping in touch (international)
send news & messages
receive news & messages
financial transactions
business transactions/enquiries
arranging logistics
access Internet
fixedmobilepublic access
BASES:Fixed: 1580Mobile: 616Public: 2106
Uses of telecom: It’s relationships…
INSTRUMENTAL
RELATIONSHIP MAINTAINANCE

www.lirneasia.netwww.lirneasia.net
Use of mobiles: relationships in SL; also some instrumental use in India
0
20
40
60
80
100keeping in touch (national)
keeping in touch (international)
send news & messages
receive news & messages
financial transactions
business transactions/enquiries
arranging logistics
access Internet
SLIndia
Bases:SL: 374India: 242
www.lirneasia.netwww.lirneasia.net
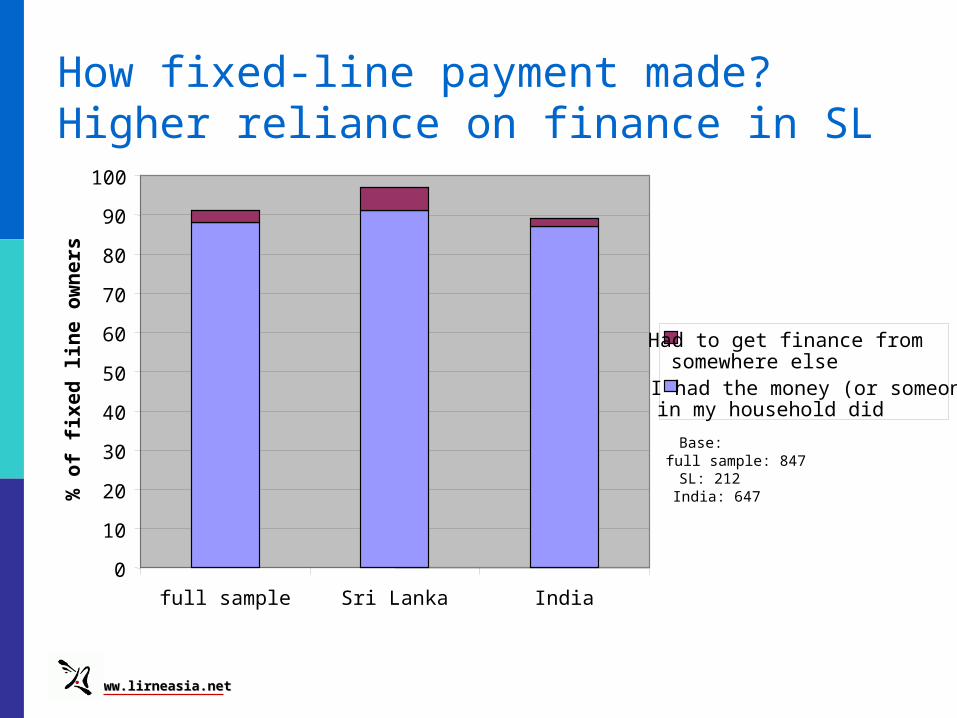
How fixed-line payment made? Higher reliance on finance in SL
0
10
20
30
40
50
60
70
80
90
100
full sample Sri Lanka India
% o
f fi
xe
d l
ine
ow
ne
rs
Had to get finance fromsomewhere elseI had the money (or someonein my household did
Base: full sample: 847SL: 212India: 647
www.lirneasia.netwww.lirneasia.net
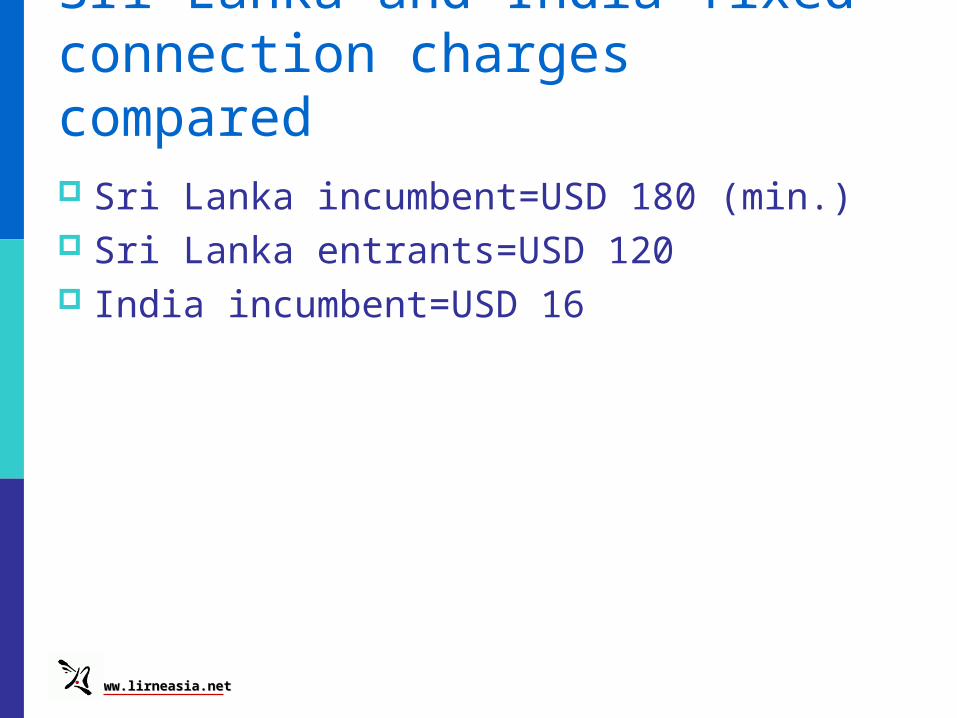
Sri Lanka and India fixed connection charges compared Sri Lanka incumbent=USD 180 (min.) Sri Lanka entrants=USD 120 India incumbent=USD 16

www.lirneasia.netwww.lirneasia.net
0
10
20
30
40
50
60
70
80
90
100
Sri Lanka India
% o
f f
ixe
d li
ne
ow
ne
rs
Paid in installmentspaid full amount at once
Base: full sample: 847SL: 212India: 647
Slightly higher use of payment plans for fixed lines in Sri Lanka

www.lirneasia.netwww.lirneasia.net
How was mobile connection paid for? More relied on finance in India
0
10
20
30
40
50
60
70
80
90
100
full sample Sri Lanka India
% o
f m
ob
ile o
wn
ers
Had to get finance fromsomewhere elseI had the money (or someonein my household did
Base: full: 509SL: 322India: 187
www.lirneasia.netwww.lirneasia.net
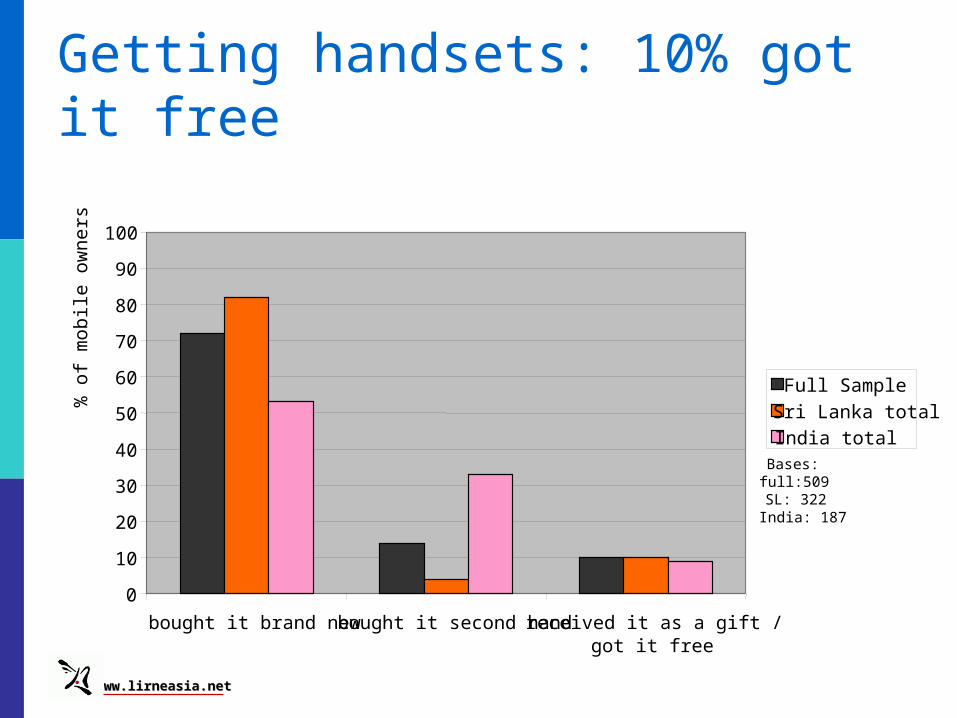
Getting handsets: 10% got it free
0
10
20
30
40
50
60
70
80
90
100
bought it brand new bought it second hand received it as a gift /got it free
% o
f m
obile
ow
ners
Full Sample
Sri Lanka total
India totalBases:full:509SL: 322India: 187
www.lirneasia.netwww.lirneasia.net
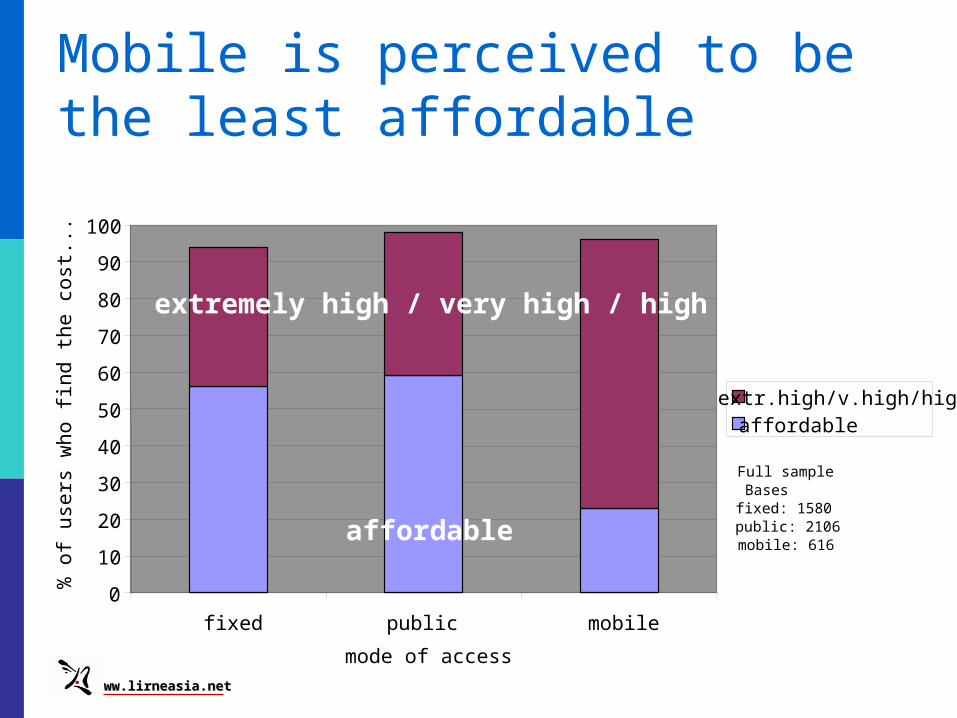
Mobile is perceived to be the least affordable
0
10
20
30
40
50
60
70
80
90
100
fixed public mobile
mode of access
% o
f u
sers
wh
o f
ind
th
e c
ost
...
extr.high/v.high/highaffordable
Full sampleBasesfixed: 1580public: 2106mobile: 616
extremely high / very high / high
affordable
www.lirneasia.netwww.lirneasia.net
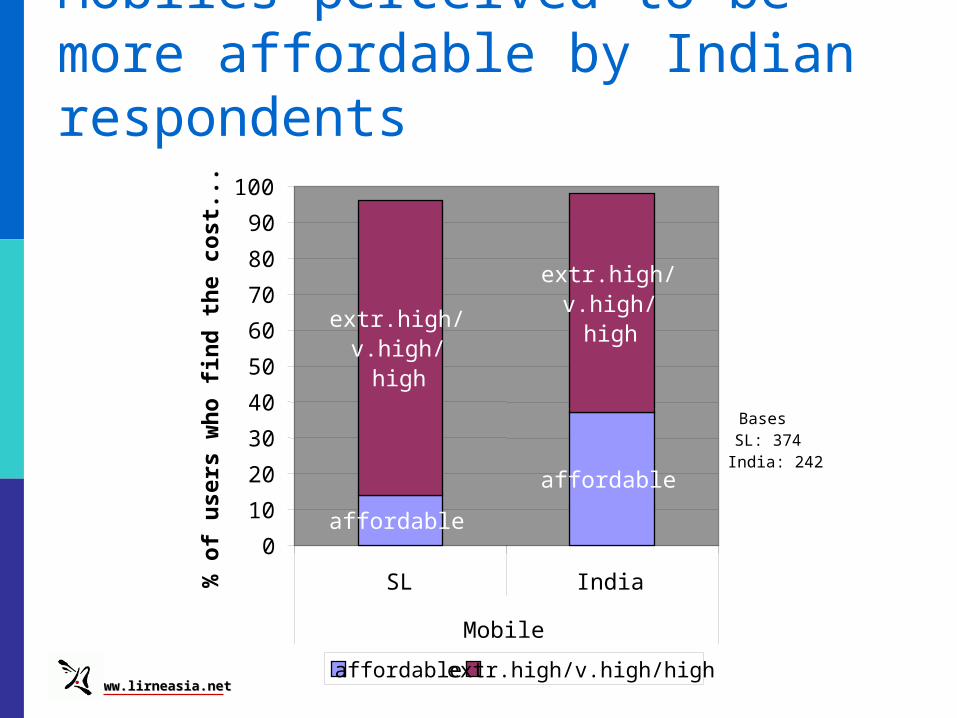
Mobiles perceived to be more affordable by Indian respondents
affordable
affordable
extr.high/v.high/
highextr.high/
v.high/high
0
10
20
30
40
50
60
70
80
90
100
SL India
Mobile
% o
f u
ser
s w
ho
fin
d t
he
co
st.
..
affordable extr.high/v.high/high
BasesSL: 374India: 242

www.lirneasia.netwww.lirneasia.net
0
2
4
6
8
10
12
Sri Lanka Northern India
Southern India India full sample
% o
f in
com
e s
pent
on
fixe
d co
mm
unic
atio
n
less than USD 50
USD 50 -100
Percentage of income spent on fixed: higher than norm
‘typical’ amount that people can afford to spend on telecom services
www.lirneasia.netwww.lirneasia.net
0
2
4
6
8
10
12
Sri Lanka Northern India
Southern India India full sample
% o
f in
com
e s
pe
nt
on
mo
bile
co
mm
un
ica
tion
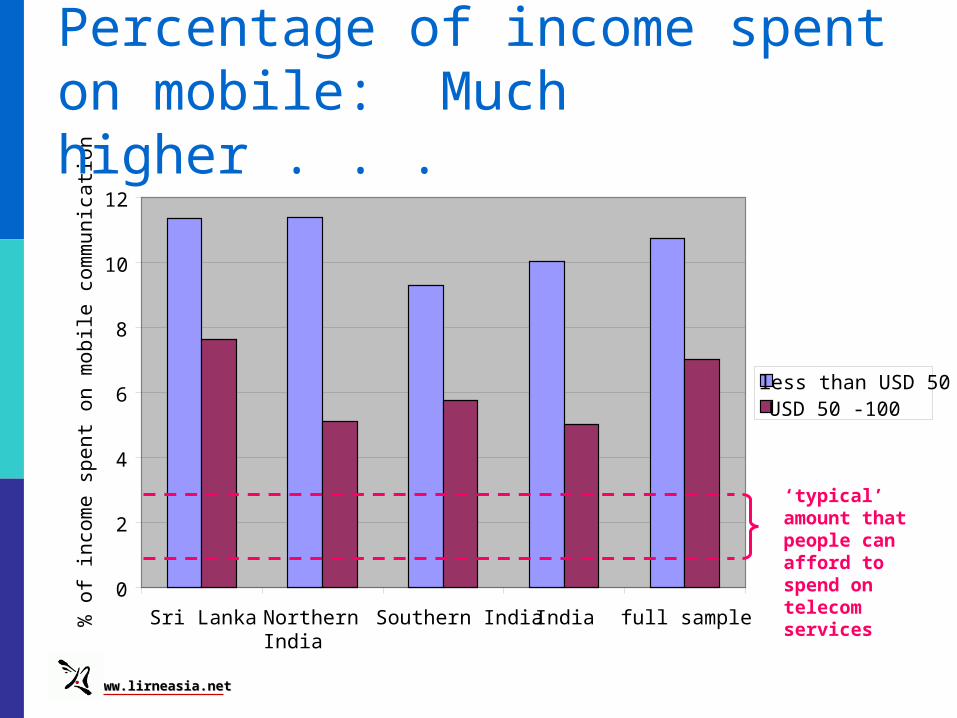
less than USD 50USD 50 -100
Percentage of income spent on mobile: Much higher . . .
‘typical’ amount that people can afford to spend on telecom services
www.lirneasia.netwww.lirneasia.net
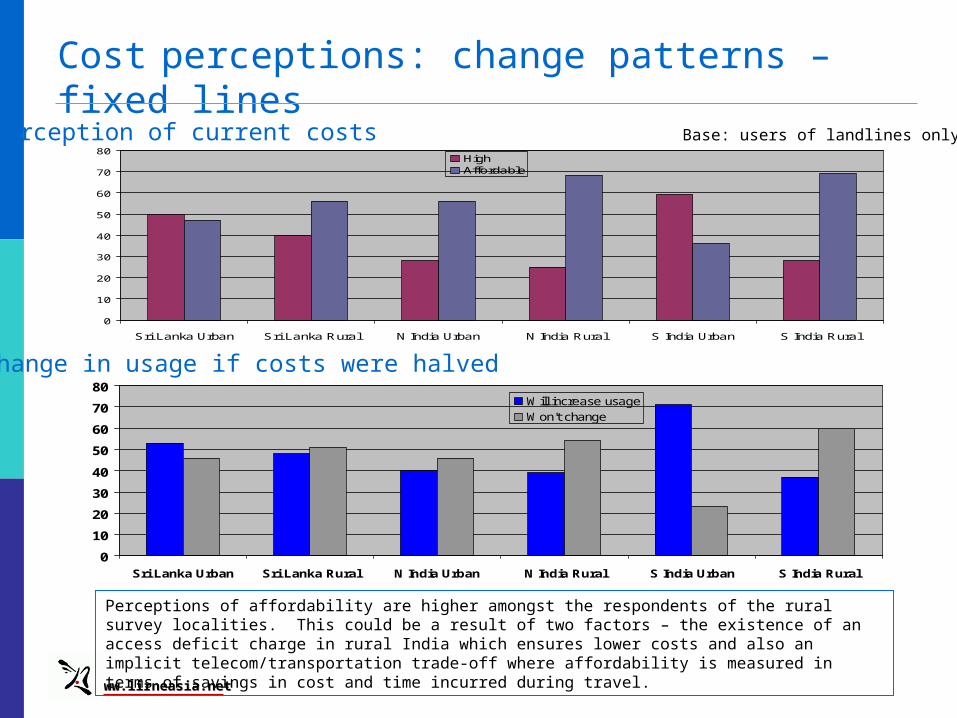
Cost perceptions: change patterns – fixed lines
0
10
20
30
40
50
60
70
80
Sri Lanka Urban Sri Lanka Rural N India Urban N India Rural S India Urban S India Rural
HighAffordable
0
10
20
30
40
50
60
70
80
Sri Lanka Urban Sri Lanka Rural N India Urban N India Rural S India Urban S India Rural
Will increase usage
Won't change
Perceptions of affordability are higher amongst the respondents of the rural survey localities. This could be a result of two factors – the existence of an access deficit charge in rural India which ensures lower costs and also an implicit telecom/transportation trade-off where affordability is measured in terms of savings in cost and time incurred during travel.
Base: users of landlines only
Change in usage if costs were halved
Perception of current costs
www.lirneasia.netwww.lirneasia.net
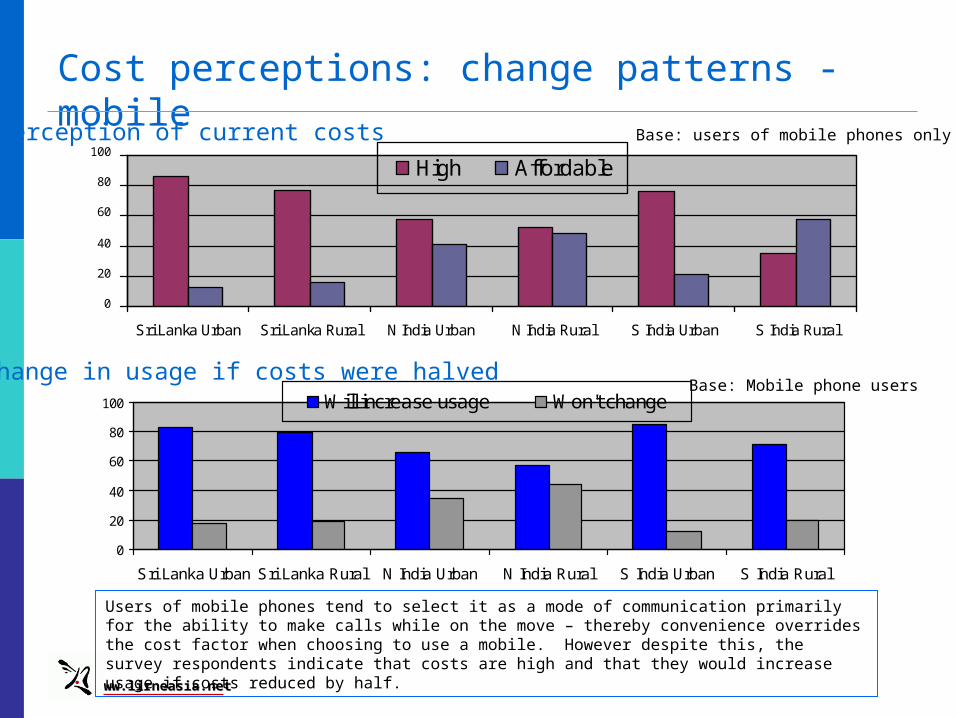
Cost perceptions: change patterns - mobile
0
20
40
60
80
100
Sri Lanka Urban Sri Lanka Rural N India Urban N India Rural S India Urban S India Rural
High Affordable
0
20
40
60
80
100
Sri Lanka Urban Sri Lanka Rural N India Urban N India Rural S India Urban S India Rural
Will increase usage Won't change
Users of mobile phones tend to select it as a mode of communication primarily for the ability to make calls while on the move – thereby convenience overrides the cost factor when choosing to use a mobile. However despite this, the survey respondents indicate that costs are high and that they would increase usage if costs reduced by half.
Base: Mobile phone users
Base: users of mobile phones only
Change in usage if costs were halved
Perception of current costs

www.lirneasia.netwww.lirneasia.net
Cost perceptions: change patterns (PCO)
0102030405060708090
Sri Lanka Urban Sri Lanka Rural N India Urban N India Rural S India Urban S India Rural
High Affordable
01020304050607080
Sri LankaUrban
Sri Lanka Rural N India Urban N India Rural S India Urban S India Rural
Will increase usage Won't change
Change in usage if costs were halved
Perception of current costs
Despite respondents in India perceiving current costs to be affordable, they are willing to increase phone usage if costs were halved.
Base: users of PCOs only
www.lirneasia.netwww.lirneasia.net
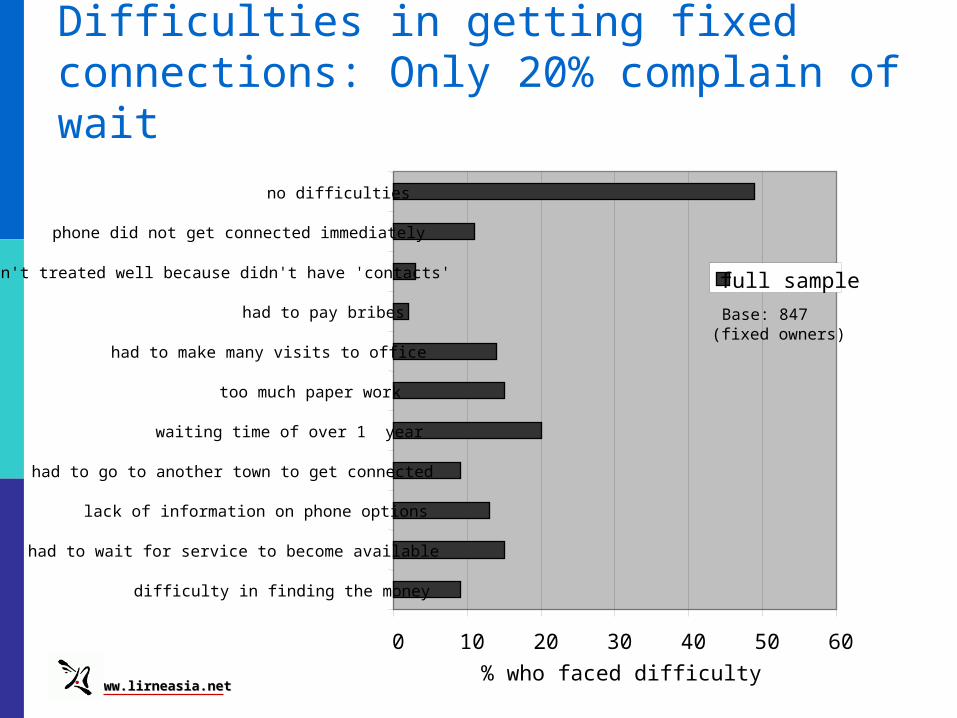
Difficulties in getting fixed connections: Only 20% complain of wait
0 10 20 30 40 50 60
difficulty in finding the money
had to wait for service to become available
lack of information on phone options
had to go to another town to get connected
waiting time of over 1 year
too much paper work
had to make many visits to office
had to pay bribes
wasn't treated well because didn't have 'contacts'
phone did not get connected immediately
no difficulties
% who faced difficulty
full sample
Base: 847(fixed owners)
www.lirneasia.netwww.lirneasia.net
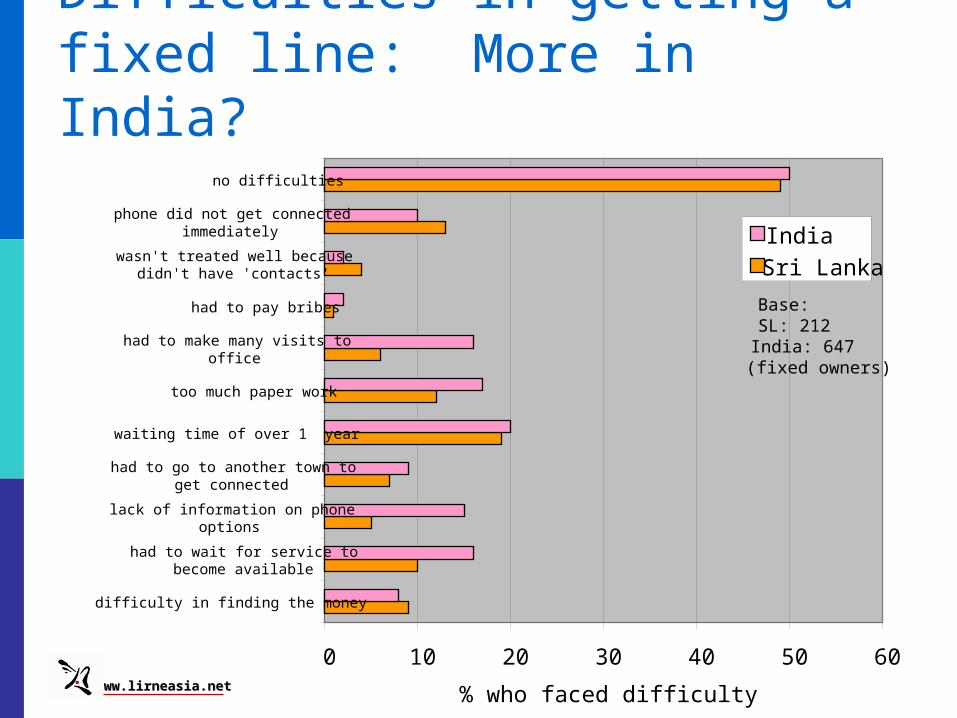
Difficulties in getting a fixed line: More in India?
0 10 20 30 40 50 60
difficulty in finding the money
had to wait for service tobecome available
lack of information on phoneoptions
had to go to another town toget connected
waiting time of over 1 year
too much paper work
had to make many visits tooffice
had to pay bribes
wasn't treated well becausedidn't have 'contacts'
phone did not get connectedimmediately
no difficulties
% who faced difficulty
India
Sri Lanka
Base: SL: 212India: 647(fixed owners)
www.lirneasia.netwww.lirneasia.net
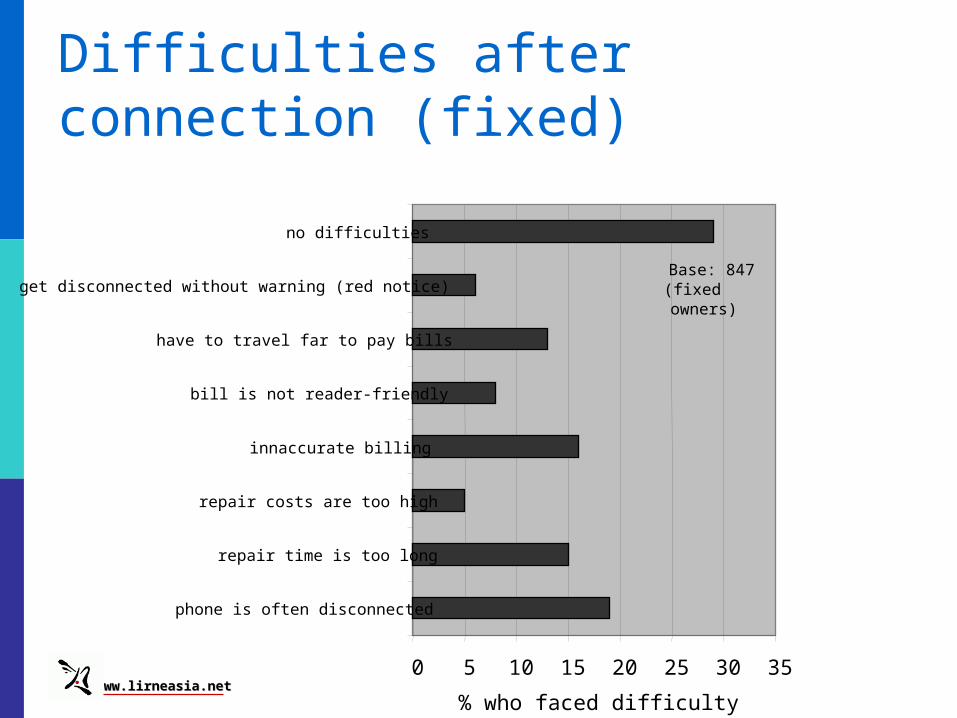
Difficulties after connection (fixed)
0 5 10 15 20 25 30 35
phone is often disconnected
repair time is too long
repair costs are too high
innaccurate billing
bill is not reader-friendly
have to travel far to pay bills
get disconnected without warning (red notice)
no difficulties
% who faced difficulty
Base: 847(fixed owners)
www.lirneasia.netwww.lirneasia.net
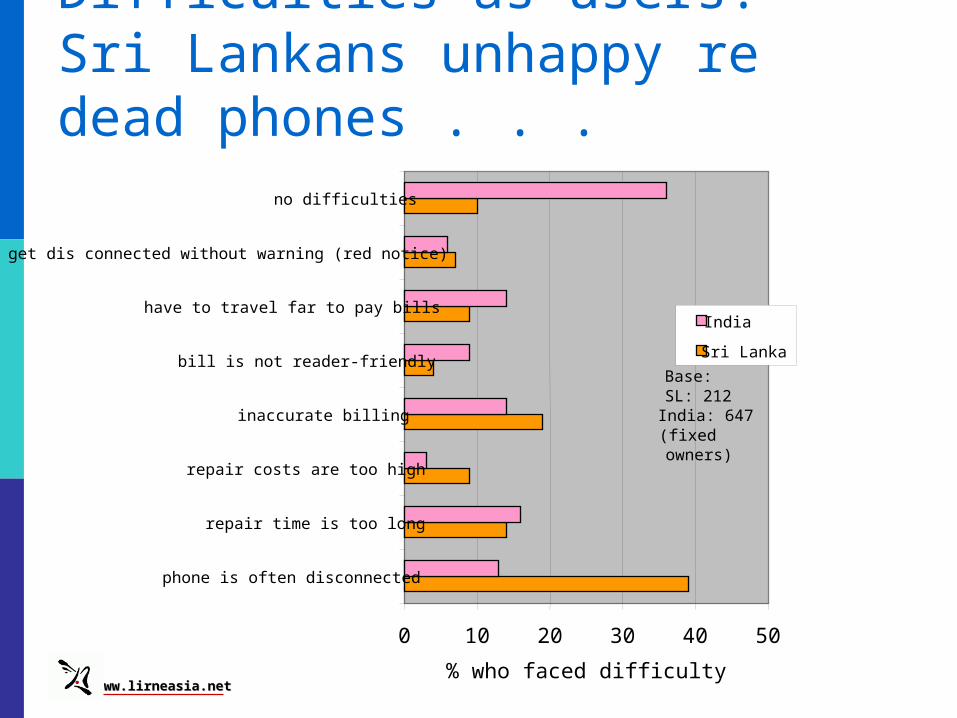
Difficulties as users: Sri Lankans unhappy re dead phones . . .
0 10 20 30 40 50
phone is often disconnected
repair time is too long
repair costs are too high
inaccurate billing
bill is not reader-friendly
have to travel far to pay bills
get dis connected without warning (red notice)
no difficulties
% who faced difficulty
India
Sri Lanka
Base: SL: 212India: 647(fixed owners)

www.lirneasia.netwww.lirneasia.net
Problems with connection (fixed)
0 5 10 15 20 25 30
Cannot get a call through
Poor audio connection (including crossconnections)
Weak signal
Line disconnection due to not paying the bill ontime
Customer service is not efficient
Call getting cut off (calls dropped)
% who face difficulty
full sampleBase: 847(fixed owners)

www.lirneasia.netwww.lirneasia.net
Difficulties with connections: Indians less happy?
0 5 10 15 20 25 30
Cannot get a call through
Poor audio connection (including crossconnections)
Weak signal
Line disconnection due to not paying the bill ontime
Customer service is not efficient
Call getting cut off (calls dropped)
% who face difficulty
India
Sri Lanka
Base: SL: 212India: 647(fixed owners)

www.lirneasia.netwww.lirneasia.net
Obtaining a connection: Happier with mobile . . .
0 10 20 30 40 50 60 70 80
difficulty in finding the money
had to wait for service to become available
lack of information on phone options
had to go to another town to get connected
waiting time of over 1 year
too much paper work
had to make many visits to office
had to pay bribes
wasn't treated well because didn't have 'contacts'
phone did not get connected immediately
no difficulties
% who faced difficulty
Base: 509(mobile owners)

www.lirneasia.netwww.lirneasia.net
Even in getting mobile, a little more unhappiness in India . . .
0 10 20 30 40 50 60 70 80
difficulty in finding the money
had to wait for service tobecome available
lack of information on phoneoptions
had to go to another town toget connected
waiting time of over 1 year
too much paper work
had to make many visits tooffice
had to pay bribes
wasn't treated well becausedidn't have 'contacts'
phone did not get connectedimmediately
no difficulties
% who faced difficulty
India
Sri LankaBase:SL: 322India: 187(mobile owners)
www.lirneasia.netwww.lirneasia.net
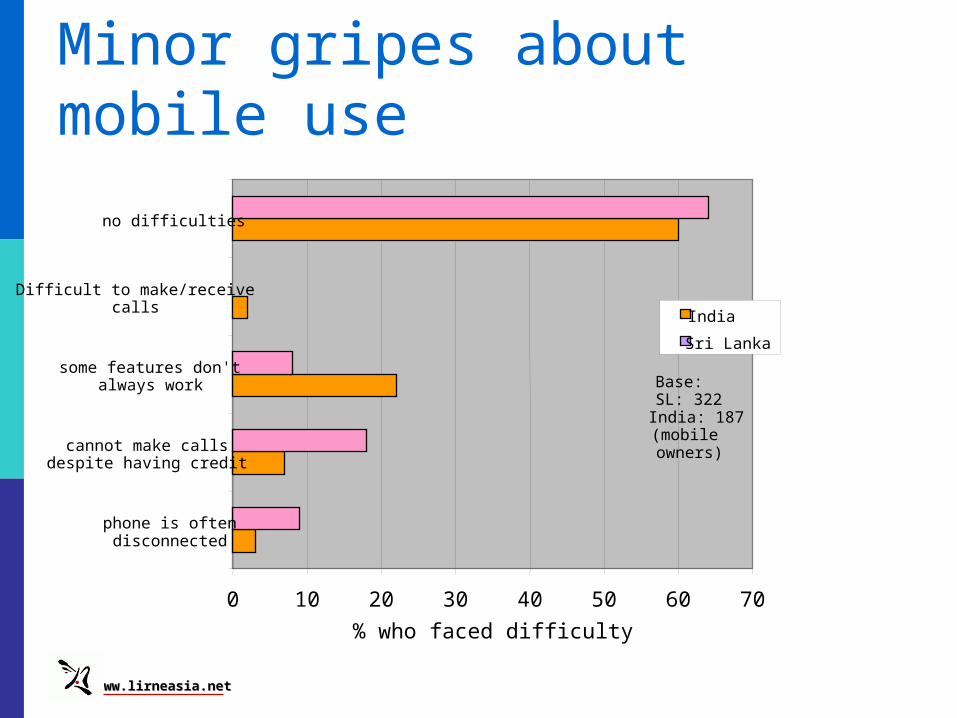
Minor gripes about mobile use
0 10 20 30 40 50 60 70
phone is oftendisconnected
cannot make callsdespite having credit
some features don'talways work
Difficult to make/receivecalls
no difficulties
% who faced difficulty
India
Sri Lanka
Base: SL: 322India: 187(mobile owners)

www.lirneasia.netwww.lirneasia.net
Using mobile: bad signals in SL; bad service in India
0 2 4 6 8 10 12 14 16 18 20
Cannot get a call through
Poor audio connection (including crossconnections)
Weak signal
Line disconnection due to not paying the bill ontime
Customer service is not efficient
Calls dropped
have to go to locations where there is signal
% who face difficulty
India
Sri Lanka
Base: SL: 322India: 187(mobile owners)
www.lirneasia.netwww.lirneasia.net
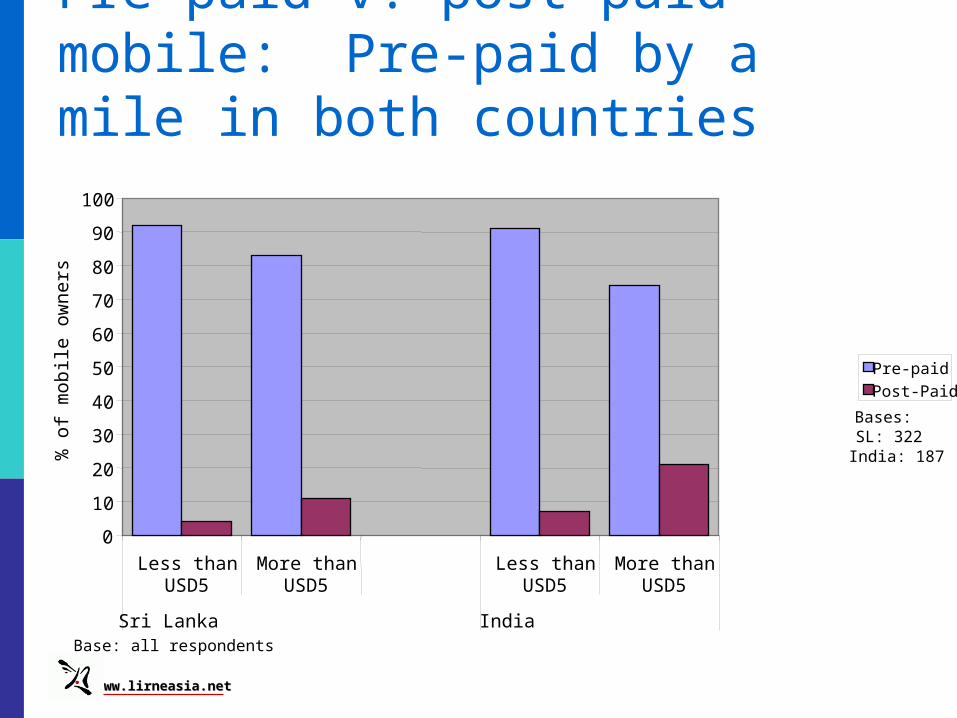
Pre-paid v. post-paid mobile: Pre-paid by a mile in both countries
Base: all respondents
0
10
20
30
40
50
60
70
80
90
100
Less thanUSD5
More thanUSD5
Less thanUSD5
More thanUSD5
Sri Lanka India
% o
f m
obile
ow
ners
Pre-paid
Post-Paid
Bases: SL: 322India: 187

www.lirneasia.netwww.lirneasia.net
India: Prepaid cheaper than postpaid
Monthly Mobile Tariffs (Pre-Paid vs Post Paid)India
0
2
4
6
8
10
12
14
16
18
20P
repa
id
Pos
tpai
d
Pre
paid
Pos
tpai
d
Pre
paid
Pos
tpai
dLow User Medium User High User
US
$
SMSUsageRentalConnection

www.lirneasia.netwww.lirneasia.net
Sri Lanka: Prepaid cheaper than postpaid
Monthly Mobile Tariffs (Prepaid vs. Postpaid)Sri Lanka
0.00
5.00
10.00
15.00
20.00
25.00
30.00
Pre
pa
id
Po
stp
aid
Pre
pa
id
Po
stp
aid
Pre
pa
id
Po
stp
aid
Low User Medium User High User
US
$
SMS
Usage
Rental
Connection

www.lirneasia.netwww.lirneasia.net
More on basket methodology on Friday . . . The tariffs are monthly tariffs Low user basket has 25 minutes of use per
month Medium user basket has 75 minutes of use
per month High user basket has 150 minutes of use
per month
www.lirneasia.netwww.lirneasia.net
In conclusion Neglected, silent group of consumers What do regulators need to know? What can regulators do? What can operators do?
More findings on Friday 5-6 articles in preparation


![Teleuse@BOP Digital Divide Digital Opportunity Rohan Samarajiva (samarajiva [at] lirne.net) Session 1: Accelerating the growth of broadband India Telecom](https://img.dokumen.tips/doc/110x75/56649d2a5503460f949fed34/teleusebop-digital-divide-digital-opportunity-rohan-samarajiva-samarajiva.jpg)