Embed Size (px)
Citation preview

Telecom Italia GroupFY 2014 Preliminary Results & 2015-2017 Plan Outline
TELECOM ITALIA GROUPFY 2014 Preliminary Results & 2015-2017 Plan OutlineLondon, February 20th, 2015

FY 2014 Preliminary Results & 2015-2017 Plan Outline 2
Giuseppe Recchi – TI Chairman Opening Overview
Marco Patuano – TI CEO FY 2014 Preliminary Results & 2015-2017 Plan Outline
Piergiorgio Peluso – TI CFO Financial Update
Rodrigo Abreu – TIM Brasil CEO 2015-2017 TIM Brasil Plan Outline
Q&A
Buffet Lunch
Agenda
FY 2014 Preliminary Results & 2015-2017 Plan Outline

FY 2014 Preliminary Results & 2015-2017 Plan Outline 3
TI Senior Management attending the event includes
Simone BattiferriBusiness
Franco BresciaPublic & Regulatory Affairs
Stefano CiurliNational Wholesale Services
Antonino CusimanoGeneral Counsel
Stefano De AngelisConsumer
Mario Di LoretoPeople Value
Mario Di MauroStrategy & Innovation
Pietro LabriolaBusiness Transformation & Quality
Guglielmo Noya CFO TIM Brasil
Giuseppe OpilioChief of Operations
Alessandro TalottaTelecom Italia Sparkle
Carlotta VenturaBrand Strategy & Media
Enrico ZamponePlanning & Control
FY 2014 Preliminary Results & 2015-2017 Plan Outline
FY 2014 Preliminary Results & 2015-2017 Plan Outline 4
Giuseppe Recchi – TI Chairman Opening Overview
FY 2014 Preliminary Results & 2015-2017 Plan Outline

FY 2014 Preliminary Results & 2015-2017 Plan Outline 5
Preliminary FY’14 Results & FY’15-’17 Plan Outline
Marco Patuano – TI CEO FY 2014 Preliminary Results & 2015-2017 Plan Outline
Piergiorgio Peluso – TI CFO Financial Update
Rodrigo Abreu – TIM Brasil CEO 2015-2017 TIM Brasil Plan Outline
FY 2014 Preliminary Results & 2015-2017 Plan Outline

FY 2014 Preliminary Results & 2015-2017 Plan Outline 6
Safe HarbourThis presentation contains statements that constitute forward looking statements within the meaning of the Private Securities Litigation Reform Act of 1995. These statements appear in anumber of places in this presentation and include statements regarding the intent, belief or current expectations of the customer base, estimates regarding future growth in the differentbusiness lines and the global business, market share, financial results and other aspects of the activities and situation relating to the Telecom Italia Group. Such forward looking statementsare not guarantees of future performance and involve risks and uncertainties, and actual results may differ materially from those projected or implied in the forward looking statements as aresult of various factors. Consequently, Telecom Italia makes no representation, whether expressed or implied, as to the conformity of the actual results with those projected in the forwardlooking statements.
Forward-looking information is based on certain key assumptions which we believe to be reasonable as of the date hereof, but forward looking information by its nature involves risks anduncertainties, which are outside our control, and could significantly affect expected results. Analysts and investors are cautioned not to place undue reliance on those forward lookingstatements, which speak only as of the date of this presentation. Telecom Italia undertakes no obligation to release publicly the results of any revisions to these forward looking statementswhich may be made to reflect events and circumstances after the date of this presentation, including, without limitation, changes in Telecom Italia business or acquisition strategy orplanned capital expenditures or to reflect the occurrence of unanticipated events. Analysts and investors should consult the Company's Annual Report on Form 20-F as well as periodicfilings made on Form 6-K, which are on file with the United States Securities and Exchange Commission which may identify factors that affect the forward looking statements includedherein.
The 2014 preliminary financial results of the Telecom Italia Group and the data of the previous years provided for comparison were drafted in accordance with the International FinancialReporting Standards issued by the International Accounting Standards Board and endorsed by the European Union (designated as “IFRS”).
The accounting policies and consolidation principles adopted in the preparation of the preliminary financial results for the 2014 FY have been applied on a basis consistent with thoseadopted in the Annual Financial Statements at 31 December 2013, to which reference should be made, except for the new standards and interpretations adopted by the Telecom ItaliaGroup starting from 1 January 2014 which had no effects on the 2014 preliminary financial results. The 2014 preliminary financial results have not been verified by the independent auditors.
Following the classification, starting from the fourth quarter 2013, of the Sofora - Telecom Argentina group as a disposal group (Discontinued operations/Non-current assets held for sale),the consolidated financial statements data of prior periods (including the twelve months ended 31 December 2013) have been restated accordingly and therefore the Sofora - TelecomArgentina group is no longer separately presented as a business unit.
Furthermore:
• starting from 2014, Organic changes in Revenues, EBITDA and EBIT are determined excluding, where applicable, only the effects of the changes in the scope of consolidation andexchange differences and therefore don’t take into account, as in the past, non-organic income and expenses, including those non-recurring;
• starting from 2014, the Domestic business unit includes the Olivetti group, in addition to Core Domestic and International Wholesale. This different presentation reflects the commercialand business placement of the Olivetti group and the process of integrating its products and services with those offered by Telecom Italia in the domestic market. Therefore, the Olivettigroup is no longer separately presented as a business unit;
as a result, the data for prior periods under comparison have been restated, accordingly.
In this presentation reference is also made to a normalization called “Domestic Underlying EBITDA trend”, which is based on the Adjusted (for one-offs and discontinuities) ReportedDomestic EBITDA. This representation is provided as additional information to our Reported EBITDA that represents Operating profit before depreciation and amortization, capital gains(losses) and impairment reversals (losses) on non-current assets.
Marco Patuano - Piergiorgio Peluso – Rodrigo Abreu

FY 2014 Preliminary Results & 2015-2017 Plan Outline 7Marco Patuano
2014 Group Main Financials and Innovative KPIs
(1) excluding one-offs: 82 €mln Sparkle provision reversal in 2014 and 84 € mln Antitrust fine in 2013; including one-offs: 190% of FY’14 target(2) Brazilian spectrum acquisition and clean-up costs=936 €Mln; (3) Latam Spectrum= 540 €Mln for Brazilian Spectrum & 344 €Mln for Argentinean Spectrum
21.6 €Bln
Revenues Ebitda
Capex Net Debt
Italy Brazil
8.8 €Bln
4.0 €Bln (-5.4% YoY) excluding Brazilian 700MHz Auction(2)
5.0 €Bln (+13.3YoY)
MBB project: 125 Cities in 2014
4G site: +92% YoY @ 3.7k
Fiber Coverage: 29%
4G coverage: >80%
Domestic Efficiency(1)
104% of FY’14 Target
Organic, €Bln, %YoY
25.8 €Bln (-1.0 €Bln YoY) excluding Latam Frequencies(3)
26.65 €Bln (-0.2 €Bln YoY)

FY 2014 Preliminary Results & 2015-2017 Plan Outline 8
AgrigentoAlessandria
AnconaApriliaArezzo
AstiBari
BeneventoBergamoBolognaBolzanoBresciaBrindisiBusto A.CagliariCarpi
CasoriaCatania
La SpeziaLatina
LegnanoLivornoLucca
MantovaMassaMatera
MessinaMilano
Modena.MonzaNapoliNovaraPadovaPalermoParmaPavia
CatanzaroCesena
Cinisello B.Como
CremonaCuneoFaenzaFano
FerraraFirenzeFoggiaForliGela
GenovaGiuglianoGrossetoGugliasco
Imola
PerugiaPesaroPescaraPiacenza
PisaPistoia
PotenzaPrato
Quartu S. ElenaRagusaRavenna
Reggio CalabriaReggio E.
RiminiRoma
SalernoSassariSavona
Sesto S.G.Siena
SiracusaTaranto
TerniTorino
Torre del GrecoTrentoTrevisoTriesteUdine
VareseVeneziaVeronaVicenza
VigevanoViterbo
TI’s New Course started in 2014: Deploying UBB and selling it
LTE Coveragewider LTE coverage in Italy
actual 2014
NGN Coverage(1)
target 2014Plan ‘13-’15
133 Municipalities covered+95 cities YoY
29% coverage
+12 pp YoY
Marco Patuano
+27pp
MBB Users Growth YoY+1.825 +1.985
+1.573 +1.627
21% 27%45%
64%
1Q'14 2Q'14 3Q'14 4Q'14
MBB
% of LTE
LTE CB 409 610 844 1,343
15 45 103
151
231
+30
+58
+47
+80
4Q'13 1Q'14 2Q'14 3Q'14 4Q'14
Fiber Users Growth
more than 4x the coverage of ourmain competitor
Today>80%
(1) As of Jan 30, 2015
Average daily acquisition (k)
0.5 1.0 0.8 1.3MBB CB 8,677 9,151 9,596 10,071
’000 ’000
~40% ~50%
51%
61%
74% 77%
FY'13 1Q'14 1H'14 9M'14 FY'14

FY 2014 Preliminary Results & 2015-2017 Plan Outline 9
1,836 1,805 1,779 1,800
1Q'14 2Q'14 3Q'14 4Q'14
1.099 1.138 1.189 1.183
1Q'14 2Q'14 3Q'14 4Q'14
3.554 3.567 3.594 3.619
1Q'14 2Q'14 3Q'14 4Q'14
Marco Patuano
Domestic Service Revenues trend
Abs QoQ
€ mln,’000
BB-based services and Monetization of Quality supported Domestic Top Line Improvement
3,664
+13 +27 +25
+70net of AGCOMprice revision(1)
(1) 45 €mln for adjustment access price 2010-2012
-8,8% -8,9%
-6,2%
-3,2%
-10,1% -10,5%-9,1% -9,1%
-4,4%
1Q 2Q 3Q 4Q
2014
2013
net of AGCOMprice revision(1)
YoY
Retail Fixed Service Revenues trend Mobile Service Revenues trend
-14,9%-13,3%
-7,1% -5,7%
YoY
YoY
+4.7pp
Fixed Service Revenues Trend (Retail+Wholesale)-7.4% -8.6% -7.2% -5.3%
net of AGCOM price revision(1) -3.7%
+1.4pp+2.3pp
-7,4% -8,9%-6,2%
-3,9%

FY 2014 Preliminary Results & 2015-2017 Plan Outline 10
-7,9%
-11,6%
-10,9%
-5,4%
-9,8% -8,5%
1H YoY 3Q YoY 4Q YoY50
4Q'13 4Q'14
Marco Patuano
Domestic Ebitda%YoY,€ mln
Domestic Ebitda trended upwards
handset subsidy
net of new handset subsidy approach
1,9101,702
-10.9%
-8.5%
-9%
-7%
-3%
1H YoY 3Q YoY 4Q YoY
Normalized for discontinuous increases in labour costs, provisions, handset subsidy and AGCOM price revision
Underlying Ebitda trend
FY’14 -7%
Reported Ebitda trend
net of new handset subsidy
approach
reported
Domestic DiscontinuitiesAdjustments for non-recurrent effects on 4Q’14 Ebitda YoYperformance are:on 4Q’14: ~+45 mln euro for AGCOM LLU 2010-2012 revision
impact ~ +10 mln euro for incentive plans & other labour costs ~+15 mln euro for other provisions
on 4Q’13: ~ -75 mln euro, of which ~ -50 mln euro for new handset
subsidy approach and ~ -25 mln euro for other

FY 2014 Preliminary Results & 2015-2017 Plan Outline 11Marco Patuano
Domestic Mobile: Building Further Improvements in aPolarized Market
€ mln, %YoY
Browsing Revenues
Total Revenues Service Revenues
Highlights
Revenues2014 1,175 1,264 1,284 1,368 1,099 1,138 1,189 1,183
264 281 301 326
-14,4%
-10,0%
-5,6% -5,1%
-16,4%-17,8%
-13,6%-11,2%
1Q'14 2Q'14 3Q'14 4Q'14
2014
2013-14,9%
-13,3%
-7,1%-5,7%
-17,8% -18,3%
-14,8% -14,3%
1Q'14 2Q'14 3Q'14 4Q'14
+12,9% +11,5% +11,7%+10,9%
-4,2%
+2,4%
+11,5%
+18,2%
Revenues2014
Revenues2014
2014
2013
2014
2013
+8.6pp
double-digitgrowth for 6
months in a row
Price War Drag is going away
MTR effect has bottomed-out
Increased Bundle adoption: 63% overall (+8 p.p. YoY)
59% on Consumer Segment (+9 p.p. YoY)
-5.0%(1)
(1) Net of national roaming price reduction

FY 2014 Preliminary Results & 2015-2017 Plan Outline 12
-7,4%
-8,6%
-7,2%
-5,3%
-3,7%
Domestic Fixed: Hitting the Gas on Internet
Service Revenues Trend
net of AGCOMprice revision(1)
Speeding-up growth
Marco Patuano
€ mln, %YoY,
655 625 597 568
5.111 5.054 5.019 4.961
1,167 1.259 1.315 1.392
1Q'14 2Q'14 3Q'14 4Q'14
Fast
BB
Flat
BB
Free
BB
-58-57 -35
+77+92 +56-29-30 -28
13.027 12.828 12.656 12.480
1Q'14 2Q'14 3Q'14 4Q'14
-200 -171 -176
19.2 19.6 20.0 20.1
total 6,933 6,939 6,932 6,921
-0,1% +1,1%
+3,5%+4,4%
+1,7% +1,3%
+1,2%
-0,8%
1Q'14 2Q'14 3Q'14 4Q'14
Internet Service Revenues
BB Customer Base
ARPU BB
Fixed Access
Total Revenues -6.9% -8.3% -6.2% -5.5%
-3.9%net of AGCOMprice revision(1)
2014
2013
(1) 45 €mln for adjustment access price 2010-2012(2) Fast ADSL + Fiber (both Flat)
+292 upselling to Fast BB (2)
€/month
‘000
1Q’14 2Q’14 3Q’14 4Q’14

FY 2014 Preliminary Results & 2015-2017 Plan Outline 13
Agenda
Marco Patuano
FY 2014 Preliminary Results
2015-2017 Plan Outline
Financial Update
2015-2017 TIM Brasil Plan Outline
Appendix

FY 2014 Preliminary Results & 2015-2017 Plan Outline 14Marco Patuano
Future-Proofing our Infrastructure for Enhanced Cash Flow
Italy BrazilNGN: ~75% coverage
in 2017LTE: >95% coverage
in 2017
(1) Including Brazil License & Clean-up costs(2) Group Ebitda-Capex
New Investments
~10 €Bln in ’15-’17of which 5 €Bln for
innovation
>14 R$Blnin ’15-’17
Business Transformation
Investment Monetization & Core Revenues
Stabilization Efficiency & Process
Transformation
Innovation
Moving Cash Flow (2) beyond Stabilization
~3.8(1)
2014 2015 2016 2017
LTE: ~80% coveragein 2017
4G Sites: >15k in 20173G Sites: >14k in 2017
Hetnet Strategy
Commercial Efficiency Evolution
Network Costs OptimizationProcess-Driven Efficiency
Single Brand& Convergence People: Change of Mix
Italy Brazil
Italy Brazil
FY 2014 Preliminary Results & 2015-2017 Plan Outline 15
2014 2015 2016 2017 2018onwards
2014 2015 2016 2017
Marco Patuano
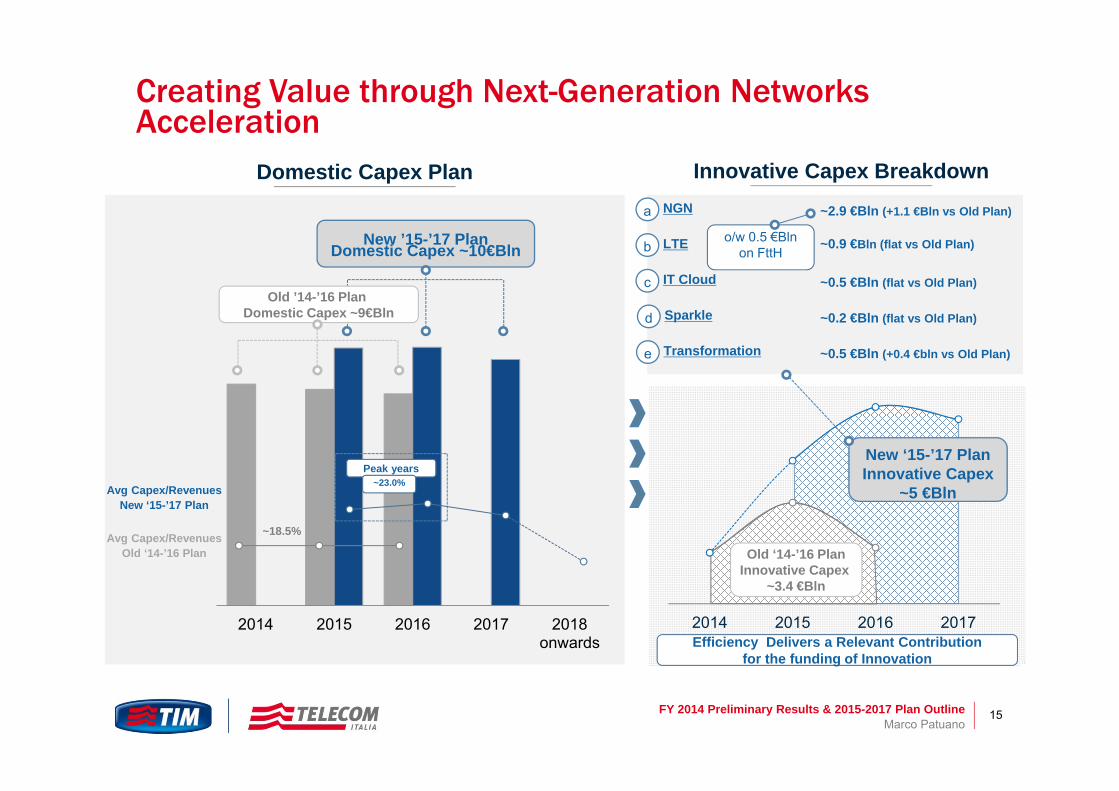
Creating Value through Next-Generation Networks Acceleration
Avg Capex/RevenuesOld ‘14-’16 Plan
Avg Capex/RevenuesNew ‘15-’17 Plan
~18.5%
New ’15-’17 Plan Domestic Capex ~10€Bln
Old ’14-’16 Plan Domestic Capex ~9€Bln
Domestic Capex Plan
New ‘15-’17 PlanInnovative Capex
~5 €Bln
Old ‘14-’16 PlanInnovative Capex
~3.4 €Bln
Innovative Capex BreakdownNGN ~2.9 €Bln (+1.1 €Bln vs Old Plan)a
LTEb
IT Cloud ~0.5 €Bln (flat vs Old Plan)c
Sparkle ~0.2 €Bln (flat vs Old Plan)d
Transformation ~0.5 €Bln (+0.4 €bln vs Old Plan)e
~0.9 €Bln (flat vs Old Plan)o/w 0.5 €Blnon FttH
Peak years
Efficiency Delivers a Relevant Contribution for the funding of Innovation
~23.0%

FY 2014 Preliminary Results & 2015-2017 Plan Outline 16
2014 2015 2016 2017
Fiber CB on TI BB CB
~3%
Marco Patuano
Fiber Italy: We are increasing our Competitive Advantage
Fiber CB Growth
today @ 29%
>50%
~75%
2014 2015 2016 2017
New Plan
~10x
+1mlnNew ‘15-’17
CB Fiber Growth
Old ‘14-’16 CB Fiber Growth
<60%
Connection speeds faster than DAE targets: 50 Mb/s currently 100 Mb/s through Vectoring
Expected Ebitda monthly uplift from Fiber ranges 5-10 €/line coming from:
Fiber Premium;
Lower churn +ve contribution from New Services Content
Up to 1Gb/s with FttH
Fiber Coverage Plan
OldPlan

FY 2014 Preliminary Results & 2015-2017 Plan Outline 17Marco Patuano
LTE Italy: Pushing on Quality, Not on Price
60%
80%
today @>80
>95%
2014 2015 2016 2017
Target reached2
years in advance
LTE Coverage Plan
36%50%
64%
2014 2015 2016 2017
innovative on business generated traditional on business generated
Revenues Mix(1)
RevenuesCagr ‘14-’17
+10%
(1) Innovative revenues = browsing+data content; traditional revenues =voice+SMS
13%
~60%
2014 2015 2016 2017
LTE Users on Mobile BB CB
+45 p.p.New
Plan
OldPlan
Geographic Coverage
~50% ~90%+40 p.p.
Indoor Coverage >80%

FY 2014 Preliminary Results & 2015-2017 Plan Outline 18
~14 (1)
~7
~1.5
~7
~3.5
~12
~7
Consumer HH TV HH
The TI Plan fits into the Italian Market
Mobile BB only
Fixed BB
TLC Households TV Households
~26 mln ~26 mln
Alreadyon PayTV
No PayTV
Interested in PayTVo/w KO dish 1 mln
Upgrade to Fiber &TV potential target
Rebuild the Value of the VoicePush on Convergence through
flatization to reduce churnUpgrade to BroadBand through
New Special offer & Video Content
Push on win-backs from the dongle community through F-M
Convergence & Quad-PlayTI M/S 30%
TI M/S 50%
Marco Patuano
3
2Voice only
pay-per-useVoice only
on flat optionsTI M/S 100%
1
10% <40 years & holiday homes30% 40-70 years60% >70 years
(1) Addressable market.
FY 2014 Preliminary Results & 2015-2017 Plan Outline 19Marco Patuano
A n-Play Strategy to Grow the Value of our Access
F-M for Mobile only customers
Targeted Actions for specific segments
Keeping price points rational
Enlarge Proposition of Convergent Offers
Lever on Convergence
Mobile BB
2
2014 2017
+20 p.p.
% Convergent Offers(1)
(1) % Convergent offers on Total Consumer Fixed Access
Massive Flatization
Retention of Voice Customers
Use BB as an anchor
Upgrade to TV
Defend the ValueProposition of Access
Less Erosion
Fixed
1
41%
57%
2%
2014 2017
1-Play
2-Play
3-Play
decreasing
stable
growing
3
Launchin April
Wide range of content offering: SVOD, events, etc
Premium offer with live events & on-demand
channels
Base-content enabler
Integration with linear TV
Pay tv penetration in Italy is 27%: market is dominated by Premium Pay DTT/DTH and BB TV is modest (~5%)
TV Business: Hub Approach
Video Content
Defend traditional, Drive Mobile BB – to – Fixed BB substitution and further expand Fixed BB penetration through Video Content
Change of Fixed Access Mix

FY 2014 Preliminary Results & 2015-2017 Plan Outline 20Marco Patuano
Moving to a single Brand: TIM brings together our best parts
Repositioning to a single commercial brand that already enjoys best in class CSI scores on mobile (LTE-driven) and fiber
Position TIM as the official enabler of “Digital Italy”
Towards a new value proposition focused on innovation and quality
Simplifying the overall customer experience and OTN services
Meeting the increasing demand for a multiple and bundled products available anytime, anywhere, anydevice
FY 2014 Preliminary Results & 2015-2017 Plan Outline 21
Rightsizing
Insourcing
Use of new “Jobs Act” for workforce mix evolution
“Active Solidarity” agreement to materially increase young personnel
More Value in Our People
TI Workforce
Marco Patuano
Labor cost restructuring to combine Efficiency & HR Development
20-30
30-40
40-50
50-60
60-70
20-30
30-40
40-50
50-60
60-70
Age Curve Evolution
today
2017-2018
age
age
Mix1%40%47%9%3%
6%53%27%6%8%
FY 2014 Preliminary Results & 2015-2017 Plan Outline 22
~1.2 ~1.1 ~1.1
~1.6 ~1.5 ~1.4
2,7 2,7
3.1 3,1
2013 Target2014
Actual2014
2015 2016 2017
-0.2target
190% of target reached including one-offs(4)
104% of target reached excluding one-offs(4)
(4) 82 mln euro Sparkle provision reversal in 2014 and 84 mln euro Antitrust fine in 2013
8.38.6
-0.4actual
Market / Customer Driven(3)
Process / Asset Driven(2)
Personnel Costs
Volume/Revenue-Driven (1)
Addressable EfficiencyArea
Not Applicable
~20% on rev.
2013 - 2014 Plan 2015 – 2017
Allow insourcing and increase productivity
> -0.1
~ -0.3
> -0.1
‘15-’17 cum. Efficiency Target
>1 €Bln
Domestic Opex Efficiency€ bln
Marco Patuano
-20% ‘17 vs ‘14
(1) Interconnection, Cost of Equipment, Other COGs(2) Industrial costs, G&A, Real Estate, Other(3) Acquisition costs, ADV, Customer Care, Other commercial costs

FY 2014 Preliminary Results & 2015-2017 Plan Outline 23
Group Operating and Financial Outlook
Group Domestic Brazil
Organic data
Ebitda YoY Growth in 2017
YoY Stabilization in 2016
YoY Growth in 2017
Continued Growth
Capex(1)
Cum. ‘15-’17
Net Debt Adj./Ebitda 2017
Reducing Towards2.5x(2)
~10 €Bln >14 R$Bln
(1) Including Italian GSM license extension (2) On reported EBITDA; ratio includes Mandatory Convertible equity strengthening effect for 1.3€Bln in November 2016Note: Organic data exclude impact from change in perimeter and FX. Avg €/Reais exchange rate: 3.21
~14.5 €Bln
Marco Patuano
FY 2014 Preliminary Results & 2015-2017 Plan Outline 24
Agenda
Piergiorgio Peluso
FY 2014 Preliminary Results
2015-2017 Plan Outline
Financial Update
2015-2017 TIM Brasil Plan Outline
Appendix

FY 2014 Preliminary Results & 2015-2017 Plan Outline 25
1.774
- 1,259
Brazil –22
6.998
-2,783
-936 +396
-1,024
Domestic3,203
EBITDA Capex Capex License WC Licenses WC excludinglicenses
OpFCF
Solid Operating FCF Generation Confirmed€ Mln
8,786(1)
3,174(1)
Group Capex(1) -4,984
Brazilian 4G Auction Cash Out-540
Group WC(1) -628
Brazilian Contribution to OpFCF
(excluding 4G auction)518 mln €
FY’14
Trade Payables
Trade Receivable
Others
-0.4
-0.2
-0.4-0.1
-0.1o/w TI Sparkle provision reversal
WC Domestic -1.0
€ Bln
(1)TI Group figures include TI Media & other subs.Piergiorgio Peluso
Domestic Contribution Brazilian Contribution Brazilian 4G Auction Cash Flow Impacts
o/w AGCM fine
o/w AGCom price revision(2) -0.1
(2) AGCOM wholesale price revision 2008/2010

FY 2014 Preliminary Results & 2015-2017 Plan Outline 26
2014 Opex Efficiency Target Fully Reached€ mln
Piergiorgio Peluso
8.647 +13 -113 -261 +19 8.305
FY'13 Volume RevenuesDriven
Market / CustomerDriven
Process / AssetDriven
Labour Cost FY'14
Excluding from Process Driven:82 €Mln Sparkle provision
reversal84 €Mln euro Antitrust fine
Efficiency -374 €Mln
Total Opex-342 €Mln
Efficiency -208 €Mln104% of Target
reached
Commissioning: Reduction in volume of acquisitions
Advertising: Cost optimization due to unification of format and brand
Customer Care: Productivity improvedalong with Volume growth
Operational Costs, Network & IT: purchasing savings and positive impact from process reengineering
G&A: Zero budget approach and policy review
(1) Interconnection, Cost of Equipment, Other COGs(2) Acquisition costs, ADV, Customer Care, Other commercial costs(3) Industrial costs, G&A, Real Estate, Other
(1) (2) (3)
190% of Target reached

FY 2014 Preliminary Results & 2015-2017 Plan Outline 27
188
1.649 1.707
663 603
346 281
186 -60 -65 +6 -188
191
FY'13 IT commercial&others IT others subsidy FY'14
33%~55%
2014 2015 2016 2017
20%24%
27% 28%
33% 34% 35% 36%
1Q 1H 9M FY
Domestic Capex Efficiency fueled more Innovation
+156 -973,0312,783
€ mln
a b c d
Innovative investment on network capex
Network
innovative traditionalEfficiency(1)= 216 €mln
(1) total domestic capex efficiency= a b c d+ + +
2013
2014
TraditionalCapex
InnovativeCapex
2015-2017 Capex Mix
Efficiency Target‘15-’17 cum.
~0.7 €Bln
2014 Capex Efficiency
Piergiorgio Peluso
handset subsidy
network
IT
commercial & other IT
others

FY 2014 Preliminary Results & 2015-2017 Plan Outline 28
1.404975
1.1041.112
1.617
1.617
7.8297.000 1.9701.879
2.9632.324
3.165
11.313
23.614
6.112
13.112
3.3742.854
4.0673.436
4.782
12.930 31.443
Liquiditymargin
FY 2015 FY 2016 FY 2017 FY 2018 FY 2019 Beyond 2019 Total M/L TermDebt
€ 31.443 mln is the nominal amount of outstanding medium-long term debt. Adding by Mandatory Convertible Bond (€ 1.300 mln), discontinued operations (€ 28 mln), IAS adjustments (€ 1.192 mln) and current financial liabilities (€ 458 mln), the gross debt figure of € 34.421 mln is reached. N.B. Debt maturities are net of € 1.281 mln (face value) of repurchased (of which € 523 in the 2013 and € 543 in the 2014) own bonds (of which € 1.066 mln related to bonds ue within 2016).
Loans (of which long-term rent, financial and operating lease payable € 1,200) Drawn bank facilityBonds
Refinancing at record low rates € mln
2011-2015 Bond Issuance Yields
Undraw portions of committed
C&CE (escluded discontinued)
Covered until 2018
Piergiorgio Peluso
Yield on issue date
Tenor
Issue date
Highlights
5 7 5,25 6,5 3 5 8 7 7 10 8
5,198%4,769%
6,968%
6,184%
4,740% 4,570%4,134%
5,054%4,594%
3,993%
3,330%
TI’s funding costs since 2013 have significantly lowered
New record-low coupon has been printed with our January 8-yr issue @ 3.25%
ECB QE plans running until September 2016 further support favourable funding environment
This context will continue offering TI significant refinancing opportunities
Debt Maturities and liquidity Margin

FY 2014 Preliminary Results & 2015-2017 Plan Outline 29
2013 2014Net Debt
before Latamfrequencies
2014Net Debtincluding
Latamfrequencies
2014 2017
-1.3
Latamfrequencies
impact
2014 Debt reduction & 2015-2017 Free Cash Flow Evolution
Piergiorgio Peluso
~26.8
~+0.9
~26.65 ~26.65
Average debt reduction of ~700 €Mln per year before Mandatory Convertible (Nov. ‘16)
~25.8
~-1.0
~1.0 €Bln of deleverage before Latam frequencies
impact
Net Debt/Ebitda Ratio ~3.0x towards 2.5x in 2017
2013 - 2014 2014 – 2017
Mandatory Convertible Bond
€ Bln
DPS BoD proposal for 2014 (cash 2015)
Ordinary Shares
Saving Shares
Zero
2.75 €cent confirmed

FY 2014 Preliminary Results & 2015-2017 Plan Outline 30
Agenda
Rodrigo Abreu
FY 2014 Preliminary Results
2015-2017 Plan Outline
Financial Update
2015-2017 TIM Brasil Plan Outline
Appendix
FY 2014 Preliminary Results & 2015-2017 Plan Outline 31
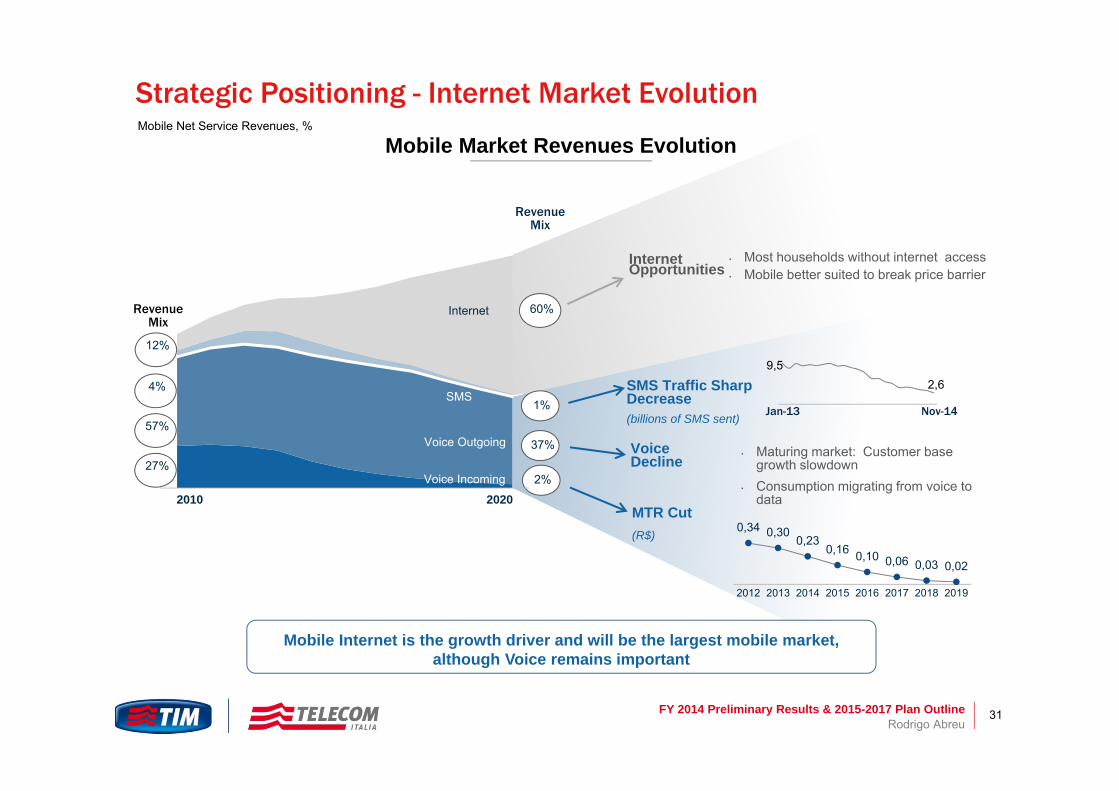
Mobile Market Revenues EvolutionMobile Net Service Revenues, %
Strategic Positioning - Internet Market Evolution
Revenue Mix
• Most households without internet access • Mobile better suited to break price barrier
9,52,6
Jan-13 Nov-14
0,34 0,300,23
0,16 0,10 0,06 0,03 0,02
2012 2013 2014 2015 2016 2017 2018 2019
1%
37%
2%
MTR Cut(R$)
Voice Incoming
Voice Outgoing
SMS
Internet 60%
• Maturing market: Customer base growth slowdown
• Consumption migrating from voice to data2010 2020
SMS Traffic Sharp Decrease(billions of SMS sent)
Voice Decline
Internet Opportunities
Mobile Internet is the growth driver and will be the largest mobile market, although Voice remains important
27%
57%
4%
12%
Revenue Mix
Rodrigo Abreu
FY 2014 Preliminary Results & 2015-2017 Plan Outline 32
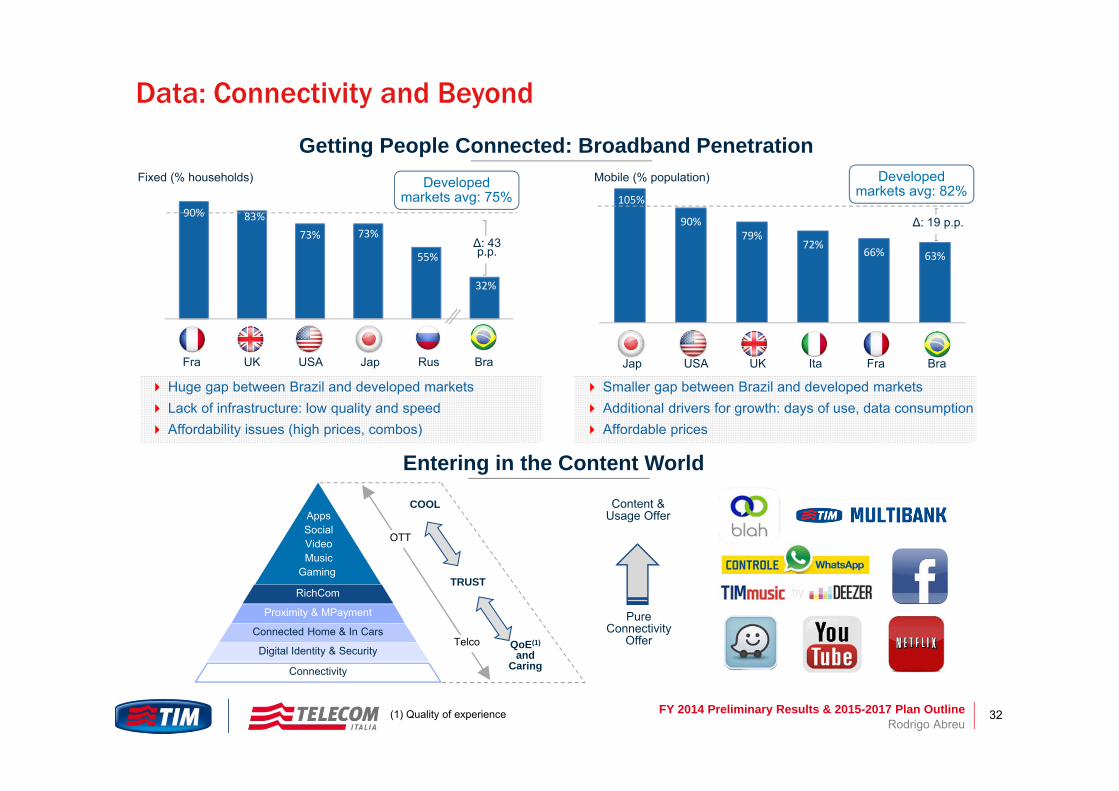
Getting People Connected: Broadband Penetration
Data: Connectivity and Beyond
Rodrigo Abreu
Smaller gap between Brazil and developed markets Additional drivers for growth: days of use, data consumption Affordable prices
Huge gap between Brazil and developed markets Lack of infrastructure: low quality and speed Affordability issues (high prices, combos)
Entering in the Content World
Content & Usage Offer
Pure Connectivity
Offer
Connectivity
Digital Identity & Security
Proximity & MPayment
Connected Home & In Cars
RichCom
AppsSocialVideoMusic
Gaming
OTT
Telco
COOL
TRUST
QoE(1)
and Caring
105%
90%79%
72%66% 63%
90% 83%73% 73%
55%
32%
Fra UK USA Jap Rus Bra Jap USA UK Ita Fra Bra
∆: 43 p.p.
∆: 19 p.p.
Fixed (% households) Mobile (% population) Developedmarkets avg: 82%Developed
markets avg: 75%
(1) Quality of experience

FY 2014 Preliminary Results & 2015-2017 Plan Outline 33
Small Cells
MACRO SITES 1,400 sites in 2015 3,902 sites in 15-17
SMALL CELLS 800 sites in 2015 3,477 sites in 15-17
WiFi / Femto / DAS 3,000 WiFi in 2015 >150 DAS in 2015
HetNet
% of Urban Covered Population2G3G
4G
95% 95%78% 79%
27%
86%
2013a 2014a 2015e 2016e 2017e
2014 Actual 2015 Bdg 2016 Plan 2017 Plan
1.9k3.7k
>15k
2013a 2014a 2015e 2016e 2017e
9.1k 10.4k>14k
2013a 2014a 2015e 2016e 2017e
0.7k1.5k
5k
2013a 2014a 2015e 2016e 2017e
Network Rollout
State of the art Capex Allocation: Enhance Quality to Increase Returns
New Coverage Strategy
Rodrigo Abreu
IRU + Construction SWAP until 2014SWAP @ 2015-2017
Legend
2G
3G
4G
2014a 2015e 2016e 2017e
TIM LD BackboneTechnology Capex Allocation
MBB Project Geographic Area• 1,137 cities prioritized due to business relevance, based on
IRR and Payback• MBB program is addressing >70% of TIM's business, and is
the key investment program in 2015-2017• High business concentration in few cities allows for a focused
infrastructure enhancement program
Number of 4G Sites
Number of Wifi & Small Cells
Number of 3G Sites

FY 2014 Preliminary Results & 2015-2017 Plan Outline 34
2014a 2017e 2014a 2017e
2014a 2015e 2016e 2017e 2014a 2015e 2016e 2017e
2014a 2015e 2016e 2017e
2014a 2017e
SAC (Subscriber Acquisition Cost)(R$)
Bad Debt (R$)
Business Growth
Network and Commercial Synergies
Network & Interconnection Savings
Rodrigo Abreu
2013a 2014a 2015e 2016e 2017e
Data Traffic Expectation
3G Data Traffic
LTE Data Traffic
(in petabytes)
Mobile Customer Base(mln customers)
73.4
75.7
2013a 2014a 2015e 2016e 2017e
Fixed Business Progress
Operational Efficiency
Network & Interconnection Cost
(R$)
Leased Lines Cost(R$)
Flat network and interconnection
cost as a percentage of total
costs
EBITDA Evolution(R$ without intercompany)
EBITDA - Capex

FY 2014 Preliminary Results & 2015-2017 Plan Outline 35
60k130k
>500k
2013a 2014a 2015e 2016e 2017e 2013a 2014a 2015e 2016e 2017e
2013a 2014a 2015e 2016e 2017e
Corporate Solutions as a Sustainable Business
Fixed Corporate Solutions & Live TIM Positive Trends
From option value to reality: Accelerate growth through
incremental investment Focus on keeping customer
experience leadership Introduction of new services
(Voice and Bluebox) Support the discussion on
“Banda Larga Para Todos” program
Rodrigo Abreu
Live TIM Plan: Accelerating Growth
Customer Base(thousands customers)
Investments(R$; YoY)
+3x+9x
2015-2017 Drivers: Revenue and EBITDA rebound Sales team resizing and training Customer care unification (F+M) Improvement on service level Fine tuning mobile portfolio Launch of new convergent solutions2013a 2014a 2015e 2016e 2017e
EBITDARevenues from New Sales (R$; YoY)
+9x
FIXEDFIXED
MOBILE
CONVERGEDSOLUTIONS
CONVERGEDSOLUTIONS

FY 2014 Preliminary Results & 2015-2017 Plan Outline 36
48% 40% 37% 35%
52% 60% 63% 65%
2014a 2015e 2016e 2017e
Innovative
Traditional
Innovative and Traditional Investments(R$; %)
MTR Impact Analysis(R$; %)
Mobile Net Revenues Analysis(R$; %)
24%
12%
31%
18%
2010 2011 2012 2013 2014 2015e 2016e 2017e-15% -11% -25%
Net Services Revenues Exposure
EBITDA Exposure
-33%MTR Cut (% YoY)
2013A 2014A 2017e
Innovative:
Traditional:
Data ContentOther
VoiceIncomingSMS
+48%
-11%
% YoY
Nearmid-single
-35% -44%
~5 bln
~9 bln
A Close Look at Business Performance
Perspectives2015-2017 Guidance
Rodrigo Abreu
18.8 19.9 19.5
2012A 2013A 2014A 2015e 2016e 2017e
Net Revenues(R$ billion)
5.0 5.2 5.5
2012A 2013A 2014A 2015e 2016e 2017e
EBITDA(R$ billion)
Others/Licenses
0.6 0.42.9
3.1 3.5
3.9
2012A 2013A 2014A 2015e 2016e 2017e
Organic3.8 3.9
6.9CAPEX(R$ billion)
Continued growth
Continued growth,
improving margin
CAPEX 2015-2017:>14 R$Bln

FY 2014 Preliminary Results & 2015-2017 Plan Outline 37
Agenda
FY 2014 Preliminary Results
2015-2017 Plan Outline
Financial Update
2015-2017 TIM Brasil Plan Outline
Appendix
Marco Patuano - Piergiorgio Peluso – Rodrigo Abreu

FY 2014 Preliminary Results & 2015-2017 Plan Outline 38
TotalRevenues
Ebitda
Group
21.6 €bln-5.4% YoY
8.8 €bln-6.8% YoY
FY’14
Organic data, € mln, %YoY
CapexIncludingLicense(1)
ExcludingLicense(1)
5.0 €bln+13.3% YoY(3)
4.0 €bln-5.4% YoY
Net DebtIncluding
Licenses(2)
ExcludingLicenses(2)
26.65 €bln; (-0.2 €bln vs FY’13)
25.8 €bln; (-1.0 €bln vs FY’13)
(1) Brazilian Spectrum & Clean-up cost(2) Brazilian & Argentinean Spectrum(3) Reported data
Domestic Brazil
15.3 €bln-6.6% YoY
7.0 €bln-9.6% YoY
2.8 €bln-8.2% YoY
6.2€bln -2.1% YoY
1.8 €bln+6.6% YoY
2.2 €bln+62.7% YoY(3)
1.2 €bln+1.5% YoY
Marco Patuano - Piergiorgio Peluso – Rodrigo Abreu
Telecom Italia Performance by Markets – Full Year 2014

FY 2014 Preliminary Results & 2015-2017 Plan Outline 39
-5,7% -4,8%
-8,5% -8,1%
1Q 2Q 3Q 4Q
-8,2% -7,4%-11,6% -11.0%
1Q 2Q 3Q 4Q+7,8% +8,0%
+6,5%+4,6%
1Q 2Q 3Q 4Q
ServiceRevenues
Ebitda
Capex
4Q’14 Group4.9 €bln-4.2% YoY
2.2 €bln-8.1% YoY
1.4 €bln+4.1% YoY
-6,5% -7,1%-5,7%
-4,2%
1Q 2Q 3Q 4Q
-5,8%-9,6%
-12,5%
+4,1%1Q 2Q 3Q 4Q
Domestic3.6 €bln-4.5% YoY
1.7 €bln-11.0% YoY
1.0 €bln-1.5% YoY
-8,7%-8,8%
-6,2% -4,5%
1Q 2Q 3Q 4Q
-14,9%-10,9% -9,3%
-1,5%
1Q 2Q 3Q 4Q
Brazil1.3 €bln -3.4% YoY
0.5 €bln+4.6% YoY
0.4 €bln+19.2% YoY
0,3% -2,0%-3,9% -3,4%
1Q 2Q 3Q 4Q
+30,4%-7,0%
-18,4%
+19,2%1Q 2Q 3Q 4Q
Marco Patuano - Piergiorgio Peluso – Rodrigo Abreu
Telecom Italia Performance by Markets - 4Q’14Organic data, € mln, %YoY

FY 2014 Preliminary Results & 2015-2017 Plan Outline 40
4Q’14 Reported€ mln, %YoY
Organic(1)
Telecom Italia 4Q’14 Group Results
Weight(2)€mln YoY YoY
Capex(3)
DomesticBrazil
RevenuesDomesticBrazil
Ebitda-Capex(3)
DomesticBrazil
EbitdaDomesticBrazil
(1) Starting from 2014, Organic performance includes only exchange rate variations and impacts from perimeter changes(2) Including TI Media, Other & Elimination. Olivetti is included in the Domestic perimeter(3) Capex w/o licence
net of new handsetsubsidy approach
+3.3%-1.5%
+16.5%
+4.1%-1.5%
+19.2%
-0.4%-6.1%
-4,1%-5.0%-2.3%
-3.7%-5.1%-0.3%
n.a.
-23.8%-21.3%
-
-23.9%-21.5%
-n.a.
1,408991416
5,6013,9671,627
79071177
2,1981,702
493
-8.4%-10.9%+1.4%
-8.1%-11.0%+4.6%
-6.5%-8.5%
70%30%
71%29%
90%10%
77%22%
Marco Patuano - Piergiorgio Peluso – Rodrigo Abreu
FY 2014 Preliminary Results & 2015-2017 Plan Outline 41
Service Revenues Trend YoY
Traditional
Outgoing voice
Incomingvoice
SMS
Innovative
wholesale
Service
530 531 536 501
52 56 57 59132 139 134 135
328 342 390 404
58 69 72 83
76126 95 185
1Q'14 2Q'14 3Q'14 4Q'14
Domestic Mobile Quarterly Mobile Revenues Breakdown
726 727
1,264 1,284
1,138 1,189
handsets
Total
+1
+48
+2
-31
+51
+20
-32
+14
+11
+90
-6
+84 1,368
1,183
695
Marco Patuano - Piergiorgio Peluso – Rodrigo Abreu
€ mln, QoQ
713
1,175
1,099
+13
+14
+12
+50
+39
+89
Traditional
Innovative
wholesale
Service
-14.9% -13.3%
-7.1% -5,7%
+8,7% +5.5% -0.5%+22.9%
+9,9% +8,4%
+16,6%+13.1%
-24,1% -21,9%-16,7% -16.1%

FY 2014 Preliminary Results & 2015-2017 Plan Outline 42
367 352 334 368
666 647 632 622
238 232 230 205
395 402 410 411
37 38 38 38133 134 135 156
878 859 860 854
56 73 79 118
1Q'14 2Q'14 3Q'14 4Q14
Domestic Fixed
Traditional
Innovative
Wholesale & others
Service
-7.4%-8,6%
-7,2%-5.3%
-10,4%-13,1%
-10,1%-7,5%
+0,1%+1,8%
+3,0% +4.2%
Traditional
Innovative
Service
Outgoing voice
Access
Others
National, Int’ wholesale + Subs&others
VASICT
Broadband
handsets
1,271 1,231 1,195
565 574 583
2,715 2,664 2,639
-40
+9
-51
-36
+9
-25
1,195
606
2,655
-
+23
+19
Marco Patuano - Piergiorgio Peluso – Rodrigo Abreu
€ mln, QoQQuarterly Fixed Revenues Breakdown
-7,2% -7,9%-9,3%
-8.1%
2,771 2,737 2,718-34 -19 2,773+55Total
Service Revenues Trend YoY

FY 2014 Preliminary Results & 2015-2017 Plan Outline 43
-28-20 -8 -17
-41 -34
-80
-2
-1-5 -28 -5
-111 -107
-178 -197
-124
-92
+75
+16
-72
-36 -41
Jan Feb Mar Apr May June July Aug Sep Oct Nov Dec
Domestic Mobile KPIs
MNP Balance
2014
2013
Highlights
Clear signs of market stabilization translated into:
better MNP balance+615k YTD
lower MNP volume -4,5 mln overall MNP transations in FY’14 vs FY’13
better churn rate 24%; -4.8pp YoY
Mobile CB Active CB
1Q'13 2Q'13 3Q'13 4Q'13 1Q'14 2Q'14 3Q'14 4Q'14
82% 82%
83% 84%83%
84%85% 85%
1Q'13 2Q'13 3Q'13 4Q'13 1Q'14 2Q'14 3Q'14 4Q'14
‘000
Marco Patuano - Piergiorgio Peluso – Rodrigo Abreu
Cum.+615 YoY
31,858 31,706 31,554 31,221 30,996 30,660 30,374 30,350
-18
FY 2014 Preliminary Results & 2015-2017 Plan Outline 44
761 736 711 684 655 625 597 568
5.258 5.182 5.131 5.130 5.111 5.054 5.020 4.961
965 1.014 1.045 1.084 1.122 1.155 1.164 1.161
1 1 4 15 45 103 151 231
1Q'13 2Q'13 3Q'13 4Q'13 1Q'14 2Q'14 3Q'14 4Q'14
965 1,015 1,050 1,100 1,167 1,259 1,315
6,984 6,933 6,892 6,915 6,933 6,939 6,9321,392
6,921
18,919,1
19,2 19,2 19,2
19,6
20,020,1
+3.5% +3.5% +3.6%+1.6% +1.8% +2.3%
+3.9% +4.8%
1Q'13 2Q'13 3Q'13 4Q'13 1Q'14 2Q'14 3Q'14 4Q'14
ARPU BB YoY
(201) (222) (183) (163) (182) (200)
(171) (176)
1Q'13 2Q'13 3Q'13 4Q'13 1Q'14 2Q'14 3Q'14 4Q'14
€/month
Domestic Fixed KPIsFixed Access
OLO
TI retail
Line Losses
YoY
BB ARPU
Flat ADSL
Total BB FastTotal
Free ADSL
SI+20Mb
Fiber
BB Access
13.777 13.555 13.372 13.210 13.027 12.828 12.656 12.480
7.238 7.233 7.164 7.169 7.211 7.258 7.167 7.224
1Q'13 2Q'13 3Q'13 4Q'13 1Q'14 2Q'14 3Q'14 4Q'14
Marco Patuano - Piergiorgio Peluso – Rodrigo Abreu
‘000
21,016 20,788 20,536 20,378 20,238 20,085 19,82319,704Total

FY 2014 Preliminary Results & 2015-2017 Plan Outline 45
+6,3%
-9.6%
-11.3%
-21.2%
+1.3%
-3.3%
+9,5%
-18,0%-62,8%
+19,2%
-6.5%
-7.4%
-18.1%
+3.2%
+16,4%
-0.6%
-15.5%-55,3%
wholesale(1)
Consumer+Business
services
outgoing voice
VAS
business received
handsets
(1) Including Visitors & other items (2) Total Retail Service Revenues net of Incoming
voicefees&other
-8.7%-5.1%Total
-11.6%-8.3%business generated(2)
1,442
75
1,367
1,181
1,136
615
521
45
186
57639
4Q’13
89
1279
1,094
504
537
52
185
48718
1,368
1,042
4Q’14 YoY FY’14 YoY
Domestic Mobile Revenues Breakdown
Marco Patuano - Piergiorgio Peluso – Rodrigo Abreu
Reported, € mln, %YoY

FY 2014 Preliminary Results & 2015-2017 Plan Outline 46
Sparkle group
Wholesale Domestic
Retail Service
Service Wireline 2,655 2,803 -5.3% -7.1%
258 245 +5.0% -0.2%
540 633 -14.7% -11.9%
1,800 1,873 -3.9% -6.6%
voice & access 1,073 1,173 -8.5% -10.5%
internet 417 400 +4.4% +2.2%
business data 287 286 +0.3% -2.1%
other 23 14 n.m. n.m.elim. & other 60 53 n.m. n.m.
Total Wireline 2,773 2,935 -5,5% -6.7%
Products 118 132 -10.6% +7.8%
Domestic Fixed Revenues Breakdown
4Q’14 4Q’13 YoY FY’14 YoY
Marco Patuano - Piergiorgio Peluso – Rodrigo Abreu
Reported, € mln, %YoY

FY 2014 Preliminary Results & 2015-2017 Plan Outline 47
25507 24467
-3,174+1,585
+893 -206 +508 +238
FY'13 OpFCF Cash Financial Expenses/Financial
Accrual
Taxes & other impacts
M&A Telecom Argentina (discontinued)
Dividends / change in equity
FY'14
FY14 Net Financial Position
26,807 26,651
-156
+1,629 -149 vs. 2013 -301 +575-153 -290
FX negative impact license
1,311
Including 1.3 bln euro Mandatory Convertible Bond& excluding 884 €Mln Cash out for Licences25,507 24,467
MandatoryConvertible Bond
Mandatory Convertible Bond & Licences Cash Out
BrazilianLicences540 mln € TA Licences
344 mln €
€ mln
Piergiorgio Peluso
-1,040

FY 2014 Preliminary Results & 2015-2017 Plan Outline 48
N.B. The figures are net of the adjustment due to the fair value measurement of derivatives and related financial liabilities/assets, as follows: - the impact on Gross Financial Debt is equal to 2.633 €/mln (of which 687 €/mln on bonds)- the impact on Financial Assets is equal to 1.263 €/mln.
Therefore, the Net Financial Indebtedness is adjusted by 1.370 €/mln.
Total Gross Debt net of Adjustment: Euro 34.421 mln
Maturities and Risk Management
Average m/l term maturity: 7,10 years (bond only 7,85 years)
Fixed rate portion on gross debt approximately 66,3%
Around 41% of outstanding bonds (nominal amount) is denominated in USD, GBP and YEN and is fully hedged
Well-Diversified and Hedged Debt
€ mln
Gross debt 34,421(of which 30 mln disc. Operations)
Financial assets (7,605) of which Cash & CE and marketable securities (6,112)
Cash & Cash Equivalent (4,812)Marketable securities (1,300)
Italian Government Securities (915)Other (385)
Discontinued operations (165)
Net Financial Position 26,651
Cost of debt: 5.4%
Marco Patuano - Piergiorgio Peluso