Embed Size (px)
Citation preview
Saudi Telecom Telecom – Industrial STC AB: Saudi Arabia
21 June 2016
Rating OVERWEIGHT
Target price SAR80.00 (25.3% upside)
Current price SAR63.83
Please see penultimate page for additional important disclosures. Al Rajhi Capital (Al Rajhi) is a foreign broker-dealer unregistered in the USA. Al Rajhi research is prepared by research analysts who are not registered in the USA. Al Rajhi research is distributed in the USA pursuant to Rule 15a-6 of the Securities Exchange Act of 1934 solely by Rosenblatt Securities, an SEC registered and FINRA-member broker-dealer.
Key themes
We expect the company to start announcing more details, post shifting to an IFRS regime. We expect minimal impact from GCC roaming rate cuts as well as interconnection rate cuts. Near term, Q2 is likely to be impacted by seasonality and finger print regulatory requirement. STC is one of the key beneficiaries of the Kingdom’s Vision 2030 blueprint.
Share information
Market cap (SAR/US$) 127.7bn / 34.04bn
52-week range 55.59 - 73.02
Daily avg volume (US$) mn
Shares outstanding 2,000mn
Free float (est) 16%
Performance 1M 3M 12M
Absolute 0.3% -7.5% -4.6%
Relative to index 2.6% -9.8% 26.6%
Major Shareholder:
Public Investment Fund 70.0%
Gen. Organisation for Social Insce. 7.0%
Valuation
12/14A 12/15A 12/16E 12/17E
P/E (x) 11.6 13.8 12.4 11.0
P/B (x) 2.1 2.1 2.0 2.0
EV/EBITDA (x) 5.8 5.6 5.4 5.1
Dividend Yield 5.5% 6.3% 6.7% 7.0% Source: Company data, Al Rajhi Capital
Performance
96.0
105.0
114.0
123.0
132.0
141.0
53.0
58.0
63.0
68.0
73.0
78.0
Price Close Relative to TADAWUL FF (RHS)
-10
30
70
06/15 09/15 12/15 03/16
RS
I10
Source: Bloomberg, Company data, Al Rajhi Capital
Company summary
STC is the incumbent in the Saudi Telecom sector. It has a dominance in fixedline space and has captured around half of the mobile market. STC also has operations internationally, which constitute ~10% of its topline.
Saudi Telecom Company OW: Safe bet We believe STC is one of the safe bets in current times with meaningful upside
and healthy dividend yield. Post a shift to IFRS accounting standards from Q1
2017, we believe there will likely be additional financial disclosures giving
more clarity on the business. In the long term, STC will be the key beneficiary
of the technological transformation of the Kingdom as outlined in the recently
released NTP program, in our view. Near term, we believe Q2 will be impacted
by the ‘finger print’ exercise and Ramadan seasonal effect. However impact of
GCC roaming rate cuts will be benign and, the second set of regulatory
interconnection cuts will be insignificant in our view. The company is
employing strategies to push ARPU up, such as phasing out one-time data
plans for prepaid subscribers. With major impairments done in 2015 at its
challenging international JVs, the company looks much leaner and cleaner. A
tower sale and lease back, if implemented, will barely move the stock price in
our view. Key downside risks to our estimates are increased provisions, and
high number of subscriber accounts cancelled post finger print exercise. Our
dividend estimates imply an attractive yield of 6.7%, which makes STC one of
the top dividend picks in the Kingdom. We maintain our Overweight rating on
the company with a TP of SAR80/share.
Safe bet. Being the dominant player in a defensive sector, with solid cash flow
generation and high dividend yield, the company is one of the safe bets in the
Kingdom especially in the current market environment. Long term, we believe
STC will likely be the key beneficiary of the Govt.’s technological transformation
as outlined in Vision 2030 document. The mandatory move to IFRS accounting
standards would be a medium term catalyst for the stock in our view, if
additional Key Performance Indicators (KPI) are also reported.
Weaker Q2. Q1 was relatively weak, with 3% top-line growth (partly attributed
to allocation of resources to finger print activity) after posting 10% growth in
2015. Q2 will be weaker given the continued impact from finger print exercise,
and Ramadan, partly offset by higher contribution from Viva Kuwait.
Barely any impact from regulatory decisions. Recent regulatory decision to
cut GCC roaming rates will barely make an impact. Moreover, these are highly
price elastic services. Cut in interconnection rate cuts will be insignificant as well
given symmetric interconnection rates and higher on-net calls in our view.
Valuation. The company is one of the top 10 picks in terms of dividend yields
and is rated as A- by S&P. Based on a mix of DCF and relative valuation
methodologies, we value the stock at SAR80/share and maintain OW rating. Key
downside risks include cancellation of active accounts that have not provided
finger prints, impairments at international subsidiaries and regulatory fines.
Period End (SAR) 12/13A 12/14A 12/15A 12/16E 12/17E
Revenue (mn) 45,605 45,826 50,651 52,071 54,006
Revenue Growth 1.9% 0.5% 10.5% 2.8% 3.7%
Gross profit margin
EBITDA margin 38.1% 40.7% 38.1% 37.4% 37.9%
Net profit margin 21.7% 23.9% 18.3% 19.8% 21.5%
EPS 4.95 5.48 4.63 5.16 5.81
EPS Growth 38.2% 10.7% -15.5% 11.6% 12.5%
ROE 18.9% 18.7% 15.2% 16.8% 18.3%
ROCE 16.2% 15.5% 16.0% 15.7% 16.3%
Capex/Sales 16.3% 13.3% 18.3% 18.0% 18.0% Source: Company data, Al Rajhi Capital
Pritish K. Devassy, CFA Head of Equity Research
Tel +966 11 2119370, [email protected]

Saudi Telecom Telecom – Industrial 21 June 2016
Disclosures Please refer to the important disclosures at the back of this report. 2
Well positioned for the long term
In the last year when oil prices declined 19.5% and TASI was down 31%, STC’s share price
was relatively stable with only 4.5% decline . Being the dominant player in a defensive sector,
STC is one of the safest bets in the market with a meaningful upside and attractive dividend
yield of 6.7%. It continues to trade below its historical (2-year) EV/EBITDA multiple and its
peers as well. We believe it will continue to remain defensive and is well positioned for the
long term. In the short term, STC will shift to IFRS reporting standards from Q1 2017 as all
listed companies are mandated to implement IFRS accounting standards beginning from
2017. We believe this will lead to a lot more financial details being reported. If the company
starts reporting additional details (beyond that mandated by IFRS) such as detailed revenue
mix, subscriber data etc., then this would eliminate some “opacity discount” applied on the
stock and could push the stock above its current trading band of around SAR60-65 in the
past year. The reverse phenomenon was seen in 2013, when the company started accounting
for some of the non-core assets as associates and JVs instead of fully consolidating and this
led to more clarity (downward revision) of domestic business drivers, pushing the stock
lower.
Key beneficiary of NTP
While the above is likely to only eliminate the perceived discount, the company will see
tangible value created as STC is likely to be the key beneficiary in the technology
transformation of the Kingdom. As per Vision2030, Saudi government is committed to
expanding telecom coverage and capacity, especially for high speed broadband through
investment in infrastructure within and around cities. In addition, the Government will also
work on improving regulations and build effective partnership with providers, enabling them
to build essential infrastructure and simultaneously encourage local investments. We believe
STC being the leading telecom provider is well-placed to benefit from this broadband push.
As per the NTP document, the Govt plans to increase FTTH penetration to 80% in 2020 from
44% currently. STC has already laid down FTTH cables of 147,000 km and has the largest
internet gateway in the Middle East, with a capacity of 1,533 gigabyte per sec and more than
12,000 terabyte daily giving it the easy advantage. Not just Telecom, the company is investing
into cloud and IT as well. We have summarised the salient targets for the telecom and related
sectors set in the NTP book:
- Increase the contribution of the IT industry to non- oil GDP from 1.12% to 2.24%
- Increase the frequency of spectrum available for telecom services out of the total
allocated resources from 42% to 80%
- Increase FTTH coverage in densely populated urban areas from 44% to 80%
- Broaden wireless broadband network coverage (more than 10mbps) in remote areas
from 12% to 70%
- Increase the number of internet users in the Kingdom from 63.7% to 85%

Saudi Telecom Telecom – Industrial 21 June 2016
Disclosures Please refer to the important disclosures at the back of this report. 3
Minimal impact of regulatory changes While telecom companies across the globe have experienced regular regulatory actions, the
Saudi Telecoms sector had been immune till 2015. Starting from 2015, the Saudi telecom
sector saw a flurry of changes – cutting of interconnection rates (twice), GCC roaming rate
cuts, 100% Saudization of telecom sector, finger print requirement etc. Most of these were
not totally unexpected, as discussions on most of the changes were on-going in the past, with
only the timelines unknown. The impact of these new regulations- cutting GCC roaming
rates, reduction in termination fee, etc. were widely feared to be a downside risk for the stock.
Based on our analysis and discussion with the companies the impact is likely to be minimal.
Cut in GCC roaming rates
GCC countries decided in June 2015 to gradually reduce the roaming rates in phases, as a
part of the economic integration plan among the GCC countries, which includes outgoing
voice calls, SMS and data services. This was after the initial set of cuts (setting the price caps)
which was only on outgoing calls, implemented way back in 2012.
The new reductions of roaming charges will be on both inter-operator wholesale level and
end user retail level and will take place gradually, over a three years period, for voice calls and
SMS services, and over a five years period for mobile data services as seen below.
Figure 1 Revised roaming rates for a typical GCC telecom company*
Rates Prev.
As of 1
April
2016
As of 1
April
2017
As of 1
April
2018
As of 1
April
2019
As of 1
April
2020
Within the Visited Country (SAR) 1.06 1.00 0.96 0.92 - -
To other GCC Member States including home country (SAR) 2.55 2.46 2.38 2.31 - -
Calls received while roaming(SAR) 1.31 1.35 1.08 0.85 - -
SMS (SAR) 0.30 0.31 0.27 0.23 - -
Data (SAR) / MB 4.88 5.00 3.27 2.31 1.92 1.61 Source: Al Rajhi Capital, CRA Qatar,. *Mobily’s roaming rates, Emirates247
Based on our understanding, call prices are to be cut by a total ~40% over a 3 year period.
The cuts are only 2-3% in 2016 and higher in 2017 and 2018 by ~18%. Post 2018, prices will
be cut only for data as seen below:
Figure 2 Changes in rates over the years
% change Weights 1st year 2nd year 3rd year 4th year 5th year
Within the Visited Country 13% -6% -4% -4%
To other GCC Member States including home country 13% -4% -3% -3%
Calls received while roaming 15% 0 -20% -21%
SMS 5% 0 -13% -15%
Data 54% 0 -35% -29% -17% -16%
Weighted average -1.2% -23.1% -20.6% -9.1% -8.7% Source: Al Rajhi Capital, CRA Qatar, Emirates247
This will lead to collective user savings of ~ $1.13bn (SAR4.24bn), reducing the financial
burden on GCC users (Source: GCC Economic affairs). We believe this to be over five years
with calculations as shown below:
Figure 3 Calculation of cumulative user savings
In USDm Current year 1st year 2nd year 3rd year 4th year 5th year
GCC Roaming revenues 757 748 575 457 415 379
Savings per year 9 182 300 342 378
Cumulative savings 1,211 Source: Company data, Al Rajhi Capital

Saudi Telecom Telecom – Industrial 21 June 2016
Disclosures Please refer to the important disclosures at the back of this report. 4
STC does not provide exact contribution of roaming revenues which makes it difficult to
calculate the impact of roaming rate cuts. Based on GCC regulatory data, we calculate GCC
roaming revenues to be 1.3% of total telecom revenues. This is below the industry average
(5% of top line for average European telecom company) as this takes into account only GCC
roaming revenues (as against international roaming revenues).
As STC has significant contribution from fixed line segment and others, GCC roaming
revenues could be less than 1% of top line. As per GCC regulatory data, the average GCC
margins are likely to be around 50% (average of inbound and outbound margins). Applying
the percentage of inbound and outbound visitors to and from Saudi Arabia on the margins,
we arrive at an average 45% margin for roaming calls for the Saudi Telecom players.
Figure 4 Calculation of margin for roaming services
2014 data (in thousand trips) Inbound tourists Outbound tourists
All inclusive 18,259 20,051
GCC alone 6,057 10,013
Weightage based on direction of visits 26% 19%
Average margin 45% Source: SAMA, Al Rajhi Capital
Thereby with a 1% revenue contribution and 45% net profit margin, the impact
on STC will be minimal at SAR90m spread over next 3 years with 2016 impact to
be less than SAR10m.
Second round of rate cuts on mobile and fixed lines
Saudi Arabia’s Communication and Information Technology Commission (CITC) announced
the second revision of the interconnection rates for mobile and landline in March 2016. The
initial rate revision was announced in February 2015, when interconnection rates were
reduced by 40% to SAR0.15 (from SAR0.25) for mobile and for landline by 30% to SAR0.07
(from SAR0.10). Zain acted on it by reducing the call rates to SAR0.19 for all calls, followed
by Mobily in June 2015, introducing new plans that slashed their on-net, off-net calls and
SMS rates to SAR 0.19.
The second set of rates cut was announced in March 2016, under which mobile
interconnection rates were reduced by 33% for mobile to SAR0.10 and landlines by 36% to
SAR 0.045. With the cut in interconnectivity charges, CITC is looking to increase competition
among the existing operators and also enable the MVNOs to compete in the already saturated
market. We believe the current termination rates are in-line with the global average
(SAR0.08 for MTRs) and do not expect any more big cuts in the near future.
In a hypothetical ideal scenario with symmetric interconnection rates, there should be no
impact of cut in interconnection rates as interconnection revenues should equal
interconnection expenses. However in the case of the telecom sector in the Kingdom we
estimate the percentage off-net calls lesser than the ideal scenario. As per our understanding
with all the bundled packages promoting on-net calls, there is a high percentage of on-net
calls in the Kingdom. Also the termination rates are symmetric. Hence, we believe that
the decline in interconnection rates should be insignificant as was seen post the
first set of cuts. For the smaller companies this should be only slightly beneficial, as was
noticed in the financials post the first cuts. Overall the net result was that it increased
competition as Zain cut its call rates to 19halalas.
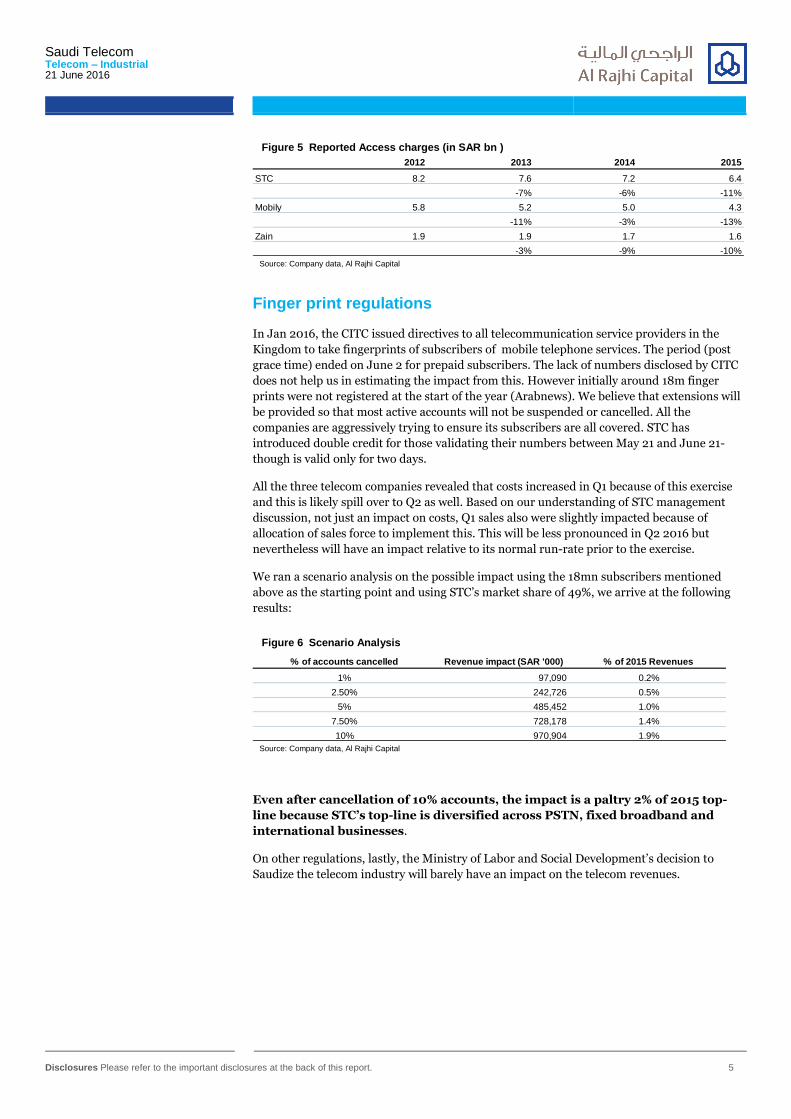
As mentioned above, we believe the net impact of the second rate cut will be similar to the
first wherein all the companies saw a 10-13% reduction in access charges (see table). For
STC we estimate access charges to decline by 10% in 2016. As there was no major
impact on financials post the first cuts, one could estimate at a similar decline for
interconnection revenues as well.
Saudi Telecom Telecom – Industrial 21 June 2016
Disclosures Please refer to the important disclosures at the back of this report. 5
Figure 5 Reported Access charges (in SAR bn )
2012 2013 2014 2015
STC 8.2 7.6 7.2 6.4
-7% -6% -11%
Mobily 5.8 5.2 5.0 4.3
-11% -3% -13%
Zain 1.9 1.9 1.7 1.6
-3% -9% -10% Source: Company data, Al Rajhi Capital
Finger print regulations
In Jan 2016, the CITC issued directives to all telecommunication service providers in the
Kingdom to take fingerprints of subscribers of mobile telephone services. The period (post
grace time) ended on June 2 for prepaid subscribers. The lack of numbers disclosed by CITC
does not help us in estimating the impact from this. However initially around 18m finger
prints were not registered at the start of the year (Arabnews). We believe that extensions will
be provided so that most active accounts will not be suspended or cancelled. All the
companies are aggressively trying to ensure its subscribers are all covered. STC has
introduced double credit for those validating their numbers between May 21 and June 21-
though is valid only for two days.
All the three telecom companies revealed that costs increased in Q1 because of this exercise
and this is likely spill over to Q2 as well. Based on our understanding of STC management
discussion, not just an impact on costs, Q1 sales also were slightly impacted because of
allocation of sales force to implement this. This will be less pronounced in Q2 2016 but
nevertheless will have an impact relative to its normal run-rate prior to the exercise.
We ran a scenario analysis on the possible impact using the 18mn subscribers mentioned
above as the starting point and using STC’s market share of 49%, we arrive at the following
results:
Figure 6 Scenario Analysis
% of accounts cancelled Revenue impact (SAR '000) % of 2015 Revenues
1% 97,090 0.2%
2.50% 242,726 0.5%
5% 485,452 1.0%
7.50% 728,178 1.4%
10% 970,904 1.9% Source: Company data, Al Rajhi Capital
Even after cancellation of 10% accounts, the impact is a paltry 2% of 2015 top-
line because STC’s top-line is diversified across PSTN, fixed broadband and
international businesses.
On other regulations, lastly, the Ministry of Labor and Social Development’s decision to
Saudize the telecom industry will barely have an impact on the telecom revenues.

Saudi Telecom Telecom – Industrial 21 June 2016
Disclosures Please refer to the important disclosures at the back of this report. 6
Pushing up ARPU
Change in mobile data strategy –shift to higher ARPU band
We note that the company has been actively making changes in its data plans. Based on our
observation of its data plans, STC has made two changes–
a) It has changed all one-time internet plans for prepaid customers to recurring plans
b) The company has made some changes that could increase its average ARPU. For
example a 2GB plan used to cost SAR100 per month. Now this plan has been
eliminated and there is only a 1GB plan which costs SAR90 per month. The next
higher data plan is a 5GB plan that costs SAR200. This should ideally provide an
incentive for customers to shift to higher bands package for better value.
Ideally, if customers continue to stick on with STC, this will result in higher ARPUs but
there are obvious risks to the change, the key risk being migration of subscribers to
competitors given its cheaper plans. Please see appendix for the plans.
Taking to the next level through Jawwy
Being a commoditized product, differentiation in telecom products is about unique
packaging. Following the trend in developed markets, 2012 saw the advent of bundle-based
competition in Saudi Arabia. STC was able to leverage its fixed line infrastructure to offer
bundles that combine fixed voice, IPTV and ADSL/FTTH broadband, while Mobily and Zain
KSA competed on bundled offers that combine voice and data. Now STC is taking to the next
level with its unique service “Jawwy”. STC is aiming to take higher market share with Jawwy
wherein one can design his or her own bundles with more or less of data or voice depending
on the need. This is the next level post bundling products in our view. The impact is
too early to be estimated, however this shows that STC is actively trying to capitalize on its
leadership position and its strength as an integrated player.
Wireline data advantage
STC is the major beneficiary of the increase in fixed broadband revenues as we estimate STC
to have bulk of the revenue market share in fixed-line and data revenues. Thus despite
market penetration being saturated for mobile business, it enjoys dominance in the
fixed broadband space. Given entry of new content based services (eg. Netflix) and fair
usage limit for mobile broadband, there is likely to be a shift from mobile broadband to fixed
line broadband gradually, which have unlimited data packages.
Figure 7 Saturated mobile market Figure 8 Total Fixed Wireline and Wireless data subscribers in Saudi Arabia
Title:
Source:
Please fill in the values above to have them entered in your report
53,700
53,000
50,800
52,700 52,800
4.1%
-1.3%
-4.2%
3.7%
0.2%
-5.0%
-4.0%
-3.0%
-2.0%
-1.0%
0.0%
1.0%
2.0%
3.0%
4.0%
5.0%
49,000
49,500
50,000
50,500
51,000
51,500
52,000
52,500
53,000
53,500
54,000
2011 2012 2013 2014 2015
Mobile subscribers ('000) y-o-y growth
Title:
Source:
Please fill in the values above to have them entered in your report
2.0
2.5
2.93.0
3.6
12.1%
30.3%
15.0%
3.8%
17.5%
0%
5%
10%
15%
20%
25%
30%
35%
0.0
0.5
1.0
1.5
2.0
2.5
3.0
3.5
4.0
2011 2012 2013 2014 2015
Fixed Wireless and Wireline Broadband lines(mn) y-o-y growth
Source: CITC, Al Rajhi Capital Source: CITC, Al Rajhi Capital

Saudi Telecom Telecom – Industrial 21 June 2016
Disclosures Please refer to the important disclosures at the back of this report. 7
International operations
The book value of its investments in joint ventures has reduced to ~SAR5bn in 2015 from
~SAR12bn in 2012, mainly because of impairments at Oger Telecom, one of its challenging
JVs. After significant impairments to Oger, we believe there is not much downside from
this level (reduced to SAR0.48bn from SAR2.23bn). While this will not impact our
valuation, this lowers EPS of the company.
Figure 9 Investments in joint ventures (SAR 000's)
2012 2013 2014 2015
Binariang GSM Holding - Malaysia 6,633 4,256 4,565 4,566
Oger Telecom Ltd. U.A.E. 5,313 3,713 2,234 487
11,946 7,969 6,799 5,053 Source: Company data, Al Rajhi Capital
Viva Kuwait
The company increased its stake in VIVA Kuwait to 51.8% (from ~26%) in February 2016,
and is the currently the largest contributor within its international segment. Based on our
estimates, we expect the increase in stake will result in an incremental net profit growth of
~2% in 2016. Similar to Saudi Arabian telecom market Kuwaiti market is saturated but its
ARPUs are higher than the domestic market and will benefit from increase in margins.
Figure 10 Blended average ARPU in SAR
Viva Kuwait STC Saudi
2012 89.0 73.9
2013 85.9 68.3
2014 103.1 63.3
2015 114.7 90.0 Source: Company data, Al Rajhi Capital
Impact of shifting Ramadan – seasonality
Usually Ramadan period is a weak period for businesses in the Kingdom and telecom
business is no exception. As Ramadan shifts forward by 2 weeks annually, this year most of
Ramadan will fall in the month of June. Q2 in 2016 will be weaker than Q2 2015 because of
this shift. In contrast Hajj season is positive for telecom business as volume of calls is likely to
be higher.
Figure 11 Ramadan shifting into Q2 this year
Year Ramadan Quarter Hajj Dates Quarter
2011 01 Aug - 31 Aug Q3 2011 02 Nov - 07 Nov Q4 2011
2012 20 Aug - 19 Aug Q3 2012 21 Oct - 26 Oct Q4 2012
2013 09 Jul - 8 Aug Q3 2013 10 Oct - 15 Oct Q4 2013
2014 28 Jun - 28 Jul Q3 2014 29 Sept - 4 Oct Q3 -Q4 2014
2015 18 Jun - 18 Jul Q2 - Q3 2015 19 Sep - 24 Sep Q3 2015
2016 07 Jun - 07 Jul Q2 2016 8 Sep - 13 Sep Q3 2016 Source: timeanddate.com, Al Rajhi Capital

Saudi Telecom Telecom – Industrial 21 June 2016
Disclosures Please refer to the important disclosures at the back of this report. 8
Tower sale and leaseback option
While sale and leaseback activity is common in the real estate sector in the Middle East,
telecom tower sale and lease back activity is unprecedented in the Kingdom. Mobily and Zain
KSA are looking at options to sell their towers. As per Argaam, even STC is considering sale of
its mobile towers, which is a bit surprising because company already has sufficient cash and
the company has the widest network coverage in the Kingdom. Based on our interaction with
the company, despite there being no real need for the company to sell its tower assets and
lease it back, they would be interested only if it is financially lucrative and as it improves
efficiency. For Mobily and Zain, a tower sale would help them reduce debt and reduce their
financial expenses. A tower sale would lower capital needs and also help the company focus
on its core business.
What is the possibility in Saudi Arabia? We believe a tower company will find a deal less lucrative in the Kingdom relative to other
markets because:
The market is already saturated with mobile penetration at 167.5% - implying not
much room for mobile towers (relatively to other markets). Topline growth for a
tower company comes from potential increase in new shared sites and tenancy.
In Saudi Arabia there are only three operators – so there is a lesser pool of targets to
increase the tenancy ratio.
On average the existing tenancy ratio average is quite high for tower companies –
which will likely not be the case in Saudi Arabia.
Contrary to the perceived notion, cost of running tower sites in the Kingdom is
higher than market average, because of high real estate rentals . We believe
operating costs could be more than US$10,000 annually. Thus the lease rates will be
higher.
What is the financial impact? As for the financial impact, a sale and lease back offer will result in lower EBITDA as the
company will have a higher lease rate compared to existing tower related operating expenses.
However the decrease in net income will be partly mitigated by reduction in financial
expenses (or increase in interest income) and lower depreciation. This cash received could
help them deleverage, meet debt and other obligations and even could even free capital for
activities such as M&A. There are disadvantages as well (especially for the market leader) as
this could give up competitive advantage by sharing towers assets with competitors.
Contrary to general perception of lower costs of operating a tower in Saudi Arabia, relative to
other markets because of lower fuel costs, operating costs of a tower is higher at around
~SAR4,000/month, which translates to ~US$13,000 annually (based on our interaction with
one of the companies in the region). This is in line with the expenses in the US which come to
US$12,000-14,000 per tower annually. The lease rates in the US are at around US$20,000.
Lease rates ideally are dependent on a lot of variables such as the tenancy ratio, cost of
maintaining a tower, cost of building a tower etc. The exact details are not available, but it
would be logical to assume higher lease rate in Saudi Arabia, than in the US given possibly
lower tenancy ratios in the Kingdom.
Using these assumptions for 5,000 towers, entering into a tower deal would
reduce EBITDA by SAR169mn, insignificant compared to 2015 EBITDA of
SAR19.2bn.
Assuming an EV/EBITDA of 7x, this would mean the company should benefit only if the
tower sale proceeds are greater than SAR1.2bn (EV EBITDA of 7* reduction in EBITDA of
SAR169mn), which would mean value per tower of USD63k. This we note is much lower than
the valuation of ~USD150k per tower, reported in the media. Logically speaking, given that a
tower sale is not too important for STC as compared to Zain and Mobily, a deal will not be
struck unless it is positive for the company. However this would not have a material impact
on the company.

Saudi Telecom Telecom – Industrial 21 June 2016
Disclosures Please refer to the important disclosures at the back of this report. 9
Among the best dividend yields in the Kingdom
Working capital increased
STC saw a surge in its accounts receivables in 2015, which is mainly attributed to Govt. receivables. The accounts receivables still at SAR12.6bn is not a worry for two reasons:
a) Based on historical evidence, Govt. could delay payments but will not default
b) The company has to pay fees every year to Govt. of around 4bn and so these receivables can be netted if required in the future. Already Government payables are at SAR2bn.
However, provisions notably surged 41% to 1.7bn from 1.2bn compared to only a 10% increase in revenue in 2015.
Dividend policy
Based on its new dividend policy (from Q4 2015), STC will continue to pay a dividend of
atleast SAR1 per share quarter (SAR4 per year) for the next three years. However, the
regulatory changes and increased working capital requirements have not helped the company
to increase its dividend payments. We believe STC will continue to generate a healthy FCF
(SAR4.5/share in 2016 and SAR5.3/share in 2017) which will allow it to maintain its dividend
payout and sustain a healthy cash position. Our forecast for STC’s annual dividend is
SAR4.25 per share, with a dividend yield of ~6.7%.
Figure 12 Dividend yields and dividend per share estimates for STC
Title:
Source:
Please fill in the values above to have them entered in your report
2.25
3.50
4.00 4.25
4.50
4.85
3.5%
5.5%
6.3%
6.6%
7.0%
7.6%
0%
1%
2%
3%
4%
5%
6%
7%
8%
0
1
2
3
4
5
6
FY13 FY14 FY15 FY16E FY17E FY18E
Source: Company data, Al Rajhi Capital.

Saudi Telecom Telecom – Industrial 21 June 2016
Disclosures Please refer to the important disclosures at the back of this report. 10
Valuation
We use a mix of DCF and relative valuation methodologies to value the firm. For DCF
method, we employ a terminal growth of 1.5% and a WACC of 9.8%. As for relative valuation,
the company is trading below its peers as well as historical multiples on a EV/forward
EBITDA basis. As Tax (Zakat) is lower compared to its peers (as most of the Govt. related fees
etc. come above the EBITDA level), ideally STC should be trading at a higher EV/EBITDA
multiple.
Figure 13 Calculation of target price
Method Valuation Weight ARC Target
DCF 82.7 75% 62.1
Relative 71.7 25% 17.9
80.0
Fair Price as on today 80.0
UPSIDE 25% Source: Company data, Al Rajhi Capital, Bloomberg
We arrive a target price of SAR80 as seen above.
Figure 14 DCF Valuation methodology(on a per share basis)
Component Value
Appraised value of the enterprise 68.8
Add:
Sukuks / Investments 3.2
Value of associates and non-core assets 7.0
Less:
Net debt 8.3
Minorities (1.4)
Provisions & Other liabilities (3.3)
Target Price 82.7 Source: Company data, Al Rajhi Capital
Figure 15 Trading below peers and 2 year historical multiples(EV/EBITDA basis)
Title:
Source:
Please fill in the values above to have them entered in your report
5
5.5
6
6.5
7
7.5
STC Comparables average
Source: Al Rajhi Capital, Bloomberg

Saudi Telecom Telecom – Industrial 21 June 2016
Disclosures Please refer to the important disclosures at the back of this report. 11
Figure 16 Valuation multiples for peers
Est P/E Current Yr Est P/E Next YrEV/EBITDA
Current YrEV/EBITDA Next Yr
Saudi Telecom Co 11.68 11.37 5.74 5.68
Oman Telecommunications Co 9.76 9.58 4.28 4.19
Maroc Telecom 18.62 17.56 7.11 6.87
Bahrain Telecom Co 1.13 1.09 4.15 4.15
Partner Communications Co 53.22 171.44 5.88 6.23
Telkom Sa Soc Ltd 10.31 9.82 3.38 3.34
Emirates Integrated Telecomm 16.12 15.60 4.85 4.65
Bezeq The Israeli Telecom Co 13.36 13.48 6.87 6.81
Ooredoo Qsc 13.02 12.19 4.62 4.57
Emirates Telecom Group Co 18.29 17.31 6.74 6.50
Cellcom Israel Ltd 17.67 20.09 6.00 6.25
Vodacom Group Ltd 16.52 15.18 7.95 7.37
Mtn Group Ltd 10.98 10.37 4.76 4.61
Global Telecom Holding 38.29 10.44 2.71 2.72
Safaricom Ltd 17.03 14.77 8.06 7.27
Mobile Telecommunications Co 8.21 7.34 4.61 4.48
Etihad Etisalat Co 95.17 33.50 7.39 6.75
Telecom Egypt 6.30 6.65 3.61 3.67
Average 20.87 22.10 5.98 5.74 Source: Company data, Al Rajhi Capital, Bloomberg consensus estimates.
Risks
Near term downside risks are cancellation of active subscriber accounts which have not
complied with finger print requirement, impairments or unexpected regulations which can
affect its international operations which have been problematic in the past, further decline in
oil markets, negative outcome of their changes in its packages or data plans, regulatory risks
such as introduction of new fees or fines.

Saudi Telecom Telecom – Industrial 21 June 2016
Disclosures Please refer to the important disclosures at the back of this report. 12
Appendix
Figure 17 Mobily prepaid plans
Package Bundle Fees/ SR MB Included Additional MB (SAR)
Internet Basic Free 0 2
Hourly Package 10 SR/ Hour Unlimited -
Daily Package 24 SR / Day Unlimited -
Internet 30 MB 10 SR / Month 30 MB 2
Internet 50 MB 15 SR / Month 50 MB 2
Internet 100 MB 25 SR / Month 100 MB 2
Internet 150 MB 30 SR / Month 150 MB 2
Internet 500 MB 60 SR / Month 500 MB 2
Internet 1 GB* 79 SR / Month 1 GB 2
Internet 2 GB 100 SR / Month 2 GB 2
Internet 3 GB 130 SR / Month 3 GB 2
Internet 5 GB 200 SR / Month 5 GB 2
Unlimited Internet 350 SR / Month Unlimited - Source: Company data, Al Rajhi Capital
Figure 18 Zain KSA prepaid plans
Package Plan Price (SAR) Validity
Internet Light Plans 500 MB 10 One Day
50 MB 15 One Month
100 MB 20 One Month
250 MB 30 One Month
500 MB 45 One Month
Internet Basic Plans 1 GB 69
3 GB 100
6 GB 200 One Month
40 GB 300
Internet Unlimited Monthly 500 Source: Company data, Al Rajhi Capital
Figure 19 STC prepaid plans
Prepaid Package Price Data Validity
Sawa 200 MB 30 SAR 200 MB 7 days with auto renew
Sawa 500 MB 50 SAR 500 MB 7 days with auto renew
SAWA 250 MB 50 SAR 250 MB 30 days with auto renew
SAWA 1 GB 90 SAR 1 GB 30 days with auto renew
Sawa 5 GB 200 SAR 5 GB 30 days with auto renew
SAWA 20 GB 350 SAR 20 GB 30 days with auto renew Source: Company website, Al Rajhi Capital

Saudi Telecom Telecom – Industrial 21 June 2016
Disclosures Please refer to the important disclosures at the back of this report. 13
Figure 20 STC data sim plans
Connet 4G
Infinity
package Package Name
Promotion
Fee
Infinity 6 Months (Data SIM & 4G Router) SAR 650
Infinity 12 Months (Data SIM & 4G Router) SAR 1,200
4G Router only SAR 180
Bundle Initial Subscription Price
Connect 2GB Data SIM 1 month SR 55
Connect 5GB Data SIM 1 month SR 90
Connect 4G USB 3 months SR 345
Connect 4G Router 3 months SR 405
Connect 4G Mini WIFI 3 months SR 395
Connect 4G Mini WIFI (Big Battery) 3 months SR 425
Connect 10GB Data SIM 3 months SR 270
Connect 4G USB 3 months SR 370
Connect 4G Router 3 months SR 480
Connect 4G Mini WIFI 3 months SR 450
Connect 4G Mini WIFI (Big Battery) 3 months SR 500
Connect 20GB Data SIM 3 months SR 300
Connect 4G USB 6 months SR 720
Connect 4G Router 6 months SR 860
Connect 4G Mini WIFI 6 months SR 830
Connect 4G Mini WIFI (Big Battery) 6 months SR 880
Connect 60GB Data SIM 6 months SR 575
Connect 4G USB 12 months SR 1270
Connect 4G Router 12 months SR 1410
Connect 4G Mini WIFI 12 months SR 1380
Connect 4G Mini WIFI (Big Battery) 12 months SR 1430 Source: Company data, Al Rajhi Capital
Figure 21 Mobily data sim plans
Package 1 month 3 months 6 months 12 months
2GB SR 45 SR 105 SR 185 SR 350
5GB SR 80 SR 210 SR 370 SR 690
10GB SR 90 SR 230 SR 410 SR 765
20GB SR 95 SR 255 SR 450 SR 850
Infinity 60GB N/A N/A SR 490 SR 920 Source: Company website, Al Rajhi Capital

Saudi Telecom Telecom – Industrial 21 June 2016
Disclosures Please refer to the important disclosures at the back of this report. 14
Figure 22 Zain data sim plans
Plan Price Validity
Free
Multi-SIM Free On-net SMS
Delight* (Pay as You Go) SAR 20 N/A N/A N/A
2 GB SAR 45 1 Month 0** 100
10 GB SAR 119 3 Months 0** 300
50 GB SAR 199 3 Months 3 500
200 GB SAR 299 3 Months 3 800
Unlimited SAR 349 3 Months N/A 1000
SAR 649 6 Months N/A 1500
SAR 1199 12 Months N/A 2000
Speed 4G Renewal Prices
Plan Price Validity Free On-net SMS
2 GB SAR 45 1 Month 100
5 GB SAR 69 1 Month 200
10 GB SAR 119 3 Months 300
50 GB SAR 199 3 Months 500
200 GB SAR 299 3 Months 800
Unlimited Plans Renewals Prices:
Plan Price Validity Free On-net SMS
Unlimited SAR 349 3 Months 1000
SAR 649 6 Months 1500
SAR 1199 12 Months 2000
*400 MBs, Pay As You Go 6 Halala/MB
**Up to 3 Multi-SIMs, SAR 10 per each Source: Company website, Al Rajhi Capital

Saudi Telecom Telecom – Industrial 21 June 2016
Disclosures Please refer to the important disclosures at the back of this report. 15
Income Statement (SARmn) 12/13A 12/14A 12/15A 12/16E 12/17E
Revenue 45,605 45,826 50,651 52,071 54,006
Access Charges (18,191) (17,670) (20,306) (21,866) (22,147)
Employee Costs - - - - -
Government Charges - - - - -
S.G. & A. Costs (8,943) (9,095) (11,051) (10,718) (11,369)
Repairs & Maintenance Costs (1,104) (399) - - -
Operating EBIT 10,989 11,632 11,859 11,981 12,954
Cash Operating Costs (28,238) (27,164) (31,357) (32,584) (33,516)
EBITDA 17,367 18,661 19,294 19,487 20,490
Depreciation and Amortisation (6,378) (7,030) (7,434) (7,506) (7,536)
Operating Profit 10,989 11,632 11,859 11,981 12,954
Net financing income/(costs) (1,083) (496) (1,023) (216) (70)
Forex and Related Gains
Provisions - - - - -
Other Income 243 390 446 533 558
Other Expenses 897 638 (797) (845) (594)
Net Profit Before Taxes 10,448 12,163 10,486 11,452 12,848
Taxes (230) (775) (697) (755) (824)
Minority Interests (321) (429) (531) (368) (410)
Net profit available to shareholders 9,897 10,959 9,258 10,329 11,615
Dividends (4,500) (7,000) (8,000) (8,500) (9,000)
Transfer to Capital Reserve
12/13A 12/14A 12/15A 12/16E 12/17E
Adjusted Shares Out (mn) 2,000 2,000 2,000 2,000 2,000
CFPS (SAR) 8.30 9.21 8.61 9.10 9.78
EPS (SAR) 4.95 5.48 4.63 5.16 5.81
DPS (SAR) 2.250 3.500 4.000 4.250 4.500
Growth 12/13A 12/14A 12/15A 12/16E 12/17E
Revenue Growth 1.9% 0.5% 10.5% 2.8% 3.7%
EBITDA Growth 8.0% 7.5% 3.4% 1.0% 5.1%
Operating Profit Growth 12.8% 5.9% 2.0% 1.0% 8.1%
Net Profit Growth 38.2% 10.7% -15.5% 11.6% 12.5%
EPS Growth 38.2% 10.7% -15.5% 11.6% 12.5%
Margins 12/13A 12/14A 12/15A 12/16E 12/17E
EBITDA margin 38.1% 40.7% 38.1% 37.4% 37.9%
Operating Margin 24.1% 25.4% 23.4% 23.0% 24.0%
Pretax profit margin 22.9% 26.5% 20.7% 22.0% 23.8%
Net profit margin 21.7% 23.9% 18.3% 19.8% 21.5%
Other Ratios 12/13A 12/14A 12/15A 12/16E 12/17E
ROCE 16.2% 15.5% 16.0% 15.7% 16.3%
ROIC 32.2% 31.4% 30.9% 33.0% 34.6%
ROE 18.9% 18.7% 15.2% 16.8% 18.3%
Effective Tax Rate 2.2% 6.4% 6.6% 6.6% 6.4%
Capex/Sales 16.3% 13.3% 18.3% 18.0% 18.0%
Dividend Payout Ratio 45.5% 63.9% 86.4% 82.3% 77.5%
Valuation Measures 12/13A 12/14A 12/15A 12/16E 12/17E
P/E (x) 12.9 11.6 13.8 12.4 11.0
P/CF (x) 7.7 6.9 7.4 7.0 6.5
P/B (x) 2.3 2.1 2.1 2.0 2.0
EV/Sales (x) 2.4 2.4 2.1 2.0 1.9
EV/EBITDA (x) 6.3 5.8 5.6 5.4 5.1
EV/EBIT (x) 9.9 9.4 9.0 8.9 8.1
EV/IC (x) 3.1 3.0 3.2 3.0 2.9
Dividend Yield 3.5% 5.5% 6.3% 6.7% 7.0% Source: Company data, Al Rajhi Capital

Saudi Telecom Telecom – Industrial 21 June 2016
Disclosures Please refer to the important disclosures at the back of this report. 16
Balance Sheet (SARmn) 12/13A 12/14A 12/15A 12/16E 12/17E
Cash and Cash Equivalents 960 5,467 4,504 5,536 7,279
Current Receivables 24,509 22,862 28,598 29,140 29,189
Inventories - - - - -
Other current assets 23,531 17,863 20,689 20,726 20,873
Total Current Assets 32,171 31,845 36,989 38,600 40,539
Fixed Assets 38,402 38,229 40,488 43,006 45,819
Investments 12,189 16,273 14,402 14,449 14,478
Goodwill
Other Intangible Assets 4,608 4,523 4,783 4,197 3,652
Total Other Assets - - - - -
Total Non-current Assets 55,199 59,024 59,672 61,652 63,949
Total Assets 87,370 90,869 96,661 100,252 104,488
Short Term Debt 1,561 1,997 1,903 1,903 1,903
Trade Payables 10,171 9,856 15,949 16,786 17,501
Dividends Payable
Other Current Liabilities 7,929 4,189 4,862 5,096 5,378
Total Current Liabilities 19,660 16,043 22,714 23,786 24,783
Long-Term Debt 6,976 7,785 5,744 5,744 5,744
Other LT Payables 4,570 4,937 6,240 6,573 6,932
Provisions - - - - -
Total Non-current Liabilities 11,547 12,722 11,984 12,317 12,676
Minority interests (67) 906 1,421 1,789 2,199
Paid-up share capital 20,000 20,000 20,000 20,000 20,000
Total Reserves 36,230 41,198 40,541 42,360 44,830
Total Shareholders' Equity 56,230 61,198 60,541 62,360 64,830
Total Equity 56,163 62,104 61,962 64,149 67,029
Total Liabilities & Shareholders' Equity 87,370 90,869 96,661 100,252 104,488
Ratios 12/13A 12/14A 12/15A 12/16E 12/17E
Net Debt (SARmn) (9,252) (10,032) (13,659) (14,691) (16,434)
Net Debt/EBITDA (x) (0.53) (0.54) (0.71) (0.75) (0.80)
Net Debt to Equity -16.5% -16.2% -22.0% -22.9% -24.5%
EBITDA Interest Cover (x) 16.0 37.7 18.9 90.1 291.8
BVPS (SAR) 28.11 30.60 30.27 31.18 32.42
Cashflow Statement (SARmn) 12/13A 12/14A 12/15A 12/16E 12/17E
Net Income before Tax & Minority Interest 10,448 12,163 10,486 11,452 12,848
Depreciation & Amortisation 6,378 7,030 7,434 7,506 7,536
Decrease in Working Capital (1,339) (1,742) 835 492 801
Other Operating Cashflow 984 182 2,167 506 552
Cashflow from Operations 16,472 17,633 20,922 19,957 21,737
Capital Expenditure (7,428) (6,100) (9,248) (9,373) (9,721)
New Investments (182) (616) (1,100) (521) (540)
Others (91) 133 (1,388) - -
Cashflow from investing activities (7,700) (6,584) (11,737) (9,894) (10,261)
Net Operating Cashflow 8,771 11,050 9,185 10,064 11,476
Dividends paid to ordinary shareholders (3,998) (6,470) (8,019) (8,500) (9,000)
Proceeds from issue of shares - - - - -
Increase in Loans (368) 1,238 (1,763) - -
Effects of Exchange Rates on Cash - - - 144 (144)
Other Financing Cashflow (147) (155) (160) 291 44
Cashflow from financing activities (4,512) (5,387) (9,942) (8,065) (9,101)
Total cash generated 4,259 5,663 (757) 1,999 2,375
Cash at beginning of period 3,508 960 5,467 4,504 5,536
Implied cash at end of year 7,767 6,623 4,711 6,503 7,911
Ratios 12/13A 12/14A 12/15A 12/16E 12/17E
Capex/Sales 16.3% 13.3% 18.3% 18.0% 18.0% Source: Company data, Al Rajhi Capital

Saudi Telecom Telecom – Industrial 21 June 2016
Disclosures Please refer to the important disclosures at the back of this report. 17
IMPORTANT DISCLOSURES FOR U.S. PERSONS
This research report was prepared by Al Rajhi Capital (Al Rajhi), a company authorized to engage in securities activities in Saudi Arabia. Al Rajhi is not a registered broker-dealer in the United States and, therefore, is not subject to U.S. rules regarding the preparation of research reports and the independence of research analysts. This research report is provided for distribution to “major U.S. institutional investors” in reliance on the exemption from registration provided by Rule 15a-6 of the U.S. Securities Exchange Act of 1934, as amended (the “Exchange Act”).
Any U.S. recipient of this research report wishing to effect any transaction to buy or sell securities or related financial instruments based on the information provided in this research report should do so only through Rosenblatt Securities Inc, 20 Broad Street 26th Floor, New York NY 10005, a registered broker dealer in the United States. Under no circumstances should any recipient of this research report effect any transaction to buy or sell securities or related financial instruments through Al Rajhi. Rosenblatt Securities Inc. accepts responsibility for the contents of this research report, subject to the terms set out below, to the extent that it is delivered to a U.S. person other than a major U.S. institutional investor.
The analyst whose name appears in this research report is not registered or qualified as a research analyst with the Financial Industry Regulatory Authority (“FINRA”) and may not be an associated person of Rosenblatt Securities Inc. and, therefore, may not be subject to applicable restrictions under FINRA Rules on communications with a subject company, public appearances and trading securities held by a research analyst account.
Ownership and Material Conflicts of Interest
Rosenblatt Securities Inc. or its affiliates does not ‘beneficially own,’ as determined in accordance with Section 13(d) of the Exchange Act, 1% or more of any of the equity securities mentioned in the report. Rosenblatt Securities Inc, its affiliates and/or their respective officers, directors or employees may have interests, or long or short positions, and may at any time make purchases or sales as a principal or agent of the securities referred to herein. Rosenblatt Securities Inc. is not aware of any material conflict of interest as of the date of this publication.
Compensation and Investment Banking Activities
Rosenblatt Securities Inc. or any affiliate has not managed or co-managed a public offering of securities for the subject company in the past 12 months, nor received compensation for investment banking services from the subject company in the past 12 months, neither does it or any affiliate expect to receive, or intends to seek compensation for investment banking services from the subject company in the next 3 months.
Additional Disclosures
This research report is for distribution only under such circumstances as may be permitted by applicable law. This research report has no regard to the specific investment objectives, financial situation or particular needs of any specific recipient, even if sent only to a single recipient. This research report is not guaranteed to be a complete statement or summary of any securities, markets, reports or developments referred to in this research report. Neither Al Rajhi nor any of its directors, officers, employees or agents shall have any liability, however arising, for any error, inaccuracy or incompleteness of fact or opinion in this research report or lack of care in this research report’s preparation or publication, or any losses or damages which may arise from the use of this research report.
Al Rajhi may rely on information barriers, such as “Chinese Walls” to control the flow of information within the areas, units, divisions, groups, or affiliates of Al Rajhi.
Investing in any non-U.S. securities or related financial instruments (including ADRs) discussed in this research report may present certain risks. The securities of non-U.S. issuers may not be registered with, or be subject to the regulations of, the U.S. Securities and Exchange Commission. Information on such non-U.S. securities or related financial instruments may be limited. Foreign companies may not be subject to audit and reporting standards and regulatory requirements comparable to those in effect within the United States.
The value of any investment or income from any securities or related financial instruments discussed in this research report denominated in a currency other than U.S. dollars is subject to exchange rate fluctuations that may have a positive or adverse effect on the value of or income from such securities or related financial instruments.
Past performance is not necessarily a guide to future performance and no representation or warranty, express or implied, is made by Al Rajhi with respect to future performance. Income from investments may fluctuate. The price or value of the investments to which this research report relates, either directly or indirectly, may fall or rise against the interest of investors. Any recommendation or opinion contained in this research report may become outdated as a consequence of changes in the environment in which the issuer of the securities under analysis operates, in addition to changes in the estimates and forecasts, assumptions and valuation methodology used herein.
No part of the content of this research report may be copied, forwarded or duplicated in any form or by any means without the prior consent of Al Rajhi and Al Rajhi accepts no liability whatsoever for the actions of third parties in this respect. This research document has been prepared by Al Rajhi Capital Company (“Al Rajhi Capital”) of Riyadh, Saudi Arabia. It has been prepared for the general use o f Al Rajhi Capital’s clients and may not be redistributed, retransmitted or disclosed, in whole or in part, or in any form or manner, without the express written consent of Al Rajhi Capital. Receipt and review of this research document constitute your agreement not to redistribute, retransmit, or disclose to others the contents, opinions, conclusion, or information contained in this document prior to public disclosure of such information by Al Rajhi Capital. The information contained was obtained from various public sources believed to be reliable but we do not guarantee its accuracy. Al Rajhi Capital makes no representations or warranties (express or implied) regarding the data and information provided and Al Rajhi Capital does not represent that the information content of this document is complete, or free from any error, not misleading, or fit for any particular purpose. This research document provides general information only. Neither the information nor any opinion expressed constitutes an offer or an invitation to make an offer, to buy or sell any securities or other investment products related to such securities or investments. It is not intended to provide personal investment advice and it does not take into account the specific investment objectives, financial situation and the particular needs of any specific person who may receive this document.
Investors should seek financial, legal or tax advice regarding the appropriateness of investing in any securities, other investment or investment strategies discussed or recommended in this document and should understand that statements regarding future prospects may not be realized. Investors should note that income from such securities or other investments, if any, may fluctuate and that the price or value of such securities and investments may rise or fall. Fluctuations in exchange rates could have adverse effects on the value of or price of, or income derived from, certain investments. Accordingly, investors may receive back less than originally invested. Al Rajhi Capital or its officers or one or more of its affiliates (including research analysts) may have a financial interest in securities of the issuer(s) or related investments, including long or short positions in securities, warrants, futures, options, derivatives, or other financial instruments. Al Rajhi Capital or its affiliates may from time to time perform investment banking or other services for, solicit investment banking or other business from, any company mentioned in this research document. Al Rajhi Capital, together with its affiliates and employees, shall not be liable for any direct, indirect or consequential loss or damages that may arise, directly or indirectly, from any use of the information contained in this research document.
This research document and any recommendations contained are subject to change without prior notice. Al Rajhi Capital assumes no responsibility to update the information in this research document. Neither the whole nor any part of this research document may be altered, duplicated, transmitted or distributed in any form or by any means. This research document is not directed to, or intended for distribution to or use by, any person or entity who is a citizen or resident of or located in any locality, state, country or other jurisdiction where such distribution, publication, availability or use would be contrary to law or which would subject Al Rajhi Capital or any of its affiliates to any registration or licensing requirement within such jurisdiction.

Saudi Telecom Telecom – Industrial 21 June 2016
Disclosures Please refer to the important disclosures at the back of this report. 18
Disclaimer and additional disclosures for Equity Research
Disclaimer
This research document has been prepared by Al Rajhi Capital Company (“Al Rajhi Capital”) of Riyadh, Saudi Arabia. It has been prepared for the general use of Al Rajhi Capital’s clients and may not be redistributed, retransmitted or disclosed, in whole or in part, or in any form or manner, without the express written consent of Al Rajhi Capital. Receipt and review of this research document constitute your agreement not to redistribute, retransmit, or disclose to others the contents, opinions, conclusion, or information contained in this document prior to public disclosure of such information by Al Rajhi Capital. The information contained was obtained from various public sources believed to be reliable but we do not guarantee its accuracy. Al Rajhi Capital makes no representations or warranties (express or implied) regarding the data and information provided and Al Rajhi Capital does not represent that the information content of this document is complete, or free from any error, not misleading, or fit for any particular purpose. This research document provides general information only. Neither the information nor any opinion expressed constitutes an offer or an invitation to make an offer, to buy or sell any securities or other investment products related to such securities or investments. It is not intended to provide personal investment advice and it does not take into account the specific investment objectives, financial situation and the particular needs of any specific person who may receive this document.
Investors should seek financial, legal or tax advice regarding the appropriateness of investing in any securities, other investment or investment strategies discussed or recommended in this document and should understand that statements regarding future prospects may not be realized. Investors should note that income from such securities or other investments, if any, may fluctuate and that the price or value of such securities and investments may rise or fall. Fluctuations in exchange rates could have adverse effects on the value of or price of, or income derived from, certain investments. Accordingly, investors may receive back less than originally invested. Al Rajhi Capital or its officers or one or more of its affiliates (including research analysts) may have a financial interest in securities of the issuer(s) or related investments, including long or short positions in securities, warrants, futures, options, derivatives, or other financial instruments. Al Rajhi Capital or its affiliates may from time to time perform investment banking or other services for, solicit investment banking or other business from, any company mentioned in this research document. Al Rajhi Capital, together with its affiliates and employees, shall not be liable for any direct, indirect or consequential loss or damages that may arise, directly or indirectly, from any use of the information contained in this research document.
This research document and any recommendations contained are subject to change without prior notice. Al Rajhi Capital assumes no responsibility to update the information in this research document. Neither the whole nor any part of this research document may be altered, duplicated, transmitted or distributed in any form or by any means. This research document is not directed to, or intended for distribution to or use by, any person or entity who is a citizen or resident of or located in any locality, state, country or other jurisdiction where such distribution, publication, availability or use would be contrary to law or which would subject Al Rajhi Capital or any of its affiliates to any registration or licensing requirement within such jurisdiction.
Explanation of Al Rajhi Capital’s rating system Al Rajhi Capital uses a three-tier rating system based on absolute upside or downside potential for all stocks under its coverage except financial stocks and those few other companies not compliant with Islamic Shariah law: "Overweight": Our target price is more than 10% above the current share price, and we expect the share price to reach the target on a 12 month time horizon. "Neutral": We expect the share price to settle at a level between 10% below the current share price and 10% above the current share price on a 12 month time horizon. "Underweight": Our target price is more than 10% below the current share price, and we expect the share price to reach the target on a 12 month time horizon. "Target price": We estimate target value per share for every stock we cover. This is normally based on widely accepted methods appropriate to the stock or sector under consideration, e.g. DCF (discounted cash flow) or SoTP (sum of the parts) analysis. Please note that the achievement of any price target may be impeded by general market and economic trends and other external factors, or if a company’s profits or operating performance exceed or fall short of our expectations.
Contact us
Al Rajhi Capital Research Department Head Office, King Fahad Road P.O. Box 5561, Riyadh 11432 Kingdom of Saudi Arabia Email: [email protected] Al Rajhi Capital is licensed by the Saudi Arabian Capital Market Authority, License No. 07068/37.