Embed Size (px)
Citation preview
Tectonic evolution of the Pacific margin of Antarctica
1. Late Cretaceous tectonic reconstructions
Robert D. Larter, Alex P. Cunningham,1 and Peter F. BarkerBritish Antarctic Survey, Natural Environment Research Council, Cambridge, UK
Karsten Gohl and Frank O. Nitsche2
Alfred Wegener Institute for Polar and Marine Research, Bremerhaven, Germany
Received 10 November 2000; revised 11 April 2002; accepted 13 June 2002; published 13 December 2002.
[1] We present new Late Cretaceous tectonic reconstructions of the Pacific margin ofAntarctica based on constraints from marine magnetic data and regional free-air gravityfields. Results from interpretation of new seismic reflection and gravity profiles collected inthe Bellingshausen Sea are also incorporated in the reconstructions. The reconstructionsshow regional constraints on tectonic evolution of the Bellingshausen and Amundsen Seasfollowing the breakup between New Zealand and West Antarctica. The breakup began at c.90 Ma with the separation of Chatham Rise, probably accompanied by the opening ofthe Bounty Trough. Campbell Plateau separated from West Antarctica later, during chron33r (83.0–79.1 Ma). A free-air gravity lineation northeast of Chatham Rise represents thetrace of a triple junction that formed as a result of fragmentation of the Phoenix plate a fewmillion years before Chatham Rise separated from West Antarctica. Remnants of thewestern fragment, the Charcot plate, are preserved in the Bellingshausen Sea. Subductionof the Charcot plate stopped before 83 Ma, and part of it became coupled to the AntarcticPeninsula across the stalled subduction zone. Subsequent convergence at the westernmargin of this captured ocean floor produced the structures that are the main cause of theBellingshausen gravity anomaly. Part of a spreading ridge at the western boundary ofthe Phoenix plate (initially Charcot–Phoenix, evolving into Marie Byrd Land–Phoenix,and eventually Bellingshausen–Phoenix (BEL–PHO)) probably subducted obliquelybeneath the southern Antarctic Peninsula during the Late Cretaceous. All of the Phoenixplate ocean floor subducted at the Antarctic Peninsula margin during the Late Cretaceouswas probably <14 Myr old when it reached the trench. Several observations suggest thatindependent Bellingshausen plate motion began near the end of chron 33n (73.6 Ma).Reconstructions in which part of the West Antarctic continental margin, including ThurstonIsland, is assumed to have been within the Bellingshausen plate seem more plausible thanones in which the plate is assumed to have been entirely oceanic. INDEX TERMS: 8157
Tectonophysics: Evolution of the Earth: Plate motions—past (3040); 9310 Information Related to Geographic
Region: Antarctica; 9609 Information Related to Geologic Time: Mesozoic; KEYWORDS: Pacific, New Zealand,
Bellingshausen Sea, Cretaceous, gravity, magnetic anomaly
Citation: Larter, R. D., A. P. Cunningham, P. F. Barker, K. Gohl, and F. O. Nitsche, Tectonic evolution of the Pacific margin of
Antarctica, 1, Late Cretaceous tectonic reconstructions, J. Geophys. Res., 107(B12), 2345, doi:10.1029/2000JB000052, 2002.
1. Introduction
[2] The part of the Antarctic continental margin in themiddle of the sector facing the Pacific Ocean is the mostpoorly studied, due to its remoteness and inaccessibility.However, the tectonic evolution of this sector of themargin, which lies in the Amundsen and Bellingshausen
Seas (Figure 1), is important in several respects. It isarguably the most important sector to study in order toimprove understanding of the Cretaceous–Tertiary devel-opment of the Antarctic plate [Stock and Molnar, 1987;Mayes et al., 1990; McCarron and Larter, 1998; Heine-mann et al., 1999]. It also has potential to yield valuableinsights into relationships between continental breakupprocesses and subduction dynamics [Bradshaw, 1989;Luyendyk, 1995; Storey et al., 1999]. Furthermore, clar-ification of the complex plate tectonic evolution of thisregion is critical to reducing uncertainties in global platecircuit calculations linking the history of relative motionsof the oceanic plates of the Pacific basin with the rest of
JOURNAL OF GEOPHYSICAL RESEARCH, VOL. 107, NO. B12, 2345, doi:10.1029/2000JB000052, 2002
1Now at ARK CLS Limited, Milton Keynes, UK.2Now at Lamont-Doherty Earth Observatory of Columbia University,
Palisades, New York, USA.
Copyright 2002 by the American Geophysical Union.0148-0227/02/2000JB000052$09.00
EPM 5 - 1

the world [Pitman et al., 1968; Molnar et al., 1975; Candeet al., 1995, 2000].
1.1. Tectonic Reconstructions of the Pacific Marginof Antarctica
[3] Previous reconstructions have attempted to describethe tectonic evolution of the Pacific margin of Antarcticasince the separation of New Zealand from West Antarctica[Molnar et al., 1975; Herron and Tucholke, 1976;Weissel etal., 1977; Cande et al., 1982; Stock and Molnar, 1987;Mayes et al., 1990; McCarron and Larter, 1998]. However,the Late Cretaceous finite rotations on which these recon-structions were based were poorly constrained because:(a)
few magnetic profiles were available from the Bellingshau-sen and Amundsen Seas, (b) the ages of the oldest magneticanomalies adjacent to Campbell Plateau (Figure 2a) wereuncertain, and (c) the precise shape and position of the WestAntarctic continental margin was poorly known. RecentlyStock et al. [1996] (see also Stock et al., Updated history ofthe Bellingshausen plate, submitted to Geology, 1997, here-inafter referred to as Stock et al., submitted manuscript,1997) have calculated new finite rotations for various timesbetween chron 27 (61.1 Ma) and the young end of chron 33(73.6 Ma) using new magnetic data from the AmundsenSea. Furthermore, a consensus has emerged that the oldestocean crust off Campbell Plateau formed during chron 33r
Figure 1. Late Cretaceous–early Tertiary reconstructions of the South Pacific in the Antarcticreference frame [after McCarron and Larter, 1998]. BELL, Bellingshausen plate; CR, Chatham Rise;NR, new ridge segment formed by propagation of the Pacific–Antarctic ridge to the Pacific–Farallonridge at c. 47 Ma; AI, Alexander Island; TI, Thurston Island. Question marks indicate areas where theposition and nature of plate boundaries are uncertain. Figure reproduced by permission of the GeologicalSociety of London.
EPM 5 - 2 LARTER ET AL.: LATE CRETACEOUS RECONSTRUCTIONS OF THE PACIFIC MARGIN

Figure 2. (a) Digitised gravity lineations (bold black lines) and magnetic anomaly picks (open squares)in the western Pacific overlaid on shaded-relief display (illuminated from northeast) of free-air gravityanomalies derived from satellite altimetry data [Sandwell and Smith, 1997]. Plotted on polarstereographic projection. CR, Chatham Rise; BT, Bounty Trough; CP, Campbell Plateau; BS, BollonsSeamount; LR, Louisville Ridge; AFZ, Antipodes Fracture Zone; UFZ Udintsev Fracture Zone; TFZ,Tharp Fracture Zone; OT, Osboum Trough; X, Y and Z, gravity lineations on Pacific Ocean floor formedduring the Cretaceous Normal Superchron. (b) Digitised gravity lineations (bold black lines) andmagnetic anomaly picks (open squares) in the Bellingshausen Sea overlaid on shaded-relief display(illuminated from northeast) of free-air gravity anomalies derived from satellite altimetry data [McAdooand Laxon, 1997]. Plotted on polar stereographic projection. Abbreviations as for (a), plus HFZ, HeezenFracture Zone; BGA, Bellingshausen gravity anomaly; DGGA, De Gerlache gravity anomaly; PGA,Peacock gravity anomaly; N, Noville gravity lineation; TI, Thurston Island; PII, Peter I Island; MBL,Marie Byrd Land; EL, Ellsworth Land.
LARTER ET AL.: LATE CRETACEOUS RECONSTRUCTIONS OF THE PACIFIC MARGIN EPM 5 - 3
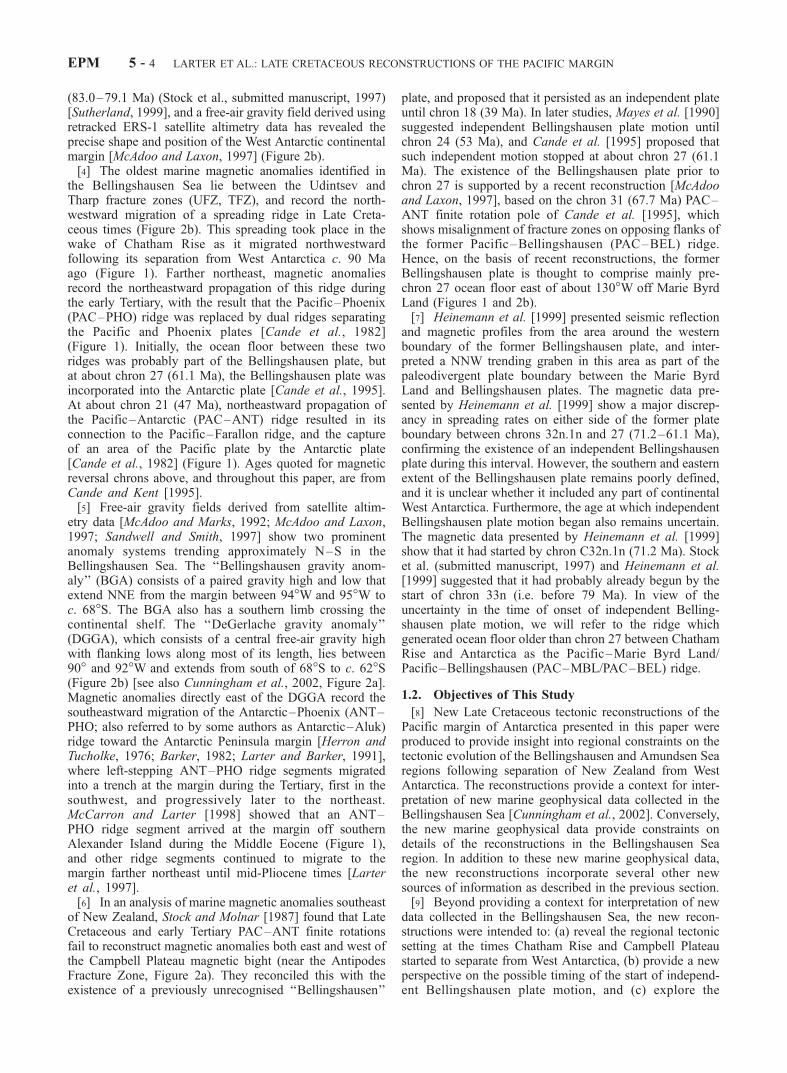
(83.0–79.1 Ma) (Stock et al., submitted manuscript, 1997)[Sutherland, 1999], and a free-air gravity field derived usingretracked ERS-1 satellite altimetry data has revealed theprecise shape and position of the West Antarctic continentalmargin [McAdoo and Laxon, 1997] (Figure 2b).[4] The oldest marine magnetic anomalies identified in
the Bellingshausen Sea lie between the Udintsev andTharp fracture zones (UFZ, TFZ), and record the north-westward migration of a spreading ridge in Late Creta-ceous times (Figure 2b). This spreading took place in thewake of Chatham Rise as it migrated northwestwardfollowing its separation from West Antarctica c. 90 Maago (Figure 1). Farther northeast, magnetic anomaliesrecord the northeastward propagation of this ridge duringthe early Tertiary, with the result that the Pacific–Phoenix(PAC–PHO) ridge was replaced by dual ridges separatingthe Pacific and Phoenix plates [Cande et al., 1982](Figure 1). Initially, the ocean floor between these tworidges was probably part of the Bellingshausen plate, butat about chron 27 (61.1 Ma), the Bellingshausen plate wasincorporated into the Antarctic plate [Cande et al., 1995].At about chron 21 (47 Ma), northeastward propagation ofthe Pacific–Antarctic (PAC–ANT) ridge resulted in itsconnection to the Pacific–Farallon ridge, and the captureof an area of the Pacific plate by the Antarctic plate[Cande et al., 1982] (Figure 1). Ages quoted for magneticreversal chrons above, and throughout this paper, are fromCande and Kent [1995].[5] Free-air gravity fields derived from satellite altim-
etry data [McAdoo and Marks, 1992; McAdoo and Laxon,1997; Sandwell and Smith, 1997] show two prominentanomaly systems trending approximately N–S in theBellingshausen Sea. The ‘‘Bellingshausen gravity anom-aly’’ (BGA) consists of a paired gravity high and low thatextend NNE from the margin between 94�W and 95�W toc. 68�S. The BGA also has a southern limb crossing thecontinental shelf. The ‘‘DeGerlache gravity anomaly’’(DGGA), which consists of a central free-air gravity highwith flanking lows along most of its length, lies between90� and 92�W and extends from south of 68�S to c. 62�S(Figure 2b) [see also Cunningham et al., 2002, Figure 2a].Magnetic anomalies directly east of the DGGA record thesoutheastward migration of the Antarctic–Phoenix (ANT–PHO; also referred to by some authors as Antarctic–Aluk)ridge toward the Antarctic Peninsula margin [Herron andTucholke, 1976; Barker, 1982; Larter and Barker, 1991],where left-stepping ANT–PHO ridge segments migratedinto a trench at the margin during the Tertiary, first in thesouthwest, and progressively later to the northeast.McCarron and Larter [1998] showed that an ANT–PHO ridge segment arrived at the margin off southernAlexander Island during the Middle Eocene (Figure 1),and other ridge segments continued to migrate to themargin farther northeast until mid-Pliocene times [Larteret al., 1997].[6] In an analysis of marine magnetic anomalies southeast
of New Zealand, Stock and Molnar [1987] found that LateCretaceous and early Tertiary PAC–ANT finite rotationsfail to reconstruct magnetic anomalies both east and west ofthe Campbell Plateau magnetic bight (near the AntipodesFracture Zone, Figure 2a). They reconciled this with theexistence of a previously unrecognised ‘‘Bellingshausen’’
plate, and proposed that it persisted as an independent plateuntil chron 18 (39 Ma). In later studies, Mayes et al. [1990]suggested independent Bellingshausen plate motion untilchron 24 (53 Ma), and Cande et al. [1995] proposed thatsuch independent motion stopped at about chron 27 (61.1Ma). The existence of the Bellingshausen plate prior tochron 27 is supported by a recent reconstruction [McAdooand Laxon, 1997], based on the chron 31 (67.7 Ma) PAC–ANT finite rotation pole of Cande et al. [1995], whichshows misalignment of fracture zones on opposing flanks ofthe former Pacific–Bellingshausen (PAC–BEL) ridge.Hence, on the basis of recent reconstructions, the formerBellingshausen plate is thought to comprise mainly pre-chron 27 ocean floor east of about 130�W off Marie ByrdLand (Figures 1 and 2b).[7] Heinemann et al. [1999] presented seismic reflection
and magnetic profiles from the area around the westernboundary of the former Bellingshausen plate, and inter-preted a NNW trending graben in this area as part of thepaleodivergent plate boundary between the Marie ByrdLand and Bellingshausen plates. The magnetic data pre-sented by Heinemann et al. [1999] show a major discrep-ancy in spreading rates on either side of the former plateboundary between chrons 32n.1n and 27 (71.2–61.1 Ma),confirming the existence of an independent Bellingshausenplate during this interval. However, the southern and easternextent of the Bellingshausen plate remains poorly defined,and it is unclear whether it included any part of continentalWest Antarctica. Furthermore, the age at which independentBellingshausen plate motion began also remains uncertain.The magnetic data presented by Heinemann et al. [1999]show that it had started by chron C32n.1n (71.2 Ma). Stocket al. (submitted manuscript, 1997) and Heinemann et al.[1999] suggested that it had probably already begun by thestart of chron 33n (i.e. before 79 Ma). In view of theuncertainty in the time of onset of independent Belling-shausen plate motion, we will refer to the ridge whichgenerated ocean floor older than chron 27 between ChathamRise and Antarctica as the Pacific–Marie Byrd Land/Pacific–Bellingshausen (PAC–MBL/PAC–BEL) ridge.
1.2. Objectives of This Study
[8] New Late Cretaceous tectonic reconstructions of thePacific margin of Antarctica presented in this paper wereproduced to provide insight into regional constraints on thetectonic evolution of the Bellingshausen and Amundsen Searegions following separation of New Zealand from WestAntarctica. The reconstructions provide a context for inter-pretation of new marine geophysical data collected in theBellingshausen Sea [Cunningham et al., 2002]. Conversely,the new marine geophysical data provide constraints ondetails of the reconstructions in the Bellingshausen Searegion. In addition to these new marine geophysical data,the new reconstructions incorporate several other newsources of information as described in the previous section.[9] Beyond providing a context for interpretation of new
data collected in the Bellingshausen Sea, the new recon-structions were intended to: (a) reveal the regional tectonicsetting at the times Chatham Rise and Campbell Plateaustarted to separate from West Antarctica, (b) provide a newperspective on the possible timing of the start of independ-ent Bellingshausen plate motion, and (c) explore the
EPM 5 - 4 LARTER ET AL.: LATE CRETACEOUS RECONSTRUCTIONS OF THE PACIFIC MARGIN

regional tectonic constraints on the position and nature ofthe southern boundary of the Bellingshausen plate.
2. Data Used in Reconstructions
2.1. Gravity Data
[10] The margins of Chatham Rise, Campbell Plateau andBollons Seamount are sharply defined in the free-air gravityfield derived from satellite altimetry data by Sandwell andSmith [1997] (Figure 2a). The gravity field also shows thetraces of the UFZ, TFZ and other fracture zones, providingimportant constraints on reconstructions between the west-ern Pacific and Bellingshausen Sea regions. The old end ofthe UFZ can be traced close to the tip of Chatham Rise.North and east of Chatham Rise there are three prominentgravity lineations which we refer to as X, Y and Z (Figure2a). The northeastern end of X appears to be truncated by Y,and these two features have been referred to collectively asthe Wishbone Scarp [Billen and Stock, 2000; Sutherlandand Hollis, 2001]. Lineation Y continues northward toabout 26�S, where it meets the E–W trending OsbournTrough (Figure 2a).[11] The Osbourn Trough has recently been shown to be
an abandoned spreading center [Billen and Stock, 2000]. Onthe basis of models of magnetic profiles across the OsbournTrough, Billen and Stock [2000] proposed that it hadcontinued spreading at a full rate of 5 cm/yr until either82 Ma or 71 Ma. However, despite these magnetic models,regional tectonic constraints suggest to us that the OsbournTrough is unlikely to have continued spreading after sub-duction ceased along the New Zealand sector of the Ant-arctic margin at about 105 Ma [Bradshaw, 1989]. TheOsbourn Trough could only have continued spreading aftersubduction stopped if the Pacific plate was migrating awayfrom Antarctica. Paleomagnetic data do indicate that thePacific plate was moving northward between 105 and 90Ma at a rate in the range 20–40 km/Ma [Larson et al.,1992]. However, an apparent polar wander path for EastAntarctica suggests that Antarctica was moving toward thewestern Pacific at a rate at least as fast during the sameinterval [DiVenere et al., 1994], making PAC–ANT spread-ing unlikely at this time. Thus we treat the Osbourn Troughas a dead ridge in our Late Cretaceous reconstructions.[12] A prominent feature in the southwestern Pacific
gravity field is the Louisville Ridge (Figure 2a). This is aseamount chain formed by northwestward migration of thePacific plate across a hot spot since about 70 Ma [Lonsdale,1988; Watts et al., 1988].[13] The West Antarctic continental margin is sharply
defined in the free-air gravity field derived from retrackedERS-1 satellite altimetry data byMcAdoo and Laxon [1997](Figure 2b). This gravity field also shows the traces of theUFZ, TFZ, and other fracture zones, although they cannotbe traced close to the Antarctic margin. This is probably aconsequence of the thick and unevenly distributed sedi-ments on the West Antarctic continental rise [Nitsche et al.,2000].[14] In addition to the BGA and DGGA (see section 1.1),
gravity data also show two anomalies on the West Antarcticcontinental shelf described here as the ‘‘Noville gravity li-neation’’ (NGL) and the ‘‘Peacock gravity anomaly’’(PGA). The NGL consists of an elongated gravity high
which extends 50 km northwest from Noville Peninsula,Thurston Island, and its projection to the continental mar-gin, where it coincides with an offset in the margin near103�W (labeled ‘‘N’’ in Figure 2b). Farther west, the PGAconsists of a broad gravity high which emerges from thewestern end of Peacock Sound (between Thurston Islandand the mainland), and trends WNW to reach the margin atabout 113�W (Figure 2b) [see also Cunningham et al.,2002, Figure 2a].
2.2. Marine Magnetic Data
[15] We have examined marine magnetic profiles fromboth the region east of Chatham Rise and the Bellingshau-sen Sea (Figures 3–6). After removal of the InternationalGeomagnetic Reference Field [Barton, 1996] profiles wereplotted along ship tracks, and positions of anomaly 30r(67.7 Ma), the young edge of anomaly 33 (33y; 73.6 Ma),and the young edge of anomaly 34 (34y; 83 Ma) werepicked for inclusion in reconstructions. Selected profileswere projected onto lines parallel to fracture zone trends andcompared to synthetic magnetic anomaly profiles to deter-mine Late Cretaceous seafloor spreading rates (Figures 4and 6).[16] Magnetic profiles for the area east of Chatham Rise
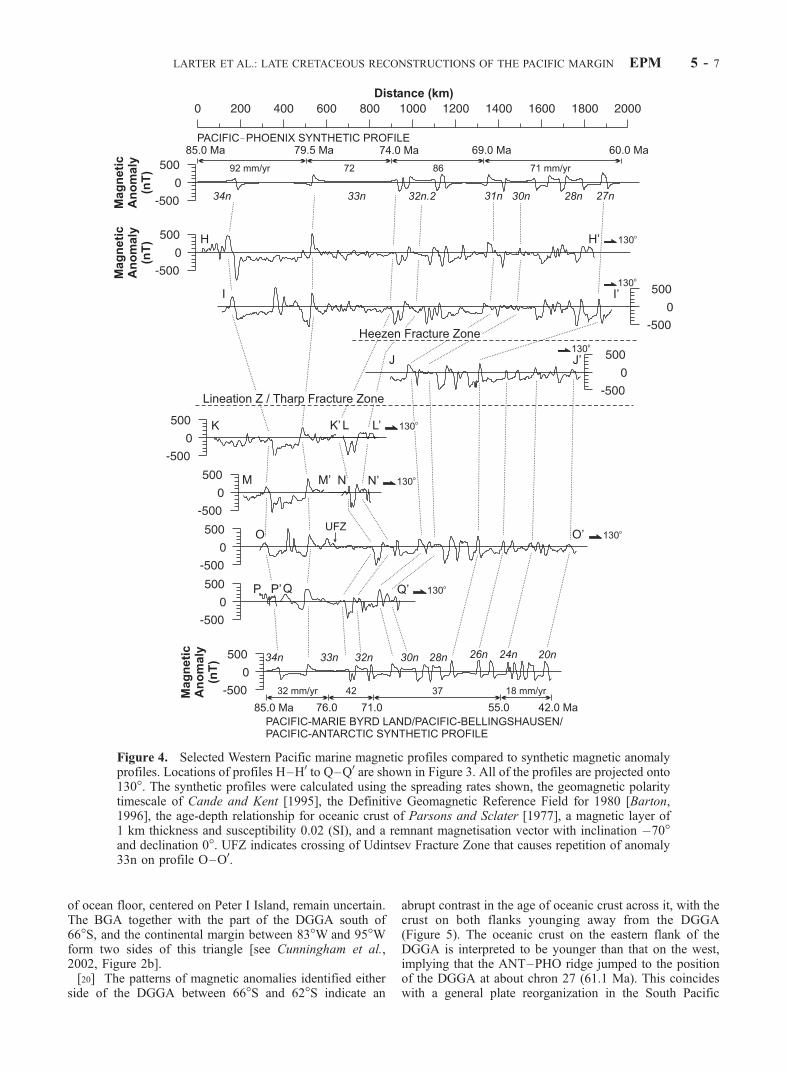
were extracted from the GEODAS database [National Geo-physical Data Center, 1996]. Selected profiles, togetherwith magnetic anomaly picks included in our reconstruc-tions, are shown overlaid on the regional free-air gravityfield in Figure 3. In selecting profiles we gave priority tothose most closely aligned with fracture zone trends. Bothfor this region and the Bellingshausen Sea our reconstruc-tions include some picks for anomalies 30r and 33y in thearea west of the UFZ from Stock et al. (submitted manu-script, 1997). The patterns of anomalies identified inFigure 3 show that there was a large difference in half-spreading rate either side of gravity lineation Z betweenchrons 34y and 33y. This suggests that lineation Z repre-sents the trace of a triple junction. After chron 32 theboundary between the two spreading regimes stepped east-ward to the Heezen Fracture Zone (HFZ), but the separationbetween anomalies 33y and 32n.2n on profile L–L0 suggeststhat the boundary first stepped westward temporarily beforestepping eastward (Figures 3 and 4). The projected profilesin Figure 4 show that the half-spreading rates on the twospreading systems differed by about a factor of two through-out the period from chron 34 to chron 27. The very fastspreading to the east of lineation Z and the HFZ occurred atthe Pacific–Phoenix (PAC–PHO) ridge [Weissel et al.,1977; Cande et al., 1982], while the slower spreading tothe west occurred at the ridge that formed when ChathamRise separated from West Antarctica.[17] On the basis of interpretation of radiolarians in
sediment from near the base of DSDP Hole 595A (about200 km north of the eastern end of the Osbourn Trough) asEarly Cretaceous in age, and paleomagnetic data suggestingthat the basalt basement at Site 595 formed at a paleolati-tude of 63�S, Sutherland and Hollis [2001] proposed that anadditional spreading ridge existed south of the PAC–PHOridge in Early Cretaceous time. If Sutherland and Hollis[2001] are correct then it would have been this ridge,between the Phoenix plate and a previously unrecognisedsouthern plate they named the Moa plate, which subse-
LARTER ET AL.: LATE CRETACEOUS RECONSTRUCTIONS OF THE PACIFIC MARGIN EPM 5 - 5

quently produced the ocean crust now lying east of lineationZ during the Late Cretaceous. However, no M series (EarlyCretaceous) marine magnetic lineations have been identifiednear Site 595. Moreover, if PAC–PHO spreading continuedthrough the Cretaceous Normal Superchron (CNS, 118–83Ma) at similar half rates to those measured before (77 mm/yr) [Larson, 1997] and after the CNS (92 mm/yr, Figure 4)then spreading on the northern flank of the ridge wouldaccount for the amount of ocean floor lacking magneticlineations that exists between the Manihiki Plateau (8�–14�S, 161�–164�W) and anomaly 34y east of lineation Z.Unless or until additional evidence is found to support themodel of Sutherland and Hollis [2001] we prefer the simpleexplanation that this area of ocean crust was produced by asingle, fast spreading ridge, and hence we refer to the plateto the south of this ridge as the Phoenix plate.[18] Four profiles show a positive anomaly about 200 km
southeast of the eastern part of Chatham Rise which weinterpret as anomaly 34y. Contrary to some earlier inter-pretations [e.g., Mayes et al., 1990], anomaly 34y is nowthought to be absent adjacent to Campbell Plateau [Stock etal., 1996; Sutherland, 1999], so if our interpretation iscorrect it implies Chatham Rise separated from Marie ByrdLand before Campbell Plateau. Two profiles close to the
UFZ and the two small fracture zones northeast of it showthat a change in the fracture zone trends occurs close toanomaly 33y.[19] New magnetic profiles collected in the Bellingshau-
sen Sea by the British Antarctic Survey and the AlfredWegener Institute were compiled with profiles from earliercruises in the region [Herron and Tucholke, 1976; Kimura,1982; Larter and Barker, 1991; National Geophysical DataCenter, 1996]. Selected profiles, together with magneticanomaly picks included in our reconstructions, are shownoverlaid on the regional free-air gravity field in Figure 5.Once again, in selecting profiles we gave priority to thosemost closely aligned with fracture zone trends. On our newprofiles we have identified two new anomaly 34y picks inthe area to the west of the BGA and DGGA (Figure 5),providing additional constraints on reconstructions for thistime. The patterns of anomalies identified reveal that theBGA and DGGA lie in an area that separates two distincttectonic provinces: anomalies to the west record the north-westward migration of the ridge that formed when ChathamRise separated from West Antarctica, whereas anomalies tothe east record the southeastward migration of the ANT–PHO ridge toward the Antarctic Peninsula since chron 27(61.1 Ma). However, the age and origin of a triangular area
Figure 3. Selected Western Pacific marine magnetic profiles plotted along ship tracks and overlaid onshaded-relief display (illuminated from northeast) of the free-air gravity field derived by Sandwell andSmith [1997]. Plotted on polar stereographic projection. All profiles shown are from the GEODASdatabase [National Geophysical Data Center, 1996], and are residual magnetic anomalies followingremoval of the International Geomagnetic Reference Field. Profiles labeled H–H0 to Q–Q0 are comparedto synthetic magnetic anomaly profiles in Figure 4. Anomalies on all profiles are projected in a direction60� clockwise from the top of the page. Positive anomalies are filled in black. Magnetic anomaly labelsconform to the geomagnetic polarity timescale nomenclature used by Cande and Kent [1995], with‘‘(y)’’ or ‘‘(o)’’ appended to some labels to indicate the young and old edges of broad anomalies. Whitecircles are anomaly picks shown in Figures 2, 7, and 8. Dashed lines are interpreted positions of fracturezones and other gravity lineations (i.e. lineations X, Y and Z).
EPM 5 - 6 LARTER ET AL.: LATE CRETACEOUS RECONSTRUCTIONS OF THE PACIFIC MARGIN
of ocean floor, centered on Peter I Island, remain uncertain.The BGA together with the part of the DGGA south of66�S, and the continental margin between 83�W and 95�Wform two sides of this triangle [see Cunningham et al.,2002, Figure 2b].[20] The patterns of magnetic anomalies identified either
side of the DGGA between 66�S and 62�S indicate an
abrupt contrast in the age of oceanic crust across it, with thecrust on both flanks younging away from the DGGA(Figure 5). The oceanic crust on the eastern flank of theDGGA is interpreted to be younger than that on the west,implying that the ANT–PHO ridge jumped to the positionof the DGGA at about chron 27 (61.1 Ma). This coincideswith a general plate reorganization in the South Pacific
Figure 4. Selected Western Pacific marine magnetic profiles compared to synthetic magnetic anomalyprofiles. Locations of profiles H–H0 to Q–Q0 are shown in Figure 3. All of the profiles are projected onto130�. The synthetic profiles were calculated using the spreading rates shown, the geomagnetic polaritytimescale of Cande and Kent [1995], the Definitive Geomagnetic Reference Field for 1980 [Barton,1996], the age-depth relationship for oceanic crust of Parsons and Sclater [1977], a magnetic layer of1 km thickness and susceptibility 0.02 (SI), and a remnant magnetisation vector with inclination �70�and declination 0�. UFZ indicates crossing of Udintsev Fracture Zone that causes repetition of anomaly33n on profile O–O0.
LARTER ET AL.: LATE CRETACEOUS RECONSTRUCTIONS OF THE PACIFIC MARGIN EPM 5 - 7

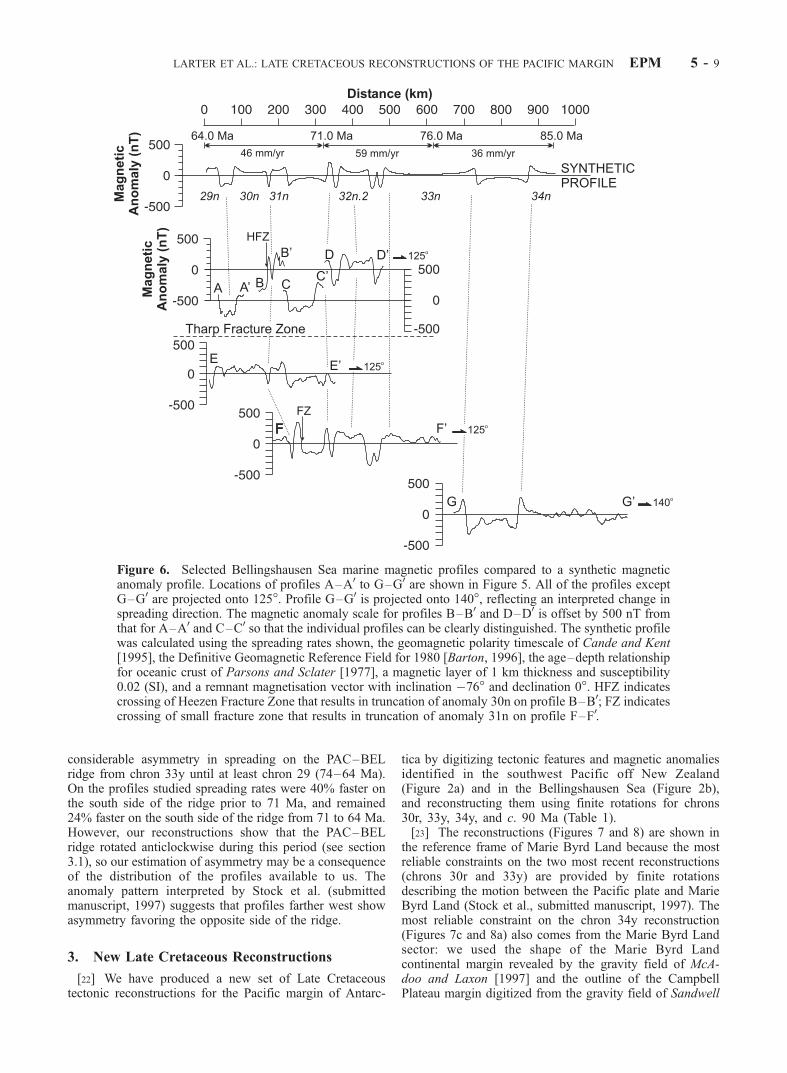
which included the incorporation of the Bellingshausenplate into the Antarctic plate. Recognition of the abruptcontrast in ocean floor age across the northern part of theDGGA is a consequence of our reinterpretation of magneticanomalies between the TFZ and HFZ to the west of theDGGA. We interpret these anomalies as a sequence young-ing to the northwest, starting from anomaly 32n.2n adjacentto the DGGA (profiles A–A0 to D–D0 in Figures 5 and 6).Previously Cande et al. [1982] interpreted the anomaly weidentify as 32n.1n as anomaly 29n, and the anomaly we
identify as 32n.2n as anomaly 28n, which suggested thatANT–PHO spreading had started earlier and farther west.This interpretation was adopted by McCarron and Larter[1998]. The continuity of the TFZ and HFZ to the west ofthe DGGA, and the absence of any major features in thegravity field between these two fracture zones, support ournew interpretation.[21] Comparison of magnetic anomaly profiles projected
parallel to fracture zone trends with synthetic magneticanomaly profiles (Figures 4 and 6) suggests that there was
Figure 5. Selected Bellingshausen Sea marine magnetic profiles plotted along ship tracks and overlaidon shaded-relief display (illuminated from northeast) of the free-air gravity fields derived by Sandwell andSmith [1997] (north of 70�S) and McAdoo and Laxon [1997] (south of 70�S). Plotted on polarstereographic projection. New profiles collected by the British Antarctic Survey and the Alfred WegenerInstitute are shown together with other profiles from the GEODAS database [National Geophysical DataCenter, 1996], and one from Kimura [1982]. All profiles shown are residual magnetic anomaliesfollowing removal of the International Geomagnetic Reference Field. Profiles labeled A–A0 to G–G0 arecompared to a synthetic magnetic anomaly profile in Figure 6. Anomalies on most profiles are projected ina direction 60� clockwise from the top of the page. The exceptions are profiles E–E0, F–F0, and three othershort profiles near the northwest corner of the map, on which anomalies are projected in a direction 30�clockwise from the top of the page. Positive anomalies are filled in black. Magnetic anomaly labelsconform to the geomagnetic polarity timescale nomenclature used by Cande and Kent [1995], with ‘‘(y)’’or ‘‘(o)’’ appended to some labels to indicate the young and old edges of broad anomalies. White circlesare anomaly picks shown in Figures 2, 7, and 8. Dashed lines are interpreted fracture zone positions.BGA, Bellingshausen gravity anomaly; DGGA, De Gerlache gravity anomaly; PII, Peter I Island.
EPM 5 - 8 LARTER ET AL.: LATE CRETACEOUS RECONSTRUCTIONS OF THE PACIFIC MARGIN
considerable asymmetry in spreading on the PAC–BELridge from chron 33y until at least chron 29 (74–64 Ma).On the profiles studied spreading rates were 40% faster onthe south side of the ridge prior to 71 Ma, and remained24% faster on the south side of the ridge from 71 to 64 Ma.However, our reconstructions show that the PAC–BELridge rotated anticlockwise during this period (see section3.1), so our estimation of asymmetry may be a consequenceof the distribution of the profiles available to us. Theanomaly pattern interpreted by Stock et al. (submittedmanuscript, 1997) suggests that profiles farther west showasymmetry favoring the opposite side of the ridge.
3. New Late Cretaceous Reconstructions
[22] We have produced a new set of Late Cretaceoustectonic reconstructions for the Pacific margin of Antarc-
tica by digitizing tectonic features and magnetic anomaliesidentified in the southwest Pacific off New Zealand(Figure 2a) and in the Bellingshausen Sea (Figure 2b),and reconstructing them using finite rotations for chrons30r, 33y, 34y, and c. 90 Ma (Table 1).[23] The reconstructions (Figures 7 and 8) are shown in
the reference frame of Marie Byrd Land because the mostreliable constraints on the two most recent reconstructions(chrons 30r and 33y) are provided by finite rotationsdescribing the motion between the Pacific plate and MarieByrd Land (Stock et al., submitted manuscript, 1997). Themost reliable constraint on the chron 34y reconstruction(Figures 7c and 8a) also comes from the Marie Byrd Landsector: we used the shape of the Marie Byrd Landcontinental margin revealed by the gravity field of McA-doo and Laxon [1997] and the outline of the CampbellPlateau margin digitized from the gravity field of Sandwell
Figure 6. Selected Bellingshausen Sea marine magnetic profiles compared to a synthetic magneticanomaly profile. Locations of profiles A–A0 to G–G0 are shown in Figure 5. All of the profiles exceptG–G0 are projected onto 125�. Profile G–G0 is projected onto 140�, reflecting an interpreted change inspreading direction. The magnetic anomaly scale for profiles B–B0 and D–D0 is offset by 500 nT fromthat for A–A0 and C–C0 so that the individual profiles can be clearly distinguished. The synthetic profilewas calculated using the spreading rates shown, the geomagnetic polarity timescale of Cande and Kent[1995], the Definitive Geomagnetic Reference Field for 1980 [Barton, 1996], the age–depth relationshipfor oceanic crust of Parsons and Sclater [1977], a magnetic layer of 1 km thickness and susceptibility0.02 (SI), and a remnant magnetisation vector with inclination �76� and declination 0�. HFZ indicatescrossing of Heezen Fracture Zone that results in truncation of anomaly 30n on profile B–B0; FZ indicatescrossing of small fracture zone that results in truncation of anomaly 31n on profile F–F0.
LARTER ET AL.: LATE CRETACEOUS RECONSTRUCTIONS OF THE PACIFIC MARGIN EPM 5 - 9
and Smith [1997] to determine a new finite rotation for thefit of Campbell Plateau to Marie Byrd Land (no. 7 inTable 1; Figure 9), where breakup occurred shortly afterchron 34y [Stock et al., 1996; Sutherland, 1999].[24] Features digitized from the southwestern Pacific
gravity field (Figure 2a) and Bellingshausen Sea fracturezones and magnetic anomalies (Figure 2b) are shown inFigures 7 and 8 in their reconstructed positions. However, theBGA and DGGA are shown in their present-day positions. Inthe case of the BGA this is because we believe that thebasement structures associated with it formed as a result ofconvergence between the Marie Byrd Land (and subse-quently Bellingshausen) plate and another plate to its east
[Gohl et al., 1997; Cunningham et al., 2002]. In the case ofthe DGGA, we believe that the structures associated with itdeveloped more recently than the times represented by thereconstructions (see section 2.2), but have indicated itspresent position in the most recent reconstruction (Figure 7a).[25] The Antarctic continental margin, PGA and NGL are
shown in Figure 7 in their present-day positions, on theassumption that there has been no relative motion betweendifferent parts of West Antarctica since the time of theearliest reconstruction (c. 90 Ma), and that the Bellingshau-sen plate did not include any part of West Antarctica (i.e. thesouthern boundary of Bellingshausen plate was situatedalong the West Antarctic continental margin, or within
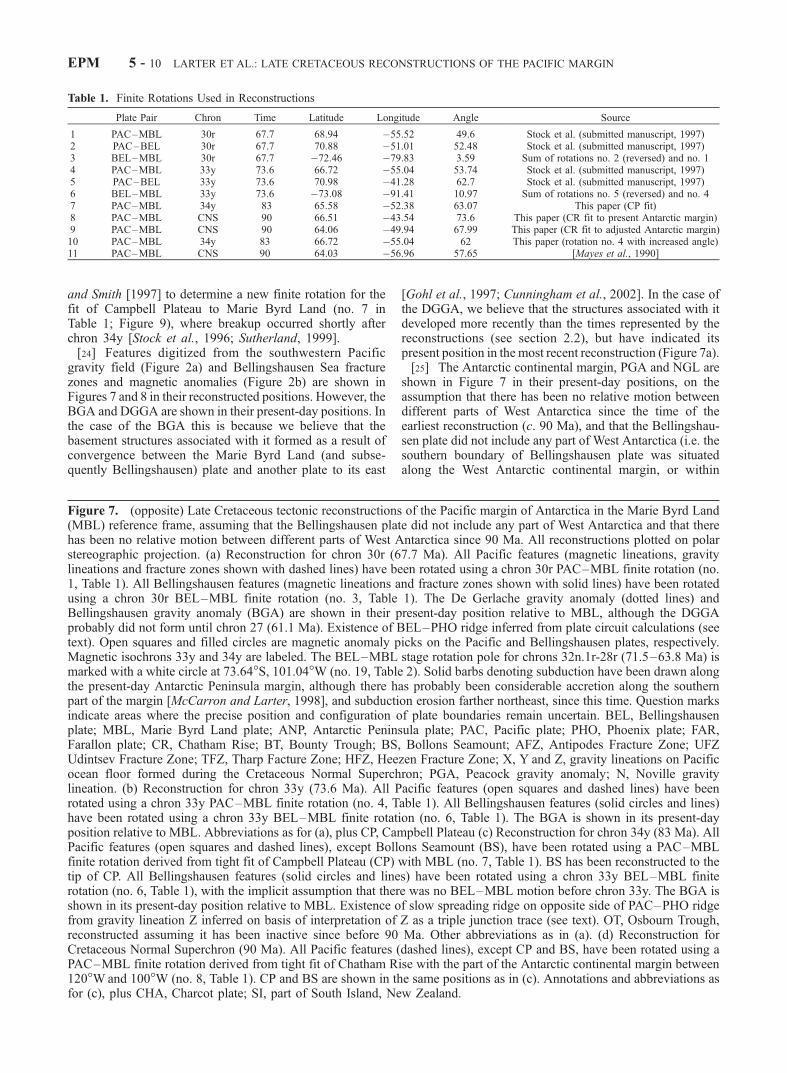
Table 1. Finite Rotations Used in Reconstructions
Plate Pair Chron Time Latitude Longitude Angle Source
1 PAC–MBL 30r 67.7 68.94 �55.52 49.6 Stock et al. (submitted manuscript, 1997)2 PAC–BEL 30r 67.7 70.88 �51.01 52.48 Stock et al. (submitted manuscript, 1997)3 BEL–MBL 30r 67.7 �72.46 �79.83 3.59 Sum of rotations no. 2 (reversed) and no. 14 PAC–MBL 33y 73.6 66.72 �55.04 53.74 Stock et al. (submitted manuscript, 1997)5 PAC–BEL 33y 73.6 70.98 �41.28 62.7 Stock et al. (submitted manuscript, 1997)6 BEL–MBL 33y 73.6 �73.08 �91.41 10.97 Sum of rotations no. 5 (reversed) and no. 47 PAC–MBL 34y 83 65.58 �52.38 63.07 This paper (CP fit)8 PAC–MBL CNS 90 66.51 �43.54 73.6 This paper (CR fit to present Antarctic margin)9 PAC–MBL CNS 90 64.06 �49.94 67.99 This paper (CR fit to adjusted Antarctic margin)10 PAC–MBL 34y 83 66.72 �55.04 62 This paper (rotation no. 4 with increased angle)11 PAC–MBL CNS 90 64.03 �56.96 57.65 [Mayes et al., 1990]
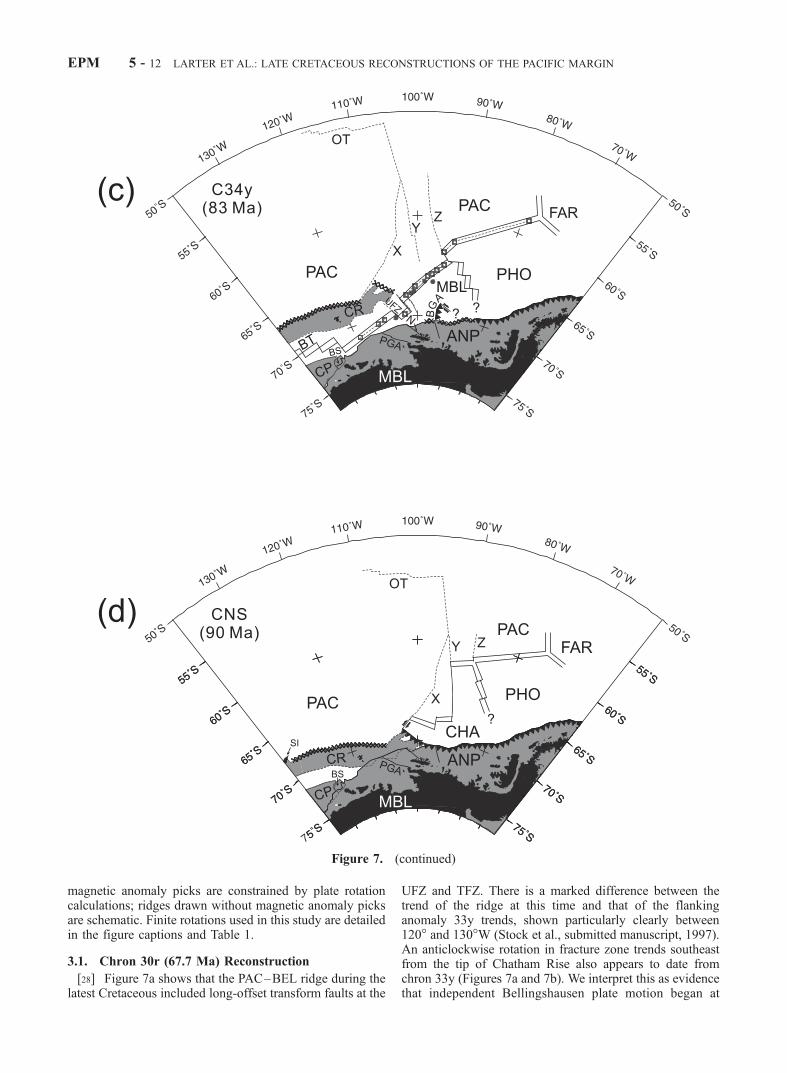
Figure 7. (opposite) Late Cretaceous tectonic reconstructions of the Pacific margin of Antarctica in the Marie Byrd Land(MBL) reference frame, assuming that the Bellingshausen plate did not include any part of West Antarctica and that therehas been no relative motion between different parts of West Antarctica since 90 Ma. All reconstructions plotted on polarstereographic projection. (a) Reconstruction for chron 30r (67.7 Ma). All Pacific features (magnetic lineations, gravitylineations and fracture zones shown with dashed lines) have been rotated using a chron 30r PAC–MBL finite rotation (no.1, Table 1). All Bellingshausen features (magnetic lineations and fracture zones shown with solid lines) have been rotatedusing a chron 30r BEL–MBL finite rotation (no. 3, Table 1). The De Gerlache gravity anomaly (dotted lines) andBellingshausen gravity anomaly (BGA) are shown in their present-day position relative to MBL, although the DGGAprobably did not form until chron 27 (61.1 Ma). Existence of BEL–PHO ridge inferred from plate circuit calculations (seetext). Open squares and filled circles are magnetic anomaly picks on the Pacific and Bellingshausen plates, respectively.Magnetic isochrons 33y and 34y are labeled. The BEL–MBL stage rotation pole for chrons 32n.1r-28r (71.5–63.8 Ma) ismarked with a white circle at 73.64�S, 101.04�W (no. 19, Table 2). Solid barbs denoting subduction have been drawn alongthe present-day Antarctic Peninsula margin, although there has probably been considerable accretion along the southernpart of the margin [McCarron and Larter, 1998], and subduction erosion farther northeast, since this time. Question marksindicate areas where the precise position and configuration of plate boundaries remain uncertain. BEL, Bellingshausenplate; MBL, Marie Byrd Land plate; ANP, Antarctic Peninsula plate; PAC, Pacific plate; PHO, Phoenix plate; FAR,Farallon plate; CR, Chatham Rise; BT, Bounty Trough; BS, Bollons Seamount; AFZ, Antipodes Fracture Zone; UFZUdintsev Fracture Zone; TFZ, Tharp Facture Zone; HFZ, Heezen Fracture Zone; X, Y and Z, gravity lineations on Pacificocean floor formed during the Cretaceous Normal Superchron; PGA, Peacock gravity anomaly; N, Noville gravitylineation. (b) Reconstruction for chron 33y (73.6 Ma). All Pacific features (open squares and dashed lines) have beenrotated using a chron 33y PAC–MBL finite rotation (no. 4, Table 1). All Bellingshausen features (solid circles and lines)have been rotated using a chron 33y BEL–MBL finite rotation (no. 6, Table 1). The BGA is shown in its present-dayposition relative to MBL. Abbreviations as for (a), plus CP, Campbell Plateau (c) Reconstruction for chron 34y (83 Ma). AllPacific features (open squares and dashed lines), except Bollons Seamount (BS), have been rotated using a PAC–MBLfinite rotation derived from tight fit of Campbell Plateau (CP) with MBL (no. 7, Table 1). BS has been reconstructed to thetip of CP. All Bellingshausen features (solid circles and lines) have been rotated using a chron 33y BEL–MBL finiterotation (no. 6, Table 1), with the implicit assumption that there was no BEL–MBL motion before chron 33y. The BGA isshown in its present-day position relative to MBL. Existence of slow spreading ridge on opposite side of PAC–PHO ridgefrom gravity lineation Z inferred on basis of interpretation of Z as a triple junction trace (see text). OT, Osbourn Trough,reconstructed assuming it has been inactive since before 90 Ma. Other abbreviations as in (a). (d) Reconstruction forCretaceous Normal Superchron (90 Ma). All Pacific features (dashed lines), except CP and BS, have been rotated using aPAC–MBL finite rotation derived from tight fit of Chatham Rise with the part of the Antarctic continental margin between120�Wand 100�W (no. 8, Table 1). CP and BS are shown in the same positions as in (c). Annotations and abbreviations asfor (c), plus CHA, Charcot plate; SI, part of South Island, New Zealand.
EPM 5 - 10 LARTER ET AL.: LATE CRETACEOUS RECONSTRUCTIONS OF THE PACIFIC MARGIN

ocean floor to its north). A second assumption in Figure 7 isthat Bellingshausen plate motion began at about chron 33y(see section 3.1 for justification of this interpretation).Alternative reconstructions for chron 34y (83 Ma) and c.90 Ma (Figures 8a and 8b) show how the configuration ofthe continental margin would be expected to have differed ifthe Bellingshausen plate included part of the West Antarcticcontinental shelf (our preferred interpretation; see sections3.5 and 3.6).[26] In all of the reconstructions the Antarctic Peninsula is
shown fixed in its present-day position relative to Marie
Byrd Land. However, it is labeled as a separate plate (ANP)in recognition of the fact that we suspect that there was asmall amount of relative motion between Marie Byrd Landand the Antarctic Peninsula during the interval covered bythese reconstructions (see section 3.2).[27] The reconstructions in Figure 7 are presented in
order of increasing age because the position of ChathamRise at final fit is based on consideration of the more recentreconstructions, and especially on reconstructed fracturezone trends in the chron 34y reconstructions (Figures 7cand 8a). In all reconstructions, spreading ridges drawn along
LARTER ET AL.: LATE CRETACEOUS RECONSTRUCTIONS OF THE PACIFIC MARGIN EPM 5 - 11
magnetic anomaly picks are constrained by plate rotationcalculations; ridges drawn without magnetic anomaly picksare schematic. Finite rotations used in this study are detailedin the figure captions and Table 1.
3.1. Chron 30r (67.7 Ma) Reconstruction
[28] Figure 7a shows that the PAC–BEL ridge during thelatest Cretaceous included long-offset transform faults at the
UFZ and TFZ. There is a marked difference between thetrend of the ridge at this time and that of the flankinganomaly 33y trends, shown particularly clearly between120� and 130�W (Stock et al., submitted manuscript, 1997).An anticlockwise rotation in fracture zone trends southeastfrom the tip of Chatham Rise also appears to date fromchron 33y (Figures 7a and 7b). We interpret this as evidencethat independent Bellingshausen plate motion began at
Figure 7. (continued)
EPM 5 - 12 LARTER ET AL.: LATE CRETACEOUS RECONSTRUCTIONS OF THE PACIFIC MARGIN

about chron 33y (73.6 Ma). This interpretation is reinforcedby the fact that Bellingshausen plate features fit well inolder reconstructions when rotated back to their chron 33ypositions, but any further rotation would be difficult toaccommodate in those reconstructions (see section 3.3,Figures 7c, 7d, 8a, and 8b).[29] The Bellingshausen plate was probably bordered to
the east by a Bellingshausen–Phoenix (BEL–PHO) ridge atthis time. A quantitative estimate of Phoenix plate motionsuggests that it was moving ESE at >100 mm/yr relative toMarie Byrd Land between chrons 34 and 31 (83–68 Ma)[McCarron and Larter, 1998]. By comparison Bellingshau-sen–Marie Byrd Land (BEL–MBL) motion was slow[Cande et al., 1995; Heinemann et al., 1999], so the motionof the Phoenix plate relative to the Bellingshausen platewould have been similar to its motion relative to Marie ByrdLand. This implies divergent BEL–PHO motion in theBellingshausen Sea, and this divergence probably continueduntil independent Bellingshausen plate motion ceased aspart of a widespread plate reorganization in the SouthPacific at chron 27 (61.1 Ma) [Cande et al., 1995]. At thattime the BEL–PHO ridge was rendered inactive by a ridgejump westward to the DGGA, where ANT–PHO spreadingwas initiated (see section 2.2) [Larter et al., 1999]. All ofthe ocean floor which lay to the east of the DGGA at chron27, including the extinct BEL–PHO ridge, has since beensubducted beneath the Antarctic Peninsula.[30] Farther south, we consider that the BGA and the
continental margin off Thurston Island probably accommo-dated convergent motion between the Bellingshausen andWest Antarctic plates (MBL and ANP) at the time of thisreconstruction, explaining the thick wedges of sediment anddeformation structures observed on seismic reflection pro-files across the BGA and across the margin [Cunningham etal., 2002]. The location of the BEL–MBL stage rotationpole calculated for the interval between chrons 32n.1r and28r (71.5–63.8 Ma; Table 2) is consistent with such motion(pole location marked by white circle in Figure 7a). It is alsoconsistent with an extensional BEL–MBL plate boundaryon the western side of the Bellingshausen plate, whichappears to have been active at this time (near 126�W)[Heinemann et al., 1999].
3.2. Chron 33y (73.6 Ma) Reconstruction
[31] Figure 7b shows a reconstruction for the time atabout which we consider independent Bellingshausen platemotion began, within the seaway between Chatham Riseand Marie Byrd Land. At chron 33y, the PAC–BEL ridgehad both right- and left-stepping offsets; the long trans-form offset at the UFZ shown in Figure 7a developed afterthis time as the ridge segments reorientated in response tothe change in spreading direction associated with the onsetof PAC–BEL motion. From interpretation of seismicprofiles across the BGA, we suspect that convergentdeformation across the BGA was already underway bythis time, preceding the onset of independent Bellingshau-sen plate motion [Cunningham et al., 2002]. In this casethe earlier convergence represents slow relative motionbetween Marie Byrd Land and ocean floor attached to theAntarctic Peninsula.[32] Two small fracture zones northeast of the UFZ
appear to be misaligned in Figure 7b. This could indicate
that the features digitized are not actually a pair of conjugatestructures: the southwestern of the two fracture zones in theBellingshausen Sea actually aligns well with the northeast-ern of the two near Chatham Rise. Alternatively the mis-alignment might indicate a small error in the chron 33yfinite rotation used. As we do not have all the magneticanomaly and fracture zone picks used in calculating thisrotation we are not in a position to evaluate this possibility.
3.3. Chron 34y (83 Ma) Reconstruction With FixedWest Antarctic Margin
[33] Figure 7c shows an early stage in the development ofthe seaway between Chatham Rise and Marie Byrd Land,probably preceding the onset of independent Bellingshausenplate motion. It depicts a tectonic setting very similar to thataround the modern Gulf of California. West of 126�W,Campbell Plateau and the Bollons Seamount are recon-structed to their prerift positions against Marie Byrd Land,as breakup occurred there shortly after chron 34y [Stock etal., 1996; Sutherland, 1999]. The presence of anomaly 34yon marine magnetic profiles southeast of the ChathamIslands (Figures 3 and 4) indicates that organized seafloorspreading was established there by this time, and we suspectthat the Late Cretaceous rifting of Bounty Trough to the easthad finished [Davy, 1993; Carter et al., 1994]. This recon-struction places the PAC–MBL ridge close to the southernmargin of the seaway (e.g. near 115�W, Figure 7c). It ispossible that such a situation could have resulted fromhighly asymmetric extension during the earliest stages ofseparation of Chatham Rise from Marie Byrd Land. How-ever, we suspect that the asymmetric position of the ridge inthis reconstruction is actually a consequence of the assump-tion that Bellingshausen plate motion did not affect theMarie Byrd Land margin being incorrect (see alternativereconstruction in Figure 8a).[34] We used a PAC–MBL finite rotation derived from a
tight fit of Campbell Plateau with Marie Byrd Land (no. 7,Table 1; Figure 9) to reconstruct Pacific plate features inFigure 7c, thereby making the implicit assumption that therewas no relative motion between Campbell Plateau andChatham Rise after chron 34y. If any subsequent relativemotion did take place between these two blocks, thenChatham Rise and the spreading ridge to its south shouldbe reconstructed to a position even closer to the WestAntarctic margin than shown in Figure 7c. Magnetic anom-aly picks and fracture zones in the Bellingshausen Sea havebeen reconstructed using a BEL–MBL finite rotation forchron 33y (no. 6, Table 1). Additional rotation about thesame pole would place these features farther southwest. Thefact that there is such a good fit between Pacific andBellingshausen features on this reconstruction supportsour interpretation that independent Bellingshausen platemotion began at about chron 33y.[35] In this reconstruction lineament Z connects with a
PAC–PHO–MBL triple junction and we interpret Z as atriple junction trace. If the rates of PAC–PHO and PAC–MBL spreading observed between anomalies 34y and 33yare extrapolated back into the CNS, the length of Z suggeststhat the triple junction developed a few million years beforeseparation of Chatham Rise from Marie Byrd Land. In thiscase it probably originated by separation of the southwest-ern part of the Phoenix plate from the main body of that
LARTER ET AL.: LATE CRETACEOUS RECONSTRUCTIONS OF THE PACIFIC MARGIN EPM 5 - 13
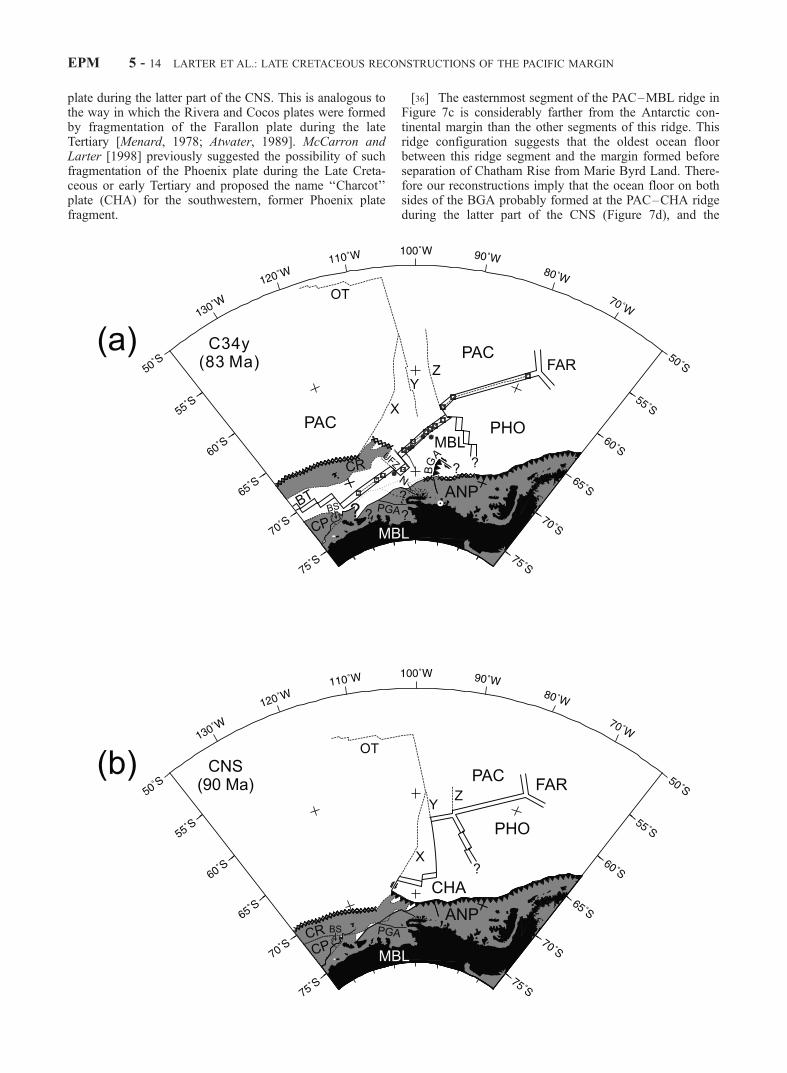
plate during the latter part of the CNS. This is analogous tothe way in which the Rivera and Cocos plates were formedby fragmentation of the Farallon plate during the lateTertiary [Menard, 1978; Atwater, 1989]. McCarron andLarter [1998] previously suggested the possibility of suchfragmentation of the Phoenix plate during the Late Creta-ceous or early Tertiary and proposed the name ‘‘Charcot’’plate (CHA) for the southwestern, former Phoenix platefragment.
[36] The easternmost segment of the PAC–MBL ridge inFigure 7c is considerably farther from the Antarctic con-tinental margin than the other segments of this ridge. Thisridge configuration suggests that the oldest ocean floorbetween this ridge segment and the margin formed beforeseparation of Chatham Rise from Marie Byrd Land. There-fore our reconstructions imply that the ocean floor on bothsides of the BGA probably formed at the PAC–CHA ridgeduring the latter part of the CNS (Figure 7d), and the
EPM 5 - 14 LARTER ET AL.: LATE CRETACEOUS RECONSTRUCTIONS OF THE PACIFIC MARGIN

western part of this ridge reorientated to become part of thePAC–MBL ridge as Chatham Rise separated from MarieByrd Land.
3.4. Cretaceous Normal Superchron (90 Ma)Reconstruction With Fixed West Antarctic Margin
[37] Figure 7d shows a possible fit of Chatham Riseagainst the West Antarctic continental margin. This fitassumes that the part of Chatham Rise at the northern endof the UFZ reconstructs to the offset in the Antarcticmargin at the NGL. Lineaments X, Y and Z on thePacific plate have been reconstructed using the same
PAC–MBL finite rotation determined for the fit ofChatham Rise (no. 8, Table 1). If the PAC–MBL half-spreading rate measured between anomalies 34 and 33 onprofiles south of Chatham Rise (32 mm/yr) is extrapolatedback to the margin, the estimated age of breakup is 90Ma. By this time subduction along the northern margin ofChatham Rise had already ceased [Bradshaw, 1989],possibly as a result of the Hikurangi Plateau collidingwith the margin. Based on the age distribution of calc-alkaline plutons in Marie Byrd Land, Storey et al. [1999]suggested that subduction ceased at c. 108 Ma in the westbut persisted until c. 95 Ma along the eastern part ofChatham Rise.[38] The PAC–PHO ridge position has been estimated by
extrapolating the average half-spreading rates measuredbetween chrons 34y and 33y east of lineation Z (80 mm/yr) back to 90 Ma. We interpret the northern part oflineament Z as the trace of a PAC–PHO–CHA triple junc-tion (see section 3.3). The continuity of lineament Z impliesthat the ends of the PAC–PHO and PAC–CHA ridges musthave remained close together during the formation of thetriple junction trace and that there was no large ridge jump.The closest modern analogy is the Pacific–Nazca–Cocostriple junction. Migration of the PAC–CHA ridge segmentbetween Y and Z southward to the position of the PAC–MBL ridge at chron 34y requires that this segment keptspreading at a fast rate similar to that of the PAC–PHOridge until shortly before chron 34y. This in turn requiresthat subduction of the eastern part of the Charcot platecontinued until shortly before chron 34y, in order to removemost of the large amount of ocean floor produced on thesouth flank of this fast spreading ridge segment. However, ifthe easternmost segment of the PAC–MBL ridge formed byreorientation of the western part of the PAC–CHA ridge asChatham Rise separated from Marie Byrd Land at about 90Ma, then the western part of the PAC–CHA ridge mustalready have been close to the eastern tip of Chatham Riseat that time. These considerations suggest to us that therewas probably a long transform offset in line with lineamentY prior to 90 Ma, and the western part of the Charcot platewas captured by Marie Byrd Land at the time of breakup. Inthis case subduction along the part of the West Antarcticmargin where the western part of the Charcot plate had beensubducting would have stalled at the time of breakup. Theyoungest radiometric ages from calc-alkaline rocks from the
Figure 8. (opposite) Alternative ( preferred) Late Cretaceous tectonic reconstructions of the Pacific margin of Antarcticain the Marie Byrd Land (MBL) reference frame, assuming that the Bellingshausen plate incorporated part of the Antarcticcontinental shelf in the Amundsen and Bellingshausen Seas, including Thurston Island. Reconstructions plotted on polarstereographic projection. Abbreviations as for Figure 7. (a) Reconstruction for chron 34y (83 Ma). All Pacific features(open squares and dashed lines), except Bollons Seamount (BS), have been rotated using a PAC–MBL finite rotationderived from tight fit of Campbell Plateau (CP) with MBL (no. 7, Table 1). BS has been reconstructed to the tip of CP. AllBellingshausen features (solid circles and lines) and the part of the Antarctic continental margin between about 125�Wand95�W (including the PGA, NGL and Thurston Island) have been rotated using a chron 33y BEL–MBL finite rotation (no.6, Table 1), with the implicit assumption that there was no BEL–MBL motion before chron 33y. The unrotated continentalmargin (as in Figure 7) is shown by faint dotted lines. The chron 33y BEL–MBL finite rotation pole (no. 6, Table 1) ismarked with a white circle at 73.08�S, 91.41�W. (b) Reconstruction for Cretaceous Normal Superchron (90 Ma). All Pacificfeatures (dashed lines), except CP and BS, have been rotated using a PAC–MBL finite rotation derived from tight fit ofChatham Rise with the reconstructed position of the part of the Antarctic continental margin between 120�W and 100�W(no. 9, Table 1). CP and BS are shown in the same positions as in (a). The part of the Antarctic continental margin betweenabout 125�W and 95�W (including the PGA, NGL and Thurston Island) has been reconstructed as in (a).
Figure 9. Reconstructed positions of Campbell Plateau(CP) in the Marie Byrd Land (MBL) reference frame usingdifferent PAC–MBL rotations, plotted on polar stereo-graphic projection. The present-day position of the CPoutline in shown in Figure 2a, and the MBL outline is thesame as shown in Figure 2b. Dashed line ‘‘M’’ is theposition resulting from the PAC–MBL ‘‘FIT’’ finiterotation of Mayes et al. [1990] (no. 11, Table 1). Dottedline ‘‘S33y’’ is the position resulting from a PAC–MBLfinite rotation for chron 33y calculated by Stock et al.(submitted manuscript, 1997) (no. 4, Table 1). Dotted line‘‘S+’’ is the position resulting from a finite rotation with thesame pole position, but with the rotation angle increased toplace the reconstructed position of the southeastern marginof CP approximately coincident with the MBL margin (no.10, Table 1). The solid line shows the fit of CP to MBLproposed in this paper, which is the basis for the PAC–MBL finite rotation for chron 34y used in Figures 7 and 8(no. 7, Table 1). IB, Iselin Bank; MBL, Marie Byrd Land.
LARTER ET AL.: LATE CRETACEOUS RECONSTRUCTIONS OF THE PACIFIC MARGIN EPM 5 - 15

corresponding sectors of Ellsworth Land (Figure 2b) areconsistent with this scenario: these are 87 ± 2 Ma (K–Ar) and 89 ± 1 Ma (Ar–Ar) from a calcic granodiorite inthe area southeast of the BGA [Pankhurst et al., 1993].A little farther west, the youngest ages from calc-alkalinerocks from the Jones Mountains (in the part of EllsworthLand south of the eastern tip of Thurston Island) are 91± 1 Ma from silicic tuffs and agglomerates, and 89 ± 3Ma from felsic dykes (both Rb–Sr) [Pankhurst et al.,1993].[39] In Figure 7d, the shape of Chatham Rise and the
Marie Byrd Land margin does not permit complete closureof Bounty Trough at fit, which would imply that only c. 130km of the c. 300 km width of the eastern part of the troughis a result of Late Cretaceous extension associated withbreakup. However, an alternative reconstruction whichpermits the full width of the Bounty Trough to have formedby Late Cretaceous extension, and which we prefer, isshown in Figure 8b (see section 3.6).
3.5. Chron 34y (83 Ma) Reconstruction WithBellingshausen Plate Motion Affecting WestAntarctic Margin
[40] Figure 8a shows an alternative reconstruction toFigure 7c for the southern Pacific Ocean at chron 34y. Thisis our preferred reconstruction and shows the effect ofsubsequent Bellingshausen plate motion on the West Ant-arctic continental margin, assuming that the plate includedthe part of the margin between 120� and 95�W. The PGA,NGL and Thurston Island have also been rotated with thispart of the margin, using a BEL–MBL finite rotation forchron 33y (no. 6, Table 1). We think that these featuresmoved northward relative to the rest of West Antarcticabetween chrons 33y and 27 (73.6–61.1 Ma) as part of theBellingshausen plate. By chron 27 they reached theirpresent-day positions, which are shown as dotted lines inFigure 8a. Reconstruction of the position of Thurston Islandbased on the assumption that it moved as part of theBellingshausen plate results in near-perfect closure of Pea-cock Sound, the narrow strait between the island and themainland.[41] In contrast to Figure 7c, this reconstruction places the
PAC–MBL ridge along the axis of the seaway, consistentwith symmetric extension during the earliest stages ofseparation of Chatham Rise from Marie Byrd Land. Thesouthern boundary of the Bellingshausen plate within WestAntarctica remains poorly defined, and may have beendiffuse. However, we speculate that tectonic strain betweenthe Bellingshausen and Marie Byrd Land plates may havebeen partly accommodated by structures corresponding tothe PGA and NGL. It may be more than coincidence that
these two lineaments, and the part of the BGA crossing thecontinental shelf, radiate from the calculated position of thechron 33y BEL–MBL finite rotation pole (marked by awhite circle in Figure 8a).
3.6. Cretaceous Normal Superchron (90 Ma)Reconstruction With Bellingshausen Plate MotionAffecting West Antarctic Margin
[42] Figure 8b shows an alternative reconstruction toFigure 7d for the fit of Chatham Rise to West Antarctica.This is our preferred reconstruction, allowing for theinferred effects of Bellingshausen plate motion on the WestAntarctic continental margin as described above. The modi-fied shape of the Antarctic margin now permits completeclosure of Bounty Trough at fit, which is consistent with thefull 300 km width of the eastern part of the Trough havingformed by Late Cretaceous extension. Lineaments X, Y andZ on the Pacific plate have been reconstructed using thesame PAC–MBL finite rotation determined for the revisedfit of Chatham Rise (no. 9, Table 1). This places themslightly farther west and with their trends slightly rotatedanticlockwise compared to their positions in Figure 7d.Other oceanic features have been placed in the samepositions relative to these lineaments as in Figure 7d, andour interpretation of lineament Z and the history of PAC–CHA spreading is unaffected by the differences betweenthese two reconstructions.[43] The reconstruction in Figure 8b suggests that the
BGA may have developed from a fracture zone conjugate tolineament Y. In section 3.4 we inferred that there was a longtransform offset in line with Y prior to 90 Ma, and thatsubduction of the part of the Charcot plate to the west of thisprobably stalled at the time Chatham Rise separated fromMarie Byrd Land. This scenario implies that the fracturezone conjugate to Y became a ridge-trench transform at thetime of breakup. Subsequent changes in plate motionsresulting in a small amount of convergence across thisstructure provide a viable explanation for features observedon seismic profiles across the BGA [Cunningham et al.,2002].
4. Discussion
[44] The new reconstructions presented here show theregional constraints on the tectonic evolution of the Bel-lingshausen and Amundsen Sea regions during the LateCretaceous. They provide some clues about the probabletime of onset of independent Bellingshausen plate motion,and show the implications of different assumptions aboutthe position and nature of the southern boundary of thatplate. The earliest reconstructions also reveal the tectonic
Table 2. Finite Rotations and Stage Rotations Used to Calculate BEL–MBL Stage Rotation for Chrons C32n.1r–C28r (71.5–63.8 Ma)
No. Plate Pair Reference Frame Chrons Latitude Longitude Angle Comment
12 PAC–BEL Finite C28r 70.43 �56.55 46.35 (Stock et al., submitted manuscript, 1997)13 PAC–BEL Finite C32n.1r 71.4 �42.69 59.57 (Stock et al., submitted manuscript, 1997)14 BEL–PAC PAC C32n.1r–C28r 61.61 �12.38 �13.8 Sum of no. 12 and no.13 (reversed)15 PAC–MBL Finite C28r 70.55 �55.72 47 (Stock et al., submitted manuscript, 1997)16 PAC–MBL Finite C32n.1r 67.1 �57.4 50.48 (Stock et al., submitted manuscript, 1997)17 PAC–MBL MBL C32n1.r–C28r 29.59 �46.08 4.52 Sum of no. 15 (reversed) and no. 1618 BEL–PAC MBL C32n.1r–C28r 74.3 10.1 �13.8 No. 14 rotated to MBL ref. frame19 BEL–MBL MBL C32n.1r–C28r �73.64 �101.04 11.66 Sum of no. 18 and no. 17
EPM 5 - 16 LARTER ET AL.: LATE CRETACEOUS RECONSTRUCTIONS OF THE PACIFIC MARGIN
framework in the southernmost Pacific Ocean during thebreakup of the former Pacific margin of Gondwana.
4.1. The Ocean Basement Near the BellingshausenGravity Anomaly
[45] Marine magnetic profiles either side of the BGA donot define a clear pattern of lineations (Figure 5). Thereconstructions in Figures 7 and 8 suggest that the oceancrust in this area is the oldest preserved in the Bellingshau-sen and Amundsen Seas. The absence of magnetic linea-tions is explained by the formation of this crust at the PAC–CHA ridge during the latter part of the CNS, prior toseparation of Chatham Rise from Marie Byrd Land.
4.2. Late Cretaceous Subduction at the AntarcticPeninsula Pacific Margin
[46] The inferred existence of a slow-spreading ridgeforming the western boundary of the Phoenix plate duringthe Late Cretaceous (Figures 7 and 8) is consistent withsome geological observations from the southern part of theAntarctic Peninsula which suggest Late Cretaceous ridgesubduction. On the basis of analyses of mafic dykes fromthe southern Antarctic Peninsula, Scarrow et al. [1997,1998] interpreted a period of compositionally diversemagmatism between 95 and 65 Ma as resulting fromspreading ridge subduction. Furthermore, high-Mg andesitelavas in southern Alexander Island, which probably eruptedat c. 75 Ma [McCarron and Millar, 1997], have beeninterpreted as having been generated by partial melting offorearc mantle at shallow depth (<50 km) triggered by anincrease in geothermal gradient associated with ridge sub-duction [McCarron and Larter, 1998; McCarron andSmellie, 1998].[47] If PAC–PHO spreading during the CNS was as fast
as between chrons 34y and 33y (an average of 80 mm/yrhalf rate), then our new reconstructions imply that, duringthe period they represent (90–67.7 Ma), Phoenix plateocean floor generated at the PAC–PHO ridge was neverolder than 14 Myr when it was subducted at the AntarcticPeninsula margin. There are few places where it can beshown there has been subduction of such young oceanfloor produced at such high spreading rates for such a longtime interval, and therefore the Late Cretaceous subduc-tion-related magmatic rocks of the Antarctic Peninsulaprovide a record of the magma compositions resultingfrom this kind of tectonic scenario.
4.3. Southern Boundary of the Bellingshausen Plate
[48] Previous studies have left the question of whetheror not the Bellingshausen plate included any part ofcontinental West Antarctica unresolved. Stock et al. (sub-mitted manuscript, 1997) and Heinemann et al. [1999]speculated that the southern boundary of the Bellingshau-sen plate could have been located near the West Antarcticcontinental margin in the Amundsen Sea, or could havecontinued from the BEL–MBL divergent boundary at c.126�W into the Amundsen Sea continental shelf.[49] A seismic reflection profile (AWI-94042) that crosses
the West Antarctic continental margin near 104�300W doesnot show any evidence of tectonic structures [Cunninghamet al., 2002]. However, the profile does show a thick glacial-margin sediment wedge on this part of the margin, so it
remains possible that tectonic structures lie buried and areobscured by seafloor multiple reverberations.[50] Our new fit of Chatham Rise against the West
Antarctic margin (Figure 8b) suggests to us that the Bel-lingshausen plate did incorporate part of the West Antarcticcontinental margin. We speculate that tectonic structuresrepresented by the PGA and NGL, and the part of thecontinental margin north of Thurston Island, may haveaccommodated BEL–MBL motion. We offer two alterna-tive explanations for development of these structures:1. The southern boundary of the Bellingshausen plate
could have been diffuse, so that BEL–MBL motion wasdistributed between several structures, including those alongthe PGA, the NGL, and the part of the margin north ofThurston Island.2. The BEL–MBL boundary could have stepped from
one site to another during the lifetime of the Bellingshausenplate, perhaps northward from a site near the coast of MarieByrd Land, to the PGA, the NGL, and finally to thecontinental margin north of Thurston Island.[51] On Thurston Island a mafic to silicic, mainly E–W
striking, swarm of dykes intrude all other lithologicalgroups on the island. No radiometric age data on thesedykes have been published, but their emplacement has beenassumed to be related to extensional stresses at the time ofcessation of subduction and rifting of Chatham Rise fromWest Antarctica [Storey et al., 1991; Leat et al., 1993].However, the observation that reconstructing the position ofThurston Island as part of the Bellingshausen plate results innear-perfect closure of Peacock Sound (Figure 8a) suggestsan alternative possibility: the emplacement of the dykesmay have been related to extensional stresses resulting fromBEL–MBL motion between chrons 33y and 27 (73.6–61.1Ma). This hypothesis can be tested by radiometric dating ofthe dykes.
4.4. Cenozoic Deformation in Antarctica
[52] Cande et al. [2000] proposed that there wasrelative motion between Marie Byrd Land and EastAntarctica in Eocene and Oligocene time, resulting inroughly 180 km of separation in the western Ross Seaembayment. They did not attempt to define the easternboundary of the Marie Byrd Land plate, but it seems tous doubtful that it included the Antarctic Peninsula, asthere is no evidence of a tectonic boundary between theAntarctic Peninsula and East Antarctica during Cenozoictime, and Late Cretaceous paleomagnetic results from theAntarctic Peninsula are inconclusive [DiVenere et al.,1994]. If the Antarctic Peninsula has remained fixed toEast Antarctica during the Cenozoic, then the finiterotation estimated by Cande et al. [2000] to describethe full amount of Eocene and Oligocene extension in thewestern Ross Sea would place the reconstructed posi-tion of the Antarctic Peninsula 150–170 km northwest ofwhere it is shown in Figures 7 and 8.
5. Conclusions
[53] New Late Cretaceous tectonic reconstructions, to-gether with new marine geophysical data collected in theBellingshausen Sea [Cunningham et al., 2002], provide
LARTER ET AL.: LATE CRETACEOUS RECONSTRUCTIONS OF THE PACIFIC MARGIN EPM 5 - 17
insight into regional constraints on tectonic evolution of thePacific margin of Antarctica since 90 Ma:1. Chatham Rise started to separate from West Antarctica
at about 90 Ma, and the Bounty Trough probably started toopen at the same time. By chron 34y (83 Ma) organizedseafloor spreading was established southeast of theChatham Islands at the PAC–MBL/PAC–BEL ridge.Campbell Plateau started to separate from West Antarcticalater, during chron 33r (83.0–79.1 Ma).2. The ocean crust either side of the BGA is the oldest
preserved in the Bellingshausen and Amundsen Seas,having formed at a ridge between the Pacific and Charcotplates prior to separation of Chatham Rise from WestAntarctica. The Charcot plate originated as a fragment ofthe Phoenix plate a few million years before Chatham Riseseparated from West Antarctica.3. Subduction of the Charcot plate stopped before chron
34y (83 Ma), and the BGA trough developed at the westernmargin of ocean crust that became coupled to the AntarcticPeninsula across the stalled subduction zone. Initialdevelopment of the BGA trough probably exploited afracture zone in the former Charcot plate.4. A prominent gravity lineament (‘‘Z’’) northeast of
Chatham Rise is the trace of a triple junction whichdeveloped as a result of the separation of the Charcot platefrom the Phoenix plate. It was a PAC–PHO–CHA triplejunction until shortly before chron 34y (83 Ma), thenbecame a PAC–PHO–MBL triple junction until aboutchron 33y (73.6 Ma), and continued as a PAC–PHO–BELtriple junction until chron 27 (61.1 Ma). The existence of aslow spreading ridge to the southeast of this triple junctionis consistent with geological observations from theAntarctic Peninsula which suggest Late Cretaceous spread-ing ridge subduction.5. Assuming PAC–PHO spreading prior to chron 34y
was as fast as between chrons 34y and 33y (an average of80 mm/yr half rate), the new reconstructions imply that thePhoenix plate ocean crust subducted at the AntarcticPeninsula margin during the Late Cretaceous was neverolder than 14 Myr when it reached the trench.6. Several observations suggest that independent Bel-
lingshausen plate motion began at about chron 33y (73.6Ma): (i) the PAC–BEL ridge rotated rapidly anticlockwiseafter chron 33y, (ii) an anticlockwise rotation in fracturezone trends southeast from the tip of Chatham Rise alsoappears to date from chron 33y, and (iii) Bellingshausenplate features fit well in pre-chron 33y reconstructions whenrotated back to their chron 33y positions.7. The Bellingshausen plate probably did incorporate
part of the West Antarctic continental margin. Reconstruc-tions for chron 34y in which part of the West Antarcticmargin is assumed to have moved with the Bellingshausenplate place the PAC–MBL/PAC–BEL ridge along the axisof the developing seaway between Chatham Rise and MarieByrd Land, and permit complete closure of the BountyTrough at fit. The southern edge of the Bellingshausen platemay have been a diffuse boundary, or the plate boundarymay have stepped from one location to another during thelifetime of the plate. We suggest that tectonic structuresrepresented by the PGA and NGL, and the part of thecontinental margin north of Thurston Island, accommodatedcomponents of BEL–MBL motion.
8. Tectonism at the BGA probably stopped with thecessation of independent Bellingshausen plate motion atchron 27 (61.1 Ma). At the same time a westward ridgejump from the former BEL–PHO spreading center initiatedANT–PHO spreading at the DGGA.
[54] Acknowledgments. We thank Seymour Laxon (University Col-lege London) and Dave McAdoo (NOAA) for providing the ERS-1 marinegravity field, Joann Stock for providing unpublished data, and DietmarMuller and two anonymous referees for their constructive reviews.
ReferencesAtwater, T., Plate tectonic history of the northeast Pacific and western NorthAmerica, in Eastern Pacific Ocean and Hawaii, The Geology of NorthAmerica, N, edited by E. L. Winterer, D. M. Hussong, and R. W. Decker,pp. 21–72, GSA, Boulder, Colo., 1989.
Barker, P. F., The Cenozoic subduction history of the Pacific margin of theAntarctic Peninsula: Ridge crest-trench interactions, J. Geol. Soc. Lon-don, 139, 787–801, 1982.
Barton, C. E., Revision of International Geomagnetic Reference Field re-leased, Eos Trans. AGU Electron. Suppl., 16 April 1996. (Available ashttp://www.agu.org/eos_elec/95242e.html)
Billen, M. I., and J. Stock, Morphology and origin of the Osbourn Trough,J. Geophys. Res., 105, 13,481–13,489, 2000.
Bradshaw, J. D., Cretaceous geotectonic patterns in the New Zealand re-gion, Tectonics, 8, 803–820, 1989.
Cande, S. C., and D. V. Kent, Revised calibration of the geomagneticpolarity time scale for the Late Cretaceous and Cenozoic, J. Geophys.Res., 100, 6093–6096, 1995.
Cande, S. C., E. M. Herron, and B. R. Hall, The early Cenozoic tectonichistory of the southeast Pacific, Earth Planet. Sci. Lett., 57, 63–74, 1982.
Cande, S. C., C. A. Raymond, J. Stock, and W. F. Haxby, Geophysics of thePitman Fracture Zone and Pacific –Antarctic plate motions during theCenozoic, Science, 270, 947–953, 1995.
Cande, S. C., J. M. Stock, R. D. Muller, and T. Ishihara, Cenozoic motionbetween East and West Antarctica, Nature, 404, 145–150, 2000.
Carter, R. M., L. Carter, and B. Davy, Seismic stratigraphy of the BountyTrough, south-west Pacific Ocean, Mar. Pet. Geol., 11, 79–93, 1994.
Cunningham, A. P., R. D. Larter, P. F. Barker, K. Gohl, and F. O. Nitsche,Multichannel seismic investigation of the ‘Bellingshausen Gravity Anom-aly’ and West Antarctic continental margin near 95�W, in Proceedings ofthe 8th International Symposium on Antarctic Earth Sciences, Bull. R. Soc.N. Z., 35, 201–206, 2002.
Cunningham, A. P., R. D. Larter, P. F. Barker, K. Gohl, and F. O. Nitsche,Tectonic evolution of the Pacific margin of Antarctica, 2, Structure ofLate Cretaceous–early Tertiary plate boundaries in the BellingshausenSea from seismic reflection and gravity data, J. Geophys. Res., 107,10.1029/2002JB001897, in press, 2002.
Davy, B., The Bounty Trough—Basement structure influences on sedimen-tary basin evolution, in South Pacific Sedimentary Basins, SedimentaryBasins of the World, vol. 2, edited by P. F. Ballance, pp. 69–92, ElsevierSci., New York, 1993.
DiVenere, V. J., D. V. Kent, and I. W. D. Dalziel, Mid-Cretaceous paleo-magnetic results from Marie Byrd Land, West Antarctica, J. Geophys.Res., 99, 15,115–15,139, 1994.
Gohl, K., F. Nitsche, and H. Miller, Seismic and gravity data reveal Tertiaryinterplate subduction in the Bellingshausen Sea, southeast Pacific, Geol-ogy, 25, 371–374, 1997.
Heinemann, J., J. Stock, R. Clayton, K. Hafner, S. Cande, and C. Raymond,Constraints on the proposed Marie Byrd Land–Bellingshausen plateboundary from seismic reflection data, J. Geophys. Res., 104, 25,321–25,330, 1999.
Herron, E. M., and B. E. Tucholke, Sea-floor magnetic patterns and base-ment structure in the southeastern Pacific, Initial Rep. Deep Sea Drill.Proj., 35, 263–278, 1976.
Kimura, K., Geological and geophysical survey in the Bellingshausen Ba-sin, off Antarctica, Antarct. Rec., 75, 12–24, 1982.
Larson, R. L., Superplumes and ridge interactions between Ontong Javaand Manihiki Plateaus and the Nova-Canton Trough, Geology, 25, 779–782, 1997.
Larson, R. L., M. B. Steiner, E. Erba, and Y. Lancelot, Paleolatitudes andtectonic reconstructions of the oldest portion of the Pacific plate: Acomparative study, Proc. Ocean Drill. Program Sci. Results, 129,615–631, 1992.
Larter, R. D., and P. F. Barker, Effects of ridge crest-trench interaction onAntarctic –Phoenix spreading: Forces on a young subducting plate,J. Geophys. Res., 96, 19,583–19,607, 1991.
EPM 5 - 18 LARTER ET AL.: LATE CRETACEOUS RECONSTRUCTIONS OF THE PACIFIC MARGIN
Larter, R. D., A. P. Cunningham, P. F. Barker, K. Gohl, and F. O. Nitsche,Structure and tectonic evolution of the West Antarctic continental marginand Bellingshausen Sea, Korean J. Polar Res., 10, 125–133, 1999.
Larter, R. D., M. Rebesco, L. E. Vanneste, L. A. P. Gamboa, and P. F.Barker, Cenozoic tectonic, sedimentary and glacial history of the conti-nental shelf west of Graham Land, Antarctic Peninsula, in Geology andSeismic Stratigraphy of the Antarctic Margin, 2, Antarctic Research Ser-ies, vol. 71, edited by P. F. Barker and A. K. Cooper, pp. 1–27, AGU,Washinton D. C., 1997.
Leat, P. T., B. C. Storey, and R. J. Pankhurst, Geochemistry of Palaeozoic–Mesozoic Pacific rim orogenic magmatism, Thurston Island area, WestAntarctica, Antarct. Sci., 5, 281–296, 1993.
Lonsdale, P., Geography and history of the Louisville hotspot chain in thesouthwest Pacific, J. Geophys. Res., 93, 3078–3104, 1988.
Luyendyk, B. P., Hypothesis for Cretaceous rifting of east Gondwanacaused by subducted slab capture, Geology, 23, 373–376, 1995.
Mayes, C. L., L. A. Lawver, and D. T. Sandwell, Tectonic history and newisochron chart of the South Pacific, J. Geophys. Res., 95, 8543–8567,1990.
McAdoo, D. C., and S. Laxon, Antarctic tectonics: Constraints from anERS-1 satellite marine gravity field, Science, 276, 556–560, 1997.
McAdoo, D. C., and K. M. Marks, Gravity fields of the Southern Oceanfrom Geosat data, J. Geophys. Res., 97, 3247–3260, 1992.
McCarron, J. J., and R. D. Larter, Late Cretaceous to early Tertiary sub-duction history of the Antarctic Peninsula, J. Geol. Soc. London, 155,255–268, 1998.
McCarron, J. J., and I. L. Millar, The age and stratigraphy of forearcmagmatism on Alexander Island, Antarctica, Geol. Mag., 134, 507–522, 1997.
McCarron, J. J., and J. L. Smellie, Tectonic implications of fore-arc mag-matism and generation of high-magnesian andesites: Alexander Island,Antarctica, J. Geol. Soc. London, 155, 269–280, 1998.
Menard, H. W., Fragmentation of the Farallon plate by pivoting subduction,J. Geol., 86, 99–110, 1978.
Molnar, P., T. Atwater, J. Mammerickx, and S. M. Smith, Magnetic anoma-lies, bathymetry, and tectonic evolution of the South Pacific since theLate Cretaceous, Geophys. J. R. Astron. Soc., 49, 383–420, 1975.
National Geophysical Data Center, Marine Geophysical Trackline Data(GEODAS/TRACKDAS). Data Announcement 96-MGG-01, NationalOceanographic and Atmospheric Administration, Boulder, Colo.,1996.
Nitsche, F. O., A. P. Cunningham, R. D. Larter, and K. Gohl, Geometry anddevelopment of glacial continental margin depositional systems in theBellingshausen Sea, Mar. Geol., 162, 277–302, 2000.
Pankhurst, J. R., I. L. Millar, A. M. Grunow, and B. C. Storey, The Pre-Cenozoic magmatic history of the Thurston Island crustal block, WestAntarctica, J. Geophys. Res., 98, 11,835–11,849, 1993.
Parsons, B., and J. G. Sclater, An analysis of the variation of ocean floorbathymetry and heat flow with age, J. Geophys. Res., 82, 803–827,1977.
Pitman, W. C., III, E. M. Herron, and J. R. Heirtzler, Magnetic anomalies inthe Pacific and sea-floor spreading, J. Geophys. Res., 73, 2069–2085,1968.
Sandwell, D. T., and W. H. F. Smith, Marine gravity-anomaly from Geosatand ERS-1 satellite altimetry, J. Geophys Res., 102, 10,039–10,054, 1997.
Scarrow, J. H., P. T. Leat, C. D. Wareham, and I. L. Millar, Geochemistry ofmafic dykes in the Antarctic Peninsula continental-margin batholith: Arecord of arc evolution, Contrib. Mineral. Petrol., 131, 289–305, 1998.
Scarrow, J. H., A. P. M. Vaughan, and P. T. Leat, Ridge-trench collision-induced switching of arc tectonics and magma sources: Clues from Ant-arctic Peninsula mafic dykes, Terra Nova, 9, 255–259, 1997.
Stock, J., and P. M. Molnar, Revised history of early Tertiary plate motionin the south-west Pacific, Nature, 325, 495–499, 1987.
Stock, J. M., S. C. Cande, and C. A. Raymond, Updated history of theBellingshausen plate(abstract), Eos Trans. AGU, 77(46), Fall Meet.Suppl., F647, 1996.
Storey, B. C., R. J. Pankhurst, I. L. Millar, I. W. D. Dalziel, and A. M.Grunow, A new look at the geology of Thurston Island, in GeologicalEvolution of Antarctica, edited by M. R. A. Thomson, J. A. Crame, andJ. W. Thomson, pp. 399–403, Cambridge Univ. Press, New York, 1991.
Storey, B. C., P. T. Leat, S. D. Weaver, R. J. Pankhurst, J. D. Bradshaw, andS. Kelley, Mantle plumes and Antarctica-New Zealand rifting: Evidencefrom mid-Cretaceous mafic dykes, J. Geol. Soc. London, 155, 659–671,1999.
Sutherland, R., Basement geology and tectonic development of the greaterNew Zealand region: An interpretation from regional magnetic data,Tectonophysics, 308, 341–362, 1999.
Sutherland, R., and C. Hollis, Cretaceous demise of the Moa plate andstrike-slip motion at the Gondwana margin, Geology, 29, 279–282, 2001.
Watts, A. B., J. K. Weissel, R. A. Duncan, and R. L. Larson, Origin of theLouisville Ridge and its relationship to the Eltanin Fracture Zone system,J. Geophys. Res., 93, 3051–3077, 1988.
Weissel, J. K., D. E. Hayes, and E. M. Herron, Plate tectonic synthesis: Thedisplacements between Australia, New Zealand, and Antarctica since theLate Cretaceous, Mar. Geol., 25, 231–277, 1977.
�����������������������P. F. Barker and R. D. Larter, British Antarctic Survey, High Cross,
Madingley Road, Cambridge CB3 0ET, UK. ([email protected]; [email protected])A. P. Cunningham, ARK CLS Limited, Mill Court, Featherstone
Rd., Wolverton Mill South, Milton Keynes MK12 5EU, UK. ([email protected])K. Gohl, Alfred Wegener Institute for Polar and Marine Research, P.O.
Box 120161, D-27515 Bremerhaven, Germany. ([email protected])F. O. Nitsche, Lamont-Doherty Earth Observatory of Columbia
University, Rte. 9W, Palisades, NY 10964, USA. ([email protected])
LARTER ET AL.: LATE CRETACEOUS RECONSTRUCTIONS OF THE PACIFIC MARGIN EPM 5 - 19


![Tectonic evolution of the European margin and …...[7], Sava-Vardar zone [5] or Sava zone [1]. Long lasting and complex tectonic and depositional evolution of the suture so far has](https://img.dokumen.tips/doc/110x75/5e90133fb4fc555e894b5540/tectonic-evolution-of-the-european-margin-and-7-sava-vardar-zone-5-or-sava.jpg)