Embed Size (px)
Citation preview

TECHNOLOGY REPORT
IQ RANKINGS – TECHNOLOGY SECTOR 2015
SWEDEN+46 31 80 26 10
IQ RankingTechnology sector report 2015
46%OVERALL TECHNOLOGY SCORE
ABOUT US
IR
GOVERNANCE
MEDIA
CSR
CAREERS
CONTENT
USABILITY
MOBILE
MULTIMEDIA
SOCIAL MEDIA
49%
50%19%
31%39%
44%58%48%36%50%
36%
Investis IQ research www.investis.com twitter/investis
Get in touch to receive a personalised IQ report comparing your digital presence to your peers.
1. SAP
2. Hewlett - Packard 3. Intel
Contact:Erik FishClient Director
[email protected]+1 415 302 7958

TECHNOLOGY REPORT
KEY FINDINGS
The technology sector is unusual in containing an exceptionally high proportion of companies that have unique business models and propositions. This means that many companies in the sector face particular challenges in communicating who they are, what they do and how they are doing it – compared to a company in a sector where the basic business model is already understood.
This report examines the corporate websites and wider digital presence of 144 global technology companies scored by Investis IQ in the past 12 months.
We found that technology companies comfortably outperform the global average when it comes to their use of social media on the corporate website and, to a lesser extent, with their use of Multimedia and Mobile and the provision of Media content. However, they are worryingly below global averages when it comes to About Us, Corporate Social Responsibility (CSR) and Corporate Governance content and are also off the pace with Investor Relations (IR) and Careers content.
41% of the companies score at or below the global average (45%) of the nearly 1,500 companies we scored in the past 12 months – although, helped by some strong performers, their overall average is just above the global average at 46%.
Technology companies are alarmingly bad at explaining what it is that they do, scoring an average of 36% in the About Us category compared to the global average of 43%. This is almost entirely due to the American technology companies (average 34%) rather than the non-US technology companies (average 42%) – and is particularly noticeable amongst internet companies (average 31%).
» Technology Hardware & Equipment companies (48% average) tend to score higher than Software & Computer Services companies (45% average): the biggest divergence is in CSR, Corporate Governance and careers content – although Software & Computer Services do better when it comes to the use of Mobile and Social Media.
» Software & Computer Services companies are particularly weak on CSR, Corporate Governance and About Us content and also need to work harder at IR content. Technology Hardware & Equipment companies’ weakest areas are About Us and Corporate Governance content.
» Two technology companies (SAP and Hewlett Packard) are in the top 25 of the 1,500 companies scored globally while eight companies appear in the top 10%.
» Seven companies appear in the bottom 10% of companies globally, reflecting a huge range of quality in this sector. All but one of them are Software & Computer Services companies – while the bottom three are all Chinese.
» Leading the sector on 73%, the German software giant SAP is the 11th highest scoring company globally. Only one company globally (Unicredit) scores higher than SAP when it comes to CSR. SAP also impress with their approach to IR and Careers – and in their use of Social Media.
» US companies (average 47%) outperform non-US companies (average 45%) overall – but they average lower than non-US companies in terms of About Us, IR, CSR and Corporate Governance content.
Off-the-record comments from technology companies in the US suggests that many of these companies believe that they do not need to explain who they are either because their offering is so unique that it needs no introduction or because they see no need to reach out to new investors. Both of these approaches are misguided and incompatible with building a global business.
A staggering 85% of companies do not discuss their strategy, rising to 93% of US companies. Only three US software and computer services companies (EMC, Microsoft and Symantec) discuss their strategy.
90% of companies fail to explain their business model or their investment proposition. Only two US companies do so – Qualcomm and Symantec.
Only 12% of companies provide analyst estimates and only 11% give information about their capital structure and debt. Over a quarter of companies provide no AGM information – rising to over a third for computer services companies. A third of US companies also provide no AGM information – while outside of the US, 86% of companies do.
Over a third of companies fail to offer an email address or direct number for a media spokesperson while six companies (all on the NASDAQ) have no media or news centre at all.
42% of companies make no provision for their mobile audience, be that through a dedicated mobile site or by using responsive design: with 1 in 5 of all corporate website visits coming from a mobile device, this needs urgent attention. The problem is worse outside of America, with just 20% of non-US technology companies offering a mobile solution.
TECHNOLOGY COMPANIES BY CATEGORY
1
2
3
OVERALL CONTENT USABILITY MOBILE MULTIMEDIA SOCIAL MEDIA ABOUT US IR GOVERNANCE MEDIA CSR CAREERS
SAP SAP Hewlett-Packard CapGemini Hewlett-Packard Hewlett-Packard Software AG Hewlett-Packard ASML Hewlett-Packard SAP SAP
73% 83% 70% 78% 64% 83% 75% 72% 96% 78% 83% 81%
Hewlett-Packard Hewlett-Packard Intel NetApp Intel NetApp Equinix SAP Nokia EMC Corporation Adobe Systems ARM Holdings
71% 80% 70% 72% 64% 74% 65% 72% 96% 70% 83% 81%
Intel Texas Instr. NetApp Cognizant SAP Cisco Systems SAP Ericsson Ericsson Software AG Repsol Hewlett-Packard
67% 76% 70% 67% 64% 74% 60% 67% 92% 70% 78% 78%
46% 49% 50% 19% 31% 39% 36% 44% 58% 48% 36% 50% AVERAGE
USER EXPERIENCE
TECHNOLOGY REPORT
OVERALL CONTENT USABILITY MOBILE MULTIMEDIA SOCIAL MEDIA ABOUT US IR GOVERNANCE MEDIA CSR CAREERS
SAP SAP Hewlett-Packard CapGemini Hewlett-Packard Hewlett-Packard Software AG Hewlett-Packard ASML Hewlett-Packard SAP SAP
73% 83% 70% 78% 64% 83% 75% 72% 96% 78% 83% 81%
Hewlett-Packard Hewlett-Packard Intel NetApp Intel NetApp Equinix SAP Nokia EMC Corporation Adobe Systems ARM Holdings
71% 80% 70% 72% 64% 74% 65% 72% 96% 70% 83% 81%
Intel Texas Instr. NetApp Cognizant SAP Cisco Systems SAP Ericsson Ericsson Software AG Repsol Hewlett-Packard
67% 76% 70% 67% 64% 74% 60% 67% 92% 70% 78% 78%
46% 49% 50% 19% 31% 39% 36% 44% 58% 48% 36% 50%
We help companies across the world communicate a better, more connected story across devices of all sizes through the digital channels that matter most to their audiences. We shape digital communications that engage audiences and make sure our clients’ stories gets told across web, mobile, apps and social.
The Investis Quarterly (IQ) benchmarking service allows publicly listed companies to measure the performance of their corporate website and their wider digital presence against their peers and best practice.
This is the most detailed and comprehensive analysis of digital corporate communications and the only one to cover the full spectrum of stakeholder needs. We have a dedicated team of analysts reviewing hundreds of websites across the world’s leading indices.
In total, over 1,600 corporate websites were scored on 200 criteria in the past year. We also produce ad-hoc reports for companies not covered by our rankings upon request.
ABOUT INVESTIS AND THE IQ RANKINGS
EXECUTIVE SUMMARY
Investis is one of the world’s leading providers of digital corporate communications services with over 1,700 listed clients globally and offices in the UK, the United States, Finland, Germany, Sweden and India.
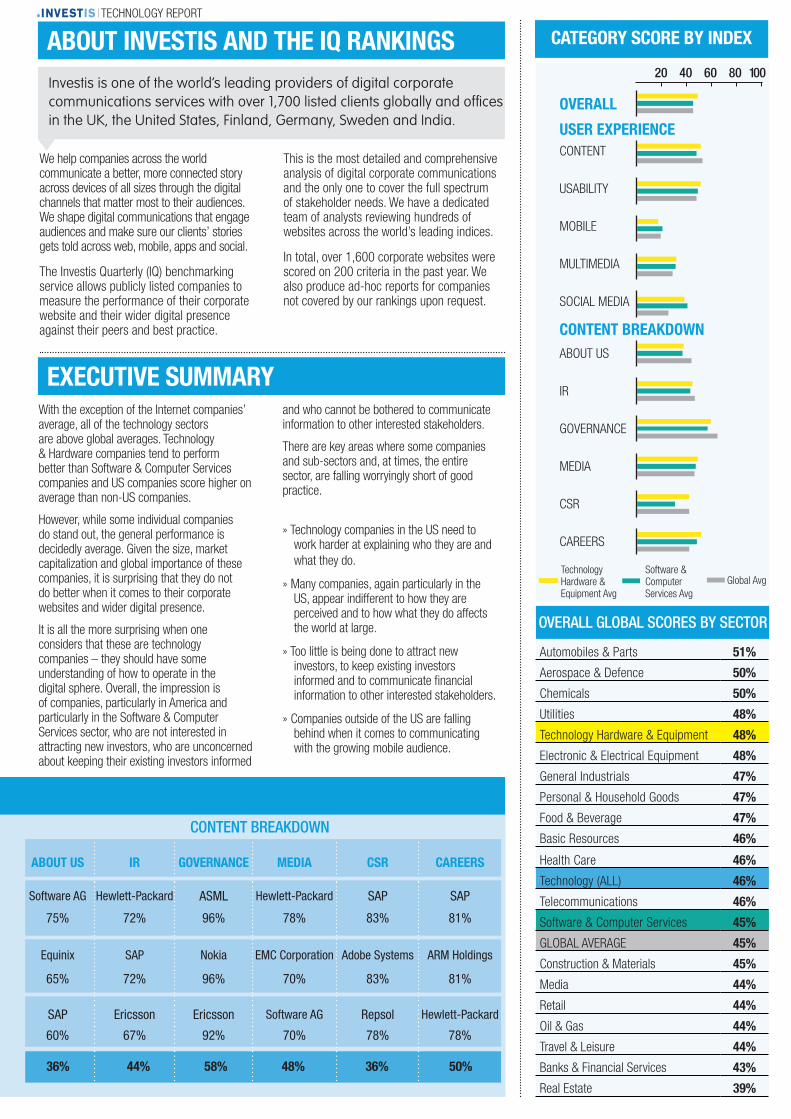
CATEGORY SCORE BY INDEX
CONTENT BREAKDOWN
20 40 60 80 100
ABOUT US
IR
GOVERNANCE
MEDIA
CSR
CAREERS
OVERALL
CONTENT
USABILITY
MOBILE
MULTIMEDIA
SOCIAL MEDIA
USER EXPERIENCE
OVERALL GLOBAL SCORES BY SECTOR
Automobiles & Parts 51%
Aerospace & Defence 50%
Chemicals 50%
Utilities 48%
Technology Hardware & Equipment 48%
Electronic & Electrical Equipment 48%
General Industrials 47%
Personal & Household Goods 47%
Food & Beverage 47%
Basic Resources 46%
Health Care 46%
Technology (ALL) 46%
Telecommunications 46%
Software & Computer Services 45%
GLOBAL AVERAGE 45%
Construction & Materials 45%
Media 44%
Retail 44%
Oil & Gas 44%
Travel & Leisure 44%
Banks & Financial Services 43%
Real Estate 39%
CONTENT BREAKDOWN
Technology Hardware & Equipment Avg
Global Avg
With the exception of the Internet companies’ average, all of the technology sectors are above global averages. Technology & Hardware companies tend to perform better than Software & Computer Services companies and US companies score higher on average than non-US companies.
However, while some individual companies do stand out, the general performance is decidedly average. Given the size, market capitalization and global importance of these companies, it is surprising that they do not do better when it comes to their corporate websites and wider digital presence.
It is all the more surprising when one considers that these are technology companies – they should have some understanding of how to operate in the digital sphere. Overall, the impression is of companies, particularly in America and particularly in the Software & Computer Services sector, who are not interested in attracting new investors, who are unconcerned about keeping their existing investors informed
and who cannot be bothered to communicate information to other interested stakeholders.
There are key areas where some companies and sub-sectors and, at times, the entire sector, are falling worryingly short of good practice.
» Technology companies in the US need to work harder at explaining who they are and what they do.
» Many companies, again particularly in the US, appear indifferent to how they are perceived and to how what they do affects the world at large.
» Too little is being done to attract new investors, to keep existing investors informed and to communicate financial information to other interested stakeholders.
» Companies outside of the US are falling behind when it comes to communicating with the growing mobile audience.
Software & Computer Services Avg

TECHNOLOGY REPORT
IQ RANKINGS – TECHNOLOGY SECTOR 2015
UK+44 20 7038 9000
USA+1 646 766 9000
GERMANY+49 931 35610
FINLAND+358 40 748 8864
SWEDEN+46 31 80 26 10
Scores are out of 100. Where the overall score is the same, rank has been determined using the Usability score as a secondary measure. 144 Technology companies were scored globally between Q4 2013 and Q4 2014.
2 Hewlett-Packard 71%1 SAP 73% 3 Intel 67%
1 SAP 73%
2 Hewlett-Packard 71%
3 Intel 67%
4 Qualcomm 65%
5 Cisco Systems 64%
6 Texas Instruments 64%
7 Ericsson 64%
8 EMC Corporation 63%
9 Microsoft 61%
10 Symantec 61%
11 ARM Holdings 61t%
12 Google Inc 60%
13 Infineon 60%
14 IBM 60%
15 ASML 60%
16 NetApp 59%
17 Oracle 59%
18 Motorola Solutions 59%
19 Nvidia 58%
20 Software AG 58%
21 Atos 58%
22 CapGemini 58%
23 Avnet 57%
24 Pace plc 57%
25 Citrix Systems 57%
26 Infosys 56%
27 Alcatel-Lucent 56%
28 Cognizant 55%
29 CA Technologies 55%
30 Seagate Technology 55%
31 Akamai Technologies 55%
32 Computacenter 54%
33 Automatic Data Processing 54%
34 eBay 54%
35 Applied Materials 54%
36 Cvent 53%
37 Broadcom 53%
38 Gemalto 53%
39 Intuit 53%
40 SanDisk 52%
41 Analog Devices 52%
42 Fiserv 52%
43 Xilinx 52%
44 Western Digital 51%
45 Altera 51%
46 CSR plc 51%
47 STMicroelectronics 51%
48 Qlik 50%
49 Ingram Micro 50%
50 Sage Group 50%
51 Equinix 50%
52 Ansys 50%
53 VMware 50%
54 Autodesk 50%
55 CommScope 49%
56 Stratasys 49%
57 Salesforce 49%
58 Cornerstone OnDemand 49%
59 Ciena 49%
60 Micron Technology 49%
61 KLA-Tencor 49%
62 comScore 48%
63 CDW 48%
64 Informatica 48%
65 IHS 48%
66 Maxim Integrated 47%
67 LinkedIn 47%
68 Yahoo 47%
69 Dialog Semiconductor 47%
70 Spirent Communications 47%
71 TelecityGroup 47%
72 Carphone Warehouse Group 46%
73 Micro Focus International 46%
74 Cree Inc. 46%
75 Groupon 46%
76 NXP Semiconductors 46%
77 Arrow Electronics 46%
78 inContact 45%
79 Nokia 45%
80 Imagination Technologies 45%
81 DigitalGlobe 45%
82 ViaSat 45%
83 Cerner Corp 45%
84 Concur Technologies 45%
85 Colt Group SA 45%
86 Logitech 44%
87 Dassault Systèmes 44%
88 Freescale Semiconductors 43%
89 Twitter 43%
90 AOL 43%
91 Synnex 43%
92 Anite 43%
93 ADTRAN 43%
94 Adobe Systems 43%
95 Harris Corporation 43%
96 Facebook 42%
97 Tibco 42%
98 Ingenico 42%
99 Wincor Nixdorf 42%
100 Calix 41%
Technology Hardware & EquipmentSoftware & Computer Services


