Embed Size (px)
Citation preview
www.harriswilliams.com
Member FINRA/SIPC
Technology, Telecom & Digital Media
Industry Update
September 2011
This report has been prepared by Harris Williams & Co. Ltd and approved by Sturgeon Ventures LLP in accordance with Conduct Of Business rules COBS 4 of the FSA Handbook. Harris
Williams & Co. Ltd is an authorized representative of Sturgeon Ventures LLP which is Authorized and Regulated by the Financial Services Authority. This report is being made by Harris
Williams & Co Ltd. Investment banking services are provided by Harris Williams LLC, a registered broker-dealer and member of FINRA and SIPC, and Harris Williams & Co. Lt. Harris
Williams & Co. is a trade name under which Harris Williams LLC and Harris Williams & Co. Ltd conduct business in the U.S. and Europe, respectively.

Table of ContentsTechnology, Telecom & Digital Media
What We've Been Reading…………………………………………………………………………………………1
Bellwethers……………………………………………………………………………………………2
TTDM Public Market Trading Statistics………………………………………………………………………..…………………..3
Recent TTDM M&A Activity…………………………………………………………………………………………….4
Recent U.S. TTDM Initial Public Offerings………………………………………………………………………….………………...………..5
Public and M&A Market Overview by Sector
Application Software…………………………………………………….…………………..6
Digital Media and Informatics………………………………………………..…………………..9
Infrastructure Software……………………………………………………..…………………..12
IT and Tech-Enabled Services………………………………………………………………..14
SaaS……………………………………………………………………………………………………..17
Tech Hardware……………………………………………………………………..…………………..19
Telecom………………………………………………………………………………………………..22
Selected HW&Co. TTDM Transactions…………………………………………………………………………………………..25
TTDM Group Overview and Disclosures…………………………………………………………………………………………..26
What We’ve Been Reading
1
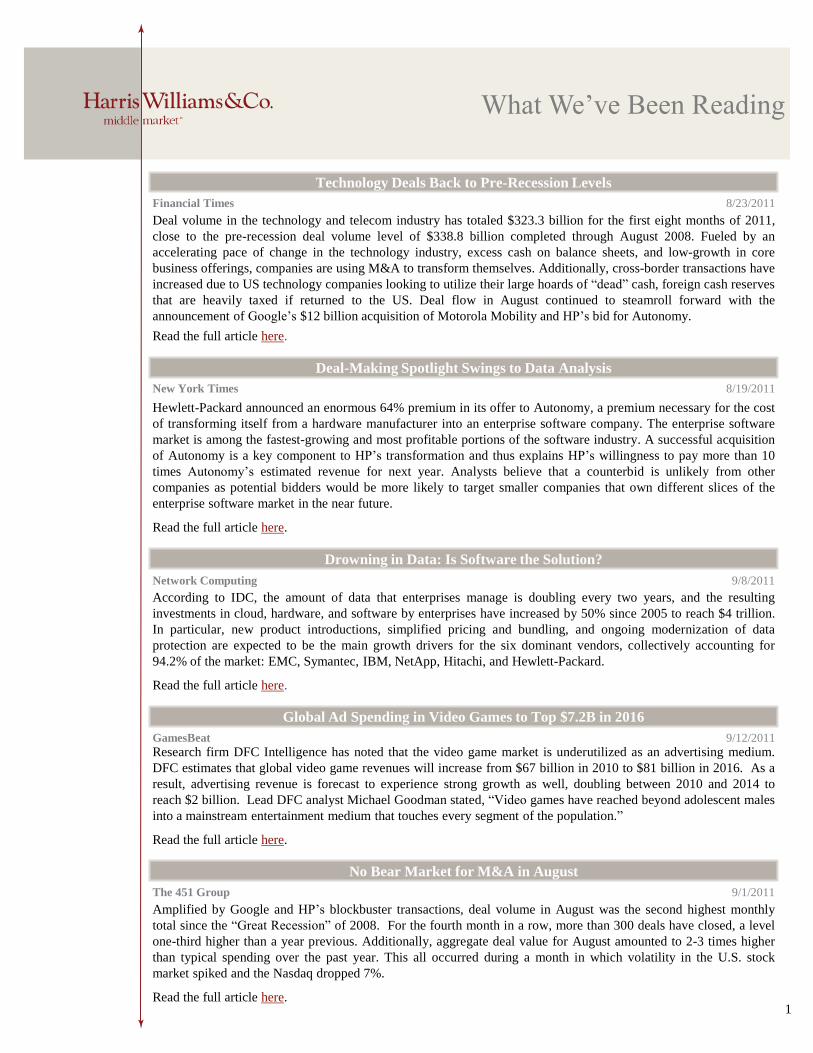
Hewlett-Packard announced an enormous 64% premium in its offer to Autonomy, a premium necessary for the cost
of transforming itself from a hardware manufacturer into an enterprise software company. The enterprise software
market is among the fastest-growing and most profitable portions of the software industry. A successful acquisition
of Autonomy is a key component to HP’s transformation and thus explains HP’s willingness to pay more than 10
times Autonomy’s estimated revenue for next year. Analysts believe that a counterbid is unlikely from other
companies as potential bidders would be more likely to target smaller companies that own different slices of the
enterprise software market in the near future.
Read the full article here.
Deal-Making Spotlight Swings to Data Analysis
New York Times 8/19/2011
Research firm DFC Intelligence has noted that the video game market is underutilized as an advertising medium.
DFC estimates that global video game revenues will increase from $67 billion in 2010 to $81 billion in 2016. As a
result, advertising revenue is forecast to experience strong growth as well, doubling between 2010 and 2014 to
reach $2 billion. Lead DFC analyst Michael Goodman stated, “Video games have reached beyond adolescent males
into a mainstream entertainment medium that touches every segment of the population.”
Read the full article here.
Global Ad Spending in Video Games to Top $7.2B in 2016
GamesBeat 9/12/2011
Amplified by Google and HP’s blockbuster transactions, deal volume in August was the second highest monthly
total since the “Great Recession” of 2008. For the fourth month in a row, more than 300 deals have closed, a level
one-third higher than a year previous. Additionally, aggregate deal value for August amounted to 2-3 times higher
than typical spending over the past year. This all occurred during a month in which volatility in the U.S. stock
market spiked and the Nasdaq dropped 7%.
Read the full article here.
No Bear Market for M&A in August
The 451 Group 9/1/2011
According to IDC, the amount of data that enterprises manage is doubling every two years, and the resulting
investments in cloud, hardware, and software by enterprises have increased by 50% since 2005 to reach $4 trillion.
In particular, new product introductions, simplified pricing and bundling, and ongoing modernization of data
protection are expected to be the main growth drivers for the six dominant vendors, collectively accounting for
94.2% of the market: EMC, Symantec, IBM, NetApp, Hitachi, and Hewlett-Packard.
Read the full article here.
Drowning in Data: Is Software the Solution?
Network Computing 9/8/2011
Deal volume in the technology and telecom industry has totaled $323.3 billion for the first eight months of 2011,
close to the pre-recession deal volume level of $338.8 billion completed through August 2008. Fueled by an
accelerating pace of change in the technology industry, excess cash on balance sheets, and low-growth in core
business offerings, companies are using M&A to transform themselves. Additionally, cross-border transactions have
increased due to US technology companies looking to utilize their large hoards of “dead” cash, foreign cash reserves
that are heavily taxed if returned to the US. Deal flow in August continued to steamroll forward with the
announcement of Google’s $12 billion acquisition of Motorola Mobility and HP’s bid for Autonomy.
Read the full article here.
Technology Deals Back to Pre-Recession Levels
Financial Times 8/23/2011

Public Market Trading StatisticsBellwethers
Stock
Performance
Last Twelve Months Last 30 Days
Comparable
Trading
Summary
2
Stock Price CY 2011P Multiples Summary LTM
Market As % of 52- Annual Growth Rates Enterprise Value/Revenue Enterprise Value/EBITDA
Company Capitalization Current Week High Revenue EBITDA LTM CY 2011P LTM CY 2011P
Bellwethers
Apple Inc. 352,239.0$ 379.94$ 93.9% 59.0% 77.6% 2.8x 2.3x 8.6x 7.2x
Microsoft Corporation 216,913.3 25.89 87.9% 9.6% 7.9% 2.4x 2.3x 5.6x 5.5x
International Business Machines Corporation 193,974.7 162.42 87.5% 8.7% 9.9% 2.0x 1.9x 8.0x 7.9x
Google Inc. 171,169.3 530.12 82.4% 28.8% 20.1% 4.1x 3.7x 10.7x 8.8x
Oracle Corporation 135,320.7 26.75 73.3% 16.6% 26.3% 3.4x 3.3x 8.4x 6.9x
Intel Corporation 106,490.3 20.28 84.6% 23.7% 14.1% 1.9x 1.7x 4.3x 4.1x
Amazon.com Inc. 98,304.2 216.56 95.2% 43.1% 2.0% 2.3x 1.9x 50.3x 36.0x
Samsung Electronics Co. Ltd. 93,607.9 719.31 76.9% NA NA 0.5x NA 3.2x NA
Cisco Systems, Inc. 88,498.0 16.09 65.4% 4.7% 4.8% 1.4x 1.4x 5.4x 4.5x
QUALCOMM Inc. 86,181.0 51.39 85.9% 36.9% 36.7% 4.9x 4.3x 12.4x 9.7x
SAP AG 57,637.2 48.45 77.1% 14.1% 20.1% 2.9x 3.0x 8.3x 8.7x
Hewlett-Packard Company 44,865.7 22.58 45.7% (0.8%) (8.0%) 0.5x 0.5x 3.2x 3.5x
EMC Corporation 44,664.8 21.63 75.3% 17.8% 15.2% 2.1x 2.0x 9.5x 7.2x
eBay Inc. 37,915.3 29.42 83.2% 26.3% 14.6% 3.3x 2.9x 11.0x 8.7x
Total Comp Set Median 95,956.0$ 82.8% 17.8% 14.6% 2.3x 2.3x 8.4x 7.2x
80%
90%
100%
110%
120%
130%
140%S
ep
-10
Oct-
10
No
v-1
0
Dec-1
0
Jan
-11
Feb
-11
Ma
r-1
1
Ap
r-1
1
Ma
y-1
1
Jun
-11
Jul-
11
Au
g-1
1
Sep
-11
Nasdaq Bellwethers
80%
85%
90%
95%
100%
105%
110%
08
/12
/11
08
/14
/11
08
/16
/11
08
/18
/11
08
/20
/11
08
/22
/11
08
/24
/11
08
/26
/11
08
/28
/11
08
/30
/11
09
/01
/11
09
/03
/11
09
/05
/11
09
/07
/11
09
/09
/11
09
/11
/11
Nasdaq Bellwethers
0%
20%
40%
60%
80%
100%
120%
Application Software Digital Media and
Informatics
Infrastructure Software IT and Tech-Enabled
Services
SaaS Technology Hardware Telecommunications
Comparable
Trading
Summary
3
Valuation
Summary
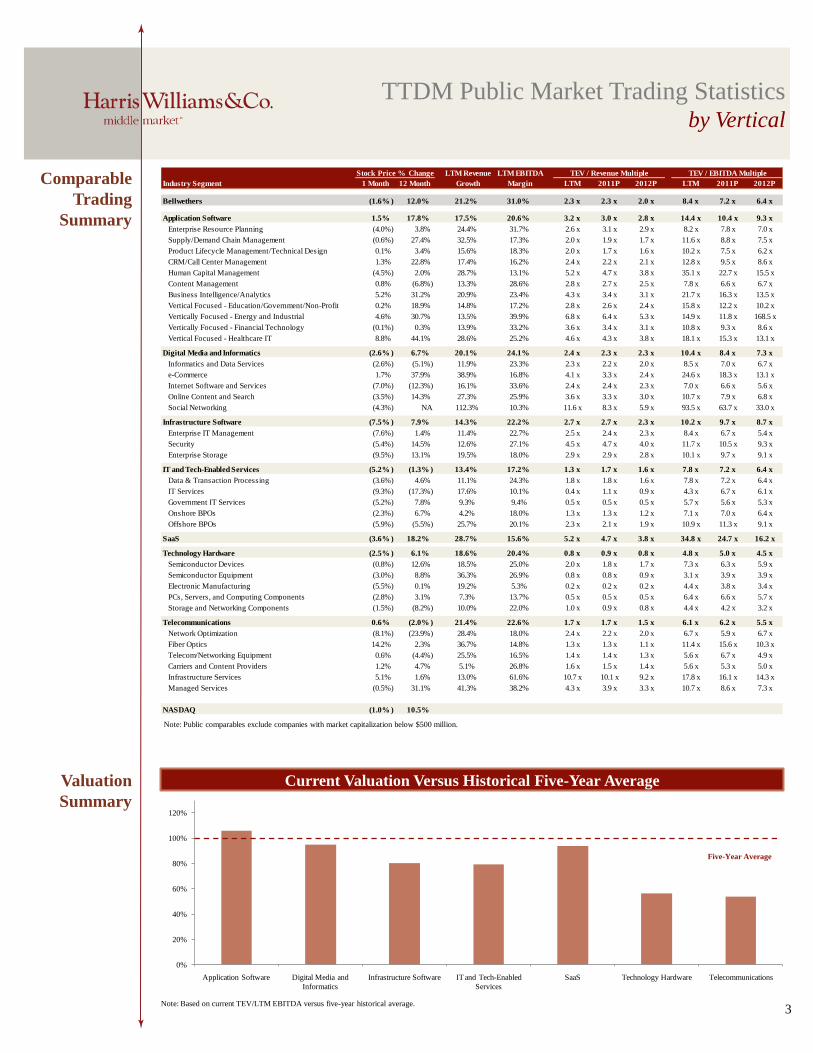
Current Valuation Versus Historical Five-Year Average
Five-Year Average
Note: Based on current TEV/LTM EBITDA versus five-year historical average.
Note: Public comparables exclude companies with market capitalization below $500 million.
TTDM Public Market Trading Statisticsby Vertical
LTM Revenue LTM EBITDA
Industry Segment 1 Month 12 Month Growth Margin LTM 2011P 2012P LTM 2011P 2012P
Bellwethers (1.6% ) 12.0% 21.2% 31.0% 2.3 x 2.3 x 2.0 x 8.4 x 7.2 x 6.4 x
Application Software 1.5% 17.8% 17.5% 20.6% 3.2 x 3.0 x 2.8 x 14.4 x 10.4 x 9.3 x
Enterprise Resource Planning (4.0%) 3.8% 24.4% 31.7% 2.6 x 3.1 x 2.9 x 8.2 x 7.8 x 7.0 x
Supply/Demand Chain Management (0.6%) 27.4% 32.5% 17.3% 2.0 x 1.9 x 1.7 x 11.6 x 8.8 x 7.5 x
Product Lifecycle Management/Technical Design 0.1% 3.4% 15.6% 18.3% 2.0 x 1.7 x 1.6 x 10.2 x 7.5 x 6.2 x
CRM/Call Center Management 1.3% 22.8% 17.4% 16.2% 2.4 x 2.2 x 2.1 x 12.8 x 9.5 x 8.6 x
Human Capital Management (4.5%) 2.0% 28.7% 13.1% 5.2 x 4.7 x 3.8 x 35.1 x 22.7 x 15.5 x
Content Management 0.8% (6.8%) 13.3% 28.6% 2.8 x 2.7 x 2.5 x 7.8 x 6.6 x 6.7 x
Business Intelligence/Analytics 5.2% 31.2% 20.9% 23.4% 4.3 x 3.4 x 3.1 x 21.7 x 16.3 x 13.5 x
Vertical Focused - Education/Government/Non-Profit 0.2% 18.9% 14.8% 17.2% 2.8 x 2.6 x 2.4 x 15.8 x 12.2 x 10.2 x
Vertically Focused - Energy and Industrial 4.6% 30.7% 13.5% 39.9% 6.8 x 6.4 x 5.3 x 14.9 x 11.8 x 168.5 x
Vertically Focused - Financial Technology (0.1%) 0.3% 13.9% 33.2% 3.6 x 3.4 x 3.1 x 10.8 x 9.3 x 8.6 x
Vertical Focused - Healthcare IT 8.8% 44.1% 28.6% 25.2% 4.6 x 4.3 x 3.8 x 18.1 x 15.3 x 13.1 x
Digital Media and Informatics (2.6% ) 6.7% 20.1% 24.1% 2.4 x 2.3 x 2.3 x 10.4 x 8.4 x 7.3 x
Informatics and Data Services (2.6%) (5.1%) 11.9% 23.3% 2.3 x 2.2 x 2.0 x 8.5 x 7.0 x 6.7 x
e-Commerce 1.7% 37.9% 38.9% 16.8% 4.1 x 3.3 x 2.4 x 24.6 x 18.3 x 13.1 x
Internet Software and Services (7.0%) (12.3%) 16.1% 33.6% 2.4 x 2.4 x 2.3 x 7.0 x 6.6 x 5.6 x
Online Content and Search (3.5%) 14.3% 27.3% 25.9% 3.6 x 3.3 x 3.0 x 10.7 x 7.9 x 6.8 x
Social Networking (4.3%) NA 112.3% 10.3% 11.6 x 8.3 x 5.9 x 93.5 x 63.7 x 33.0 x
Infrastructure Software (7.5% ) 7.9% 14.3% 22.2% 2.7 x 2.7 x 2.3 x 10.2 x 9.7 x 8.7 x
Enterprise IT Management (7.6%) 1.4% 11.4% 22.7% 2.5 x 2.4 x 2.3 x 8.4 x 6.7 x 5.4 x
Security (5.4%) 14.5% 12.6% 27.1% 4.5 x 4.7 x 4.0 x 11.7 x 10.5 x 9.3 x
Enterprise Storage (9.5%) 13.1% 19.5% 18.0% 2.9 x 2.9 x 2.8 x 10.1 x 9.7 x 9.1 x
IT and Tech-Enabled Services (5.2% ) (1.3% ) 13.4% 17.2% 1.3 x 1.7 x 1.6 x 7.8 x 7.2 x 6.4 x
Data & Transaction Processing (3.6%) 4.6% 11.1% 24.3% 1.8 x 1.8 x 1.6 x 7.8 x 7.2 x 6.4 x
IT Services (9.3%) (17.3%) 17.6% 10.1% 0.4 x 1.1 x 0.9 x 4.3 x 6.7 x 6.1 x
Government IT Services (5.2%) 7.8% 9.3% 9.4% 0.5 x 0.5 x 0.5 x 5.7 x 5.6 x 5.3 x
Onshore BPOs (2.3%) 6.7% 4.2% 18.0% 1.3 x 1.3 x 1.2 x 7.1 x 7.0 x 6.4 x
Offshore BPOs (5.9%) (5.5%) 25.7% 20.1% 2.3 x 2.1 x 1.9 x 10.9 x 11.3 x 9.1 x
SaaS (3.6% ) 18.2% 28.7% 15.6% 5.2 x 4.7 x 3.8 x 34.8 x 24.7 x 16.2 x
Technology Hardware (2.5% ) 6.1% 18.6% 20.4% 0.8 x 0.9 x 0.8 x 4.8 x 5.0 x 4.5 x
Semiconductor Devices (0.8%) 12.6% 18.5% 25.0% 2.0 x 1.8 x 1.7 x 7.3 x 6.3 x 5.9 x
Semiconductor Equipment (3.0%) 8.8% 36.3% 26.9% 0.8 x 0.8 x 0.9 x 3.1 x 3.9 x 3.9 x
Electronic Manufacturing (5.5%) 0.1% 19.2% 5.3% 0.2 x 0.2 x 0.2 x 4.4 x 3.8 x 3.4 x
PCs, Servers, and Computing Components (2.8%) 3.1% 7.3% 13.7% 0.5 x 0.5 x 0.5 x 6.4 x 6.6 x 5.7 x
Storage and Networking Components (1.5%) (8.2%) 10.0% 22.0% 1.0 x 0.9 x 0.8 x 4.4 x 4.2 x 3.2 x
Telecommunications 0.6% (2.0% ) 21.4% 22.6% 1.7 x 1.7 x 1.5 x 6.1 x 6.2 x 5.5 x
Network Optimization (8.1%) (23.9%) 28.4% 18.0% 2.4 x 2.2 x 2.0 x 6.7 x 5.9 x 6.7 x
Fiber Optics 14.2% 2.3% 36.7% 14.8% 1.3 x 1.3 x 1.1 x 11.4 x 15.6 x 10.3 x
Telecom/Networking Equipment 0.6% (4.4%) 25.5% 16.5% 1.4 x 1.4 x 1.3 x 5.6 x 6.7 x 4.9 x
Carriers and Content Providers 1.2% 4.7% 5.1% 26.8% 1.6 x 1.5 x 1.4 x 5.6 x 5.3 x 5.0 x
Infrastructure Services 5.1% 1.6% 13.0% 61.6% 10.7 x 10.1 x 9.2 x 17.8 x 16.1 x 14.3 x
Managed Services (0.5%) 31.1% 41.3% 38.2% 4.3 x 3.9 x 3.3 x 10.7 x 8.6 x 7.3 x
NASDAQ (1.0% ) 10.5%
Stock Price % Change TEV / Revenue Multiple TEV / EBITDA Multiple
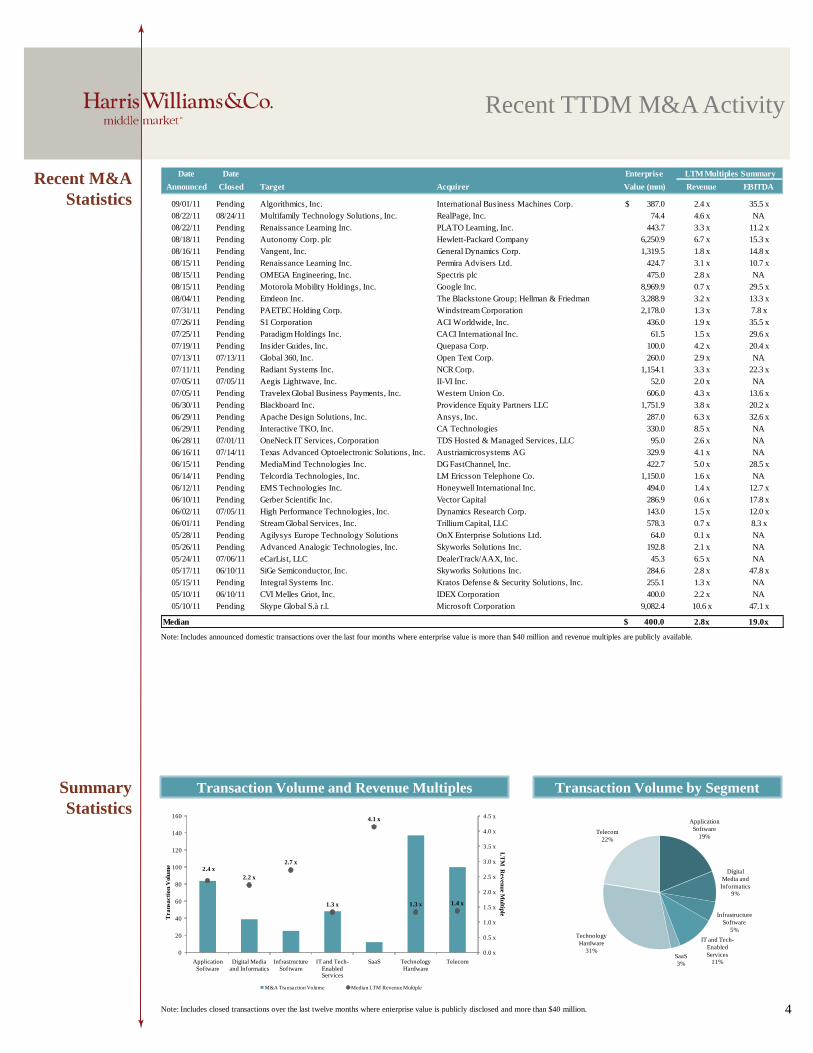
Date Date Enterprise LTM Multiples Summary
Announced Closed Target Acquirer Value (mm) Revenue EBITDA
09/01/11 Pending Algorithmics, Inc. International Business Machines Corp. 387.0$ 2.4 x 35.5 x
08/22/11 08/24/11 Multifamily Technology Solutions, Inc. RealPage, Inc. 74.4 4.6 x NA
08/22/11 Pending Renaissance Learning Inc. PLATO Learning, Inc. 443.7 3.3 x 11.2 x
08/18/11 Pending Autonomy Corp. plc Hewlett-Packard Company 6,250.9 6.7 x 15.3 x
08/16/11 Pending Vangent, Inc. General Dynamics Corp. 1,319.5 1.8 x 14.8 x
08/15/11 Pending Renaissance Learning Inc. Permira Advisers Ltd. 424.7 3.1 x 10.7 x
08/15/11 Pending OMEGA Engineering, Inc. Spectris plc 475.0 2.8 x NA
08/15/11 Pending Motorola Mobility Holdings, Inc. Google Inc. 8,969.9 0.7 x 29.5 x
08/04/11 Pending Emdeon Inc. The Blackstone Group; Hellman & Friedman 3,288.9 3.2 x 13.3 x
07/31/11 Pending PAETEC Holding Corp. Windstream Corporation 2,178.0 1.3 x 7.8 x
07/26/11 Pending S1 Corporation ACI Worldwide, Inc. 436.0 1.9 x 35.5 x
07/25/11 Pending Paradigm Holdings Inc. CACI International Inc. 61.5 1.5 x 29.6 x
07/19/11 Pending Insider Guides, Inc. Quepasa Corp. 100.0 4.2 x 20.4 x
07/13/11 07/13/11 Global 360, Inc. Open Text Corp. 260.0 2.9 x NA
07/11/11 Pending Radiant Systems Inc. NCR Corp. 1,154.1 3.3 x 22.3 x
07/05/11 07/05/11 Aegis Lightwave, Inc. II-VI Inc. 52.0 2.0 x NA
07/05/11 Pending Travelex Global Business Payments, Inc. Western Union Co. 606.0 4.3 x 13.6 x
06/30/11 Pending Blackboard Inc. Providence Equity Partners LLC 1,751.9 3.8 x 20.2 x
06/29/11 Pending Apache Design Solutions, Inc. Ansys, Inc. 287.0 6.3 x 32.6 x
06/29/11 Pending Interactive TKO, Inc. CA Technologies 330.0 8.5 x NA
06/28/11 07/01/11 OneNeck IT Services, Corporation TDS Hosted & Managed Services, LLC 95.0 2.6 x NA
06/16/11 07/14/11 Texas Advanced Optoelectronic Solutions, Inc. Austriamicrosystems AG 329.9 4.1 x NA
06/15/11 Pending MediaMind Technologies Inc. DG FastChannel, Inc. 422.7 5.0 x 28.5 x
06/14/11 Pending Telcordia Technologies, Inc. LM Ericsson Telephone Co. 1,150.0 1.6 x NA
06/12/11 Pending EMS Technologies Inc. Honeywell International Inc. 494.0 1.4 x 12.7 x
06/10/11 Pending Gerber Scientific Inc. Vector Capital 286.9 0.6 x 17.8 x
06/02/11 07/05/11 High Performance Technologies, Inc. Dynamics Research Corp. 143.0 1.5 x 12.0 x
06/01/11 Pending Stream Global Services, Inc. Trillium Capital, LLC 578.3 0.7 x 8.3 x
05/28/11 Pending Agilysys Europe Technology Solutions OnX Enterprise Solutions Ltd. 64.0 0.1 x NA
05/26/11 Pending Advanced Analogic Technologies, Inc. Skyworks Solutions Inc. 192.8 2.1 x NA
05/24/11 07/06/11 eCarList, LLC DealerTrack/AAX, Inc. 45.3 6.5 x NA
05/17/11 06/10/11 SiGe Semiconductor, Inc. Skyworks Solutions Inc. 284.6 2.8 x 47.8 x
05/15/11 Pending Integral Systems Inc. Kratos Defense & Security Solutions, Inc. 255.1 1.3 x NA
05/10/11 06/10/11 CVI Melles Griot, Inc. IDEX Corporation 400.0 2.2 x NA
05/10/11 Pending Skype Global S.à r.l. Microsoft Corporation 9,082.4 10.6 x 47.1 x
Median 400.0$ 2.8x 19.0x
Recent M&A
Statistics
4
Note: Includes announced domestic transactions over the last four months where enterprise value is more than $40 million and revenue multiples are publicly available.
Transaction Volume and Revenue Multiples Transaction Volume by SegmentSummary
Statistics
Recent TTDM M&A Activity
Note: Includes closed transactions over the last twelve months where enterprise value is publicly disclosed and more than $40 million.
2.4 x
2.2 x
2.7 x
1.3 x
4.1 x
1.3 x 1.4 x
0.0 x
0.5 x
1.0 x
1.5 x
2.0 x
2.5 x
3.0 x
3.5 x
4.0 x
4.5 x
0
20
40
60
80
100
120
140
160
Application Software
Digital Media and Informatics
Infrastructure Software
IT and Tech-Enabled Services
SaaS Technology Hardware
Telecom
LT
M R
ev
en
ue M
ultip
le
Tra
nsa
cti
on
Volu
me
M&A Transaction Volume Median LTM Revenue Multiple
Application
Software
19%
Digital
Media and
Informatics9%
Infrastructure
Software
5%
IT and Tech-
Enabled
Services11%
SaaS
3%
Technology
Hardware
31%
Telecom
22%

($ in millions) IPO Details Financials at IPO (LTM) Trading Multiples
Gross Offering % Post-IPO EBITDA 1YR Rev. TEV/LTM TEV/LTM
Date Company Amount Secondary Perf. Revenue Margin Growth Revenue EBITDA
07/26/11 Tangoe, Inc. 87.7$ 14.5% 25.9% 84.2$ 7.7% 36.0% 6.0x 77.8x
07/19/11 Zillow, Inc. 69.2 0.0% 84.7% 44.9 2.8% 156.7% 22.3x NM
06/28/11 HomeAway, Inc. 216.0 25.9% 49.9% 183.7 17.1% 52.8% 19.9x 116.1x
06/16/11 Bankrate, Inc. 300.0 37.5% 5.5% 285.2 32.6% 123.5% 7.3x 22.5x
06/14/11 Pandora Media, Inc. 234.9 59.1% (35.1%) 167.2 NM 203.0% 9.8x NM
06/08/11 Fusion-io, Inc. 233.7 12.6% 3.2% 136.4 NM 1,244.2% 11.9x NM
05/25/11 The Active Network, Inc. 165.0 25.3% (4.0%) 289.1 5.2% 19.0% 4.0x 77.6x
05/25/11 Freescale Semiconductor Holdings I, Ltd. 783.0 0.0% (38.0%) 4,632.0 23.1% 25.6% 2.0x 8.7x
05/18/11 LinkedIn Corporation 352.8 38.4% 83.8% 292.3 13.0% 143.3% 26.9x 207.5x
05/03/11 Boingo Wireless, Inc. 77.9 33.3% (39.8%) 82.9 21.9% 26.2% 4.3x 19.8x
04/20/11 Responsys, Inc. 79.4 16.9% 7.3% 104.8 18.0% 57.3% 6.3x 34.8x
04/14/11 Ellie Mae, Inc. 45.0 33.3% (12.2%) 45.0 8.0% 23.3% 3.9x 48.9x
03/16/11 Cornerstone OnDemand, Inc. 136.5 28.6% (3.4%) 43.7 NM 49.1% 15.8x NM
03/10/11 MagnaChip Semiconductor Corporation 133.0 90.0% (39.7%) 770.4 19.8% 37.6% 0.5x 2.7x
Median 150.8$ 27.2% (0.1% ) 151.8$ 17.1% 51.0% 6.8x 41.9x
Recent IPO
Statistics
5
Note: Includes major U.S. exchanges and transactions for companies located in the United States over the last six months.
Number of Transactions by Tier Percentage of Transactions by Tier
Tier by Market Capitalization on IPO Pricing Date
$0 - $250M $250M - $500M $500M - $1,000M $1,000M - $2,000M $2,000M +
Recent U.S. TTDM Initial Public Offerings
0
10
20
30
40
50
60
2005 2006 2007 2008 2009 2010 2011 YTD
0%
10%
20%
30%
40%
50%
60%
70%
80%
90%
100%
2005 2006 2007 2008 2009 2010 2011 YTD
Note: Includes major U.S. exchanges and transactions for companies located in the United States.

Public Market Trading StatisticsApplication Software
6
Stock
Performance
Last Twelve Months Last 30 Days
Comparable
Trading
Summary
70%
80%
90%
100%
110%
120%
130%
140%
150%S
ep
-10
Oct-
10
No
v-1
0
Dec-1
0
Jan
-11
Feb
-11
Ma
r-1
1
Ap
r-1
1
Ma
y-1
1
Jun
-11
Jul-
11
Au
g-1
1
Sep
-11
Nasdaq Application Software
80%
85%
90%
95%
100%
105%
110%
08
/12
/11
08
/14
/11
08
/16
/11
08
/18
/11
08
/20
/11
08
/22
/11
08
/24
/11
08
/26
/11
08
/28
/11
08
/30
/11
09
/01
/11
09
/03
/11
09
/05
/11
09
/07
/11
09
/09
/11
09
/11
/11
Nasdaq Application Software
($ in millions) Stock Price CY 2011P Multiples Summary LTM
Market As % of 52- Annual Growth Rates Enterprise Value/Revenue Enterprise Value/EBITDA
Company Capitalization Current Week High Revenue EBITDA LTM CY 2011P LTM CY 2011P
Enterprise Resource Planning 31,408.4$ -$ 0.8$ 0.2$ 0.2$ 2.6$ 3.1$ 8.2$ 7.8$
Oracle Corporation 135,320.7$ 26.75$ 73.3% 16.6% 26.3% 3.4x 3.3x 8.4x 6.9x
SAP AG 57,637.2 48.45 77.1% 14.1% 20.1% 2.9x 3.0x 8.3x 8.7x
Sage Group plc 5,179.6 3.93 81.4% NA NA 2.3x NA 8.2x NA
Exact Holding NV 570.0 24.98 76.5% NA NA 1.6x NA 7.0x NA
Median 31,408.4$ 76.8% 15.4% 23.2% 2.6x 3.1x 8.2x 7.8x
Supply/Demand Chain Management 1,035.2$ -$ 0.7$ 0.1$ 0.2$ 2.0$ 1.9$ 11.6$ 8.8$
Ariba Inc. 2,500.9$ 26.79$ 72.1% 30.6% 22.2% 5.1x 4.8x 70.1x 23.0x
JDA Software Group Inc. 1,035.2 24.34 69.5% 10.1% 10.5% 1.6x 1.5x 6.6x 5.9x
Manhattan Associates, Inc. 725.8 34.31 86.4% 10.0% 25.4% 2.0x 1.9x 11.6x 8.8x
Median 1,035.2$ 72.1% 10.1% 22.2% 2.0x 1.9x 11.6x 8.8x
Product Lifecycle Management/Technical Design
Dassault Systemes SA 8,650.6$ 71.25$ 83.1% NA NA 2.9x NA 9.7x NA
Autodesk, Inc. 6,114.2 26.72 57.9% 13.5% 23.9% 2.2x 2.1x 10.8x 7.5x
Synopsys Inc. 3,634.5 25.23 86.0% 10.2% 14.7% 1.7x 1.7x 8.3x 5.9x
Cadence Design Systems Inc. 2,428.7 9.03 81.5% 21.8% 75.7% 2.2x 2.1x 17.1x 8.6x
Parametric Technology Corporation 1,902.5 16.20 64.0% 18.0% 31.4% 1.7x 1.6x 11.6x 7.5x
Mentor Graphics Corporation 1,123.1 10.23 61.8% 11.6% 33.1% 1.2x 1.2x 7.6x 6.1x
Median 3,031.6$ 72.8% 13.5% 31.4% 2.0x 1.7x 10.2x 7.5x
CRM/Call Center Management
Salesforce.com 16,766.8$ 123.74$ 77.3% 35.1% 29.8% 8.2x 7.2x 138.8x 40.2x
Nuance Communications, Inc. 5,393.6 17.65 77.0% 14.3% 9.3% 4.6x 4.1x 21.7x 10.5x
Amdocs Ltd. 4,880.8 26.98 84.3% 6.2% (1.1%) 1.2x 1.2x 6.3x 5.7x
NICE Systems Ltd. 1,803.1 28.59 80.9% 15.9% 36.2% 1.5x 1.4x 9.5x 5.6x
Comverse Technology Inc. 1,425.0 6.95 84.4% 5.4% NM 1.0x 1.0x 11.9x 7.4x
Rightnow Technologies Inc. 1,061.7 31.93 87.0% 22.6% 23.7% 4.7x 4.3x 46.1x 31.7x
Verint Systems Inc. 1,047.4 27.00 70.9% 8.4% (9.5%) 2.4x 2.2x 12.8x 9.5x
Median 1,803.1$ 80.9% 14.3% 16.5% 2.4x 2.2x 12.8x 9.5x
Human Capital Management
Concur Technologies, Inc. 2,077.1$ 38.47$ 66.1% 20.4% 18.8% 5.2x 4.7x 35.1x 16.6x
SuccessFactors, Inc. 1,814.6 21.75 53.8% 55.3% 43.2% 6.2x 5.0x NM 128.3x
Ultimate Software Group, Inc. 1,262.2 48.81 80.8% 18.5% 21.2% 4.9x 4.5x 57.3x 28.7x
Taleo Corporation 1,056.5 25.57 66.8% 35.1% 45.5% 3.3x 2.8x 25.4x 12.6x
Cornerstone OnDemand, Inc. 583.0 12.13 51.6% NA NA 9.3x 6.9x NM NM
Median 1,262.2$ 66.1% 27.7% 32.2% 5.2x 4.7x 35.1x 22.7x

Comparable
Trading
Summary
(continued)
Public Market Trading StatisticsApplication Software
7
($ in millions) Stock Price CY 2011P Multiples Summary LTM
Market As % of 52- Annual Growth Rates Enterprise Value/Revenue Enterprise Value/EBITDA
Company Capitalization Current Week High Revenue EBITDA LTM CY 2011P LTM CY 2011P
Content Management
Adobe Systems Inc. 12,445.4$ 25.20$ 70.0% 9.7% 13.4% 2.8x 2.7x 7.8x 6.6x
Open Text Corporation 3,177.4 55.42 76.6% 23.6% 18.9% 3.1x 2.8x 10.8x 9.3x
Blue Coat Systems Inc. 651.1 15.40 47.8% (11.4%) (39.5%) 0.8x 0.9x 5.1x 5.9x
Median 3,177.4$ 70.0% 9.7% 13.4% 2.8x 2.7x 7.8x 6.6x
Business Intelligence/Analytics
Autonomy Corporation plc 9,675.5$ 39.80$ 98.7% NA NA 10.3x NA 23.4x NA
Teradata Corporation 8,260.2 49.08 78.3% 20.4% 19.5% 3.7x 3.4x 16.7x 13.8x
Informatica Corporation 4,158.4 38.98 62.4% 23.4% 37.7% 5.0x 4.6x 20.2x 16.3x
MicroStrategy Inc. 1,133.0 105.79 59.2% 30.0% (28.5%) 1.8x 1.7x 23.1x 22.9x
Median 6,209.3$ 70.4% 23.4% 19.5% 4.3x 3.4x 21.7x 16.3x
Vertical Focused - Education/Government/Non-Profit
Blackboard Inc. 1,552.0$ 44.17$ 87.9% 20.0% 9.8% 3.5x 3.1x 21.2x 14.2x
Blackbaud Inc. 1,012.4 23.37 76.9% 15.1% 13.1% 2.8x 2.6x 14.4x 10.9x
K12, Inc. 929.0 26.02 65.5% 27.6% 35.1% 1.9x 1.6x 16.3x 10.4x
Tyler Technologies, Inc. 780.8 24.58 89.2% 5.6% 8.9% 2.7x 2.6x 15.2x 13.4x
Median 970.7$ 82.4% 17.5% 11.4% 2.8x 2.6x 15.8x 12.2x
Vertically Focused - Energy and Industrial
Ansys, Inc. 4,723.2$ 51.21$ 89.1% 19.3% 13.5% 6.8x 6.2x 13.8x 11.8x
Aveva Group plc 1,617.9 23.85 83.7% NA NA 4.9x NA 16.0x NA
Aspen Technology Inc. 1,505.1 16.01 89.5% 23.6% NA 7.0x 6.6x NM NM
Median 1,617.9$ 89.1% 21.4% 13.5% 6.8x 6.4x 14.9x 11.8x
Vertically Focused - Financial Technology
Intuit Inc. 14,227.2$ 46.80$ 82.9% 13.1% 22.5% 3.6x 3.4x 10.8x 9.2x
MSCI Inc. 3,876.6 32.18 78.9% 38.5% 43.5% 7.3x 5.3x 16.4x 11.4x
DST Systems Inc. 1,996.4 42.90 72.2% 10.9% (6.9%) 0.5x 0.7x 3.2x 3.0x
SS&C Technologies Holdings, Inc. 1,234.2 15.68 71.4% 12.8% 15.5% 3.9x 3.7x 10.6x 9.3x
Advent Software, Inc. 1,160.6 22.20 70.2% 14.6% 27.9% 3.6x 3.4x 17.2x 12.1x
Median 1,996.4$ 72.2% 13.1% 22.5% 3.6x 3.4x 10.8x 9.3x
Vertical Focused - Healthcare IT
Cerner Corporation 10,870.1$ 64.30$ 94.4% 14.2% 21.6% 5.0x 4.7x 18.9x 14.8x
Allscripts Healthcare Solutions, Inc. 3,239.6 17.24 74.5% 14.5% 30.6% 2.8x 2.5x 16.8x 9.7x
Quality Systems Inc. 2,661.2 90.84 95.6% 23.5% 35.7% 6.8x 6.2x 22.6x 18.8x
athenahealth, Inc. 2,117.4 60.52 94.9% 31.9% 57.7% 7.1x 6.2x 42.0x 29.5x
HMS Holdings Corporation 2,115.8 24.97 88.3% 24.6% 28.2% 5.9x 5.3x 21.3x 17.8x
Emdeon Inc. 1,712.9 18.78 99.7% 12.9% 12.6% 2.6x 2.5x 11.1x 9.3x
Computer Programs & Systems Inc. 739.2 66.82 84.5% 22.3% 57.1% 4.1x 3.9x 17.4x 15.8x
MedAssets, Inc. 576.9 9.80 43.6% 42.4% 42.9% 3.1x 2.6x 11.1x 8.1x
Median 2,116.6$ 91.4% 22.9% 33.1% 4.6x 4.3x 18.1x 15.3x
Total Application Software Median 1,949.4$ 77.2% 17.3% 22.4% 3.2x 3.0x 14.4x 10.4x
Note: Public comparables exclude companies with market capitalization below $500 million.

2.1x2.2x
2.1x
2.8x
2.6x2.5x
2.8x
1.2x
2.0x
2.5x
0.0x
0.5x
1.0x
1.5x
2.0x
2.5x
3.0x
3.5x
0
25
50
75
100
125
150
175
2002 2003 2004 2005 2006 2007 2008 2009 2010 2011 YTD
LT
M R
even
ue M
ultip
leTra
nsa
ctio
n V
olu
me
Transaction Volume Median LTM Revenue Multiple
Date Date Enterprise LTM Multiples
Announced Closed Target Acquirer Value (mm) Revenue EBITDA
09/01/11 Pending Algorithmics, Inc. International Business Machines Corp. 387.0$ 2.4 x 35.5 x
08/18/11 Pending Autonomy Corp. plc Hewlett-Packard Company 10,300.6 11.1x 25.2x
08/13/11 Pending Loquendo S.p.A. Nuance Communications, Inc. 75.5 NA NA
08/04/11 Pending Emdeon Inc. The Blackstone Group; Hellman & Friedman 3,304.8 3.1x 13.1x
08/04/11 Pending Sungard Higher Education, Inc. Datatel, Inc. 1,775.0 NA NA
08/02/11 Pending Carnegie Learning, Inc. Apollo Group Inc. 75.0 NA NA
07/26/11 08/11/11 Seismic Micro-Technology, Inc. IHS Inc. 500.0 NA NA
07/13/11 07/13/11 Global 360, Inc. Open Text Corp. 260.0 2.9x NA
07/11/11 Pending Multimodal Technologies, Inc. MedQuist Holdings Inc. 132.6 NA NA
07/10/11 Pending Vetstreet Vicar Operating, Inc. 146.0 NA NA
06/30/11 Pending Blackboard Inc. Providence Equity Partners LLC 1,767.1 3.7x 22.3x
06/29/11 08/01/11 Apache Design Solutions, Inc. Ansys, Inc. 287.0 6.3x 32.6x
06/28/11 Pending Medical Present Value, Inc. Experian plc 185.0 NA NA
06/26/11 Pending Fundtech Ltd. S1 Corporation 228.4 1.6x 10.8x
06/22/11 07/26/11 Portico Systems, Inc. McKesson Health Solutions LLC 90.0 NA NA
06/16/11 06/16/11 SVOX AG Nuance Communications, Inc. 123.1 NA NA
06/14/11 Pending Telcordia Technologies, Inc. LM Ericsson Telephone Co. 1,150.0 1.6x NA
06/13/11 06/17/11 Health Risk Partners LLC Verisk Analytics, Inc. 60.0 NA NA
06/09/11 Pending Fundamo Limited Visa, Inc. 110.0 NA NA
06/07/11 07/19/11 Mamut ASA Visma ASA 161.8 1.7x 13.6x
05/15/11 06/02/11 Iron Mountain Inc., Digital Division Autonomy Corp. plc 380.0 NA NA
05/10/11 06/15/11 Equitrac Corporation Nuance Communications, Inc. 157.0 NA NA
05/08/11 06/30/11 Tekla Oyj Trimble Finland Oy 426.8 4.9x 22.5x
05/04/11 06/23/11 Entraction Holding AB International Game Technology 88.7 1.7x 17.3x
04/27/11 06/15/11 Vital Images, Inc. Toshiba Medical Systems Corporation 151.3 2.5x 94.0x
04/27/11 04/27/11 Bloodhound Technologies, Inc. Verisk Analytics, Inc. 82.0 NA NA
04/26/11 05/31/11 SchoolNet, Inc. Pearson plc 230.0 NA NA
04/23/11 06/14/11 Explore Information Services, L.L.C. Audatex North America, Inc. 520.0 6.8x 15.3x
04/19/11 06/01/11 DadaNet S.p.A. Buongiorno SpA 44.4 0.4x 3.1x
04/12/11 06/01/11 ARGUS Software, Inc. Altus Group Limited 130.0 NA NA
04/06/11 05/31/11 MKS Inc. Parametric Technology Corporation 280.8 4.1x 21.0x
04/04/11 05/13/11 Epicor Software Corporation Apax Partners LLP 951.5 2.1x 17.5x
03/29/11 04/01/11 Allegient Systems, Inc. Bottomline Technologies Inc. 52.8 3.7x 17.7x
03/28/11 03/28/11 Access UK Ltd. Lyceum Capital Partners LLP 80.2 1.8x 9.1x
03/24/11 04/12/11 Mortgagebot LLC Davis + Henderson Corporation 231.8 6.1x 11.5x
03/16/11 03/16/11 Intercim, LLC Dassault Systemes SA 44.5 NA NA
03/11/11 07/05/11 Lawson Software, Inc. Golden Gate Capital; Infor Global Solutions, Inc. 1,779.4 2.4x 13.2x
Median 185.0$ 2.7x 17.4x
Recent M&A
Activity
8
Comparable TransactionsApplication Software
Summary
Statistics
M&A Transaction Volume and Revenue Multiples
Note: Includes announced transactions over the last six months where enterprise value is publicly disclosed and more than $40 million.
Note: Includes closed transactions where enterprise value is publicly disclosed and more than $40 million.
Stock
Performance
Public Market Trading StatisticsDigital Media and Informatics
9
Comparable
Trading
Summary
Last Twelve Months Last 30 Days
70%
80%
90%
100%
110%
120%
130%
140%
150%S
ep
-10
Oct-
10
No
v-1
0
Dec-1
0
Jan
-11
Feb
-11
Ma
r-1
1
Ap
r-1
1
Ma
y-1
1
Jun
-11
Jul-
11
Au
g-1
1
Sep
-11
Nasdaq Digital Media and Informatics
80%
85%
90%
95%
100%
105%
110%
08
/12
/11
08
/14
/11
08
/16
/11
08
/18
/11
08
/20
/11
08
/22
/11
08
/24
/11
08
/26
/11
08
/28
/11
08
/30
/11
09
/01
/11
09
/03
/11
09
/05
/11
09
/07
/11
09
/09
/11
09
/11
/11
Nasdaq Digital Media and Informatics
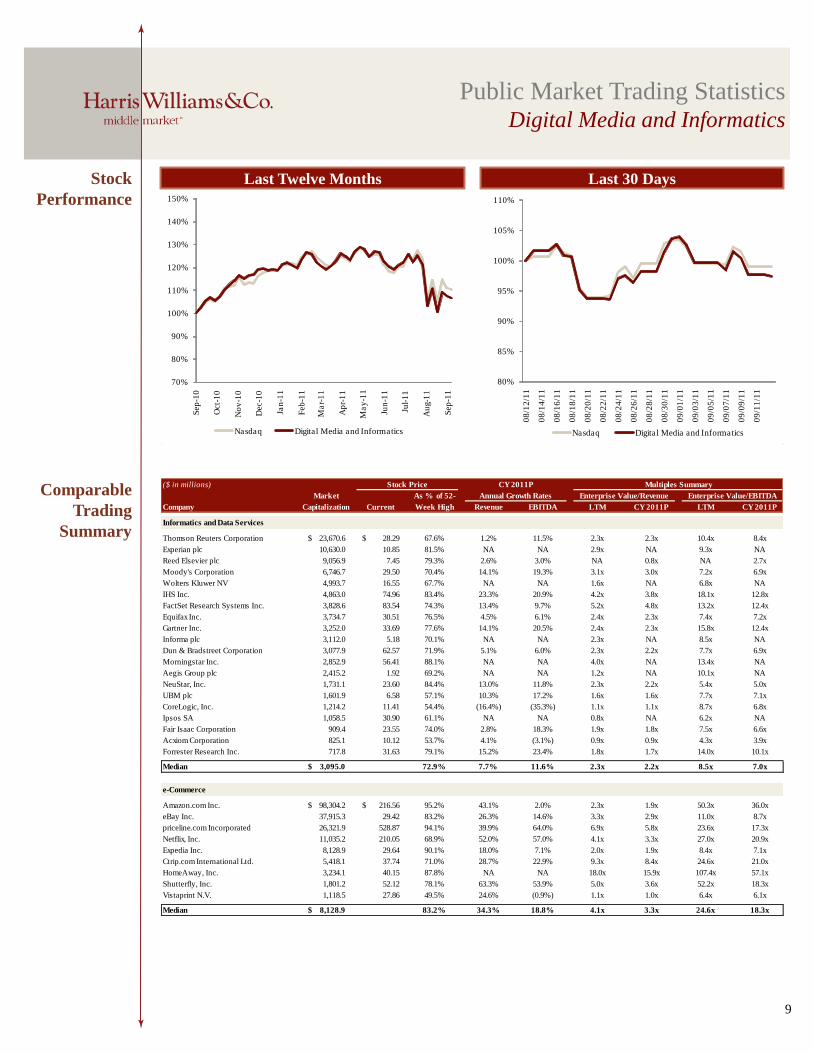
($ in millions) Stock Price CY 2011P Multiples Summary LTM
Market As % of 52- Annual Growth Rates Enterprise Value/Revenue Enterprise Value/EBITDA
Company Capitalization Current Week High Revenue EBITDA LTM CY 2011P LTM CY 2011P
Informatics and Data Services
Thomson Reuters Corporation 23,670.6$ 28.29$ 67.6% 1.2% 11.5% 2.3x 2.3x 10.4x 8.4x
Experian plc 10,630.0 10.85 81.5% NA NA 2.9x NA 9.3x NA
Reed Elsevier plc 9,056.9 7.45 79.3% 2.6% 3.0% NA 0.8x NA 2.7x
Moody's Corporation 6,746.7 29.50 70.4% 14.1% 19.3% 3.1x 3.0x 7.2x 6.9x
Wolters Kluwer NV 4,993.7 16.55 67.7% NA NA 1.6x NA 6.8x NA
IHS Inc. 4,863.0 74.96 83.4% 23.3% 20.9% 4.2x 3.8x 18.1x 12.8x
FactSet Research Systems Inc. 3,828.6 83.54 74.3% 13.4% 9.7% 5.2x 4.8x 13.2x 12.4x
Equifax Inc. 3,734.7 30.51 76.5% 4.5% 6.1% 2.4x 2.3x 7.4x 7.2x
Gartner Inc. 3,252.0 33.69 77.6% 14.1% 20.5% 2.4x 2.3x 15.8x 12.4x
Informa plc 3,112.0 5.18 70.1% NA NA 2.3x NA 8.5x NA
Dun & Bradstreet Corporation 3,077.9 62.57 71.9% 5.1% 6.0% 2.3x 2.2x 7.7x 6.9x
Morningstar Inc. 2,852.9 56.41 88.1% NA NA 4.0x NA 13.4x NA
Aegis Group plc 2,415.2 1.92 69.2% NA NA 1.2x NA 10.1x NA
NeuStar, Inc. 1,731.1 23.60 84.4% 13.0% 11.8% 2.3x 2.2x 5.4x 5.0x
UBM plc 1,601.9 6.58 57.1% 10.3% 17.2% 1.6x 1.6x 7.7x 7.1x
CoreLogic, Inc. 1,214.2 11.41 54.4% (16.4%) (35.3%) 1.1x 1.1x 8.7x 6.8x
Ipsos SA 1,058.5 30.90 61.1% NA NA 0.8x NA 6.2x NA
Fair Isaac Corporation 909.4 23.55 74.0% 2.8% 18.3% 1.9x 1.8x 7.5x 6.6x
Acxiom Corporation 825.1 10.12 53.7% 4.1% (3.1%) 0.9x 0.9x 4.3x 3.9x
Forrester Research Inc. 717.8 31.63 79.1% 15.2% 23.4% 1.8x 1.7x 14.0x 10.1x
Median 3,095.0$ 72.9% 7.7% 11.6% 2.3x 2.2x 8.5x 7.0x
e-Commerce
Amazon.com Inc. 98,304.2$ 216.56$ 95.2% 43.1% 2.0% 2.3x 1.9x 50.3x 36.0x
eBay Inc. 37,915.3 29.42 83.2% 26.3% 14.6% 3.3x 2.9x 11.0x 8.7x
priceline.com Incorporated 26,321.9 528.87 94.1% 39.9% 64.0% 6.9x 5.8x 23.6x 17.3x
Netflix, Inc. 11,035.2 210.05 68.9% 52.0% 57.0% 4.1x 3.3x 27.0x 20.9x
Expedia Inc. 8,128.9 29.64 90.1% 18.0% 7.1% 2.0x 1.9x 8.4x 7.1x
Ctrip.com International Ltd. 5,418.1 37.74 71.0% 28.7% 22.9% 9.3x 8.4x 24.6x 21.0x
HomeAway, Inc. 3,234.1 40.15 87.8% NA NA 18.0x 15.9x 107.4x 57.1x
Shutterfly, Inc. 1,801.2 52.12 78.1% 63.3% 53.9% 5.0x 3.6x 52.2x 18.3x
Vistaprint N.V. 1,118.5 27.86 49.5% 24.6% (0.9%) 1.1x 1.0x 6.4x 6.1x
Median 8,128.9$ 83.2% 34.3% 18.8% 4.1x 3.3x 24.6x 18.3x

Comparable
Trading
Summary
(continued)
Public Market Trading StatisticsDigital Media and Informatics
10
($ in millions) Stock Price CY 2011P Multiples Summary LTM
Market As % of 52- Annual Growth Rates Enterprise Value/Revenue Enterprise Value/EBITDA
Company Capitalization Current Week High Revenue EBITDA LTM CY 2011P LTM CY 2011P
Internet Software and Services
Rovi Corporation 4,913.3$ 44.16$ 63.5% 46.4% 34.0% 8.4x 6.7x 21.9x 13.9x
Dolby Laboratories, Inc. 3,452.0 31.26 44.9% 1.3% (1.6%) 2.4x 2.4x 4.9x 4.9x
Pandora Media, Inc. 1,591.7 9.87 38.0% NA NA 7.4x 5.5x NM 2219.8x
ValueClick, Inc. 1,207.8 15.26 77.3% 27.1% 29.1% 2.2x 2.0x 7.8x 6.6x
Digital River Inc. 788.9 19.88 49.9% 8.5% 25.0% 0.9x 0.8x 6.3x 3.9x
Median 1,591.7$ 49.9% 17.8% 27.1% 2.4x 2.4x 7.0x 6.6x
Online Content and Search
Google Inc. 171,169.3$ 530.12$ 82.4% 28.8% 20.1% 4.1x 3.7x 10.7x 8.8x
Baidu, Inc. 50,327.4 144.23 86.9% 83.9% 86.9% 29.8x 22.7x 52.5x 39.0x
Yahoo! Inc. 18,004.8 14.26 75.7% 0.3% (10.4%) 1.9x 2.3x 7.4x 7.2x
Rakuten, Inc. 14,889.1 1,134.08 97.2% NA NA 4.0x NA 16.3x NA
Yandex N.V. 9,373.2 29.02 69.1% NA NA 15.4x 13.6x 34.2x 30.2x
Scripps Networks Interactive, Inc. 6,402.4 39.58 73.8% 2.7% 10.2% 3.2x 3.3x 7.2x 6.9x
IAC/InterActiveCorporation 3,359.5 39.54 90.3% 19.0% 40.0% 1.3x 1.2x 10.6x 6.6x
WebMD Health Corporation 1,931.5 32.92 56.2% 10.3% 17.4% 2.7x 2.7x 10.5x 7.9x
Bankrate, Inc. 1,571.0 15.71 83.2% NA NA 4.9x 4.3x 15.5x 14.2x
Monster Worldwide, Inc. 993.7 8.09 31.2% 14.4% 73.8% 0.9x 0.8x 8.2x 4.6x
Demand Media, Inc. 640.4 7.63 27.9% NA NA 1.8x 1.7x 8.8x 6.3x
Responsys, Inc. 583.5 12.40 68.2% NA NA 4.3x 3.8x 23.2x 23.0x
Median 4,880.9$ 74.7% 14.4% 20.1% 3.6x 3.3x 10.7x 7.9x
Social Networking
LinkedIn Corporation 7,969.4$ 82.78$ 67.5% NA NA 21.2x 14.8x 158.6x 110.4x
The Active Network, Inc. 779.9 14.39 61.0% NA NA 2.0x 1.9x 28.3x 17.0x
Median 4,374.6$ 48.59$ 64.2% NA NA 11.6x 8.3x 93.5x 63.7x
Total DM and Informatics Median 3,305.8$ 72.8% 14.1% 17.4% 2.4x 2.3x 10.4x 8.4x
Note: Public comparables exclude companies with market capitalization below $500 million.

Date Date Enterprise LTM Multiples
Announced Closed Target Acquirer Value (mm) Revenue EBITDA
08/03/11 Pending Network Solutions, LLC Web.com Group, Inc. 755.5$ NA NA
07/19/11 Pending Insider Guides, Inc. Quepasa Corp. 100.0 4.2 x 20.4 x
07/19/11 08/04/11 Vovici Corporation Verint Systems Inc. 76.4 NA NA
07/05/11 Pending Travelex Global Business Payments, Inc. Western Union Co. 975.3 4.3 x 13.6 x
06/14/11 07/29/11 Prosodie SA Cap Gemini S.A. 552.8 2.2 x NA
05/30/11 Pending Meetic S.A. Match.com, L.L.C. 436.4 1.6 x 7.9 x
05/26/11 Pending MerchantCircle, Inc. Reply! Inc. 60.0 NA NA
05/23/11 05/23/11 Modular Patterns Ltd. Conduit Ltd. 45.0 NA NA
05/12/11 Pending Home Loan Center, Inc. Discover Bank 55.9 NA NA
04/28/11 06/02/11 Shopzilla, Inc. Symphony Technology Group 165.0 NA NA
04/28/11 06/03/11 Tretti AB CDON Group AB 50.3 0.6 x 11.2 x
04/27/11 Pending LoopNet, Inc. CoStar Group Inc. 654.4 8.2 x 30.3 x
04/08/11 Pending Fubon Multimedia Technology Co., Ltd. Wealth Media Technology Co., Ltd. 563.5 NA NA
03/30/11 05/02/11 Radian6 Technologies, Inc. salesforce.com Canada Corporation 350.0 NA NA
03/27/11 06/17/11 GSI Commerce Inc. eBay Inc. 2,139.3 1.6 x 20.5 x
03/23/11 06/03/11 Drugstore.com Inc. Walgreen Co. 402.4 0.9 x 51.4 x
03/21/11 04/25/11 Tiny Prints, Inc. Shutterfly, Inc. 357.2 4.1 x NA
Median 357.2$ 2.2x 20.4x
Recent M&A
Activity
11
Comparable TransactionsDigital Media and Informatics
Summary
Statistics
M&A Transaction Volume and Revenue Multiples
Note: Includes announced transactions over the last six months where enterprise value is publicly disclosed and more than $40 million.
Note: Includes closed transactions where enterprise value is publicly disclosed and more than $40 million.
5.8x
3.0x
1.8x
2.9x
2.3x
3.2x 3.2x 3.3x
2.2x 2.2x
0.0x
1.5x
3.0x
4.5x
6.0x
0
15
30
45
2002 2003 2004 2005 2006 2007 2008 2009 2010 2011 YTD
LT
M R
even
ue M
ultip
leTra
nsa
ctio
n V
olu
me
Transaction Volume Median LTM Revenue Multiple
Comparable
Trading
Summary
Public Market Trading StatisticsInfrastructure Software
12
Stock
Performance
Last Twelve Months Last 30 Days
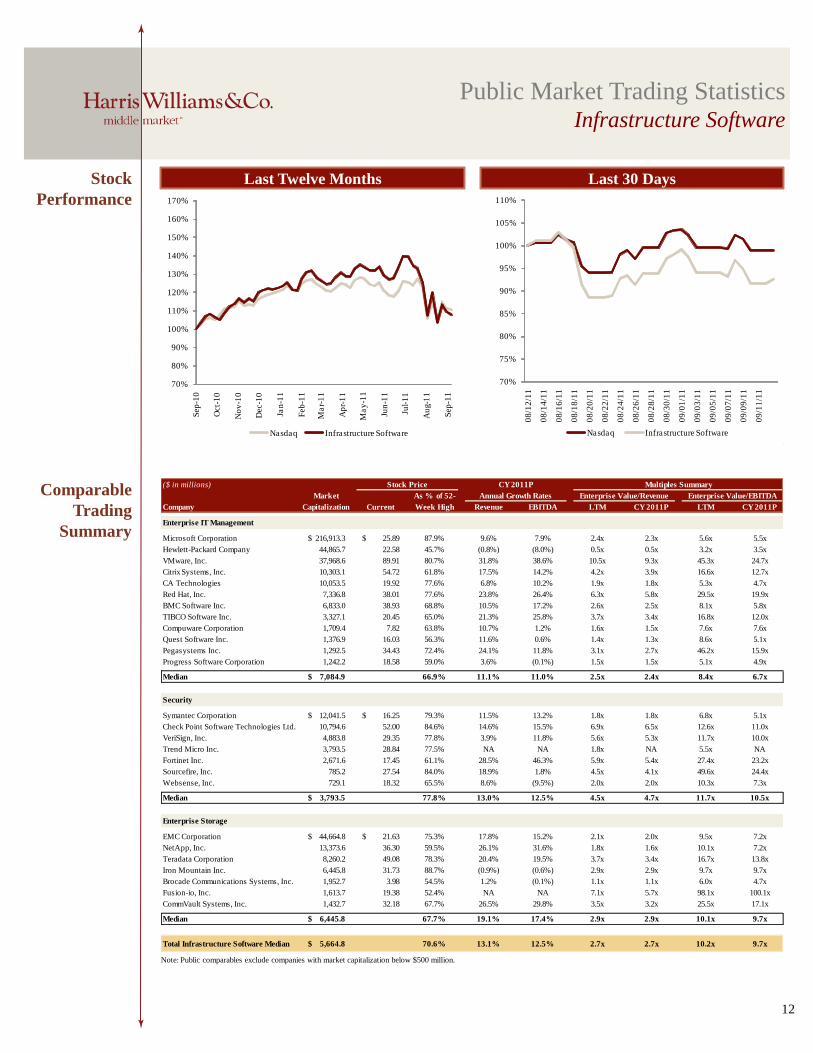
($ in millions) Stock Price CY 2011P Multiples Summary LTM
Market As % of 52- Annual Growth Rates Enterprise Value/Revenue Enterprise Value/EBITDA
Company Capitalization Current Week High Revenue EBITDA LTM CY 2011P LTM CY 2011P
Enterprise IT Management
Microsoft Corporation 216,913.3$ 25.89$ 87.9% 9.6% 7.9% 2.4x 2.3x 5.6x 5.5x
Hewlett-Packard Company 44,865.7 22.58 45.7% (0.8%) (8.0%) 0.5x 0.5x 3.2x 3.5x
VMware, Inc. 37,968.6 89.91 80.7% 31.8% 38.6% 10.5x 9.3x 45.3x 24.7x
Citrix Systems, Inc. 10,303.1 54.72 61.8% 17.5% 14.2% 4.2x 3.9x 16.6x 12.7x
CA Technologies 10,053.5 19.92 77.6% 6.8% 10.2% 1.9x 1.8x 5.3x 4.7x
Red Hat, Inc. 7,336.8 38.01 77.6% 23.8% 26.4% 6.3x 5.8x 29.5x 19.9x
BMC Software Inc. 6,833.0 38.93 68.8% 10.5% 17.2% 2.6x 2.5x 8.1x 5.8x
TIBCO Software Inc. 3,327.1 20.45 65.0% 21.3% 25.8% 3.7x 3.4x 16.8x 12.0x
Compuware Corporation 1,709.4 7.82 63.8% 10.7% 1.2% 1.6x 1.5x 7.6x 7.6x
Quest Software Inc. 1,376.9 16.03 56.3% 11.6% 0.6% 1.4x 1.3x 8.6x 5.1x
Pegasystems Inc. 1,292.5 34.43 72.4% 24.1% 11.8% 3.1x 2.7x 46.2x 15.9x
Progress Software Corporation 1,242.2 18.58 59.0% 3.6% (0.1%) 1.5x 1.5x 5.1x 4.9x
Median 7,084.9$ 66.9% 11.1% 11.0% 2.5x 2.4x 8.4x 6.7x
Security
Symantec Corporation 12,041.5$ 16.25$ 79.3% 11.5% 13.2% 1.8x 1.8x 6.8x 5.1x
Check Point Software Technologies Ltd. 10,794.6 52.00 84.6% 14.6% 15.5% 6.9x 6.5x 12.6x 11.0x
VeriSign, Inc. 4,883.8 29.35 77.8% 3.9% 11.8% 5.6x 5.3x 11.7x 10.0x
Trend Micro Inc. 3,793.5 28.84 77.5% NA NA 1.8x NA 5.5x NA
Fortinet Inc. 2,671.6 17.45 61.1% 28.5% 46.3% 5.9x 5.4x 27.4x 23.2x
Sourcefire, Inc. 785.2 27.54 84.0% 18.9% 1.8% 4.5x 4.1x 49.6x 24.4x
Websense, Inc. 729.1 18.32 65.5% 8.6% (9.5%) 2.0x 2.0x 10.3x 7.3x
Median 3,793.5$ 77.8% 13.0% 12.5% 4.5x 4.7x 11.7x 10.5x
Enterprise Storage
EMC Corporation 44,664.8$ 21.63$ 75.3% 17.8% 15.2% 2.1x 2.0x 9.5x 7.2x
NetApp, Inc. 13,373.6 36.30 59.5% 26.1% 31.6% 1.8x 1.6x 10.1x 7.2x
Teradata Corporation 8,260.2 49.08 78.3% 20.4% 19.5% 3.7x 3.4x 16.7x 13.8x
Iron Mountain Inc. 6,445.8 31.73 88.7% (0.9%) (0.6%) 2.9x 2.9x 9.7x 9.7x
Brocade Communications Systems, Inc. 1,952.7 3.98 54.5% 1.2% (0.1%) 1.1x 1.1x 6.0x 4.7x
Fusion-io, Inc. 1,613.7 19.38 52.4% NA NA 7.1x 5.7x 98.1x 100.1x
CommVault Systems, Inc. 1,432.7 32.18 67.7% 26.5% 29.8% 3.5x 3.2x 25.5x 17.1x
Median 6,445.8$ 67.7% 19.1% 17.4% 2.9x 2.9x 10.1x 9.7x
Total Infrastructure Software Median 5,664.8$ 70.6% 13.1% 12.5% 2.7x 2.7x 10.2x 9.7x
70%
80%
90%
100%
110%
120%
130%
140%
150%
160%
170%S
ep
-10
Oct-
10
No
v-1
0
Dec-1
0
Jan
-11
Feb
-11
Ma
r-1
1
Ap
r-1
1
Ma
y-1
1
Jun
-11
Jul-
11
Au
g-1
1
Sep
-11
Nasdaq Infrastructure Software
70%
75%
80%
85%
90%
95%
100%
105%
110%
08
/12
/11
08
/14
/11
08
/16
/11
08
/18
/11
08
/20
/11
08
/22
/11
08
/24
/11
08
/26
/11
08
/28
/11
08
/30
/11
09
/01
/11
09
/03
/11
09
/05
/11
09
/07
/11
09
/09
/11
09
/11
/11
Nasdaq Infrastructure Software
Note: Public comparables exclude companies with market capitalization below $500 million.
Recent M&A
Activity
13
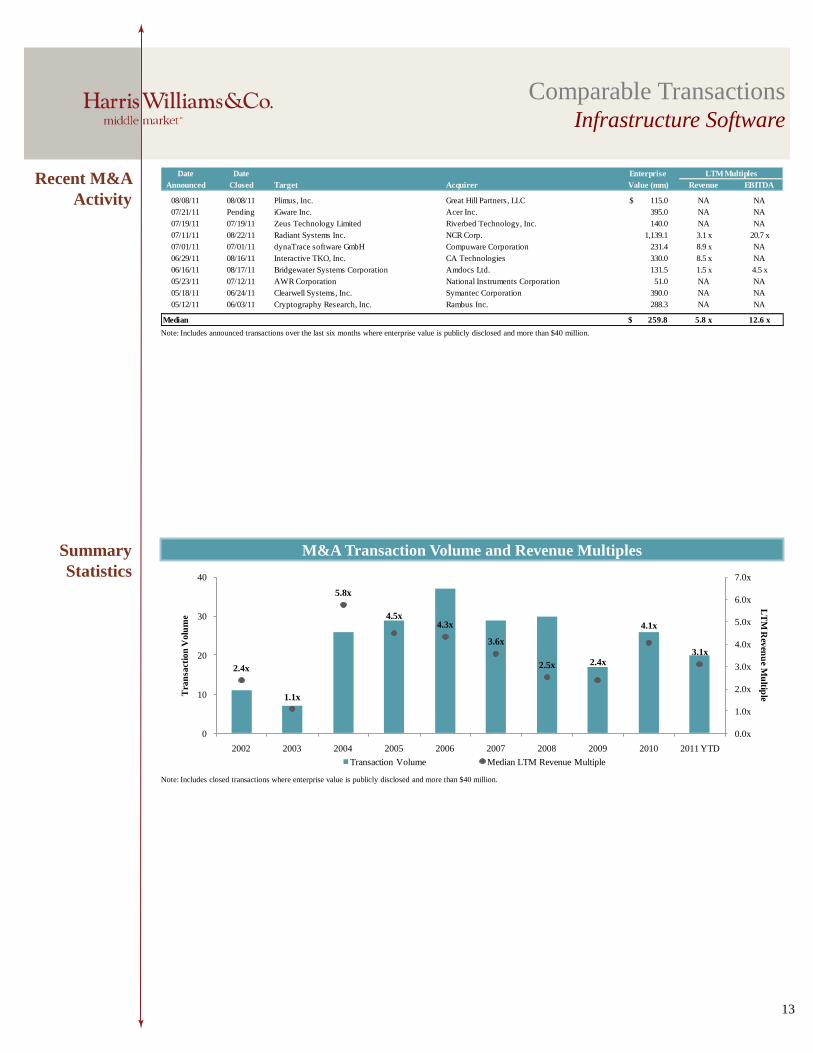
Comparable TransactionsInfrastructure Software
Summary
Statistics
M&A Transaction Volume and Revenue Multiples
Note: Includes announced transactions over the last six months where enterprise value is publicly disclosed and more than $40 million.
Note: Includes closed transactions where enterprise value is publicly disclosed and more than $40 million.
Date Date Enterprise LTM Multiples
Announced Closed Target Acquirer Value (mm) Revenue EBITDA
08/08/11 08/08/11 Plimus, Inc. Great Hill Partners, LLC 115.0$ NA NA
07/21/11 Pending iGware Inc. Acer Inc. 395.0 NA NA
07/19/11 07/19/11 Zeus Technology Limited Riverbed Technology, Inc. 140.0 NA NA
07/11/11 08/22/11 Radiant Systems Inc. NCR Corp. 1,139.1 3.1 x 20.7 x
07/01/11 07/01/11 dynaTrace software GmbH Compuware Corporation 231.4 8.9 x NA
06/29/11 08/16/11 Interactive TKO, Inc. CA Technologies 330.0 8.5 x NA
06/16/11 08/17/11 Bridgewater Systems Corporation Amdocs Ltd. 131.5 1.5 x 4.5 x
05/23/11 07/12/11 AWR Corporation National Instruments Corporation 51.0 NA NA
05/18/11 06/24/11 Clearwell Systems, Inc. Symantec Corporation 390.0 NA NA
05/12/11 06/03/11 Cryptography Research, Inc. Rambus Inc. 288.3 NA NA
Median 259.8$ 5.8 x 12.6 x
2.4x
1.1x
5.8x
4.5x4.3x
3.6x
2.5x 2.4x
4.1x
3.1x
0.0x
1.0x
2.0x
3.0x
4.0x
5.0x
6.0x
7.0x
0
10
20
30
40
2002 2003 2004 2005 2006 2007 2008 2009 2010 2011 YTD
LT
M R
even
ue M
ultip
leTra
nsa
ctio
n V
olu
me
Transaction Volume Median LTM Revenue Multiple

Comparable
Trading
Summary
Public Market Trading StatisticsIT and Tech-Enabled Services
14
Stock
Performance
Last Twelve Months Last 30 Days
($ in millions) Stock Price CY 2011P Multiples Summary LTM
Market As % of 52- Annual Growth Rates Enterprise Value/Revenue Enterprise Value/EBITDA
Company Capitalization Current Week High Revenue EBITDA LTM CY 2011P LTM CY 2011P
Data & Transaction Processing
Fidelity National Information Services, Inc. 7,806.0$ 25.51$ 75.6% 10.8% 9.2% 2.2x 2.2x 7.8x 7.2x
Fiserv, Inc. 7,340.9 51.86 79.3% 4.2% 5.6% 2.5x 2.4x 8.0x 7.4x
Global Payments Inc. 3,436.0 42.77 79.7% 16.3% 21.4% 1.6x 1.5x 7.2x 6.5x
Total System Services, Inc. 3,338.8 17.33 89.5% 0.5% 4.7% 1.9x 1.9x 7.7x 6.7x
Broadridge Financial Solutions Inc. 2,485.9 20.12 81.0% 8.6% 14.0% 1.3x 1.2x 7.8x 7.1x
Jack Henry & Associates Inc. 2,460.6 28.48 83.3% 8.8% 11.8% 2.6x 2.6x 8.3x 8.1x
Lender Processing Services, Inc. 1,334.1 15.81 45.3% (14.5%) (29.9%) 1.1x 1.2x 4.3x 5.3x
ACI Worldwide, Inc. 900.6 26.91 70.9% 10.5% 33.5% 1.8x 1.7x 8.4x 7.5x
Heartland Payment Systems, Inc. 809.5 20.64 89.7% 7.9% 38.1% 0.4x 1.8x 9.3x 8.2x
Median 2,485.9$ 79.7% 8.6% 11.8% 1.8x 1.8x 7.8x 7.2x
IT Services
Accenture plc 32,234.0$ 50.02$ 78.6% 18.8% 18.8% 1.1x 1.1x 7.1x 6.7x
Cap Gemini S.A. 4,884.8 31.75 53.7% NA NA 0.3x NA 4.1x NA
Atos Origin SA 2,931.4 42.08 70.0% NA NA 0.4x NA 3.7x NA
Logica PLC 2,084.2 1.29 54.8% NA NA 0.4x NA 5.2x NA
Sapient Corporation 1,377.4 9.90 60.9% 27.3% 38.4% 1.2x 1.1x 10.9x 8.9x
Tieto Oyj 909.3 12.72 58.3% NA NA 0.4x NA 4.3x NA
Unisys Corporation 682.5 15.81 38.3% (5.3%) NA 0.2x 0.2x 2.1x 1.5x
Median 2,084.2$ 58.3% 18.8% 28.6% 0.4x 1.1x 4.3x 6.7x
Government IT Services
SAIC, Inc. 4,330.6$ 12.70$ 72.0% (3.8%) (6.1%) 0.4x 0.5x 4.7x 5.0x
CACI International Inc. 1,518.0 49.95 75.1% 12.2% 19.5% 0.5x 0.5x 5.7x 5.6x
ManTech International Corporation 1,199.1 32.64 70.6% 14.0% 11.1% 0.4x 0.4x 4.6x 4.5x
MAXIMUS, Inc. 1,164.8 33.75 78.9% 11.2% 13.0% 1.1x 1.0x 7.1x 6.7x
Tyler Technologies, Inc. 780.8 24.58 89.2% 5.6% 8.9% 2.7x 2.6x 15.2x 13.4x
Median 1,199.1$ 75.1% 11.2% 11.1% 0.5x 0.5x 5.7x 5.6x
Onshore BPOs
Automatic Data Processing, Inc. 23,656.3$ 48.31$ 87.6% 11.6% 8.7% 2.2x 2.2x 10.3x 10.2x
Paychex Inc. 9,498.7 26.19 77.2% 6.2% 9.0% 4.2x 4.1x 10.1x 9.8x
CGI Group, Inc. 4,745.4 18.02 73.8% 9.8% 7.2% 1.3x 1.3x 7.1x 7.0x
Alliance Data Systems Corporation 4,603.5 90.41 89.1% 13.0% 20.1% 3.7x 3.5x 13.1x 11.1x
Computer Sciences Corporation 4,325.9 27.90 49.3% (0.0%) (14.1%) 0.3x 0.3x 2.7x 2.7x
DST Systems Inc. 1,996.4 42.90 72.2% 10.9% (6.9%) 0.5x 0.7x 3.2x 3.0x
Convergys Corporation 1,149.7 9.58 63.9% 1.4% 4.3% 0.5x 0.5x 4.3x 4.0x
Median 4,603.5$ 73.8% 9.8% 7.2% 1.3x 1.3x 7.1x 7.0x
70%
80%
90%
100%
110%
120%
130%
140%
150%S
ep
-10
Oct-
10
No
v-1
0
Dec-1
0
Jan
-11
Feb
-11
Ma
r-1
1
Ap
r-1
1
Ma
y-1
1
Jun
-11
Jul-
11
Au
g-1
1
Sep
-11
Nasdaq IT and Tech-Enabled Services
80%
85%
90%
95%
100%
105%
110%
08
/12
/11
08
/14
/11
08
/16
/11
08
/18
/11
08
/20
/11
08
/22
/11
08
/24
/11
08
/26
/11
08
/28
/11
08
/30
/11
09
/01
/11
09
/03
/11
09
/05
/11
09
/07
/11
09
/09
/11
09
/11
/11
Nasdaq IT and Tech-Enabled Services
Comparable
Trading
Summary
(continued)
Public Market Trading StatisticsIT and Tech-Enabled Services
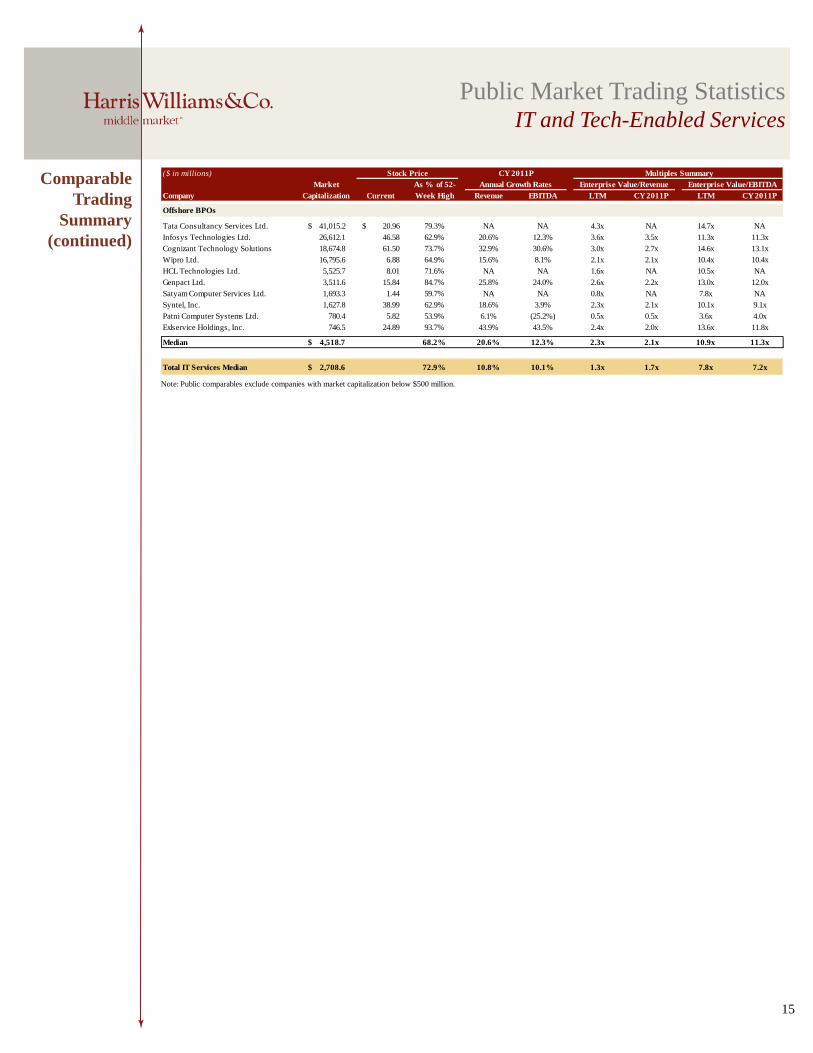
15
($ in millions) Stock Price CY 2011P Multiples Summary LTM
Market As % of 52- Annual Growth Rates Enterprise Value/Revenue Enterprise Value/EBITDA
Company Capitalization Current Week High Revenue EBITDA LTM CY 2011P LTM CY 2011P
Offshore BPOs
Tata Consultancy Services Ltd. 41,015.2$ 20.96$ 79.3% NA NA 4.3x NA 14.7x NA
Infosys Technologies Ltd. 26,612.1 46.58 62.9% 20.6% 12.3% 3.6x 3.5x 11.3x 11.3x
Cognizant Technology Solutions 18,674.8 61.50 73.7% 32.9% 30.6% 3.0x 2.7x 14.6x 13.1x
Wipro Ltd. 16,795.6 6.88 64.9% 15.6% 8.1% 2.1x 2.1x 10.4x 10.4x
HCL Technologies Ltd. 5,525.7 8.01 71.6% NA NA 1.6x NA 10.5x NA
Genpact Ltd. 3,511.6 15.84 84.7% 25.8% 24.0% 2.6x 2.2x 13.0x 12.0x
Satyam Computer Services Ltd. 1,693.3 1.44 59.7% NA NA 0.8x NA 7.8x NA
Syntel, Inc. 1,627.8 38.99 62.9% 18.6% 3.9% 2.3x 2.1x 10.1x 9.1x
Patni Computer Systems Ltd. 780.4 5.82 53.9% 6.1% (25.2%) 0.5x 0.5x 3.6x 4.0x
Exlservice Holdings, Inc. 746.5 24.89 93.7% 43.9% 43.5% 2.4x 2.0x 13.6x 11.8x
Median 4,518.7$ 68.2% 20.6% 12.3% 2.3x 2.1x 10.9x 11.3x
Total IT Services Median 2,708.6$ 72.9% 10.8% 10.1% 1.3x 1.7x 7.8x 7.2x
Note: Public comparables exclude companies with market capitalization below $500 million.
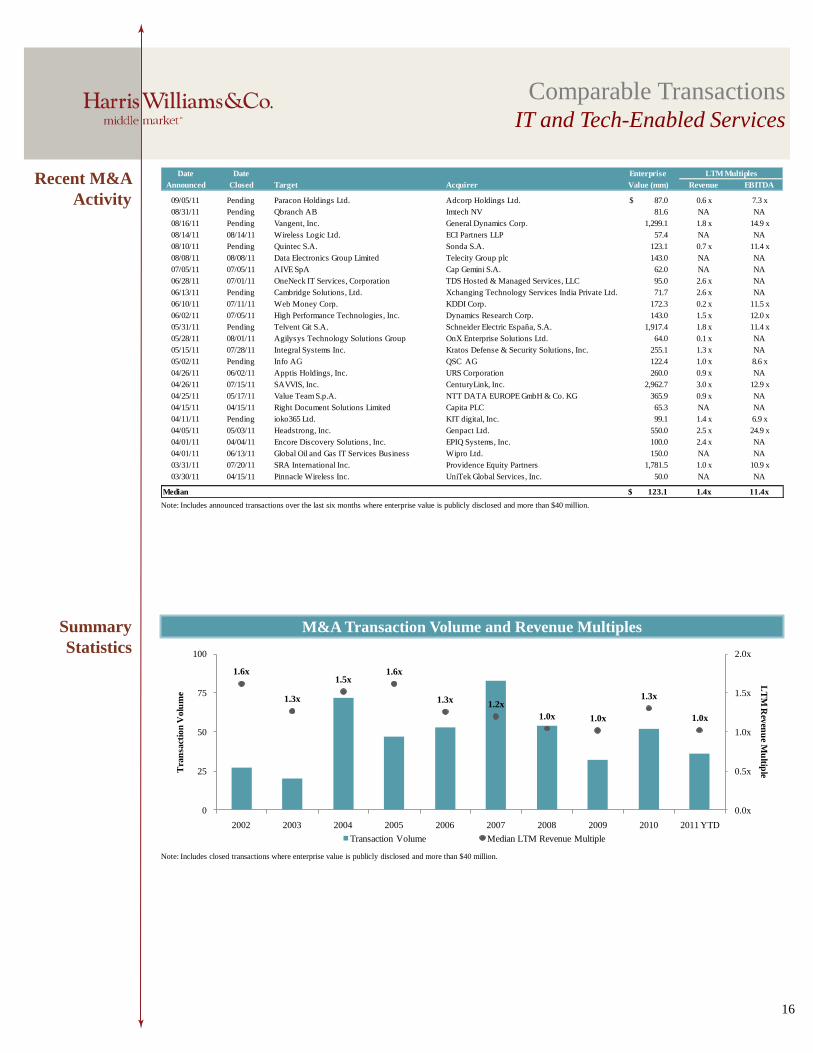
Date Date Enterprise LTM Multiples
Announced Closed Target Acquirer Value (mm) Revenue EBITDA
09/05/11 Pending Paracon Holdings Ltd. Adcorp Holdings Ltd. 87.0$ 0.6 x 7.3 x
08/31/11 Pending Qbranch AB Imtech NV 81.6 NA NA
08/16/11 Pending Vangent, Inc. General Dynamics Corp. 1,299.1 1.8 x 14.9 x
08/14/11 08/14/11 Wireless Logic Ltd. ECI Partners LLP 57.4 NA NA
08/10/11 Pending Quintec S.A. Sonda S.A. 123.1 0.7 x 11.4 x
08/08/11 08/08/11 Data Electronics Group Limited Telecity Group plc 143.0 NA NA
07/05/11 07/05/11 AIVE SpA Cap Gemini S.A. 62.0 NA NA
06/28/11 07/01/11 OneNeck IT Services, Corporation TDS Hosted & Managed Services, LLC 95.0 2.6 x NA
06/13/11 Pending Cambridge Solutions, Ltd. Xchanging Technology Services India Private Ltd. 71.7 2.6 x NA
06/10/11 07/11/11 Web Money Corp. KDDI Corp. 172.3 0.2 x 11.5 x
06/02/11 07/05/11 High Performance Technologies, Inc. Dynamics Research Corp. 143.0 1.5 x 12.0 x
05/31/11 Pending Telvent Git S.A. Schneider Electric España, S.A. 1,917.4 1.8 x 11.4 x
05/28/11 08/01/11 Agilysys Technology Solutions Group OnX Enterprise Solutions Ltd. 64.0 0.1 x NA
05/15/11 07/28/11 Integral Systems Inc. Kratos Defense & Security Solutions, Inc. 255.1 1.3 x NA
05/02/11 Pending Info AG QSC AG 122.4 1.0 x 8.6 x
04/26/11 06/02/11 Apptis Holdings, Inc. URS Corporation 260.0 0.9 x NA
04/26/11 07/15/11 SAVVIS, Inc. CenturyLink, Inc. 2,962.7 3.0 x 12.9 x
04/25/11 05/17/11 Value Team S.p.A. NTT DATA EUROPE GmbH & Co. KG 365.9 0.9 x NA
04/15/11 04/15/11 Right Document Solutions Limited Capita PLC 65.3 NA NA
04/11/11 Pending ioko365 Ltd. KIT digital, Inc. 99.1 1.4 x 6.9 x
04/05/11 05/03/11 Headstrong, Inc. Genpact Ltd. 550.0 2.5 x 24.9 x
04/01/11 04/04/11 Encore Discovery Solutions, Inc. EPIQ Systems, Inc. 100.0 2.4 x NA
04/01/11 06/13/11 Global Oil and Gas IT Services Business Wipro Ltd. 150.0 NA NA
03/31/11 07/20/11 SRA International Inc. Providence Equity Partners 1,781.5 1.0 x 10.9 x
03/30/11 04/15/11 Pinnacle Wireless Inc. UniTek Global Services, Inc. 50.0 NA NA
Median 123.1$ 1.4x 11.4x
Recent M&A
Activity
16
Comparable TransactionsIT and Tech-Enabled Services
Summary
Statistics
M&A Transaction Volume and Revenue Multiples
Note: Includes announced transactions over the last six months where enterprise value is publicly disclosed and more than $40 million.
Note: Includes closed transactions where enterprise value is publicly disclosed and more than $40 million.
1.6x
1.3x
1.5x1.6x
1.3x1.2x
1.0x 1.0x
1.3x
1.0x
0.0x
0.5x
1.0x
1.5x
2.0x
0
25
50
75
100
2002 2003 2004 2005 2006 2007 2008 2009 2010 2011 YTD
LT
M R
even
ue M
ultip
leTra
nsa
ctio
n V
olu
me
Transaction Volume Median LTM Revenue Multiple

Public Market Trading StatisticsSaaS
17
Comparable
Trading
Summary
Stock
Performance
Last Twelve Months Last 30 Days
( $ in millions) Stock Price CY 2011P Multiples Summary LTM
Market As % of 52- Annual Growth Rates Enterprise Value/Revenue Enterprise Value/EBITDA
Company Capitalization Current Week High Revenue EBITDA LTM CY 2011P LTM CY 2011P
SaaS
Salesforce.com 16,766.8$ 123.74$ 77.3% 35.1% 29.8% 8.2x 7.2x 138.8x 40.2x
athenahealth, Inc. 2,117.4 60.52 94.9% 31.9% 57.7% 7.1x 6.2x 42.0x 29.5x
Concur Technologies, Inc. 2,077.1 38.47 66.1% 20.4% 18.8% 5.2x 4.7x 35.1x 16.6x
NetSuite Inc. 2,038.0 30.32 70.8% 22.0% 15.0% 9.0x 8.2x NM 91.1x
SuccessFactors, Inc. 1,814.6 21.75 53.8% 55.3% 43.2% 6.2x 5.0x NM 128.3x
Blackboard Inc. 1,552.0 44.17 87.9% 20.0% 9.8% 3.5x 3.1x 21.2x 14.2x
OpenTable, Inc. 1,267.7 53.54 45.1% 45.3% 68.8% 9.7x 8.4x 34.5x 20.8x
Ultimate Software Group, Inc. 1,262.2 48.81 80.8% 18.5% 21.2% 4.9x 4.5x 57.3x 28.7x
Rightnow Technologies Inc. 1,061.7 31.93 87.0% 22.6% 23.7% 4.7x 4.3x 46.1x 31.7x
Taleo Corporation 1,056.5 25.57 66.8% 35.1% 45.5% 3.3x 2.8x 25.4x 12.6x
Websense, Inc. 729.1 18.32 65.5% 8.6% (9.5%) 2.0x 2.0x 10.3x 7.3x
Cornerstone OnDemand, Inc. 583.0 12.13 51.6% NA NA 9.3x 6.9x NM NM
MedAssets, Inc. 576.9 9.80 43.6% 42.4% 42.9% 3.1x 2.6x 11.1x 8.1x
Total SaaS Median 1,267.7$ 66.8% 27.2% 26.8% 5.2x 4.7x 34.8x 24.7x
80%
90%
100%
110%
120%
130%
140%
150%
160%
170%
180%S
ep
-10
Oct-
10
No
v-1
0
Dec-1
0
Jan
-11
Feb
-11
Ma
r-1
1
Ap
r-1
1
Ma
y-1
1
Jun
-11
Jul-
11
Au
g-1
1
Sep
-11
Nasdaq SaaS
75%
80%
85%
90%
95%
100%
105%
110%
08
/12
/11
08
/14
/11
08
/16
/11
08
/18
/11
08
/20
/11
08
/22
/11
08
/24
/11
08
/26
/11
08
/28
/11
08
/30
/11
09
/01
/11
09
/03
/11
09
/05
/11
09
/07
/11
09
/09
/11
09
/11
/11
Nasdaq SaaS
Note: Public comparables exclude companies with market capitalization below $500 million.

Date Date Enterprise LTM Multiples
Announced Closed Target Acquirer Value (mm) Revenue EBITDA
07/01/11 07/01/11 dynaTrace software GmbH Compuware Corporation 231.4$ 8.9 x NA
06/30/11 Pending Blackboard Inc. Providence Equity Partners LLC; Providence Equity Partners VI, L.P.1,767.1 3.7 x 22.3 x
06/26/11 Pending Fundtech Ltd. S1 Corporation 231.5 1.6 x 11.0 x
05/24/11 07/06/11 eCarList, LLC DealerTrack/AAX, Inc. 45.3 6.5 x NA
05/13/11 05/13/11 RP Data Ltd. CoreLogic, Inc. 293.6 4.7 x 11.8 x
04/26/11 06/29/11 Plateau Systems, LTD. SuccessFactors, Inc. 290.0 NA NA
03/30/11 05/02/11 Radian6 Technologies, Inc. salesforce.com 340.7 NA NA
03/24/11 04/12/11 Mortgagebot LLC Davis + Henderson Corporation 231.8 6.1 x 11.5 x
Median 260.9$ 5.4x 11.6x
Recent M&A
Activity
18
Comparable TransactionsSaaS
Summary
Statistics
M&A Transaction Volume and Revenue Multiples
Note: Includes announced transactions over the last six months where enterprise value is publicly disclosed and more than $40 million.
Note: Includes closed transactions where enterprise value is publicly disclosed and more than $40 million.
2.6x
3.8x
2.3x
3.1x
2.5x
3.8x
4.4x
2.5x
3.7x3.5x
0.0x
1.0x
2.0x
3.0x
4.0x
5.0x
0
15
30
45
60
2002 2003 2004 2005 2006 2007 2008 2009 2010 2011 YTD
LT
M R
even
ue M
ultip
leTra
nsa
ctio
n V
olu
me
Transaction Volume Median LTM Revenue Multiple

Comparable
Trading
Summary
Public Market Trading StatisticsTech Hardware
19
Stock
Performance
Last Twelve Months Last 30 Days
($ in millions) Stock Price CY 2011P Multiples Summary LTM
Market As % of 52- Annual Growth Rates Enterprise Value/Revenue Enterprise Value/EBITDA
Company Capitalization Current Week High Revenue EBITDA LTM CY 2011P LTM CY 2011P
Semiconductor Devices
Intel Corporation 106,490.3$ 20.28$ 84.6% 23.7% 14.1% 1.9x 1.7x 4.3x 4.1x
Texas Instruments Inc. 30,361.8 26.28 71.6% (4.0%) (15.8%) 1.9x 2.0x 5.4x 6.1x
Broadcom Corporation 17,687.1 33.06 69.8% 11.8% 2.7% 2.0x 1.9x 13.2x 8.0x
Analog Devices Inc. 9,830.5 32.83 75.9% 4.3% 6.2% 2.4x 2.4x 5.8x 6.0x
Marvell Technology Group Ltd. 8,716.0 14.39 65.4% (1.3%) (17.9%) 1.8x 1.7x 6.4x 6.6x
Maxim Integrated Products Inc. 7,075.5 24.00 84.4% 8.7% 6.7% 2.6x 2.5x 7.1x 7.3x
Micron Technology Inc. 6,711.6 6.69 55.9% 3.0% (21.4%) 0.7x 0.8x 2.0x 2.3x
National Semiconductor Corporation 6,301.4 24.88 99.8% (5.9%) (13.3%) 4.1x 4.2x 10.9x 12.6x
Advanced Micro Devices Inc. 4,638.8 6.71 70.0% 4.0% (6.3%) 0.7x 0.7x 5.8x 4.8x
LSI Corporation 3,763.8 6.57 84.9% (17.9%) 4.7% 1.1x 1.4x 8.0x 7.1x
Cree Inc. 3,702.5 31.99 43.9% (0.0%) (45.3%) 2.6x 2.5x 9.4x 12.1x
Freescale Semiconductor Holdings I, Ltd. 2,840.3 11.57 55.2% NA NA 2.0x 2.0x 8.4x 8.1x
Cypress Semiconductor Corporation 2,733.8 15.90 66.4% 16.2% 36.0% 2.5x 2.3x 13.6x 8.3x
Fairchild Semiconductor International Inc. 1,574.3 12.33 58.7% 3.0% 1.0% 0.8x 0.9x 3.7x 3.7x
MEMC Electronic Materials Inc. 1,532.4 6.65 44.2% 56.5% 66.9% 0.8x 0.7x 7.4x 5.0x
Semtech Corporation 1,475.5 22.26 75.5% 10.4% 13.1% 2.4x 2.3x 9.1x 7.9x
PMC-Sierra Inc. 1,468.4 6.26 68.0% 9.3% 9.4% 1.6x 1.5x 7.0x 4.9x
Microsemi Corporation 1,388.9 16.02 64.2% 50.4% 79.7% 2.0x 1.7x 8.3x 5.1x
Median 4,201.3$ 68.9% 4.3% 4.7% 2.0x 1.8x 7.3x 6.3x
Semiconductor Equipment
Applied Materials Inc. 14,308.4$ 10.86$ 64.1% (4.3%) (13.2%) 0.8x 1.0x 3.1x 4.1x
KLA-Tencor Corporation 6,080.5 36.41 70.2% 32.4% 46.5% 1.5x 1.5x 3.8x 3.7x
Lam Research Corporation 4,603.6 37.19 62.9% (3.1%) (26.6%) 1.0x 1.1x 3.6x 5.2x
Teradyne Inc. 2,200.7 11.82 61.6% (11.4%) (26.1%) 0.7x 0.8x 2.3x 3.0x
Novellus Systems, Inc. 1,994.2 28.64 68.5% 1.0% (3.3%) 1.0x 1.1x 3.7x 4.4x
MKS Instruments Inc. 1,198.2 22.84 67.5% (3.0%) (6.0%) 0.8x 0.8x 3.0x 3.4x
Amkor Technology, Inc. 888.7 4.49 52.9% (2.2%) (17.6%) 0.6x 0.6x 2.6x 3.0x
Cabot Microelectronics Corporation 864.1 37.08 70.4% 6.9% 7.3% 1.3x 1.3x 5.2x 5.3x
Tessera Technologies Inc. 651.3 12.71 54.8% (13.5%) (58.6%) 0.4x 0.5x 0.8x 2.9x
Brooks Automation Inc. 560.2 8.48 58.1% (2.6%) NA 0.3x 0.4x 2.2x NA
ATMI Inc. 524.6 16.56 77.7% 13.0% 10.4% 0.8x 0.8x 4.5x 4.2x
Median 1,198.2$ 64.1% (2.6% ) (9.6% ) 0.8x 0.8x 3.1x 3.9x
70%
80%
90%
100%
110%
120%
130%
140%
150%S
ep
-10
Oct-
10
No
v-1
0
Dec-1
0
Jan
-11
Feb
-11
Ma
r-1
1
Ap
r-1
1
Ma
y-1
1
Jun
-11
Jul-
11
Au
g-1
1
Sep
-11
Nasdaq Tech Hardware
80%
85%
90%
95%
100%
105%
110%
08
/12
/11
08
/14
/11
08
/16
/11
08
/18
/11
08
/20
/11
08
/22
/11
08
/24
/11
08
/26
/11
08
/28
/11
08
/30
/11
09
/01
/11
09
/03
/11
09
/05
/11
09
/07
/11
09
/09
/11
09
/11
/11
Nasdaq Tech Hardware

Comparable
Trading
Summary
(continued)
Public Market Trading StatisticsTech Hardware
20
($ in millions) Stock Price CY 2011P Multiples Summary LTM
Market As % of 52- Annual Growth Rates Enterprise Value/Revenue Enterprise Value/EBITDA
Company Capitalization Current Week High Revenue EBITDA LTM CY 2011P LTM CY 2011P
Electronic Manufacturing
Flextronics International Ltd. 4,030.5$ 5.51$ 64.8% 9.9% 5.4% 0.2x 0.2x 4.0x 3.7x
Jabil Circuit Inc. 3,504.1 16.03 69.4% 17.4% 22.9% 0.2x 0.2x 4.3x 3.8x
Molex Inc. 3,534.0 20.13 70.6% 7.1% 8.0% 0.9x 0.9x 4.8x 4.9x
Celestica Inc. 1,680.0 7.79 63.2% 14.7% 12.9% 0.2x 0.2x 4.5x 3.5x
Plexus Corporation 867.7 24.49 63.3% 3.8% (2.1%) 0.4x 0.4x 6.3x 6.5x
TTM Technologies Inc. 867.0 10.66 54.3% 24.4% 29.1% 0.9x 0.9x 4.8x 4.8x
Benchmark Electronics Inc. 761.0 12.77 63.1% (1.5%) (15.5%) 0.2x 0.2x 3.7x 3.8x
Sanmina-SCI Corporation 563.0 6.98 40.3% 2.0% 1.1% 0.2x 0.2x 3.6x 3.6x
Median 1,273.9$ 63.2% 8.5% 6.7% 0.2x 0.2x 4.4x 3.8x
PCs, Servers, and Computing Components
Apple Inc. 352,239.0$ 379.94$ 93.9% 59.0% 77.6% 2.8x 2.3x 8.6x 7.2x
IBM Corporation 193,974.7 162.42 87.5% 8.7% 9.9% 2.0x 1.9x 8.0x 7.9x
Samsung Electronics Co. Ltd. 93,607.9 719.31 76.9% NA NA 0.5x NA 3.2x NA
Hewlett-Packard Company 44,865.7 22.58 45.7% (0.8%) (8.0%) 0.5x 0.5x 3.2x 3.5x
Dell Inc. 25,888.4 14.19 80.6% 2.0% 23.3% 0.3x 0.3x 3.1x 3.0x
Xerox Corporation 10,679.3 7.52 62.3% 5.6% 9.8% 0.8x 0.8x 6.0x 5.4x
Lenovo Group Ltd. 6,612.6 0.64 87.4% NA NA 0.0x NA 0.9x NA
Pitney Bowes Inc. 3,885.2 19.22 72.9% (1.1%) (4.3%) 1.4x 1.4x 6.9x 6.7x
NCR Corporation 2,625.3 16.69 79.6% 9.4% 36.9% 0.4x 0.4x 8.8x 6.6x
Lexmark International Inc. 2,428.3 30.64 63.7% (1.2%) (2.2%) 0.4x 0.4x 2.6x 2.5x
Diebold, Inc. 1,747.7 27.22 73.3% 3.3% (9.2%) 0.7x 0.6x 7.7x 7.4x
ScanSource, Inc. 779.0 28.71 71.8% 19.5% 21.6% 0.3x 0.3x 6.7x 6.7x
Median 8,645.9$ 75.1% 4.5% 9.9% 0.5x 0.5x 6.4x 6.6x
Storage and Networking Components
SanDisk Corporation 9,573.8$ 40.02$ 74.7% 18.1% 5.5% 1.1x 1.0x 3.1x 3.0x
Western Digital Corporation 6,729.9 28.86 68.9% (0.5%) (9.8%) 0.4x 0.4x 2.5x 2.3x
QLogic Corporation 1,421.9 13.68 72.7% 4.1% (1.1%) 1.7x 1.7x 5.8x 5.3x
Emulex Corporation 589.0 6.67 51.4% 12.0% (28.2%) 0.9x 0.9x 18.3x 5.7x
Median 4,075.9$ 70.8% 8.1% (5.4% ) 1.0x 0.9x 4.4x 4.2x
Total Tech Hardware Median 3,504.1$ 68.5% 4.1% 2.7% 0.8x 0.9x 4.8x 5.0x
Note: Public comparables exclude companies with market capitalization below $500 million.
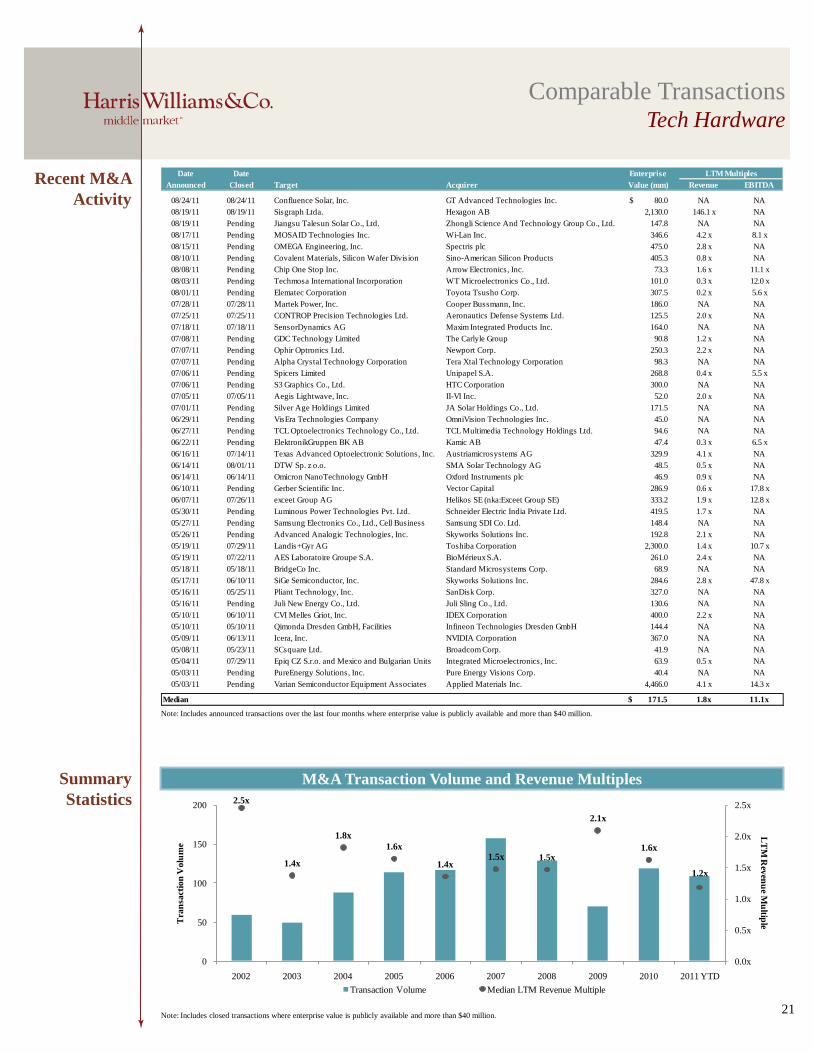
Date Date Enterprise LTM Multiples
Announced Closed Target Acquirer Value (mm) Revenue EBITDA
08/24/11 08/24/11 Confluence Solar, Inc. GT Advanced Technologies Inc. 80.0$ NA NA
08/19/11 08/19/11 Sisgraph Ltda. Hexagon AB 2,130.0 146.1 x NA
08/19/11 Pending Jiangsu Talesun Solar Co., Ltd. Zhongli Science And Technology Group Co., Ltd. 147.8 NA NA
08/17/11 Pending MOSAID Technologies Inc. Wi-Lan Inc. 346.6 4.2 x 8.1 x
08/15/11 Pending OMEGA Engineering, Inc. Spectris plc 475.0 2.8 x NA
08/10/11 Pending Covalent Materials, Silicon Wafer Division Sino-American Silicon Products 405.3 0.8 x NA
08/08/11 Pending Chip One Stop Inc. Arrow Electronics, Inc. 73.3 1.6 x 11.1 x
08/03/11 Pending Techmosa International Incorporation WT Microelectronics Co., Ltd. 101.0 0.3 x 12.0 x
08/01/11 Pending Elematec Corporation Toyota Tsusho Corp. 307.5 0.2 x 5.6 x
07/28/11 07/28/11 Martek Power, Inc. Cooper Bussmann, Inc. 186.0 NA NA
07/25/11 07/25/11 CONTROP Precision Technologies Ltd. Aeronautics Defense Systems Ltd. 125.5 2.0 x NA
07/18/11 07/18/11 SensorDynamics AG Maxim Integrated Products Inc. 164.0 NA NA
07/08/11 Pending GDC Technology Limited The Carlyle Group 90.8 1.2 x NA
07/07/11 Pending Ophir Optronics Ltd. Newport Corp. 250.3 2.2 x NA
07/07/11 Pending Alpha Crystal Technology Corporation Tera Xtal Technology Corporation 98.3 NA NA
07/06/11 Pending Spicers Limited Unipapel S.A. 268.8 0.4 x 5.5 x
07/06/11 Pending S3 Graphics Co., Ltd. HTC Corporation 300.0 NA NA
07/05/11 07/05/11 Aegis Lightwave, Inc. II-VI Inc. 52.0 2.0 x NA
07/01/11 Pending Silver Age Holdings Limited JA Solar Holdings Co., Ltd. 171.5 NA NA
06/29/11 Pending VisEra Technologies Company OmniVision Technologies Inc. 45.0 NA NA
06/27/11 Pending TCL Optoelectronics Technology Co., Ltd. TCL Multimedia Technology Holdings Ltd. 94.6 NA NA
06/22/11 Pending ElektronikGruppen BK AB Kamic AB 47.4 0.3 x 6.5 x
06/16/11 07/14/11 Texas Advanced Optoelectronic Solutions, Inc. Austriamicrosystems AG 329.9 4.1 x NA
06/14/11 08/01/11 DTW Sp. z o.o. SMA Solar Technology AG 48.5 0.5 x NA
06/14/11 06/14/11 Omicron NanoTechnology GmbH Oxford Instruments plc 46.9 0.9 x NA
06/10/11 Pending Gerber Scientific Inc. Vector Capital 286.9 0.6 x 17.8 x
06/07/11 07/26/11 exceet Group AG Helikos SE (nka:Exceet Group SE) 333.2 1.9 x 12.8 x
05/30/11 Pending Luminous Power Technologies Pvt. Ltd. Schneider Electric India Private Ltd. 419.5 1.7 x NA
05/27/11 Pending Samsung Electronics Co., Ltd., Cell Business Samsung SDI Co. Ltd. 148.4 NA NA
05/26/11 Pending Advanced Analogic Technologies, Inc. Skyworks Solutions Inc. 192.8 2.1 x NA
05/19/11 07/29/11 Landis+Gyr AG Toshiba Corporation 2,300.0 1.4 x 10.7 x
05/19/11 07/22/11 AES Laboratoire Groupe S.A. BioMérieux S.A. 261.0 2.4 x NA
05/18/11 05/18/11 BridgeCo Inc. Standard Microsystems Corp. 68.9 NA NA
05/17/11 06/10/11 SiGe Semiconductor, Inc. Skyworks Solutions Inc. 284.6 2.8 x 47.8 x
05/16/11 05/25/11 Pliant Technology, Inc. SanDisk Corp. 327.0 NA NA
05/16/11 Pending Juli New Energy Co., Ltd. Juli Sling Co., Ltd. 130.6 NA NA
05/10/11 06/10/11 CVI Melles Griot, Inc. IDEX Corporation 400.0 2.2 x NA
05/10/11 05/10/11 Qimonda Dresden GmbH, Facilities Infineon Technologies Dresden GmbH 144.4 NA NA
05/09/11 06/13/11 Icera, Inc. NVIDIA Corporation 367.0 NA NA
05/08/11 05/23/11 SCsquare Ltd. Broadcom Corp. 41.9 NA NA
05/04/11 07/29/11 Epiq CZ S.r.o. and Mexico and Bulgarian Units Integrated Microelectronics, Inc. 63.9 0.5 x NA
05/03/11 Pending PureEnergy Solutions, Inc. Pure Energy Visions Corp. 40.4 NA NA
05/03/11 Pending Varian Semiconductor Equipment Associates Applied Materials Inc. 4,466.0 4.1 x 14.3 x
Median 171.5$ 1.8x 11.1x
Recent M&A
Activity
21
Comparable TransactionsTech Hardware
Summary
Statistics
M&A Transaction Volume and Revenue Multiples
Note: Includes closed transactions where enterprise value is publicly available and more than $40 million.
Note: Includes announced transactions over the last four months where enterprise value is publicly available and more than $40 million.
2.5x
1.4x
1.8x
1.6x
1.4x1.5x 1.5x
2.1x
1.6x
1.2x
0.0x
0.5x
1.0x
1.5x
2.0x
2.5x
0
50
100
150
200
2002 2003 2004 2005 2006 2007 2008 2009 2010 2011 YTD
LT
M R
even
ue M
ultip
leTra
nsa
ctio
n V
olu
me
Transaction Volume Median LTM Revenue Multiple
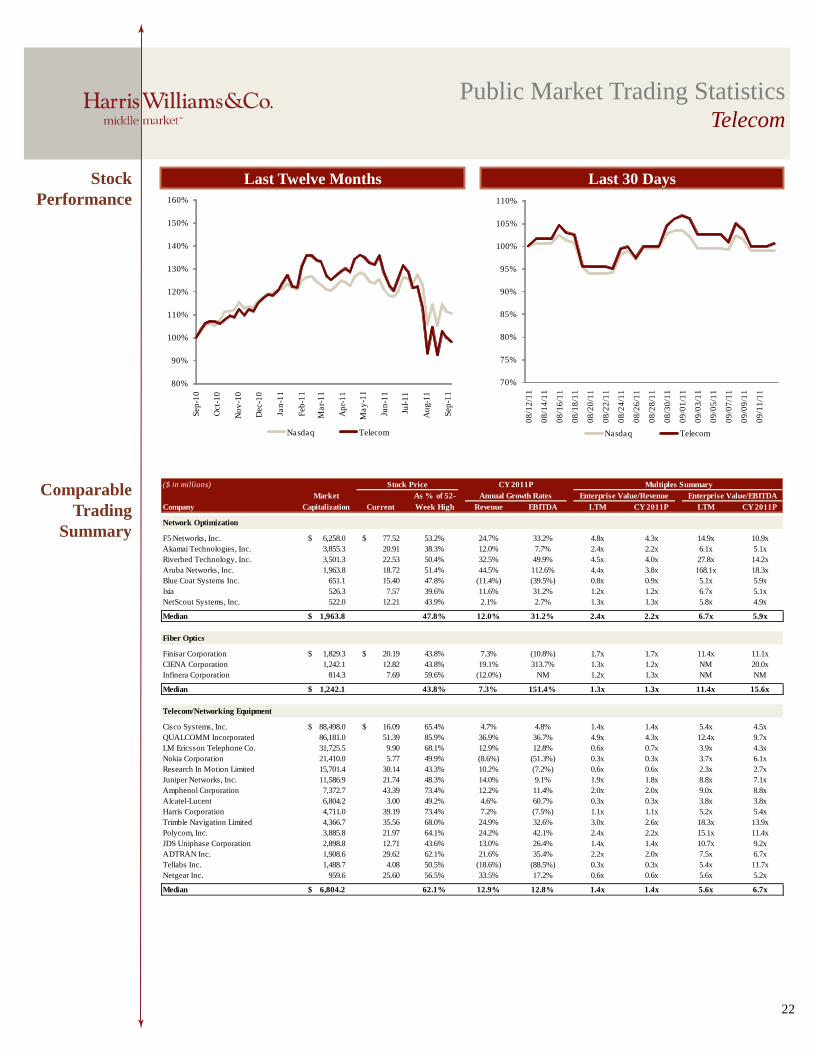
Public Market Trading StatisticsTelecom
22
Comparable
Trading
Summary
Stock
Performance
Last Twelve Months Last 30 Days
($ in millions) Stock Price CY 2011P Multiples Summary LTM
Market As % of 52- Annual Growth Rates Enterprise Value/Revenue Enterprise Value/EBITDA
Company Capitalization Current Week High Revenue EBITDA LTM CY 2011P LTM CY 2011P
Network Optimization
F5 Networks, Inc. 6,258.0$ 77.52$ 53.2% 24.7% 33.2% 4.8x 4.3x 14.9x 10.9x
Akamai Technologies, Inc. 3,855.3 20.91 38.3% 12.0% 7.7% 2.4x 2.2x 6.1x 5.1x
Riverbed Technology, Inc. 3,501.3 22.53 50.4% 32.5% 49.9% 4.5x 4.0x 27.8x 14.2x
Aruba Networks, Inc. 1,963.8 18.72 51.4% 44.5% 112.6% 4.4x 3.8x 168.1x 18.3x
Blue Coat Systems Inc. 651.1 15.40 47.8% (11.4%) (39.5%) 0.8x 0.9x 5.1x 5.9x
Ixia 526.3 7.57 39.6% 11.6% 31.2% 1.2x 1.2x 6.7x 5.1x
NetScout Systems, Inc. 522.0 12.21 43.9% 2.1% 2.7% 1.3x 1.3x 5.8x 4.9x
Median 1,963.8$ 47.8% 12.0% 31.2% 2.4x 2.2x 6.7x 5.9x
Fiber Optics
Finisar Corporation 1,829.3$ 20.19$ 43.8% 7.3% (10.8%) 1.7x 1.7x 11.4x 11.1x
CIENA Corporation 1,242.1 12.82 43.8% 19.1% 313.7% 1.3x 1.2x NM 20.0x
Infinera Corporation 814.3 7.69 59.6% (12.0%) NM 1.2x 1.3x NM NM
Median 1,242.1$ 43.8% 7.3% 151.4% 1.3x 1.3x 11.4x 15.6x
Telecom/Networking Equipment
Cisco Systems, Inc. 88,498.0$ 16.09$ 65.4% 4.7% 4.8% 1.4x 1.4x 5.4x 4.5x
QUALCOMM Incorporated 86,181.0 51.39 85.9% 36.9% 36.7% 4.9x 4.3x 12.4x 9.7x
LM Ericsson Telephone Co. 31,725.5 9.90 68.1% 12.9% 12.8% 0.6x 0.7x 3.9x 4.3x
Nokia Corporation 21,410.0 5.77 49.9% (8.6%) (51.3%) 0.3x 0.3x 3.7x 6.1x
Research In Motion Limited 15,701.4 30.14 43.3% 10.2% (7.2%) 0.6x 0.6x 2.3x 2.7x
Juniper Networks, Inc. 11,586.9 21.74 48.3% 14.0% 9.1% 1.9x 1.8x 8.8x 7.1x
Amphenol Corporation 7,372.7 43.39 73.4% 12.2% 11.4% 2.0x 2.0x 9.0x 8.8x
Alcatel-Lucent 6,804.2 3.00 49.2% 4.6% 60.7% 0.3x 0.3x 3.8x 3.8x
Harris Corporation 4,711.0 39.19 73.4% 7.2% (7.5%) 1.1x 1.1x 5.2x 5.4x
Trimble Navigation Limited 4,366.7 35.56 68.0% 24.9% 32.6% 3.0x 2.6x 18.3x 13.9x
Polycom, Inc. 3,885.8 21.97 64.1% 24.2% 42.1% 2.4x 2.2x 15.1x 11.4x
JDS Uniphase Corporation 2,898.8 12.71 43.6% 13.0% 26.4% 1.4x 1.4x 10.7x 9.2x
ADTRAN Inc. 1,908.6 29.62 62.1% 21.6% 35.4% 2.2x 2.0x 7.5x 6.7x
Tellabs Inc. 1,488.7 4.08 50.5% (18.6%) (88.5%) 0.3x 0.3x 5.4x 11.7x
Netgear Inc. 959.6 25.60 56.5% 33.5% 17.2% 0.6x 0.6x 5.6x 5.2x
Median 6,804.2$ 62.1% 12.9% 12.8% 1.4x 1.4x 5.6x 6.7x
80%
90%
100%
110%
120%
130%
140%
150%
160%S
ep
-10
Oct-
10
No
v-1
0
Dec-1
0
Jan
-11
Feb
-11
Ma
r-1
1
Ap
r-1
1
Ma
y-1
1
Jun
-11
Jul-
11
Au
g-1
1
Sep
-11
Nasdaq Telecom
70%
75%
80%
85%
90%
95%
100%
105%
110%
08
/12
/11
08
/14
/11
08
/16
/11
08
/18
/11
08
/20
/11
08
/22
/11
08
/24
/11
08
/26
/11
08
/28
/11
08
/30
/11
09
/01
/11
09
/03
/11
09
/05
/11
09
/07
/11
09
/09
/11
09
/11
/11
Nasdaq Telecom
Comparable
Trading
Summary
(continued)
Public Market Trading StatisticsTelecom
23
($ in millions) Stock Price CY 2011P Multiples Summary LTM
Market As % of 52- Annual Growth Rates Enterprise Value/Revenue Enterprise Value/EBITDA
Company Capitalization Current Week High Revenue EBITDA LTM CY 2011P LTM CY 2011P
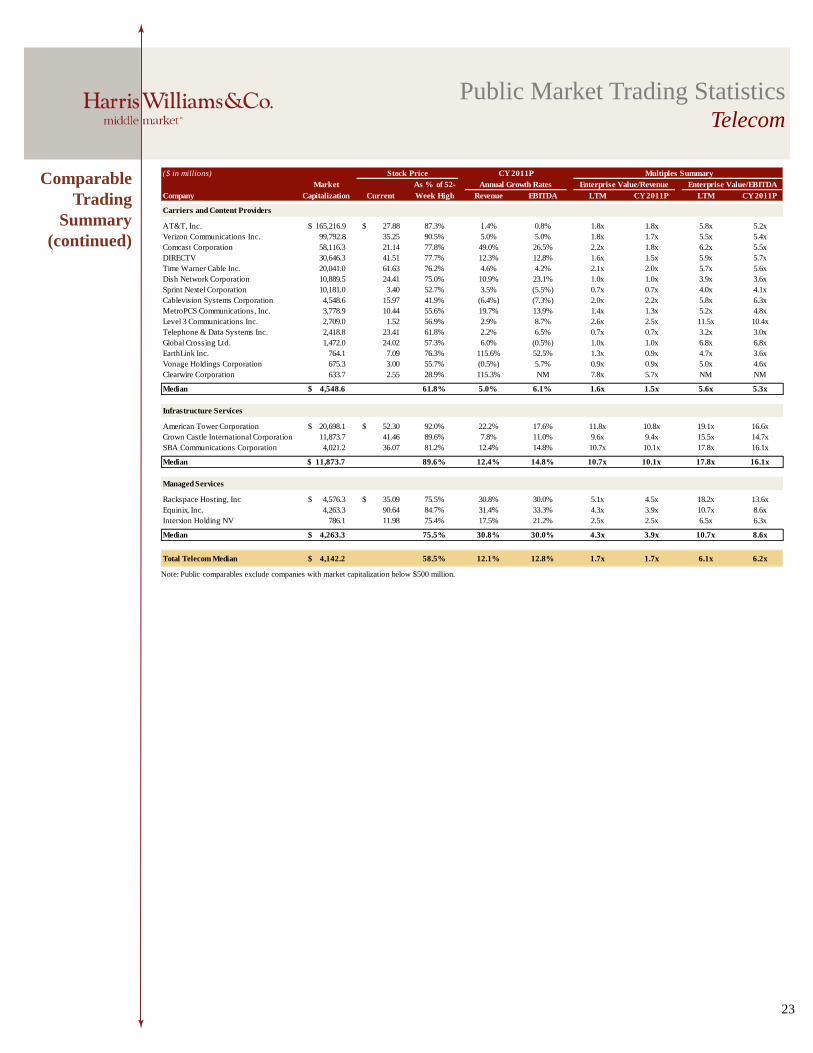
Carriers and Content Providers
AT&T, Inc. 165,216.9$ 27.88$ 87.3% 1.4% 0.8% 1.8x 1.8x 5.8x 5.2x
Verizon Communications Inc. 99,792.8 35.25 90.5% 5.0% 5.0% 1.8x 1.7x 5.5x 5.4x
Comcast Corporation 58,116.3 21.14 77.8% 49.0% 26.5% 2.2x 1.8x 6.2x 5.5x
DIRECTV 30,646.3 41.51 77.7% 12.3% 12.8% 1.6x 1.5x 5.9x 5.7x
Time Warner Cable Inc. 20,041.0 61.63 76.2% 4.6% 4.2% 2.1x 2.0x 5.7x 5.6x
Dish Network Corporation 10,889.5 24.41 75.0% 10.9% 23.1% 1.0x 1.0x 3.9x 3.6x
Sprint Nextel Corporation 10,181.0 3.40 52.7% 3.5% (5.5%) 0.7x 0.7x 4.0x 4.1x
Cablevision Systems Corporation 4,548.6 15.97 41.9% (6.4%) (7.3%) 2.0x 2.2x 5.8x 6.3x
MetroPCS Communications, Inc. 3,778.9 10.44 55.6% 19.7% 13.9% 1.4x 1.3x 5.2x 4.8x
Level 3 Communications Inc. 2,709.0 1.52 56.9% 2.9% 8.7% 2.6x 2.5x 11.5x 10.4x
Telephone & Data Systems Inc. 2,418.8 23.41 61.8% 2.2% 6.5% 0.7x 0.7x 3.2x 3.0x
Global Crossing Ltd. 1,472.0 24.02 57.3% 6.0% (0.5%) 1.0x 1.0x 6.8x 6.8x
EarthLink Inc. 764.1 7.09 76.3% 115.6% 52.5% 1.3x 0.9x 4.7x 3.6x
Vonage Holdings Corporation 675.3 3.00 55.7% (0.5%) 5.7% 0.9x 0.9x 5.0x 4.6x
Clearwire Corporation 633.7 2.55 28.9% 115.3% NM 7.8x 5.7x NM NM
Median 4,548.6$ 61.8% 5.0% 6.1% 1.6x 1.5x 5.6x 5.3x
Infrastructure Services
American Tower Corporation 20,698.1$ 52.30$ 92.0% 22.2% 17.6% 11.8x 10.8x 19.1x 16.6x
Crown Castle International Corporation 11,873.7 41.46 89.6% 7.8% 11.0% 9.6x 9.4x 15.5x 14.7x
SBA Communications Corporation 4,021.2 36.07 81.2% 12.4% 14.8% 10.7x 10.1x 17.8x 16.1x
Median 11,873.7$ 89.6% 12.4% 14.8% 10.7x 10.1x 17.8x 16.1x
Managed Services
Rackspace Hosting, Inc 4,576.3$ 35.09$ 75.5% 30.8% 30.0% 5.1x 4.5x 18.2x 13.6x
Equinix, Inc. 4,263.3 90.64 84.7% 31.4% 33.3% 4.3x 3.9x 10.7x 8.6x
Interxion Holding NV 786.1 11.98 75.4% 17.5% 21.2% 2.5x 2.5x 6.5x 6.3x
Median 4,263.3$ 75.5% 30.8% 30.0% 4.3x 3.9x 10.7x 8.6x
Total Telecom Median 4,142.2$ 58.5% 12.1% 12.8% 1.7x 1.7x 6.1x 6.2x
Note: Public comparables exclude companies with market capitalization below $500 million.

Recent M&A
Activity
24
Comparable TransactionsTelecom
Summary
Statistics
M&A Transaction Volume and Revenue Multiples
Note: Includes announced transactions over the last six months where enterprise value is publicly available and more than $40 million.
Note: Includes closed transactions where enterprise value is publicly available and more than $40 million.
Date Date Enterprise LTM Multiples
Announced Closed Target Acquirer Value (mm) Revenue EBITDA
09/03/11 Pending Unison Site Management, Communications Sites American Tower Corp. 500.0$ NA NA
08/15/11 Pending Motorola Mobility Holdings, Inc. Google Inc. 8,969.9 0.7 x 29.5 x
08/01/11 Pending Vizada SAS Astrium N.V. 960.0 NA NA
07/28/11 Pending ITIS Holdings plc Inrix, Inc. 51.1 1.9 x 12.5 x
07/22/11 Pending Network Norway AS Tele2 Sverige AB 268.0 0.9 x 77.3 x
07/15/11 Pending Colombia Movil S.A., Towers American Tower Corp. 182.0 NA NA
07/08/11 Pending AES Communications Rio de Janeiro S.A. Tim Celular S.A. 302.2 NA NA
06/27/11 Pending Outremer Telecom AXA Private Equity 367.8 1.4 x 5.5 x
06/16/11 Pending Teltronic S.A. Unipersonal Private Equity Consortia 56.6 0.6 x NA
06/14/11 Pending Terrestar Networks, Inc. Dish Network Corp. 1,325.0 NA NA
06/13/11 Pending Telecommunications Management Time Warner Cable Inc. 260.0 NA NA
06/12/11 Pending EMS Technologies Inc. Honeywell International Inc. 494.0 1.4 x 12.7 x
06/08/11 Pending B.net Hrvatska d.o.o. VIPnet d.o.o 135.5 3.3 x 11.3 x
06/01/11 Pending Hewlett-Packard Company, Visual Business Polycom, Inc. 89.0 NA NA
05/30/11 06/30/11 Metroweb S.p.A. Private Equity Consortia 626.8 8.5 x NA
05/20/11 Pending Modelabs SA BigBen Interactive 73.2 0.2 x 2.9 x
05/19/11 Pending Versatel AG Kohlberg Kravis Roberts & Co. 929.4 0.9 x 4.1 x
05/11/11 05/18/11 OnFone ApS TDC A/S 60.0 NA NA
05/10/11 Pending Skype Global S.à r.l. Microsoft Corporation 9,082.4 10.6 x 47.1 x
05/10/11 05/10/11 SCT Telecom SAS Backbone SAS; TIP Gestion SAS 142.2 1.4 x NA
05/02/11 07/08/11 Continuous Computing Corporation RadiSys Corporation 119.9 2.1 x NA
04/20/11 06/06/11 Smoothstone IP Communications, Inc. West Corporation 120.0 NA NA
04/10/11 Pending Global Crossing Ltd. Level 3 Communications Inc. 2,649.5 1.0 x 6.6 x
04/07/11 04/07/11 Jingle Networks, Inc. Marchex, Inc. 66.8 3.4 x NA
03/31/11 04/28/11 Ship Equip AS Inmarsat Plc 159.5 2.8 x NA
03/31/11 05/13/11 Smartlink Network Systems Limited Schneider Electric India Private Ltd. 112.8 3.2 x NA
03/24/11 06/13/11 Vivo Participacoes S.A. Telecomunicacoes de Sao Paulo S.A. - TELESP 16,035.4 1.5 x 5.0 x
03/23/11 Pending Sascar Tecnologia E Segurança Automotiva S/A GP Investments; GP Capital Partners V 180.5 1.5 x NA
03/22/11 03/31/11 BelCompany BV GP Capital Partners 170.4 0.7 x NA
03/22/11 05/09/11 Ignis ASA Finisar Corp. 99.6 2.1 x 259.1 x
03/20/11 Pending T-Mobile USA Inc. AT&T, Inc. 38,891.0 1.8 x 7.1 x
03/18/11 Pending Foxconn Precision Electronics (Taiyuan) Co., Ltd. Prime Rich Holdings Limited 70.5 0.5 x NA
Median 181.2$ 1.5x 11.3x
2.6x
1.9x2.1x 2.1x 2.0x
1.7x
2.1x 2.1x
1.5x1.4x
0.0x
0.5x
1.0x
1.5x
2.0x
2.5x
3.0x
3.5x
0
50
100
150
200
2002 2003 2004 2005 2006 2007 2008 2009 2010 2011 YTD
LT
M R
even
ue M
ultip
leTra
nsa
ctio
n V
olu
me
Transaction Volume Median LTM Revenue Multiple

Selected HW&Co. TTDM Transactions
a portfolio company of
has been acquired by
GFI Energy Group
a division of
a subsidiary of
has been acquired by
a portfolio company of
has received a minority
private placement from
a portfolio company of
has been acquired by
a portfolio company of
has been acquired by
a portfolio company of
has been acquired by
a portfolio company of
has received a strategic
investment from
a portfolio company of
has been acquired by
25
a portfolio company of
has acquired
a portfolio company of
has merged with
has been acquired by
has received a minority
investment from
a portfolio company of
has been acquired by
a portfolio company of
has been acquired by
has acquired
a portfolio company of
has been recapitalized by

Harris Williams & Co. (www.harriswilliams.com), a member of The PNC Financial Services Group, Inc. (NYSE:PNC), is the
premier middle market advisor with a two-decade legacy of sell side excellence serving clients worldwide. The firm is focused
exclusively on the middle market, providing sell side and acquisition advisory, restructuring advisory, board advisory, private
placements and capital markets advisory services.
Investment banking services are provided by Harris Williams LLC, a registered broker-dealer and member of FINRA and SIPC,
and Harris Williams & Co. Ltd, an Appointed Representative of Sturgeon Ventures LLP, which is Authorized and Regulated by
the Financial Services Authority. Harris Williams & Co. is a trade name under which Harris Williams LLC and Harris Williams
& Co. Ltd conduct business in the U.S. and Europe, respectively.
THIS REPORT MAY CONTAIN REFERENCES TO REGISTERED TRADEMARKS, SERVICE MARKS AND
COPYRIGHTS OWNED BY THIRD-PARTY INFORMATION PROVIDERS. NONE OF THE THIRD-PARTY
INFORMATION PROVIDERS IS ENDORSING THE OFFERING OF, AND SHALL NOT IN ANY WAY BE DEEMED AN
ISSUER OR UNDERWRITER OF, THE SECURITIES, FINANCIAL INSTRUMENTS OR OTHER INVESTMENTS
DISCUSSED IN THIS REPORT, AND SHALL NOT HAVE ANY LIABILITY OR RESPONSIBILITY FOR ANY
STATEMENTS MADE IN THE REPORT OR FOR ANY FINANCIAL STATEMENTS, FINANCIAL PROJECTIONS OR
OTHER FINANCIAL INFORMATION CONTAINED OR ATTACHED AS AN EXHIBIT TO THE REPORT. FOR MORE
INFORMATION ABOUT THE MATERIALS PROVIDED BY SUCH THIRD PARTIES, PLEASE CONTACT US AT THE
ABOVE ADDRESSES OR NUMBERS.
The information and views contained in this report were prepared by Harris Williams & Co. (“Harris Williams”). It is not a
research report, as such term is defined by applicable law and regulations, and is provided for informational purposes only. It is
not to be construed as an offer to buy or sell or a solicitation of an offer to buy or sell any financial instruments or to participate in
any particular trading strategy. The information contained herein is believed by Harris Williams to be reliable, but Harris
Williams makes no representation as to the accuracy or completeness of such information. Harris Williams and/or its affiliates
may be market makers or specialists in, act as advisers or lenders to, have positions in and effect transactions in securities of
companies mentioned herein and also may provide, may have provided, or may seek to provide investment banking services for
those companies. In addition, Harris Williams and/or its affiliates or their respective officers, directors and employees may hold
long or short positions in the securities, options thereon or other related financial products of companies discussed herein.
Opinions, estimates and projections in this report constitute Harris Williams’ judgment and are subject to change without notice.
The financial instruments discussed in this report may not be suitable for all investors, and investors must make their own
investment decisions using their own independent advisors as they believe necessary and based upon their specific financial
situations and investment objectives. Also, past performance is not necessarily indicative of future results. No part of this material
may be copied or duplicated in any form or by any means, or redistributed, without Harris Williams’ prior written consent.
Copyright© 2011 Harris Williams & Co., all rights reserved.
TTDM Group Overview
and Disclosures
Thierry Monjauze
Managing Director
63 Brook Street
London W1K 4HS
United Kingdom
Phone: +44 20 7518 [email protected]
Jeff Bistrong
Managing Director
Two International Place, 24th Floor
Boston, MA 02110
USA
Phone: +1 (617) [email protected]
Our Technology, Telecom & Digital Media (TTDM) Group is dedicated to providing superior merger & acquisition
and capital markets advisory services to market leading companies. Our extensive industry knowledge and
transaction leadership experience spans the software, digital media, IT services and communications sectors. Our
professionals in Boston, London, and San Francisco have global relationships with leading technology companies
and financial investors. Thoughtful advice, deep experience and technology expertise, creativity and attention to
detail from our senior technology bankers have resulted in a track record of consistently exceeding our clients'
expectations.
1001 Haxall Point
9th Floor
Richmond, VA 23219
USA
Phone: +1 (804) 648-0072
Fax: +1 (804) 648-0073
Two International Place
24th Floor
Boston, MA 02110
USA
Phone: +1 (617) 482-7501
Fax: +1 (617) 482-7503
1900 East 9th Street
20th Floor
Cleveland, OH 44114
USA
Phone: +1 (216) 689-2400
Fax: +1 (216) 689-2401
63 Brook St
London, W1K 4HS
United Kingdom
Phone: +44 20 7518 8900
Fax: +44 20 7526 2187
222 South Ninth Street
Suite 3350
Minneapolis, MN 55402
USA
Phone: +1 (612) 359-2700
Fax: +1 (612) 359-2701
1600 Market Street
21st Floor
Philadelphia, PA 19103
USA
Phone: +1 (267) 675-5900
Fax: +1 (267) 675-5901
575 Market Street
31st Floor
San Francisco, CA 94105
USA
Phone: +1 (415) 288-4260
Fax: +1 (415) 288-4269
www.harriswilliams.com26
Mike Wilkins
Managing Director
575 Market Street, 31st Floor
San Francisco, CA 94105
USA
Phone: +1 (415) [email protected]