Embed Size (px)
Citation preview

Technology Roadmap Analysis 2013: Assessing Automotive Technology R&D Relevant to DOE
Power Electronics Cost Targets
Christopher L. Whaling Organization: Synthesis Partners, LLC Email: [email protected] Phone: 703-318-7002 Team members: Steven Boyd, DOE-VTP Richard Holcomb, Synthesis Partners Frank Williams, Synthesis Partners Frieda Hanratty, Ph.D. Synthesis Partners 2013 DOE AMR Vehicle Technologies Program Gateway Crystal Marriott Hotel Arlington, VA
May 14, 2013 Project ID: APE032
This presentation does not contain any proprietary or confidential information

DOE APEEM FY13 Kickoff Meeting
• Start: Oct 2012
• Finish: Sept 2013
• Percent complete: 50%
• Gaps in technical understanding of paths to scalable automotive power electronics production leadership
• R&D and associated milestones needed to achieve the DOE 2015 ($5/kW) and 2020 ($3.30/kW) power electronics-only cost targets
• Production bottlenecks that limit high volume power inverter manufacturing
• Foreign language information processing
Timeline
Budget
Barriers Addressed
• Interactions/ collaborations: • USCAR Electrical and Electronics Tech
Team (EETT); OEMs, Tier 1-4 Suppliers, Ames Research Lab, ORNL.
• Project lead: Synthesis Partners, LLC
Partners
Overview
• Funding for FY13: $235K

DOE APEEM FY13 Kickoff Meeting
The Power Electronics Cost Reduction Challenge Has Three Critical Dimensions
Manufacturing Volume
Supply Chain Integration
Investment (Private and Public)
Technology RDT&E
© Synthesis Partners, LLC

DOE APEEM FY13 Kickoff Meeting
5
FY 13 Research Objectives
• Identify and assess lessons-learned from power electronics production leaders including their North American-based actions and strategies • Characterize best practices relevant to North American power
electronics supply-network expansion activities • Identify the top constraints or bottlenecks that currently limit Tier 1-
4 producers from achieving high volume power inverter manufacturing in North America
• Begin to build a business case of an integrated approach to achieve a significant expansion in North American power inverter manufacturing volume
• Integrate all findings and results with 2012 Inverter Roadmap Analysis and produce graphical portrayal of results and progress in roadmap diagrams, as appropriate.

DOE APEEM FY13 Kickoff Meeting
6
FY13 Tasks and Timeline 2012
Oct
Nov
Dec
2013
Jan
Feb
Mar
Apr
May
Jun
Jul
Aug
Sep
New topics under development
FY 13 research design and planning
First round collection and analysis
Go No/Go Decision Point: Ongoing assessment and end-of-phase review. Challenges/Barriers: Time to process large amounts of heterogeneous data;
Access to primary sources and foreign language data. Key Deliverable: Presentations and concise reports on key findings.
Report Key
Findings
Mid-phase
Review
Second round collection and analysis

DOE APEEM FY13 Kickoff Meeting
7
General Research Approach and Strategy • Global coverage (tens of thousands of sources mined and
hundreds engaged)
• Initiated multi-lingual, targeted secondary source assessment • Japanese • Chinese
• Integrated in-depth primary source collection and secondary source assessment
• Flexible approach to enable rapid adjustments to new information • Many aspects of cost reduction are not driven by technology • Market, business and technology insights needed to address DOE
power electronics cost reduction targets
• First round collection cut-off date: May 2013
DOE APEEM FY13 Kickoff Meeting
8
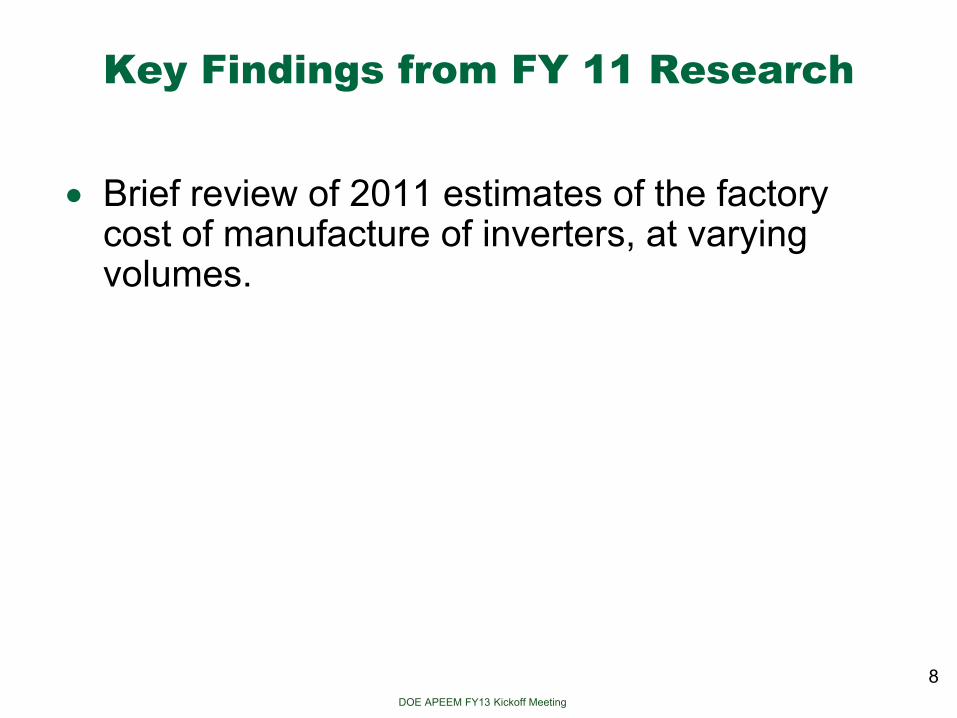
Key Findings from FY 11 Research
• Brief review of 2011 estimates of the factory cost of manufacture of inverters, at varying volumes.

DOE APEEM FY13 Kickoff Meeting
Prius-Type Inverter Cost Estimate: Methodology and Update
1. The factory cost of a mature Prius’ hybrid system is $3385 (as per the detailed top-down analysis in SP report “Hybrid Vehicle Power Inverters Cost Analysis,” dated July 2011).
2. Using expert primary source estimates we conclude that the power electronics make up 24 percent of the cost of a hybrid system, indicating that a Toyota’s power electronics (dual inverter plus DC/DC converter) currently cost $812. (SP July 2011.)
3. DOE estimates that a single-inverter unit would cost 66 percent of the dual-inverter unit Toyota uses. This would result in a factory cost estimate of $536 for a single-inverter-plus DC/DC converter unit based on Toyota’s current architecture. This includes the power electronics for both the inverter and the DC/DC converter. (SP July 2011.)
4. A Toyota-specific, single inverter (minus the DC/DC converter) factory cost estimate may be derived based on our FY 11 research, and is in the $379 range. (SP March 2013 update.)
9
DOE APEEM FY13 Kickoff Meeting
Source Methodology Component Assumed Volume
Current Cost Estimate
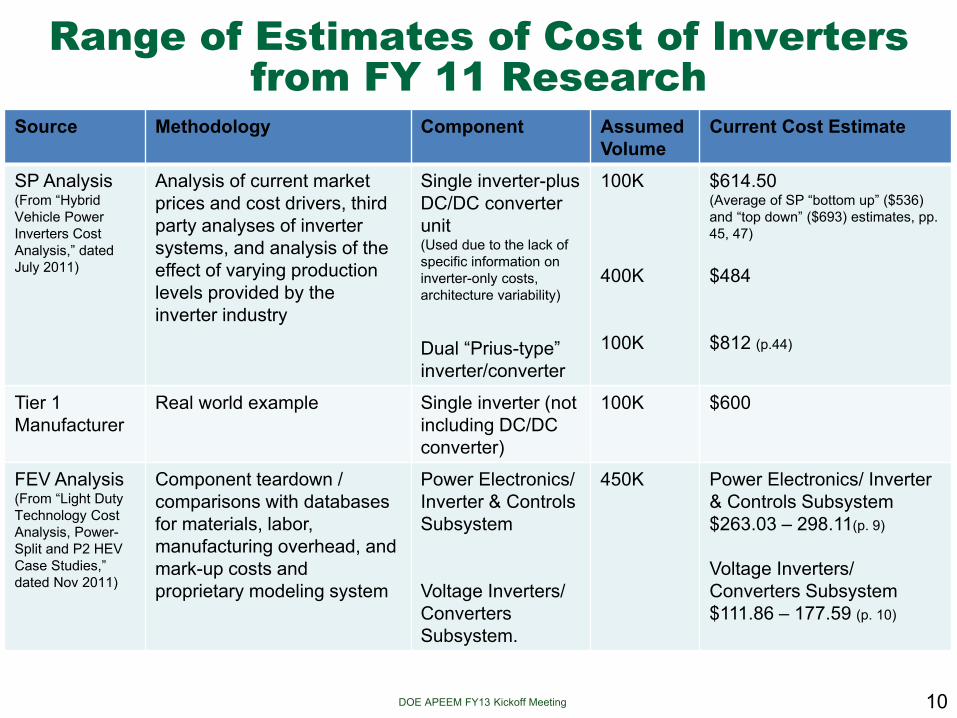
SP Analysis (From “Hybrid Vehicle Power Inverters Cost Analysis,” dated July 2011)
Analysis of current market prices and cost drivers, third party analyses of inverter systems, and analysis of the effect of varying production levels provided by the inverter industry
Single inverter-plus DC/DC converter unit (Used due to the lack of specific information on inverter-only costs, architecture variability) Dual “Prius-type” inverter/converter
100K 400K 100K
$614.50 (Average of SP “bottom up” ($536) and “top down” ($693) estimates, pp. 45, 47) $484 $812 (p.44)
Tier 1 Manufacturer
Real world example Single inverter (not including DC/DC converter)
100K $600
FEV Analysis (From “Light Duty Technology Cost Analysis, Power-Split and P2 HEV Case Studies,” dated Nov 2011)
Component teardown / comparisons with databases for materials, labor, manufacturing overhead, and mark-up costs and proprietary modeling system
Power Electronics/ Inverter & Controls Subsystem Voltage Inverters/ Converters Subsystem.
450K Power Electronics/ Inverter & Controls Subsystem $263.03 – 298.11(p. 9) Voltage Inverters/ Converters Subsystem $111.86 – 177.59 (p. 10)
10
Range of Estimates of Cost of Inverters from FY 11 Research
DOE APEEM FY13 Kickoff Meeting
11
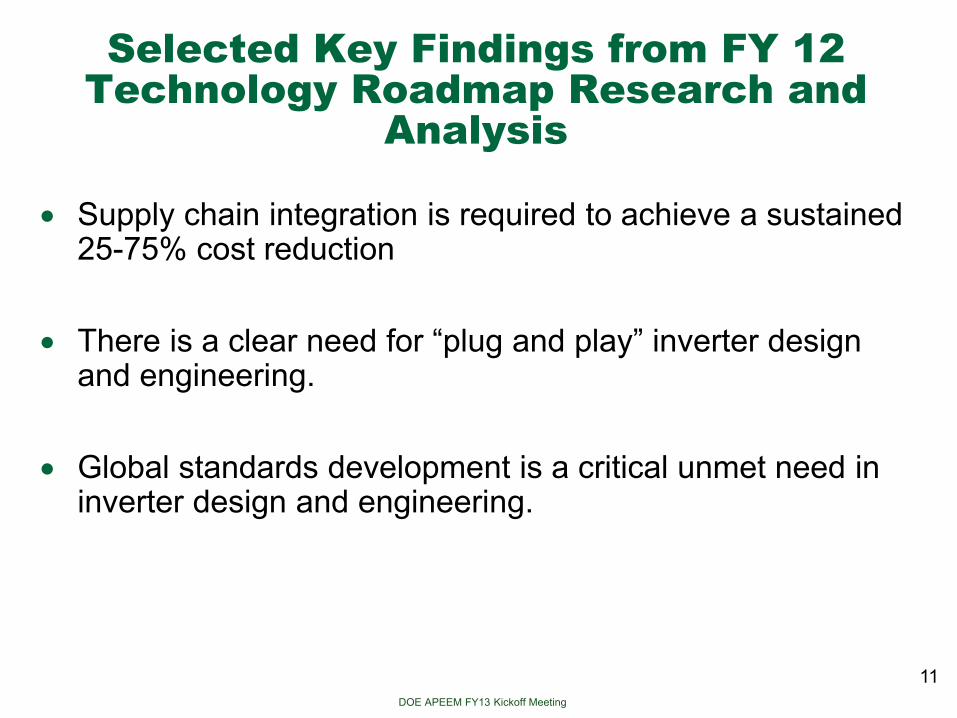
Selected Key Findings from FY 12 Technology Roadmap Research and
Analysis
• Supply chain integration is required to achieve a sustained 25-75% cost reduction
• There is a clear need for “plug and play” inverter design and engineering.
• Global standards development is a critical unmet need in inverter design and engineering.

DOE APEEM FY13 Kickoff Meeting
Supply Chain Integration is Required to Achieve Sustained 25-75% Cost Reduction
• Key finding #1: Systems-level, modular design and engineering has become a strategic requirement.
• Key finding #2: Documentation, sharing and refining of lessons-learned in modularization and systems-level engineering is a strategic requirement.
• Key finding #3: “In-house” only production model presents diminishing rate of returns for cost reduction • By the time “major” changes occur, the market will have shifted
to even lower cost-base • A vigorous standards development activity built on
simplification, not over-complexity, is needed.
12

DOE APEEM FY13 Kickoff Meeting
Plug and Play Inverter Design and Engineering is Required
• This is another very big cost driver and area for significant cost reduction in the future. Currently, each inverter is unique, with different specs and design requirements. – Tier 1A
• If modularization went high volume, 40 or up to 50 percent cost reduction could result. This could take 10-15 years at the current rate of change – Tier 1B
• There needs to be a “plug and play” system, but currently inverters and power electronics must be redesigned each time. – OEM 1
• Interchangeability between different models is the future direction. – OEM 2

DOE APEEM FY13 Kickoff Meeting
New Standards Are Needed
• Standardization is needed across the industry. The features of power electronics systems should be standardized. – OEM-1
• Global standards are needed to address performance, safety, durability, reliability and other requirements for inverters and their subcomponents. – OEM-2
• Conservatively, global standards could lead to at least 10% in cost reduction – OEM-3
• After 2020, the existence of global standards will be a critical driver for future, significant cost reductions – OEM-1

DOE APEEM FY13 Kickoff Meeting
15
Global Top Ten Lists and Rankings
• Top 10 Automotive Traction Drive Inverter Suppliers
• Top Eight Chinese Traction Drive Inverter Suppliers
• Vehicle Production Growth by Continent
• Vehicle Production By Top 15 Countries
• Top 15 Countries By IEEE Inverter Research Activity

DOE APEEM FY13 Kickoff Meeting
Top 10 Automotive Traction Drive Inverter Suppliers, 2010-2012
Propulsion Inverter Supplier 2010* 2011* 2012*
Three Year Total*
Toyota/DENSO 770,863 680,738 1,279,073 2,730,674 Mitsubishi Electric 195,536 226,033 294,868 716,437 Hitachi 29,663 58,365 156,065 244,093 Toshiba 69,706 5,885 42,320 117,911 Continental 7,859 20,257 85,585 113,701 Bosch 7,332 19,003 56,153 82,488 Hyundai Mobis 11,652 27,940 53,762 93,354 Calsonic Kansei 0 27,258 37,980 65,238 TDK 0 56,952 22,271 79,223 Edrive 563 4,285 9,025 13,873 Annual Subtotals*: 1,093,174 1,126,716 2,037,102 4,256,992
*These numbers are provided to show order of magnitude comparisons between suppliers. Data is based on ongoing research and subject to change as updates become available. Note that rankings below the top seven are subject to significant churn. Totals reflect the number of vehicles in which the inverters were installed for that calendar year. Source: Synthesis Partners’ power electronics and automotive technology supplier database (March 2013).
16

DOE APEEM FY13 Kickoff Meeting
Top Eight Chinese Traction Drive Inverter Suppliers, 2010-2012
Chinese Inverter Suppliers with Number of Chinese Vehicle OEMs Supplied:
Propulsion Inverter Supplier 2010* 2011* 2012*
Three Year
Total*
Number of Automakers Supplied (2012)
Edrive 563 4,285 9,025 13,873 6 Dajun 1,320 1,624 4,817 7,761 5 Zhongke Shenjiang 609 2,489 3,481 6,579 1 BYD 502 1,454 3,600 5,556 1 Unite 0 1,372 3,092 4,464 2 Weiteli 341 377 1,030 1,748 1 Qingyuan 123 16 322 461 1 Nanche 48 38 38 124 1
• Low-cost, Chinese-made HEVs and EVs for domestic markets are being supplied with home-grown “good enough” inverters
• Chinese-made inverters: Volume for 2012: 40,566
17
*Totals reflect the number of vehicles in which the inverters were installed for that calendar year. Data based on on-going research and subject to change as updates become available. Source: Synthesis Partners’ power electronics and automotive technology supplier database (March 2013).

DOE APEEM FY13 Kickoff Meeting
Vehicle Production Growth by Continent
18
Source: International Organization of Motor Vehicle Manufacturers (March 2013).

DOE APEEM FY13 Kickoff Meeting
Vehicle Production, By Top 15 Countries
19
Source: International Organization of Motor Vehicle Manufacturers, (March 2013).

DOE APEEM FY13 Kickoff Meeting
Top 15 Countries, by IEEE Inverter Research Activity (2008-2012)
20

DOE APEEM FY13 Kickoff Meeting
Power Electronics Database Update
• Over 30 date-specific technology projections • More than 40 global R&D and technology transition activities • 500 IEEE article abstracts identified, sorted and analyzed for
trends • US and foreign company-specific data:
• Every major OEM, Tier 1 and Tier 2 supplier • For every EV, HEV or PHEV on the road, the name of the company that
supplies the inverter(s), converter(s), battery and motor • Total number of EV, HEV or PHEV vehicles supplied by each
manufacturer, and projections
• Data on projections, engineering trends and market leadership positions still being extracted from primary source results
• Growing repository of foreign-language publications dedicated to power electronics and motor drive.
21
DOE APEEM FY13 Kickoff Meeting
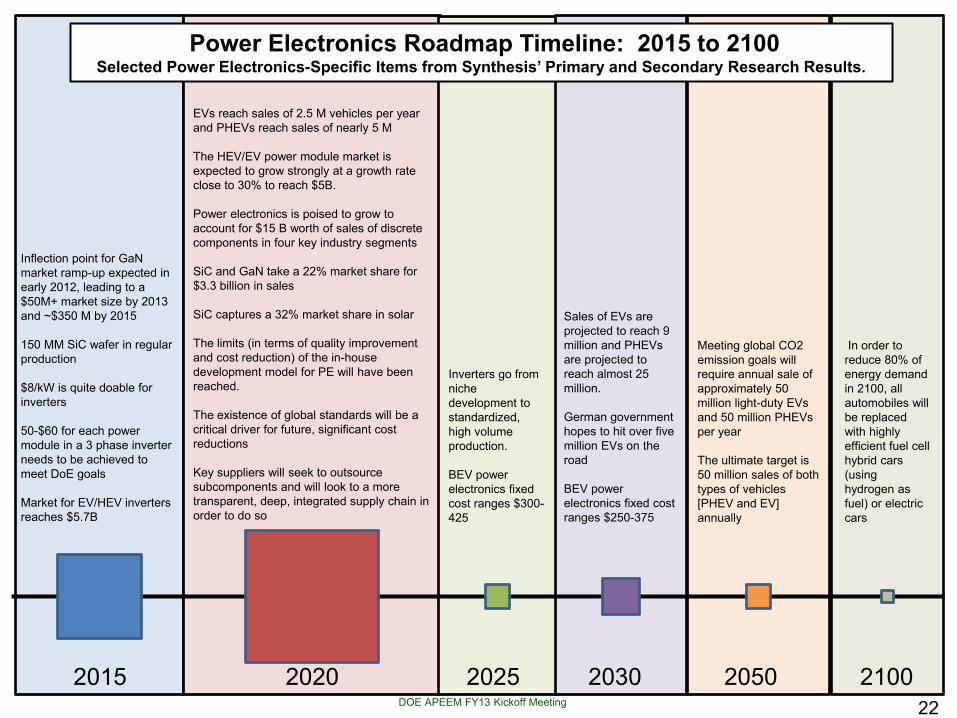
2015 2020 2025 2030 2050 2100
Inflection point for GaN market ramp-up expected in early 2012, leading to a $50M+ market size by 2013 and ~$350 M by 2015 150 MM SiC wafer in regular production $8/kW is quite doable for inverters 50-$60 for each power module in a 3 phase inverter needs to be achieved to meet DoE goals Market for EV/HEV inverters reaches $5.7B
EVs reach sales of 2.5 M vehicles per year and PHEVs reach sales of nearly 5 M The HEV/EV power module market is expected to grow strongly at a growth rate close to 30% to reach $5B. Power electronics is poised to grow to account for $15 B worth of sales of discrete components in four key industry segments SiC and GaN take a 22% market share for $3.3 billion in sales SiC captures a 32% market share in solar The limits (in terms of quality improvement and cost reduction) of the in-house development model for PE will have been reached. The existence of global standards will be a critical driver for future, significant cost reductions Key suppliers will seek to outsource subcomponents and will look to a more transparent, deep, integrated supply chain in order to do so
Inverters go from niche development to standardized, high volume production. BEV power electronics fixed cost ranges $300-425
Sales of EVs are projected to reach 9 million and PHEVs are projected to reach almost 25 million. German government hopes to hit over five million EVs on the road BEV power electronics fixed cost ranges $250-375
Meeting global CO2 emission goals will require annual sale of approximately 50 million light-duty EVs and 50 million PHEVs per year The ultimate target is 50 million sales of both types of vehicles [PHEV and EV] annually
In order to reduce 80% of energy demand in 2100, all automobiles will be replaced with highly efficient fuel cell hybrid cars (using hydrogen as fuel) or electric cars
Power Electronics Roadmap Timeline: 2015 to 2100 Selected Power Electronics-Specific Items from Synthesis’ Primary and Secondary Research Results.
22

DOE APEEM FY13 Kickoff Meeting
Collaborations • Close coordination and involvement with USCAR
Electrical/Electronics Tech Team.
• Close coordination and collaboration with industry, universities, federal laboratories, and subject matter experts on both public and proprietary basis.
• Collection from sources outside the DOE-Vehicle Technologies Program to identify low-cost technology development opportunities in support of DOE goals .
• Industry engagements: Global OEMs, Tier 1 and 2 suppliers, technology developer networks, VivoMind™ Research.
• Federal Research Lab: ORNL, Argonne, Ames Research Lab and international S&T labs (TBD)
23

DOE APEEM FY13 Kickoff Meeting
• FY 13 research and analysis work is at mid-point.
• FY 13 research builds on prior work and findings, and leverages growing in-house database of results.
• Collaboration with EETT is key part of FY 13 work and tasking focus.
24
Summary