Embed Size (px)
Citation preview

Technology, Monopoly, and the Decline of the
Viatical Settlements Industry 1
Neeraj Sood2
RANDAbby Alpert3
RANDJay Bhattacharya4
Stanford Universityand NBER
December 29, 2004
1We thank the National Institute on Aging for financial assistance.2RAND, 1776 Main Street, Santa Monica, CA 90407 ([email protected])3RAND, 1776 Main Street, Santa Monica, CA 90407 ([email protected])4Center for Primary Care and Outcomes Research, Stanford Medical School,
117 Encina Commons, Stanford, CA 94305-6019 ([email protected])

Abstract
Markets that in which prices depend upon the mortality risk of the insuredmust necessarily make forecasts about future technological shocks. But howwell do markets do in making these forecasts? We exploit the 1996 introduc-tion and dissemination of effective anti- HIV medication, which substantiallyreduced mortality from HIV and AIDS, to test answer this question in thecase of the viatical settlement market. In this market, consumers with HIVsell their life insurance policies to firms in return for an up-front payment.Using Freedom of Information Act (FOIA) requests to state insurance regu-latory agencies, we have assembled a unique dataset of over twelve thousandviatical transactions from firms licensed in states that regulate viatical settle-ment markets. We find that the viatical market did a poor job in anticipatingthe introduction of effective antiretroviral medication in 1995, became overlyoptimistic about further treatment advances between 1996 and 1998, andthen reverted to pessimism (which has thus far been borne out) between1999 and 2001.

2
1 Introduction
Living in the post-Schumpeterian age, we often view technological progress
as a process of creative destruction – that is, the emergence of a new tech-
nology leading to the dissolution of an old industry. For example, think of
the development of the automobile and the plight of horse-buggy manufac-
turers at the turn of the 20th century. However, new industries do not always
destroy their older counterparts. In fact, sometimes they create entirely new
products that enhance the value of older products. In this paper, we study
the life cycle of one such industry, the viatical settlement industry, that cre-
ated an entirely new product and enhanced the value of billions of dollars
worth of already existing life insurance policies. The study of this new in-
dustry has several important and unique aspects. First, the development
and subsequent dissolution of this industry has important implications for
consumer welfare, especially of terminally ill consumers, who benefited the
most from the emergence of this industry. Second, unlike most industries,
where within-industry technological developments are the proximate cause
of industrial decline, the relatively rapid decline of this industry was spurred
by a technological shock wholly outside of this industry – that is, pharma-
cological advances in the treatment of HIV/AIDS. Finally, the study of this
industry is intellectually appealing, especially for economists, as it presents
the rare opportunity to study an industry that owes its very existence to an
advance in economic knowledge.
The viatical settlement industry emerged in 1989 in response to the AIDS
epidemic. AIDS patients or individuals with other life threatening illnesses
are often unable to work and often lack health insurance coverage. Con-
sequently, such people are frequently under extreme financial stress: they
need cash now to buy life-saving treatments, but do not have enough income
or liquid assets to pay prescription bills. Until recently, the only options
for these people were to either default on their payments or borrow against
their non-liquid assets such as a house or a cash value life insurance policy.

3
The viatical settlement industry changed this by providing an opportunity
for terminally-ill consumers to exploit a previously untapped source of eq-
uity in existing life insurance contracts to finance consumption and medical
expenses.
A typical viatical settlement transaction works in the following manner:
the policyholder receives an immediate up-front payment at a discount to
the face value of the life insurance policy; in return, he makes a third party
the sole beneficiary of the policy. The third party collects the death benefits
promised by the policy when the policyholder dies, but pays all remaining
premiums on the policy while the policyholder is alive. The reason why life
insurance policies of individuals with HIV (or other life-threatening illnesses)
are valuable to third parties is because premiums were set before the poli-
cyholder contracted their disease. Thus, the expected present value of the
policy’s face value, evaluated using the mortality rates of the now HIV posi-
tive patient, is greater than the net present value of the premium payments
plus the up-front settlement payment. Moreover, the value of the initial up-
front payment to the policyholder by the viatical company will be inversely
proportional to the life expectancy of the policyholder, since the company
collects the full value only when the policyholder dies.
While viatical settlements represent a significant advance in contracting
technology and have become an important source of income for persons near-
ing the end of life, there has been little scrutiny of this industry - and its
unusual life-cycle - in the economic literature. Using Freedom of Information
Act (FOIA) requests to state insurance regulatory agencies, we have assem-
bled a unique dataset of over twelve thousand viatical transactions from firms
licensed in states that regulate viatical settlement markets. Our transaction
data are representative (and virtually a census) of the universe of viatical
settlement transactions that took place in regulated states between 1995 and
2001. Using these data, we are the first to document the nationwide decline
in the number of viatical firms and transactions over this period. For exam-

4
ple, in Texas, which was initially the largest viatical market in the U.S., there
were 94 percent fewer transactions in 2001 than in 1995. We also identify two
other key trends. First, we document a sharp decline in the price of viatical
settlements, even after taking into account the improvement in the health of
the HIV positive population over that period. In addition, we also find larger
reductions in returns for those with longer life expectancies. For example,
prices in California dropped by more than 50 percent for policyholders with
a life expectancy greater than 3 years, compared to a decline of 20 percent
for individuals with less than one year to live.
The technological shock that has triggered this industry’s dissolution is
the 1996 introduction and dissemination of a set of powerful medications that
delay the onset of terminal AIDS symptoms and mortality in HIV infected pa-
tients. Collectively, these drugs are known as Highly Active Anti-Retroviral
Therapy (HAART), and were a major and unexpected breakthrough in the
treatment of HIV. In the wake of their widespread diffusion in the U.S., an-
nual mortality rates among HIV patients declined by 60% between 1996 and
2001 (CDC, 2001; CDC, 2002). Almost overnight, HIV was transformed from
a too-quick death sentence into a chronic and manageable illness.
We have two main aims in this paper. The first is to document some
basic facts about the structure and performance of the viatical settlement
industry for the period between 1995 and 2001, using the data set that we
have compiled. With few exceptions, there has been little academic work
done on the viatical settlement industry, and as a consequence, such facts are
available nowhere in the extant literature. Our second aim is to build a model
of the HAART technological shock in this market, estimate the model using
our data, and then infer the welfare consequences of the decline in the market
for sellers. The key motivation underlying our model is to distinguish two
explanations for falling prices—an increase in market power, and a change
in market expectations about the likelihood of further improvements in HIV
care.

5
Such an exercise is important for both practical and intellectual reasons.
First, even in the post-HAART era, the viatical settlement market represents
an important source of financing life-saving medication for many HIV+ pa-
tients. In this case, ensuring effective competition is literally a matter of life
or death. Second, the contracting innovation that led to the development
of the viatical settlement market has been adopted by life insurance com-
panies themselves. The population of policyholders who can now sell their
policies has expanded beyond HIV patients to the chronically ill elderly pop-
ulation more generally. As the population ages, these so-called life or senior
settlements are becoming increasingly popular. In part this reflects demo-
graphic trends, but also the rising costs of treating chronic illnesses (Joyce
et al., 2002). Indeed, a 1999 study by the Conning Corporation, a leading
insurance research and investment management firm, said that the potential
market for life settlements could be “conservatively” estimated at over $100
billion (OFIS, 2002). Finally, the story of this market is a good example of
how subtle and unexpected the welfare effects of technological advance can
be. In this story, there are at least two important and distinct technological
improvements—one in pharmacology, and the other in contracting. The op-
timal regulation of an industry that has undergone substantial technological
change (from both internal and external sources) is a complex challenge, and
the more carefully considered examples we have to look at, the better.
2 Basic Facts
Using Freedom of Information Act (FOIA) requests to state regulatory agen-
cies, we have put together a unique database of viatical settlement transac-
tions that is representative of the universe of viatical settlement transactions
that took place in regulated states between 1995 and 2001. These state agen-
cies collect annual reports of all viatical firms that purchase such contracts
within the state. The database includes information on: face value of policy

6
sold; settlement amount received; life expectancy of the seller at time of sale;
date of transaction; premium paid; and, type of policy. We have complete
records for seven states: California, Connecticut, Kentucky, North Carolina,
New York, Oregon, and Texas. Moreover, California, New York, and Oregon
require viatical firms operating there to report on all transactions, regard-
less of location (that is, in all states). Overall, the dataset represents 32
viatical firms with 12,097 transactions, and includes transactions in every
state in the U.S. in at least one year between 1995 and 2001. For our seven
states, we have data from all viatical transactions that took place within
each state. We provide more details about the construction of this database
in the Appendix.
2.1 Market Size
We first examine changes in the total value and number of viatical settle-
ment transactions during the period of the study. Contrary to the trade
literature, which has reported a booming viatical industry,1 our data show a
significant decline in the number of viatical transactions and the total value
of settlements over the time period (Table 1). In 1995, 2,623 transactions
were reported by the firms in our data, yet by 2001, that number had fallen
by 91 percent. Without exception, all states recorded fewer transactions in
2001 than in 1995.2 With the exception of an upward spike in 1998 in some
states, the monotonic decline in the number of transactions was matched by
a decline in every state in our sample. Meanwhile, the average settlement
amount per policy doubled, and the average face amount increased by 5 times
1According to the National Viatical Association (1999), the size of the viatical settle-ments market doubled from $500 million in 1995 to $1 billion in 1998 (National ViaticalAssociation, 1999). Erich Sippel and Company, a market research firm specializing in theinsurance industry, estimates continued growth with a market size of $1.2 billion in 1999and between $1.8 billion to $2.2 billion in 2001. The Viatical Association of America,a leading industry association of viatical firms, more optimistically estimates the marketsize to be $4 billion in 2001. (Sippel and Buerger, 2002)
2States with zero transactions in 1995 also had zero transactions in 2001.

7
its average in 1995. Yet, despite increasing policy values per settlement, we
observe a diminishing total amount viaticated over this period.
Table 1: Transactions in the Viatical Settlement Market, 1995-2001
Amount Viaticated Face ValueYear # of Transactions (millions $) (millions $)
1995 2,623 $148.3 $229.61996 2,083 121.8 182.91997 1,930 104.4 213.71998 3,267 174.6 398.21999 1,486 84.0 194.72000 473 41.2 93.82001 235 29.9 107.7Total 12,097 $704.3 $1,420.6
While the trends are similar across states, we conduct an additional check
on our findings by more closely examining those states for which we have
collected complete records for the entire time period (CA, NC, NY, OR,
TX). In these five states, we find patterns that are similar to the national
trend. For example, in Texas—initially the largest regulated market—the
number of transactions declined 4% from 1995 to 1998 and an additional 94%
between 1998 and 2001. And for each of the five states, we find a decrease in
the total value of transactions (in terms of total settlement amount) ranging
from 56.1% in Oregon to 97.6% in New York between 1995 and 2001.
2.2 Market Structure
Some of the decline in transactions and settlement value that we have ob-
served may reflect market exit. To avoid misrepresenting the magnitude of
the change in the number of firms over time, we again focus our attention
on the five states with complete data. Table 2 demonstrates a reduction in

8
the number of firms in each of the five states. In California, New York, and
Oregon there was a fairly steady decline, while in Texas and North Carolina,
the number of firms peaked during the latter part of the decade and started
decreasing shortly before 2001.3 We also find that the average number of
transactions per firm has declined.
Table 2: Number of Viatical Firms by State, 1995-2001
1995 1996 1997 1998 1999 2000 2001
California 13 11 9 9 9 8 5New York 11 10 6 9 8 4 2Texas 11 12 9 14 13 15 11North Carolina 4 8 6 9 7 6 5Oregon 5 5 2 3 0 2 1Total 44 46 32 44 37 35 24
Next, we estimate the Hirschman-Herfindahl Index (HHI) to describe
the change in market concentration in this industry over time. We define
a market as the total number of transactions in a specific state and year,
since individuals in regulated states are only allowed to sell their policies to
firms licensed in their state of residence. The results in Table 3 show some
evidence of increasing market concentration. In fact, the HHI nearly tripled
in New York and California from 1995 to 2001 with the largest increase
in concentration occurring in the years 2000 and 2001. The Federal Trade
Commission (FTC) considers an HHI index above 1,800 as an indication that
the industry may be non-competitive (FTC, 2004). In all five states, the HHI
far exceeded this threshold in 2001.
3In some high-profile cases, firm exit from this market has been noted in the popularpress. For example, in 2001, Viaticus, one of the nation’s largest viatical and life settle-ments firms, publicly announced that it had decided to cease purchasing new policies (seeBelth, 2002 or Huntley, 2001).

9
Table 3: Hirschman-Herfindahl Index by State, 1995-2001
NorthCalifornia New York Texas Carolina Oregon
1995 1,575 1,741 6,164 6,485 4,0391996 4,964 2,976 2,206 3,241 3,8581997 2,057 2,258 1,940 2,666 9,1921998 1,502 3,005 2,750 2,110 4,1011999 2,229 2,101 2,142 2,059 -2000 2,460 4,308 2,009 2,886 8,7172001 4,800 5,187 4,034 3,178 10,000% change 204% 198% -35% -51% 148%
2.3 Prices
Next, we examine price trends in this market. Since policyholders sell their
life insurance policies in this market, lower prices imply lower returns for
them. The nominal price of a viatical settlement is the ratio of the amount
the policyholder receives from the viatical firm over the face value of his
life insurance policy. However, comparing nominal prices across consumers
with different mortality risks is not economically meaningful, as the values
of benefits received or forgone depend critically on the mortality risk of the
consumer. For example, if firms offered the same nominal price to all HIV
patients in the viatical settlement market, then firms would be paying a lower
economic price to those with advanced disease, as firms are more likely to
collect the life insurance benefits of patients with advanced disease in the
immediate future. Thus, the higher a person’s life expectancy, the lower the
nominal settlement price offered by a firm.
Figure 1 shows that average life expectancy of consumers participating in
the viatical settlements market increased by 62 percent from 1995-2001. In
1995-96 the majority of transactions were for people with a life expectancy
of 2 years or less, but after 1996 firms bought most of their policies from

10
individuals with life expectancies of more than 2 years.
Figure 1: Average Life Expectancy Among US HIV Patients, 1995-2001
15
20
25
30
35
40
Life
Exp
ecta
ncy
(mon
ths)
1995 1996 1997 1998 1999 2000 2001
Year
Thus, we should expect to find a reduction in average nominal settlement
price over this period. We observe that the average price in 2001 was nearly
half the 1995 average. However, since price and life expectancy are inversely
related, this observation does not reveal whether changes in price over time
also signal lower returns for consumers. Hence, we also examine the changes
in the nominal price of viatical settlement transactions conditional on the
life expectancy of the consumer (Table 4). The data show two salient trends
– (1) a dramatic decrease in returns for consumers in 2001 relative to 1995
for each life expectancy category, (2) larger reductions in returns for those
with longer life expectancies.

11
Table 4: Nominal Settlement Price by Life Expectancy
Life Expectancy Year % Change(months) 1995 1998 2001 (1995-2001)
<12 73.59 71.56 67.94 -7.68%12-23 71.43 60.91 50.71 -29.01%24-35 61.65 48.57 38.8 -37.06%36-47 48.72 36.7 26.89 -44.81%48+ 39.31 27.35 22.32 -43.22%
Note: We dropped data from 244 transactions where life expectancy exceeded 100
months.
The results in Table 3 offer an important clue in explaining the first trend
of an overall decline in prices. The data show evidence of increasing market
concentration. This increase in market concentration might be associated
with rising profit margins and declining prices. Table 5 shows the percent
decline in prices between 1995 and 2001 for each life expectancy category in
the 3 states with the largest viatical settlement markets. 4 We observe that
California, the state with the largest increase in HHI between 1995 and 2001
(see Table 3), generally experienced the largest declines in settlement prices
at each life expectancy level. This suggests that increasing levels of market
concentration may have explained some of the variation in prices that we
observed over this time period.
But what explains the other trend of larger reductions in prices for con-
sumers with longer life expectancies? One explanation is that the unantic-
ipated introduction of HAART changed market expectations about future
breakthroughs in treatment, and this change in risk affected prices of con-
sumers with longer expectancies more than those with relatively short lifes-
pans. The intuition behind this is that changes in the market’s perception of
4Again we consider only states with complete data and exclude Oregon and North Car-olina because of their small sample size, with zero observations in certain life expectancycategories.

12
Table 5: Change in Mean Settlement Price by State
Life Expectancy California New York Texas
<12 -20.00% - -5.10%12-23 -32.10% -28.20% -43.50%24-35 -40.30% -31.10% -38.40%36-47 -56.30% -29.20% -46.10%48+ -53.10% -73.80% -30.10%
Note: Settlement prices are measured as a proportion of face value of the orig-
inal life insurance contract. We dropped data from 89 transactions where life
expectancy exceeded 100 months.
risks would increase the risk premiums that lenders would charge (above the
risk free interest rate) to the viatical industry. This change in cost of capital
(due to technological advance) would affect prices of longer life expectancies
more, as these policies involve higher financing costs (interest charges) since
firms need to borrow capital for a longer duration before they receive payoffs
on their purchases. In other words, since firms only collect when the policy-
holder dies, the longer the time horizon for the payoff, the higher the effect
of changes in cost of capital on the nominal price. The larger reductions
in prices for consumers with longer life expectancies is also consistent with
the intuition that consumers with longer life expectancies are more likely to
survive to enjoy the benefits of future breakthroughs in treatment.
In the remainder of this paper we measure how well these two distinct
stories – increases in market power due to higher market concentration, and
changes in market expectations about future innovations and the risks in-
volved in purchasing policies from terminally ill consumers – explain prices
in this market.

13
3 Viatical Settlements Economics
This section develops an economic model of viatical settlement prices that
encompasses the effects of both changes in market power and market expec-
tations on prices. We begin our modeling with the observation that anyone
who undergoes an unexpectedly large health shock after buying a life insur-
ance policy and has a strong demand for immediate disposable income will
have an incentive to cash out their life insurance policy. Prior to the advent
of the viatical settlements market in 1989 (Belth, 2002), these individuals
surrendered their policies to their life insurance carrier for a predetermined
amount independent of their health status. However, since this amount was
uniformly assigned to all policyholders based on the assumption of a normal
path of health, this surrender value did not fully compensate the policyholder
for his policy’s increased economic value that had resulted from a shortened
lifespan (Doherty and Singer, 2003).
The value of a viatical settlement contract to a potential buyer is simply
the present value of the expected death benefits from the purchase of the life
insurance policy less the present value of the expected premium payments
on the policy. Thus the value of a viatical settlement contract to potential
buyers (viatical firms) will depend on the assessment of the mortality risks of
the insured.5 Viatical contracts with high mortality risk consumers would be
more highly valued, as viatical firms would expect to collect the life insurance
benefits of these patients in the nearer term. In addition, the price that
firms will be willing to offer for a policy will depend on the cost of capital,
or the interest rate at which firms can borrow, with higher cost of capital
implying lower prices. In turn, the cost of capital for this industry depends on
the market’s perception of risks associated with this industry. For example,
unanticipated increases in life expectancy (a negative shock to returns for the
5Typically these firms use the services of in-house staff, independent physicians, actuar-ies and other consultants to determine the mortality risks of potential consumers (NAIC,1999).

14
viatical industry) will increase the cost of capital for this industry. Finally,
as in all industries, prices will also depend on market structure, with more
competition implying higher prices.6
3.1 Survival and Settlement Value
We will need some notation. Consider a consumer with a term life insurance
policy with face value F , associated per period premium π (per dollar of
coverage) and term length T . Let the sequence of mortality hazards in each
period t = 0 . . . T be given by λ (t), which equals the probability of dying in
period t, conditional on surviving up to period t−1, given existing mortality
information at the time of sale of the policy (t = 0).7
Let Ωτ represent the information set at calendar time τ regarding the
discovery and adoption of new treatments that lead to reductions in mor-
tality. Let βτ = 1(1+rτ+δτ )
be the market discount rate for supplying funds
to the viatical settlements market. Here, rτ is the risk-free interest rate,
and δτ is the risk premium charged to viatical settlement firms at calendar
time τ given the information set Ωτ . We assume δτ increases with market
expectations about possible adoption and discovery of new treatments. In
other words, lenders charge a higher risk premium if they anticipate negative
shocks to the returns of the viatical settlement industry. Thus, the expected
present value of the death benefits (net of premium payments) of this policy
at calendar time τ is given by:
PVτ =T∑
t=0
[
D (t) βtτ F − S (t) βt
τπF]
(1)
Here, D (t) is the probability of dying t time periods after the sale of
the policy, and S (t) is the probability of surviving at least t time periods
6Since consumers are sellers in this market, an increase in profit margins for firmsmeans lower prices for consumers.
7We assume that this information is publicly available from existing epidemiologicaland clinical studies.

15
after the sale of the policy. Equation (1) shows that the contribution of each
period to the expected present value is simply the probability of receiving
life insurance benefits in that period multiplied by the present value of the
benefits in that period, less the probability of paying premiums in that period
multiplied by the present value of the per period premium payment.
Thus, the true economic price of a viatical settlement contract is the
present value of death benefits forgone less the settlement amount received
by the consumer, all measured per unit face value:
Pτ ≡T∑
t=0
[
D (t, τ) βt − S (t, τ) βtπ]
−S
F(2)
In equation (2), we have normalized prices so that higher prices imply
higher returns for firms and lower returns for consumers.
3.2 Price and Market Power
To model the market power, we consider a standard oligopolistic model with
no product differentiation—N identical viatical firms in the market charging
a single economic price. We define the relevant market as all transactions
in a particular state since, as mentioned earlier, residents of a state are only
allowed to sell their policies to firms licensed in that state.
To simplify the model, we posit that there are Kτs potential consumers at
calendar time τ in market s, each with a life insurance policy with face value
of F . Each consumer has a reservation price ceiling θi; that is, consumer
i is willing to sell his life insurance policy if the price charged by viatical
firms is less than θi. We assume that firms do not observe the reservation
price for individual consumers but know the cumulative distribution of the
reservation price Fτs (θ).8 Thus KτsF (Pτs) consumers will sell their policy
8In related research—Bhattacharya, Goldman, and Sood (2004)—we show that thereservation price of a consumer will depend on his degree of time preference, risk aversion,bequest motives, and proportion of assets held as life insurance, and life expectancy. Sincefirms do not observe most of these characteristics (with the exception of life expectancy)

16
at a market price Pτs. For convenience, we express this relationship as the
inverse market supply curve Pτs (Qτs).
Pτs = Pτs (Qτs) ≡ F−1τs
(
Qτs
Kτs
)
(3)
Where F−1τs (.) is the inverse of the cumulative distribution function of
the reservation price; Qτs is the total supply of life insurance policies in the
market at time τ , which is simply the sum of individual purchases by firms
in the market. Thus, the profit function of each firm j at time τ in market
s is:
Πjτs = (Pτs (Qτs) qjτs − cqjτs)F (4)
The first term in equation (4) is the expected present value of the revenues
from the purchase of policies less the settlement amount paid to consumers
for the purchase. The second term is the underwriting and administrative
cost of acquiring the policies. We assume that all firms are identical and
face the same underwriting and administrative costs c, as a percent of face
amount, per policy. Differentiating the profit function with respect to output
yields the firm’s profit maximizing first order condition:
∂Πj,τs
∂qjτs
= Pτs + qjτs
dPτs
dQτs
(1 + ϑjτs) − c = 0 (5)
The first order condition is a modified version of the familiar marginal
revenue equals marginal cost condition. As usual, different values of the
conjectural variation term, ϑjτs = dQ−jτs
dqjτsimply different conclusions about
market structure and firm behavior. For example, assuming ϑjτ = 0 ∀j im-
plies the Cournot model, while assuming ϑjτs = −1 ∀j, implies the Bertrand
oligopoly model where competition among firms lead to marginal cost pric-
ing. At the other extreme, ϑjτs = Qτs−qjτs
qjτs∀j implies collusion among firms
at the time of the viatical settlement contract, it is realistic to assume that firms do notobserve the reservation price.

17
and leads to monopoly pricing with prices higher than marginal costs.
Multiplying equation (5) by the market share of each firm yields:
∂Πjτs
∂qjτs
= sjτsPτs + s2jτsQτs
dPτs
dQτs
(1 + ϑjτs) − sjτsc = 0 (6)
Let ητs be the price elasticity of the supply of life insurance policies to the
viatical market and let HHIτs be the HHI. By definition, ητs = −dQτs
dPτs
Pτs
Qτs.
Aggregating equation (6) over all firms in the industry and some algebra
yields the following:
Pτs − c
Pτs
=
HHIτs +∑
j
(
qjτs
Qτs
)2(ϑjτs)
ητs
= kτs (7)
Equation (7) is the familiar Lerner Index equation and shows that the
price cost margin at time τ in market (kτs) is determined by market condi-
tions (price elasticity) and by the strategic interaction of firms at that time.
If firms exhibit Bertrand behavior then the price cost margin is zero. Sim-
ilarly, if firms exhibit Cournot behavior then the price cost margin is the
ratio of the HHI and the price elasticity of demand. Substituting for Pτ from
equation (2) in equation (7) yields:
Siτs =
(
T∑
t=0
[
D (t) βt
τ − S (t) βt
τπ]
)
−c
1 − kτs
F (8)
Equation (8) shows that the equilibrium settlement amount received for
a policy increases with the present value of the policy and decreases with un-
derwriting and administrative costs. In particular, changes in the settlement
amount over time (for a given mortality profile) occur for two very different
reasons. First, when lenders perceive a higher likelihood of future life-saving
technological advances, they charge a higher risk premium for the provision
of capital to firms; in particular, we posit that after the discovery of HAART
drugs, δτ increased. On the other hand, firms might offer a lower settlement
amount if they become less competitive, that is, kτ increases over time. The

18
extent to which the change in market expectations and the change in profit
margins explain the observed variation in price is an empirical question
Equation (8) also shows that the effect of changes in market power on
the settlement amount received is independent of the life expectancy of the
seller of the policy. By contrast, the effect of changes in expectations about
new treatments is dependent on the life expectancy of the seller. We use this
key insight to separately identify changes in firms’ market power and the
markets’ expectation of decline in AIDS related mortality due to discovery
and adoption of new treatments for HIV.
3.3 Identification
The data we use in our estimation contain the following information on each
viatical transaction—settlement amount received (S), the date and year of
transaction (τ), face value of policy sold (F ), and life expectancy of patients
at the time the policy was sold.
However, despite the detailed data on each transaction, we cannot esti-
mate equation (8) without some further assumptions. In particular, we need
to parameterize the mortality hazard profile of the consumer. This is neces-
sary, as we need to calculate the expected present value of each life insurance
policy sold in the viatical settlement market. Equation (2) shows that calcu-
lation of the expected present value of the death benefit of a policy requires
information on the mortality hazard profile of the policyholder. Since our
data on viatical transactions report only the life expectancy of the seller, we
assume a constant mortality hazard parameterization—λ (t) = λ ∀t, where
λ is simply the inverse of the life expectancy of the policyholder. Given this
parameterization, and after some algebraic manipulation, the present value
of an infinite term life insurance policy—equation 1—sold in year τ can be
expressed as:

19
PVτ =
[
(λ − π) (1 + rτ + δτ )
(λ + rτ + δτ )
]
F (9)
If the settlement amount (Siτs) for the ith transaction in year τ and market
s is observed with orthogonal measurement error εi, equation (8) can be
rewritten as:
Siτs
Fiτs
=
([
(λi − πi) (1 + rτ + δτ )
(λi + rτ + δτ )
]
−c
1 − kτs
)
+ εi (10)
In Figures 2 and 3, we illustrate the change in settlement amount re-
ceived for consumers with different life expectancy due to changes in market
power (kτ ) and due to changes in risk premium (δτ ). For the purpose of this
illustration we assume that each consumer has a life insurance policy with a
face value of $100,000, underwriting costs are $10,000 per transaction, costs
of borrowing are 4% per annum, and there are no premium payments on the
policy.
Figure 2 shows that change in the market power causes the same absolute
change in settlement amount irrespective of the life expectancy of the seller;
that is, such a change causes a parallel shift in the offer-curve. In contrast,
Figure 3 shows that changes in risk premium causes a higher absolute change
in the viatical prices for persons with relatively high life expectancy. Thus,
Figures 2 and 3 show that even though we cannot directly observe firms’ com-
petitive behavior and market expectations about future treatments, changes
in these two parameters can be separately identified as they produce very
distinct patterns of changes in the settlement amount.
4 Empirical specification
To estimate our model, we use data on viatical settlement transactions by
consumers residing in the five states for which we have complete data to
estimate the parameters of equation (8) separately for three time-periods

20
Figure 2: Changes in prices due to changes in market power
0
25
50
75
100
Set
tlem
ent A
mou
nt (
$100
0’s)
0 10 20 30 40 50 60 70 80 90 100
Current Life Exectancy (months)
k = 0k = 0.3k = 0.6

21
Figure 3: Changes in prices due to changes in risk premium
0
25
50
75
100
Set
tlem
ent A
mou
nt (
$100
0’s)
0 10 20 30 40 50 60 70 80 90 100
Current Life Exectancy (months)
delta = 0%delta = 8%delta = 16%

22
(1995, 1996-98, 1999-01). We choose these intervals because they track im-
portant milestones in the adoption and diffusion of HAART, which have
had a substantial impact on the mortality profiles of viatical consumers with
HIV disease. HAART, and its unprecedented ability to reduce viral loads
to almost undetectable levels, was first introduced in early 1996. This drug
therapy was rapidly adopted by HIV patients over the next couple years. By
1998, most American HIV patients were on some variant of HAART, and
as a result death rates from HIV infection fell dramatically, as illustrated in
Figure 4.
However, while age-adjusted death rates fell 47 percent in the U.S. from
1996 to 1997, following a 25 percent decline the year before (CDC, 1997), the
mortality decline leveled off after 1998, with a decline of only 6 percent be-
tween 1999 to 2001. We classify the period before 1996 as the “Pre-HAART”
era and the period with the most significant HAART gains from 1996-1998
as the “Post-HAART” era. Finally, during the period 1999-2001 death rates
from HIV stopped declining and the medical literature raised concerns that
the AIDS virus was developing resistance to treatment with HAART (HIV-
dent, 2000). Thus, we classify this time period as the “Resistance” era.
We now reexamine the relationship between settlement prices and con-
sumers life expectancies across the three time periods defined above. Figure 5
plots the predicted values from OLS regressions of settlement prices on con-
sumers’ life expectancies for the three time periods in our analysis. We find
that the offer-curve pivots in the post-HAART era (compared to pre-HAART
era), with greater absolute changes in prices for consumers with higher life
expectancies relative to those with lower ones (analogous to Figure 3). This
provides preliminary evidence that changes in the risk premium (δτ ) had the
most significant impact on prices between the pre- and post-HAART peri-
ods. The change in offer curve between the pre-HAART and Resistance time
periods is starkly different. We observe, a downward parallel shift in the offer
curve between the pre-HAART and Resistance time periods (analogous to

23
Figure 4: US AIDS Death Rate per 100,000, 1995-2001
Pre−HAART ResistancePost−HAART0
3
6
9
12
15
18
HIV
Dea
th R
ate
per
100,
000
popu
latio
n
1994 1995 1996 1997 1998 1999 2000 2001 2002
Year
Source: CDC HIV/AIDS Surveillance Report 1993-2001, Year-end editions; CDC
HIV Mortality L285 Slide Series 2000.

24
Figure 2). This suggests that increase in market power (kτs) rather than δτ
might explain most of the price decline observed in the Resistance era. Next,
we estimate the precise impact of each of these two factors on prices.
Figure 5: Changes in prices, by life expectancy and time period
.2.4
.6.8
Nom
inal
Pric
e (s
ettle
men
t am
ount
/face
val
ue)
0 20 40 60Life expectancy (months)
Pre−HAART Post−HAARTResistance
To account for changes in market power we employ a reduced form model.
Thus, instead of estimating ητ , ϑτ , kτ , c for each time period, we estimate
a separate intercept(
ατs = c1−kτs
)
for each time period and state. The inde-
pendent variables in the model are: the reported life expectancy of the pol-
icyholder based on current treatments for HIV/AIDS(
λ = 1LEcurrent
)
, face
value of the policy (F ), the per period premiums on the policy (πF ), the
risk free interest rate (rτ ), which we assume to be the yield on 3-month US
treasury bills.

25
We estimate the following parameters: the time and market varying inter-
cept terms ατs which captures changes in market power (kτs), and δτ which
measures the risk premium for the industry. As we have seen in section 3.3,
the latter parameters are identified by changes in settlement prices over time
and across markets, while the former are identified by changes across states
only.
In previous work, which uses a nationally representative database of HIV
patients in care from 1996-1998, we find that HIV patients with low life ex-
pectancies are overly optimistic about their chance of survival (relative to
actuarial death rates), at least with respect to their behavior in viatical set-
tlement markets.9 This result from the post-HAART period suggests that,
in addition to affecting demand elasticities through changes in the cost of
capital, mortality profiles may also affect the supply elasticity (consumers’
willingness to sell their life insurance policies). To accommodate this possi-
bility, we estimate a second specification in which the intercept term αsτLE
is permitted to vary with state, year, and the policyholder’s life expectancy.
We define the policyholder’s life expectancy categorically as either one year
or less or greater than one year. We estimate the parameters of equation
(10) using Nonlinear Least Squares (NLLS).
5 Results and Discussion
Tables 6 and 7 below show our estimates of equation (10)’s parameters. We
observe a significant increase in risk premiums (δτ ) between the pre- and
post-HAART periods in both specifications that mirrors the considerable
contemporary optimism about the life prolonging effects of HAART and the
possibility of new treatment breakthroughs. However, between the post-
HAART and Resistance periods, the monthly risk premium declined by 32
percent in the first specification and by 52 percent in the second. After the
9See Bhattacharya, Goldman, and Sood (2003).
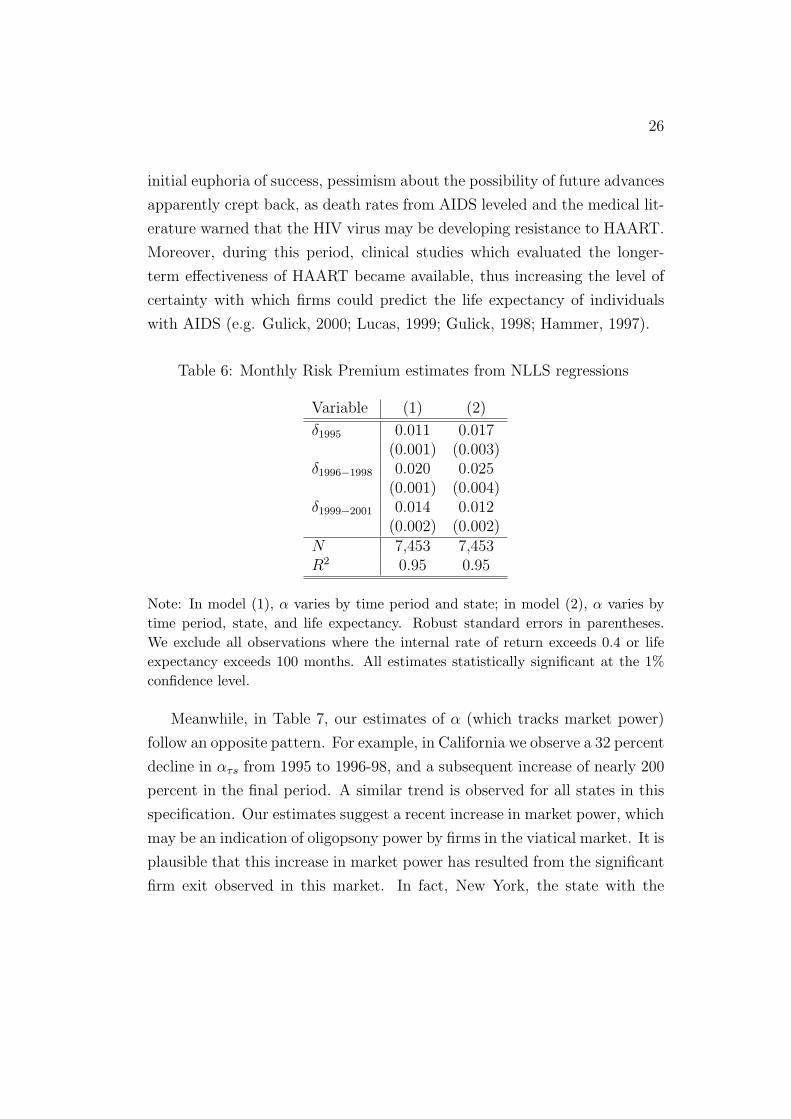
26
initial euphoria of success, pessimism about the possibility of future advances
apparently crept back, as death rates from AIDS leveled and the medical lit-
erature warned that the HIV virus may be developing resistance to HAART.
Moreover, during this period, clinical studies which evaluated the longer-
term effectiveness of HAART became available, thus increasing the level of
certainty with which firms could predict the life expectancy of individuals
with AIDS (e.g. Gulick, 2000; Lucas, 1999; Gulick, 1998; Hammer, 1997).
Table 6: Monthly Risk Premium estimates from NLLS regressions
Variable (1) (2)
δ1995 0.011 0.017(0.001) (0.003)
δ1996−1998 0.020 0.025(0.001) (0.004)
δ1999−2001 0.014 0.012(0.002) (0.002)
N 7,453 7,453R2 0.95 0.95
Note: In model (1), α varies by time period and state; in model (2), α varies by
time period, state, and life expectancy. Robust standard errors in parentheses.
We exclude all observations where the internal rate of return exceeds 0.4 or life
expectancy exceeds 100 months. All estimates statistically significant at the 1%
confidence level.
Meanwhile, in Table 7, our estimates of α (which tracks market power)
follow an opposite pattern. For example, in California we observe a 32 percent
decline in ατs from 1995 to 1996-98, and a subsequent increase of nearly 200
percent in the final period. A similar trend is observed for all states in this
specification. Our estimates suggest a recent increase in market power, which
may be an indication of oligopsony power by firms in the viatical market. It is
plausible that this increase in market power has resulted from the significant
firm exit observed in this market. In fact, New York, the state with the

27
Table 7: Price-cost margin estimates from NLLS regressions(1) (2)
αLE≤12 6= αLE>12
α αLE≤12 αLE>12 (p-value)
California1995 0.107 0.124 0.019 < 0.001
(0.011)* (0.018)* (0.027)1996-1998 0.073 0.077 0.027 < 0.001
(0.011)* (0.020)* (0.028)1999-2001 0.214 0.235 0.229 0.799
(0.018)* (0.021)* (0.029)*New York
1995 0.095 0.072 0.016 0.007(0.013)* (0.021)* (0.028)
1996-1998 0.069 0.049 0.027 0.186(0.012)* (0.022)** (0.028)
1999-2001 0.219 0.224 0.236 0.605(0.018)* (0.024)* (0.028)*
Texas1995 0.144 0.084 0.078 0.624
(0.012)* (0.020)* (0.028)*1996-1998 0.104 0.075 0.062 0.208
(0.012)* (0.021)* (0.028)**1999-2001 0.263 0.26 0.282 0.257
(0.018)* (0.021)* (0.028)*Oregon
1995 0.137 0.16 0.028 0.034(0.032)* (0.048)* (0.048)
1996-1998 0.037 -0.028 0.000 0.755(0.027) (0.088) (0.038)
1999-2001 0.04 0.028 0.07 0.705(0.057) (0.087) (0.075)
North Carolina1995 0.121 0.186 0.017 0.001
(0.025)* (0.045)* (0.037)1996-1998 0.071 0.046 0.028 0.353
(0.013)* (0.025)*** (0.029)1999-2001 0.16 0.174 0.176 0.965
(0.022)* (0.037)* (0.032)*N 7453 7,453 7,453R
2 0.95 0.95 0.95
Note: Robust standard errors in parentheses. *Significant at 1%; **Significant at 5%;
***Significant at 10%. In model (1), α varies by time period and state; in model (2), α
varies by time period, state, and life expectancy. We exclude all observations where the
internal rate of return exceeds 0.4 or life expectancy exceeds 100 months. All estimates
statistically significant at the 1% confidence level.

28
largest percent decline in the number of firms between 1996 and 2001, also
had the largest increase in ατs over that time period.
In our second specification, which permits α to differ for patients with low
and high life expectancy, we find similar results for the subset of consumers
with a life expectancy of one year or less. That is, the estimates suggest an
increase in the market power of firms in the 1999 to 2001 time period, which
is most likely related to the significant firm exit in the preceding time period.
For those with life expectancy greater than one year, αsτLE increases
steadily across the three periods for all states except Oregon (which may be
a result of its small sample size, n = 45). We also find that for those with
with less than one year to live, αsτLE is larger than the corresponding value of
α for those with longer life expectancy, although in later years the difference
in αs is statistically insignificant (see the last column of the table).
We conjecture that the reason sicker HIV patients face higher price-cost
margins is that the search costs associated with choosing the most generous
viatical contract and the willingness to sell are highest for individuals with
an imminent risk of death. Thus, out of desperation and a high preference
for immediate consumption, these individuals may be more likely to accept
prices which deviate from marginal costs.
In combination, the estimates for δτ and α suggest that both changes in
optimism about treatment advances and changes in market power and costs
have contributed to the diminishing nominal settlement prices over the last
decade which we observed in section 2.3. Changes in mortality expectations
appear to have had the most significant impact on prices between the pre- and
post-HAART periods, as our results show that δτ had risen while α declined
over this interval. By contrast, it appears that viatical firms’ market power
have contributed most substantially to declining settlement prices between
the most recent two periods—likely as a consequence of significant firm exit.

29
6 Conclusion
Viatical settlements, and similar types of transactions, have the potential
to be an important financial resource for the terminally ill and the elderly.
The availability of these instruments may reduce the dependence of these
vulnerable populations on public assistance and need-based programs. Viat-
ical settlements may also affect the use of health care services by providing
financial resources to the underinsured or uninsured populations. They may
help finance new and experimental treatments not covered by conventional
health plans or long term care for the chronically ill. While it is unlikely
that the demand for viatical settlements by individuals with HIV has dimin-
ished in recent years—as treatment costs continue to soar—the availability
of suppliers for these contracts has declined. Many firms are not willing to
accept new contracts and are exiting the market. Moreover, policyholders
face diminishing prices, even holding life expectancy fixed.
In this market, lower prices within life expectancy classes are typically
seen as worse for policy holders, but the cause of the lower prices has impor-
tant implications for whether there exists a policy issue. If lower settlement
offers are due to high expectations about new discoveries, consumers receive
a fair economic price for their life insurance policy even at the lower prices.
In that case, the market is simply using new information about the treatment
horizon to more accurately predict policyholders’ mortality profiles, and no
welfare loss ensues. On the other hand, lower settlement offers that result
from reduced competition obviously diminish consumer welfare. Our empir-
ical results suggest that changes in mortality expectations drove the decline
in settlement prices during the middle part of the last decade, that is, the
period when new treatments for HIV diffused rapidly. However, high levels
of market power may be responsible for lowering returns during the latter
half.
How much did the increase in market power of viatical firms in the Resis-
tance era (1999 - 2001) hurt consumers? The answer to this clearly depends

30
on how many HIV+ and other terminally ill consumers own life insurance
and the total value of their life insurance holdings. Data from the HIV
Costs and Services Utilization Study (HCSUS)– a nationally representative
panel study of HIV+ persons – provide reliable estimates of the life insurance
holdings of HIV+ persons. The HCSUS data represent 231,400 HIV+ adults
who received care for HIV in 1996. Of these, an estimated 80,575 adults had
life insurance policies in force in 1998. The average face value of their life
insurance policies was $83,859, so the total face value of the life insurance
holdings of HIV+ persons in 1998 was about $6.8 billion. We estimate that
the increase in market power in the Resitance era reduced prices by roughly
15 cents per dollar of face value (see Table 7). Thus, our estimates imply
that the increase in market power of firms reduced the value of life insurance
holdings of HIV+ persons by about 1.0 billion dollars. This is a significant
welfare loss for these terminally ill consumers both in absolute and relative
terms and equals about a quarter of the value of their non-life insurance
assets.10
Still, these results do not necessarily motivate price regulation. Price
floors, like those which have already been implemented in several states,
may actually prevent trades which are mutually beneficial to the consumer
and viatical firm (see Bhattacharya et al., 2004). This may be especially true
during a period in which market expectations of treatment effects and future
treatment breakthroughs are in a constant state of flux (large δ). Consider,
for example, the effects of a hypothetical minimum price floor enacted prior
to the introduction of HAART. Since there is strong evidence that changes
in risk premiums drove the reduction in settlement prices between 1995 and
1996-1998, a minimum price floor would have made it difficult for many
AIDS patients to sell their policies during this period even though it may
have otherwise been appropriate to do so. Moreover, consumers with AIDS
10This estimate is also based on HCSUS data which show that HIV+ persons with lifeinsurance polices had a mean net worth (excluding life insurance) of $63,809.

31
may possess unique characteristics with respect to their income levels, mar-
riage status, and bequest motives which have a differential influence on their
willingness to sell their policies relative to other types of consumers. In par-
ticular, previous work has shown that low bequest motives and low income
intensify the magnitude of welfare loss from inappropriately blocked trans-
actions (Bhattacharya et al., 2004). Stringent minimum price regulation is
unlikely to take into account these types of complexities when determining
threshold price levels.
More broadly, the story of the viatical settlement industry in the late
1990s suggests that even dying industries may greatly enhance the welfare
of market participants. Certainly, those who sold policies at near actuarially
fair prices in the pre-HAART and post-HAART periods benefited from the
ability to liquidate their life insurance equity. However, even those who sold
policies in the late 1990s, when the market had become non-competitive,
benefited relative to not having been able to viaticate at all—an oligopsony
is better than no market. The introduction of viatical settlement contracts
in 1989 was an important advance in the technology of contracting. It is
ironic that the dissemination of HAART in 1996, a technological advance
that greatly enhanced the welfare of HIV patients, mitigated the welfare
enhancing effects of the earlier economic innovation.

32
7 References
Belth, J (2002). “Viatical and Life Settlement Transactions.” Contingencies.March/April.
Bhattacharya, J, Goldman, D, and Sood, N (2003). “Market Evidence ofMisperceived Prices and Mistaken Mortality Risks.” NBER Working PaperNo. 9863
Bhattacharya, J, Goldman, D, and Sood, N (2004). “Price Regulation inSecondary Insurance Markets.” Journal of Risk and Insurance; Vol 71 (4)pp643 675.
Centers for Disease Control and Prevention. HIV/AIDS Surveillance Re-port, Year-end editions 1993-2001.
Centers for Disease Control and Prevention (2001). HIV/AIDS Surveil-lance Report 2001, Year-end edition. Volume 13, No. 2.
Centers for Disease Control and Prevention (2002). Mortality L285 slideseries (through 2000). Online at http://www.cdc.gov/hiv/graphics/mortality.htm (as of Jan 18, 2004).
Consumer Reports (Feb 2001). “Betting on death: Insurance settle-ments intended to help the dying have short-changed them and fleeced manyinvestors instead.”
Doherty, N. and Singer, H. (2003). “Regulating the Secondary Marketfor Life Insurance Policies.” Journal of Insurance Regulation; 21(4).
Federal Trade Commission (2004). 1992 Horizontal Merger Guidelines -with April 8, 1997, revisions to section 4 on efficiencies. Online at http://www.ftc.gov/bc/docs/horizmer.htm (as of Jan 18, 2004).
Gulick RM, Mellors JW, Havlir D, et al. Simultaneous vs sequentialinitiation of therapy with indinavir, zidovudine, and lamivudine for HIV-1infection: 100-week follow-up. JAMA 1998; 280:35-41.
Gulick RM, Mellors JW, Havlir D, et al. 3-Year suppression of HIVviremia with indinavir, zidovudine, and lamivudine. Annals of InternalMedicine 2000; 133:35-9.
Hammer SM, Squires KE, Hughes MD, et al. A controlled trial of twonucleoside analogues plus indinavir in persons with human immunodeficiencyvirus infection and CD4 cell counts of 200 per cubic millimeter or less. NewEngland Journal of Medicine 1997; 337:725-33.
Health Insurance Portability and Accountability Act (1996), on-line pub-lication http://www.hcfa.gov/hipaa/hipaahm.htm (as of December 22, 2002)

33
working)HIVdent (2000), “Resistance to HAART, Viral Rebound Common in Pre-
treated HIV-Infected Patients,” Reuters Health Information Services, March30, 2000 http://www.hivdent.org/drugs1/drugrthvrcip042000.htm
Huntley, H. “Viaticus suspends buying new policies” St. PetersburgTimes, published July 26, 2001
Joyce, Geoffrey F., Escarce, Jose J., Solomon, Matthew D., Goldman,Dana P. (2002), ”Employer Drug Benefit Plans and Spending on PrescriptionDrugs,” JAMA, Vol. 288, No. 14 (October 9, 2002).
Michigan Office of Financial and Insurance Services (OFIS), Press Re-lease, “Viatical Settlements Draw Warning From State Regulators, Congres-sional Scrutiny”, February 27 2002.
National Association of Insurance Commissioners (1999), Advisory Pack-
age on Viatical Settlements, Kansas City, Missouri.National Association of Insurance Commissioners (2003). “Compendium
of State Laws on Insurance Topics”National Association of Insurance Commissioners (2004) Modernizing
the Insurance Regulatory Structure: The NAIC Framework for a NationalSystem of State-Based Regulation. Online at http://www.naic.org/docs/naic framework.pdf (as of Jan 18, 2004).
National Viatical Association (1999), NVA Information Booklet, Wash-ington, DC.
Sippel, E. and Buerger, A. (2002). A Free Market for Life Insurance,Contingencies. March/April.
Palella, et al. (1998), “Declining Morbidity and Mortality Among Pa-tients with Advanced Human Immunodeficiency Virus Infection,” The New
England Journal of Medicine, 338(13): 853-60.

34
Appendix
Taking advantage of states financial filing requirements, we have put to-gether the first systematic dataset detailing information on actual viaticaltransactions in the U.S. At present, roughly half of all states regulate viati-cal settlement markets. In nearly all of these states, viatical firms must belicensed, and they must file annual statements regarding all of their transac-tions in that state. Some states, such as California, New York, and Oregon,require firms to file reports about transactions from all states where theydo business. Typically firms are required to disclose the following detaileddescriptions of each viatical settlement contract in their annual reports: facevalue of policy sold; settlement amount received; life expectancy of the sellerat time of sale; type of terminal illness; date of transaction; premium paid;and, type of policy.
Under the Freedom of Information Act (FOIA),11 we requested the an-nual reports of all viatical firms for the period between 1995 and 2001 (themost recent years available at the start of this analysis). We have a com-plete set of reports from seven states - California, Connecticut, Kentucky,North Carolina, New York, Oregon, and Texas. The data were entered andcleaned by deleting transactions with nonsensical values (e.g. negative lifeexpectancy, or settlement amount greater than face amount) and with miss-ing values for critical variables. The data were then aggregated in a way thatprevented the duplication of records in the combined dataset: we started withthe state with the largest number of nationwide transactions reported (CA)and then added any transactions by companies licensed in the second-largeststate (NY) that were not already accounted for in the California data, andso forth. Ultimately, we were able to include records that were not reportedin the actual state in which they were transacted. For example, sequentiallyadding New York and Oregon’s data to California retrieved nearly 1,000 ad-ditional transactions in California, which were undocumented in the reportswe received from California alone.
One problem with many of the annual reports was that the informationabout premium payments on the original life insurance policy were included
11“The Freedom of Information Act (F.O.I.A.) U.S.C. (United States Code) Sec. 552was enacted in 1966 so that any individual or organization would have access to certaingovernment records. For more detail, see http://www.ftc.gov/foia/index.htm.

35
in a separate table that often could not be linked to the transaction databy a unique policy identifier. In a few cases, no premium information wasavailable at all. To address this problem, we matched a number of recordsin both tables using combinations of the following fields: settlement amount,face amount, life expectancy, and purchase date. We used California an-nual reports from 1998-2001 to extract a representative 11 percent sampleof premiums (n=1,287). This method captured records from all years andnearly all states, since, in each year’s report, California requires its viaticalfirms to report all of their transactions from all U.S. states, for the currentyear as well as from previous years. We then calculated the premium permonth as a percent of face amount for the California sample and ran a multi-variate regression controlling for face amount, life expectancy, and purchasedate in order to impute the missing premium percentage for the remainingtransactions in the dataset.
We close this appendix with two caveates about our dataset. First, whilethe dataset represents a comprehensive set of transaction data for firms oper-ating in licensed states, it is not nationally represenative. Our data includesa sample of transactions from every unregulated state (since viatical firmsconduct business in both regulated and unregulated states), but there maybe other firms operating in only unregulated states whose transactions wewill never observe. Second, our data are specific to viatical settlement trans-actions; we have almost no information on life settlements. These financialvehicles, though similar to viatical settlements, differ in that they are mar-keted to elderly who are not terminally ill. State viatical regulations havemostly been applied to only terminally or chronically ill individuals and thus,life settlements have not been subject to the same filing requirements.12
12The National Association of Insurance Commissioners (NAIC) adopted a model lawin 2001 to broaden the definition of contracts covered under viatical regulations to includeall contracts (such as life settlements) that exchanged life insurance policies for less thantheir expected death benefit (NAIC, 2004).