Embed Size (px)
Citation preview

International Journal of Scientific & Engineering Research, Volume 5, Issue 10, October-2014 834 ISSN 2229-5518
IJSER © 2014 http://www.ijser.org
“Trends and Patterns of India’s High Technology Export with Special Reference to
Pharmaceutical Products” Manisha, Research Scholar, Central University of Punjab, India
Abstract: Diversification of a country’s exports plays an important role in the economic growth of the developing countries. These countries are trying to increase its exports by exporting high technology products and improve their ranking in the world trade. India is no exception to this. The present study is an attempt to examine the competitiveness of pharmaceutical exports in India’s high technology exports, which is the largest sector amongst high technology commodities, with the US and Russian Federation by calculating different indices like Revealed Comparative Advantage (RCA), Revealed Symmetric Comparative Advantage (RSCA) and Intra Industry Trade (IIT) during 1991-2012. An extensive research effort has been made to comprehend the composition and direction of India’s Pharmaceutical exports with its top two export partners i.e. US and Russia using these indices. The empirical result of the study revealed that India has revealed comparative advantage in maximum pharmaceutical products with these two countries. Further, the result of the study also explained that TRIPS has a positive impact on India’s pharmaceutical exports. The study also revealed that domestic companies are more R and D oriented than foreign companies. The positive correlation of R and D expenditure and exports has been found in Indian Pharmaceutical companies. For India to become a top player in the global pharmaceutical business, the government of India needs to support foreign investments in pharmaceuticals sector in order to overcome the stiff competition in the global pharmaceutical market. Keyword: High technology, Revealed Comparative Advantage, Revealed Symmetry Comparative Advantage, Grubel Lloyd Index, Compound Growth Rate, Product Patent, Process Patent and Trade Related Intellectual Property Rights
----------------------------------------------------------------------------------- 1. INTRODUCTION Diversification of a country’s exports has become essential for easing the pressure on balance of payment situation and also for the growth of more viable and efficient agricultural and industrial sectors for balanced development. According to Dennis (2007), export diversification plays a significant role in the economic growth of the developing countries because terms of trade are always unfavorable for these countries as they are exporters of primary goods. According to Samen (2010), the pattern of economic development is allied with structural changes in exports and expansion of export diversification worldwide. With the phases of development, many developing countries started to shift from natural resources based and low technology exports to medium and high technology exports as these countries realized that dependency on exports of primary products would hinder their development process. According to Alexander and Warwick (2011), countries should create and export those goods which are demanded by the other countries Pattern of trade has been changed from finished products to intermediate and processing products. Different countries that specialized in different tasks have added value to the processing of products such as parts and components, imported for processing and assembly into semi-finished or finished products and re-exported to the global supply chain before they reach the final consumers (Ismail, 2013) . According to Srholec (2010), over the past two decades, the global map of exports has changed dramatically due to the arrival on the market of high technology products from developing countries. The striking transformation in the export pattern has led economists to question whether the success of high technology exports from developing
countries is real or just a ‘statistical illusion’. Although some optimists consider it a positive signal that emerging economies are climbing up the ladder in the global value chain and competing head-to-head with developed countries in high technology, some skeptics have pointed out that the expansion of the high technology exports from developing countries is largely due to their active participation in the labor-intensive processing stages within high-tech industries resulting from the international fragmentation of production (Dahai, 2010). The analysis of exports growth and its overall economic effects has also been a significant topic in the economic literature over the last decades. However, more recently, the focus has turned to high-technology trade, as researchers attempt to understand the associations among innovation, high-tech international trade and overall economic performance (Eaton and Kortum, 2001; Spulber, 2008; Zhang, 2007; Falk, 2009). This growing interest is mostly due to the fact that international trade of high-technology goods provides information about the overall competitiveness and position of an economy within the technology global market. It also contributes to the understanding of how innovation affects comparative advantages on a dynamic economic environment and of the relative importance of high-technology on the international marketplace (Tebaldi, 2011). For instance, Falk (2009) shows that the share of high-tech exports significantly impacts GDP growth. The share of developing countries in high technology exports is very large, but the majority of developed countries take no part in the export of high technology products because there is much variation in the technological capability of even the high technology exporting countries. At the one end of the spectrum are
IJSER

International Journal of Scientific & Engineering Research, Volume 5, Issue 10, October-2014 835 ISSN 2229-5518
IJSER © 2014 http://www.ijser.org
Korea and Singapore, which have the local capability to design, manufacture and export high technology items. Malaysia is somewhere in the middle, while Thailand and Philippines appear to be at the other end with low capability. However, the developing countries as a whole are fast catching up with the developed countries (Sunnil Mani, 2004). Specialization in high-tech products is frequently used to capture technological intensity of exports (Srholec, 2007). Organization for Economic Cooperation and Development (OECD, 2005) has developed a four way classification-high technology. The classification is based on the importance of expenditure on research and development relative to the gross output and value added of different types of industries that produce goods for exports. Table 1.1: Technological Classification of Indian Manufacturing Industry
Technology Category
Industry
Low technology
1. Food, beverages and tobacco products
2. Textile, leather and footwear
3. Wood, paper and paper products
Medium-low technology
4. Rubber and plastic products
5. Other non-metallic mineral products
6. Cement and glass 7. Basic metal and metal
products
Medium-high technology
8. Chemical excluding pharmaceuticals
9. Electrical machinery 10. Non-electrical machinery 11. Transport equipments
High- technology
12. Pharmaceuticals 13. Electronics
Source: OECD, Science Technology and Industry Scoreboard, 2001. Export performance enhanced during the post-1991 years and the global map of exports has changed significantly due to the arrival on the market of high-technology products from developing countries (Srholec 2007). One of the objectives of launching of the economic reforms was that it would facilitate access to new technology. It is also believed that Indian economy would become more innovative with economic reforms. (Basu, 2012). India is progressive on the path of development, yet its export shares in the global market are still very small, with a modest increase in export of medium- and high- technology products (Nayak, 2013). According to World Development Indicators 2011, compiled by the World Bank, India’s high technology exports were 6.87 per cent of its manufactured exports compared to 9.72 per cent in the case of Brazil, 25.81 per cent in the case of China, 31.44 per cent in the case of Israel & Japan and 43.39 and 45.16 per cent in the case of Malaysia and Singapore. Some of the areas where India is making impact are computer software, automobiles and auto components and pharmaceuticals. 1.2 Significance of the study Today is the world highly competitive, each country is trying to increase its exports by exporting high technology products and improve its ranking in the world trade. As India is no exception to this. There is a need to analyze the trends and patterns of India’s high technology exports. Among other high technology sectors, India has greater
advantage in pharmaceutical sector .Therefore; the study has tried to examine the composition and direction of pharmacy products of India with its top two partners from 1991-2012. An attempt is also made to study the issues of TRIPS with respect to India’s pharmaceutical sector. Even though a number of studies have been done in the way of export performance of high technology goods sector in India, but only a few studies have examined the competitiveness of pharmaceutical components in India’s exports which is the largest sector amongst high technology commodities. Therefore, keeping in view the above literature gap, the present study attempts to carry out the following objectives to contribute to the literature and provide further knowledge about the subject. 1.3 Objectives of the study
1. To study the trends and growth of India’s high technology exports with the rest of the world since liberalization.
2. To study the composition and direction of high technology exports of pharmacy products of India with its top two export partners over the period of 1991 to 2012.
3. To analyze the Indian competitiveness and intra-industry trade of pharmaceutical products with its top two partners.
4. To study the issues of TRIPS with respect to India’s pharmaceutical exports.
2. Data and Methodology The study mainly covers the period of 12 years i.e. 1991 to 2012. Keeping in mind the nature of study, secondary data has been taken from the following different sources:
IJSER

International Journal of Scientific & Engineering Research, Volume 5, Issue 10, October-2014 836 ISSN 2229-5518
IJSER © 2014 http://www.ijser.org
1. Data for India high technology exports performance have been collected from WITS for 1991-2013.
2. Data for different indices like Revealed Comparative Advantage, Revealed Symmetric Comparative Advantage and Grubel-Lloyd (G-L) index have been collected from WITS database.
Methodology Various trade indices have been calculated to assess the India’s performance of pharmaceutical exports with her top two exporting partners. Export Competitiveness: The degree of export specialization of India with the USA and Russian federation is calculated with the help of two indices i.e. Balassa’s Revealed Comparative Advantage (RCA) and Revealed Symmetric Comparative Advantage (RSCA) for the average of five years i.e. 1991-1995, 1996-2000, 2001-2005, 2006-2010 and 2006-2012 for pharmaceutical products. Revealed Comparative Advantage Index: Balassa’s index (1965) of revealed comparative advantage (RCA) has been used to assess a country’s export potential. A variation of his formula was further interpreted by Donges and Riedel (1977); Browen (1983) and Vollrath (1991).
Table 2.1: Classification of Pharmaceutical Products Sr.no. SITC CODE Commodity Name 1. 54131 Pencillines and derivatives 2. 54132 Streptomycin’s and derivatives 3. 54133 Tetracycline’s and derivatives 4. 54139 Other antibiotics(bulk) 5. 54151 Insulin and its salts 6. 54152 Pituitary/hormones etc. 7. 54153 Cortisone derivatives 8. 54159 Other hormones/devices etc. 9. 54161 Glycosides and derivatives 10. 54162 Glands etc and extracts 11. 54163 Antisera/Blood fracture/Vaccine 12. 54164 Blood/Toxin/Cultures 13. 54211 Penicillin non retail 14. 54212 Antibiotic n.e.s non retail 15. 54213 Penicillin/Strept retail 16. 54219 Antibiotic n.e.s retail 17. 54221 Insulin formulated, bulk 18. 54222 Other hormones non retail 19. 54223 Insulin retail pack 20. 54224 Hormone ach retail pack 21. 54229 Hormone n.e.s retail pack
The RCA indicates whether a country is in the process of extending the products in which it has export potential, as opposed to situation in which the number of products that can be trade prospects with new partners. Countries with similar RCA profiles are unlikely to have high bilateral trade intensities unless intra industry trade is involved. RCA measures, if estimated at high levels of product disaggregation, can focus attention on the other non-traditional products that might be successfully exported. The RCA index of country i for the product j is often measured by the product’s share in the country’s exports in relation to its share in the world exports:
RCAij= (Xij/Xit)/ (Xwj/Xwt) Where Xij and Xwj are the values of country’s exports of product j and world exports of product j and where Xit and Xwt refer to the country’s total exports and world total exports. A value of less than unity implies that the country has a revealed comparative disadvantage in the product. Similarly, if the index exceeds unity, the country is said to have a revealed comparative advantage in the product. If the value is equal to one, the country’s specialization in a commodity is identical with the world specialization in that commodity (Balassa, 1977). RCA suffers from the problem of asymmetry as the ‘pure’ RCA is basically not comparable on both sides of unity. A country is said to be under-specialized in a given sector if the values of index ranges from zero to one; while the value of the index ranges from one to infinity, if country is specialized in that particular sector (Burange, 2008). Dalum et al. (1998) suggested a methodology to make the index symmetric and the new index is called ‘revealed symmetric comparative advantage’ (RSCA). Mathematically, it is;
RSCA= (RCA-1) / (RCA+1) This measure varies between -1 and +1 commodity is said to have comparative advantage in its exports if the corresponding RSCA value is positive and vice versa. In the present study, the RSCA is also used. Intra – Industry Trade (IIT): Intra industry trade arises if a country, in same period of time, imports and exports similar types of goods or services. Similarity means goods or services taken from the same sector/industry. IIT allows a country to take advantage of larger markets. Most commonly used index to measure the IIT is Grubel- Lloyd (G-L) index. G-L Index computes the ratio of net exports in a commodity category to its total trade i.e.
IITj= (Xij-Mij)-(Xij-Mij) / (Xij+Mij) Xij and Mij are country j’s exports and imports of industry i respectively. IITj=1 if trade in all industries is intra-industry (i.e. Xij=Mij for all i) and IITj=0 if trade in all industries is inter industry (i.e. either Xj=0 or Mj=0 for all i). As Grubel and Lloyd (1975) points out, this measurement of IIT will be affected by the size of the overall trade imbalance of the
IJSER

International Journal of Scientific & Engineering Research, Volume 5, Issue 10, October-2014 837 ISSN 2229-5518
IJSER © 2014 http://www.ijser.org
country. The greater the imbalance the greater will be the share of net trade and smaller share of IIT (Bruhart, 1995; Stone, 1995). IIT is driven by economies of scale and commodity gains. By being engaged in IIT, a country can reduce the number of similar commodities it produces and benefit from scale economies and specialization. A higher IIT value suggests that these sources of gains are being exploited. It also indicates that the adjustment cost would be lower when compared to inter-industry trade in the process of trade expansion (Parvakar, 2009).It is based on the Grubel-Lloyd (G-L) formula; G-L index for bilateral trade is used to find out the intra- industry trade between India and USA and Russian Federation. It is a modified form used by Sahoo (2009). The formula is:
GLi=1-{|Xij-Mji|} / (Xij+Mji) Compound Growth Rate: To calculate the compound growth rate for different indicators used in the study, the following formula has been used. Y= ABt Where A and B are parameters, Y is dependent variable and t is time variable. The compound growth rate is equal to
∧∧
− BB 100. x )1( is estimated value of B. Selection of Indian Companies: Indian companies have been selected to compare the R and D expenditure and their exports from prowess data base. There are nearly 5000 manufacturing firms in Bombay Stock Exchange (BSE) which are filtered on the basis of two steps as first exclude those firms which have zero or less than zero sales during any year of study period, secondly, there is exclusion of all those firms which have nil foreign equity in any year of study period.
Table 2.2: Selection of Indian Pharmaceutical Companies
Sr. No. Name of the Company 1.
Hester Biosciences Ltd. 2. Gujarat Themis Biosyn Ltd. 3. Ranbaxy Laboratories Ltd. 4. Cipla Ltd. 5. Pfizer Ltd. 6. Sanofi India Ltd. 7. GlaxoSmithKline Pharmaceuticals Ltd. 8. Merck Ltd. 9. Wyeth Ltd. 10. AstraZeneca Pharma India Ltd. 11. Abbott India Ltd. 12. Zenotech Laboratories Ltd. 13. Resonance Specialties Ltd. 14. Novartis India Ltd. 15. Vista Pharmaceuticals Ltd. 16. Kerala Ayurveda Ltd. 17. Wanbury Ltd. 18. Fermenta Biotech Ltd. 19. Themis Medicare Ltd. 20. Capsugel Healthcare Ltd. IJSER

International Journal of Scientific & Engineering Research, Volume 5, Issue 10, October-2014 838 ISSN 2229-5518
IJSER © 2014 http://www.ijser.org
3. Growth and Performance of India’s High Technology Exports: An Analysis of Pharmaceutical Products The average percentage share of pharmacy i.e. 34.92 percent seem to be the highest followed by chemistry (30.51 percent), computer office machines (12.10 percent), aerospace (6.31 percent), scientific instruments (5.57 percent), electronics tele-com’s (4.36 percent),non electrical machinery (4.15 percent), electrical machinery (1.87 percent) and armaments (0.22 percent) during the whole study period. The compound growth rate in aerospace found to be maximum with 12.66 percent followed by armaments (12.59 percent), scientific instruments (12.02 percent), pharmacy (11.78 percent), electrical machinery (11.66 percent), non electrical machinery (11.54 percent), electronics tele-com’s (11.16 percent), chemistry (11.07 percent) and computer office machines (10.91 percent) during the study period. From the above description of the Table 4.1, pharmaceutical products seem to be most important in terms of value as well as extent. From Table 4.2, United Kingdom seems to have the lowest variations in imports of India’s pharma products. On the other hand, the increasing share of USA in India’s pharma products reflects the better trade relations of USA with India. Thus, it is evident that USA is the top most exporting destination of India’s pharmaceutical exports followed by Russian Federation with an average share of 30.30 percent and 17.5 percent respectively, in total exports since 1991 till 2012. Germany is the third major importing country of India’s pharma products with an average share of 12.78 percent, followed by Nigeria (10.08 percent) United Kingdom (4.76 percent), Netherlands (4.60 percent), Vietnam (4.55 percent), Ukraine (7.48 percent), Brazil (4.39 percent) and South Africa (4.22 percent) in total pharmaceutical exports of India during 1991 to 2012. The compound growth rate of South Africa indicates to be maximum i.e.14.26 percent followed by Brazil (13.09 percent), US (12.59 percent), Ukraine (12.16 percent), Vietnam (12.03), UK (11.99 percent), Nigeria (11.31 percent), Netherlands (11.19), Russian federation (11.10 percent) and Germany (10.67 percent) during the study period. The compound growth rate is the highest of product ‘Insulin retail pack’ followed by ‘Cortisone derivatives’, ‘Streptomycin’s and their derivatives’, ‘Other hormones non retail’, ‘Insulin formulated and bulk’, ‘Antibiotic n.e.s retail’, ‘Penicillin/Strept retail’ and ‘Antibiotic n.e.s non retail’. Their compound growth rates found to be 19.06 percent, 18.42 percent, 16.60 percent, 15.93 percent, 15.49 percent, 14.82 percent, 14.60 percent and 13.61 percent respectively. The average share is the highest of product ‘Antibiotic n.e.s retail’ (33.40 percent) followed by ‘Penicillin/strept retail’ (19.00 percent), ‘Other antibiotics, bulk’ (8.76 percent) ‘Other hormones non retail’ (7.35
percent), ‘Antibiotic n.e.s non retail’ (6.61). These are important commodities in India’s exports to USA throughout the period (Table 4.3). The overall compound growth rate is found to be greater for ‘Pencillines/Strept retail’ with 14.26 percent, followed by ‘Hormone n.e.s retail pack’ (14.13 percent), ‘Antibiotic n.e.s non retail’ (12.94 percent annual growth) and ‘Glycosides and derivatives’ (12.90), ‘Insulin and salts’ (12.29), ‘Insulin retail pack’ (11.91), ‘Blood/Toxin/Cultures’ (11.54) and ‘Hormone n.e.s retail pack’ (11.30) during 1991 to 2012. This shows the changing import pattern of India pharmaceutical products from USA (table 4.4) The highest compound growth rate of exports is found for ‘Antisera/blood fracture/vaccine’ (13.38) followed by ‘Blood/Toxin/Cultures’ i.e. (13.15), ‘Glands etc. and extracts’ (12.26), ‘Streptomycin’s and derivatives’ (12.04), ‘Glycosides and derivatives’ (11.91), ‘Hormones ach retail pack’ (11.87) and ‘Penicillin/strept retail’ (11.73). The average share of exports is the highest of ‘Antibiotic n.e.s retail’ (26.00 percent) followed by ‘Antisera/blood fracture/vaccine’ (19.18 percent), ‘Hormone n.e.s retail pack’ (14.48 percent), ‘Insulin retail pack’ (13.28 percent), ‘Hormones ach retail pack’ (8.52 percent), ‘Penicillin/strept retail’ (5.13 percent) and ‘Blood/Toxin/Cultures’ (4.46 percent). Hence it is concluded from the table that India’s exports of pharma products are increasing, however the highest exports are of ‘Antisera/Blood fracture/Vaccine’ (table 4.5) The Compound Growth rate of Indian pharmaceutical imports from Russian federation has been found the highest for ‘Glands etc. and extracts’ (26.93) followed by ‘blood/toxin/cultures’ (11.98) and ‘Other antibiotics, (bulk)’ (10.77). The average share of imports is the highest of ‘Other antibiotics, (bulk)’ (49.69 per cent) followed by ‘Pencillines and derivatives’ (29.27 percent) and ‘Glands etc and extracts’ (20.04 percent). And others have very less average share in imports. ‘Blood/Toxin/Cultures’, ‘Antibiotic n.e.s retail’, ‘Insulin formulated, bulk’, ‘Other hormones non retail’, ‘Insulin retail pack’ and ‘Hormone n.e.s retail pack’ have specialization and their imports are less as compared to ‘Pencillines and derivatives’, ‘Other antibiotics (bulk)’ and ‘Glands etc and derivatives’ respectively.
IJSER

International Journal of Scientific & Engineering Research, Volume 5, Issue 10, October-2014 839 ISSN 2229-5518
IJSER © 2014 http://www.ijser.org
Table 3.1: India’s High Technology Exports with World (US$ Thousands)
Year Computer
office Machines
Scientific Instruments
Aerospace Electronics Tele-com’s
Chemistry Non
Electrical Machinery
Armaments Electrical Machinery
Pharmacy Total
1991 60443.978 (10.8)
26506.96 (4.77)
18274.01 (3.29)
25103.65 (4.52)
223272.1 (40.22)
27977.082 (5.04)
180.572 (0.03)
42248.5 (7.61)
131142.43 (23.62) 555149.3
1992 70802.705 (11.68)
20514.59 (3.39)
11603.75 (1.91)
49074.19 (8.10)
281444.1 (46.45)
23233.443 (3.83)
1054.75 (0.17)
11559.361 (1.91)
136669.23 (22.55) 605956.1
1993 111017.25 (15.89)
23999.94 (3.44)
23945.25 (3.43)
36781.41 (5.27)
291039.7 (41.66)
38060.447 (5.45)
674.494 (0.10)
9817.241 (1.41)
163223.71 (23.37) 698559.4
1994 150479.176 (17.47)
28400.57 (3.30)
13365.99 (1.55)
20602.83 (2.39)
366789.8 (42.58)
26258.005 (3.05)
409.521 (0.05)
10018.582 (1.16)
245080.06 (28.45) 861404.5
1995 217242.911 (18.18)
30743.33 (2.57)
10057.6 (0.84)
229700.06 (19.22)
340698.9 (28.51)
28363.113 (2.37)
324.507 (0.03)
13865.273 (0.65)
323828.56 (27.10) 1194824
1996 283565.916 (23.45)
49420.04 (4.09)
19229.04 (1.59)
27240.57 (2.25)
427611.1 (35.36)
32776.541 (2.71)
1006.055 (0.08)
7849.234 (0.89)
360752.47 (29.83) 1209451
1997 252266.247 (19.03)
46015.14 (3.47)
56506.25 (4.26)
38925.69 (2.94)
458923.5 (34.61)
47331.342 (3.57)
3880.942 (0.29)
11810.55 (1.32)
410209.55 (30.94) 1325869
1998 65087.905 (6.46)
52774.61 (5.24)
19278.61 (1.91)
39057.91 (3.88)
367419.9 (36.47)
45253.099 (4.49)
472.145 (0.05)
13299.978 (1.50)
404926.88 (40.19) 1007571
1999 118439.239 (9.76)
65662.51 (5.41)
43971.1 (3.62)
31028.36 (2.56)
425650.2 (35.06)
42585.918 (3.51)
1002.419 (0.08)
18232.041 (1.02)
467326.52 (38.50) 1213898
2000 196125.712 (13.02)
86557.16 (5.75)
62724.9 (4.16)
26845.8 (1.78)
499229.4 (33.14)
49112.421 (3.26)
1461.437 (0.10)
15382.631 (1.25)
568824.9 (37.76) 1506264
2001 348658.33 (19.19)
104332.1 (5.74)
98981.48 (5.45)
47008.2 (2.59)
467308.4 (25.72)
78487.791 (4.32)
7510.876 (0.41)
22696.348 (1.25)
641650.51 (35.32)
1816634
2002 262653.762 (13.80)
100469.9 (5.28)
118620.5 (6.23)
55638.06 (2.92)
507754.4 (26.68)
93821.463 (4.93)
2613.573 (0.14)
23885.465 (1.43)
737807.92 (38.77)
1903265
2003 339178.997 (15.05)
116103.8 (5.15)
103458.4 (4.59)
59907.22 (2.66)
601916.4 (26.71)
93437.602 (4.15)
4337.743 (0.19)
32121.099 (1.38)
902823.58 (40.07)
2253285
2004 387150.935 (15.19)
17926.1 (0.70)
107014.3 (4.20)
108061.9 (4.24)
747094.1 (29.30)
130894.787 (5.13)
4628.053 (0.18)
35234.483 (1.43)
1011378.4 (39.67)
2549383
2005 385087.128 (11.58)
217214.5 (6.53)
136555.6 (4.11)
170172.4 (5.12)
1002699 (30.14)
210659.368 (6.33)
929.327 (0.03)
58205.066 (1.38)
1144836 (34.42)
3326358
2006 407037.056 (10.66)
274318.4 (7.18)
87840.19 (2.30)
119344.2 (3.12)
1156211 (30.27)
142541.634 (3.73)
5257.408 (0.14)
93103.112 (1.75)
1534071.2 (40.16)
3819724
2007 346905.687 (6.79)
354951.7 (6.94)
441440.3 (8.63)
158519.2 (3.10)
1297377 (25.38)
209102.65 (4.09)
4320.827 (0.08)
85649.333 (2.44)
2214139.8 (43.31)
5112407
2008 354813.511 (4.63)
471756.8 (6.15)
1726497 (22.52)
333957.5 (4.36)
1573699 (20.53)
383090.719 (5.00)
43528.586 (0.57)
109302.257 (1.68)
2669985 (34.83)
7666630
2009 415324.201 (6.59)
608021.9 (9.64)
398957.8 (6.33)
412857.5 (6.55)
1205003 (19.11)
364678.558 (5.78)
44312.978 (0.70)
146754.35 (1.43)
2709212.4 (42.97)
6305123
2010 467178.974 (5.90)
610025.4 (7.70)
1806676 (22.81)
41827.9 (0.53)
1706469 (21.55)
368224.701 (4.65)
11659.119 (0.15)
174488.064 (2.20)
2732334 (34.50)
7918883
2011 511383.388 (5.92)
852026.1 (9.86)
467985.9 (5.42)
385970.1 (4.47)
1959916 (22.68)
298214.155 (3.45)
75804.839 (0.88)
261034.607 (3.02)
3827988.1 (44.30)
8640323
2012 494401.995 (4.99)
1018081 (10.28)
1939925 (19.59)
332199.4 (3.36)
1886630 (19.06)
233228.452 (2.36)
35234.872 (0.36)
233157.536 (2.36)
3727534 (37.65)
9900393
Compound Growth Rate
10.91 12.02 12.66 11.16 11.07 11.54 12.59 11.66 11.78 -
Average share
12.10 5.57 6.31 4.36 30.51 4.15 0.22 1.87 34.92 -
Source: Calculated from World Integrated Trade Solution (WITS), 2012. Note: Values in parentheses shows the percentage share of different sections.
IJSER

International Journal of Scientific & Engineering Research, Volume 5, Issue 10, October-2014 840 ISSN 2229-5518
IJSER © 2014 http://www.ijser.org
Table 3.2: Direction of India’s Pharmaceutical Exports with Top Ten Countries
(US$ Thousands)
Cont….
Year United States
Russian Federation
United Kingdom
Nigeria Germany South Africa
Brazil Vietnam Ukraine Netherlands Total Trade
1991 27116 (21.86)
- 12624 (10.18)
17653 (14.23)
57926 (46.7)
1 (0.00)
512 (0.41)
985 (0.79)
- 7219 (5.82) 124035.7
1992 25603 (12.24)
49761 (23.8)
13982 (6.69)
34067 (16.29)
69513 (33.25)
860 (0.41)
597 (0.29)
1577 (0.75)
- 13131 (6.28) 209091.3
1993 36814 (14.76)
84508 (33.89)
12958 (5.20)
27426 (11.00)
55153 (22.12)
2667 (1.07)
3994 (1.60)
5422 (2.17)
5620 (2.25)
14784 (5.93) 249344.9
1994 40119 (13.75)
84981 (29.09)
13406 (4.59)
26546 (9.09)
65069 (22.27)
4484 (1.53)
2268 (0.78)
21297 (7.29)
7914 (2.71)
26050 (8.92) 292133
1995 56095 (16.53)
86292 (25.43)
19072 (5.62)
34787 (10.25)
66556 (19.61)
6032 (1.78)
3353 (0.99)
25328 (7.46)
7722 (2.28)
34089 (10.05) 339327.5
1996 69368 (18.32)
106803 (28.21)
23086 (6.10)
34269 (9.05)
60357 (15.94)
8230 (2.17)
7067 (1.87)
27829 (7.35)
9510 (2.51)
32052 (8.47) 378572.5
1997 79528 (19.06)
99910 (23.94)
38192 (9.15)
39947 (9.57)
60936 (14.60)
10947 (2.62)
10787 (2.59)
25719 (6.16)
16758 (4.02)
34535 (8.28) 417259.7
1998 91166 (26.42)
43289 (12.55)
24599 (7.13)
48184 (13.96)
41952 (12.16)
9329 (2.70)
14920 (4.32)
33594 (9.74)
7419 (2.15)
30594 (8.87) 345045.6
1999 82918 (19.26)
109313 (25.39)
24975 (5.80)
63220 (14.68)
38182 (8.87)
11842 (2.75)
19095 (4.44)
33296 (7.73)
12212 (2.84)
35473 (8.24) 430526
2000 84828 (18.88)
93660 (20.85)
25022 (5.57)
71628 (15.94)
46478 (10.35)
14140 (3.15)
28735 (6.40)
34150 (7.60)
19296 (4.30)
31286 (6.96) 449222.1
2001 173642 (30.01)
105378 (18.22)
31393 (5.43)
72381 (12.51)
50218 (8.68)
14352 (2.48)
41728 (7.21)
40273 (6.96)
27688 (4.79)
21467 (3.71) 578519.9
2002 207538 (30.17)
97152 (14.13)
52115 (7.58)
73835 (10.74)
65272 (9.49)
20171 (2.93)
57483 (8.36)
47180 (6.86)
28368 (4.12)
38683 (5.62) 687796.6
2003 338467 (39.23)
126717 (14.69)
61612 (7.14)
73466 (8.52)
64498 (7.48)
24782 (2.87)
45451 (5.27)
53011 (6.14)
37930 (4.40)
36829 (4.27) 862762.9
2004 352427 (35.33)
152741 (15.31)
86955 (8.72)
92514 (9.27)
64181 (6.43)
37479 (3.76)
59887 (6.00)
52371 (5.25)
65710 (6.59)
33309 (3.34) 997573.4
2005 309256 (26.46)
213262 (18.25)
132362 (11.33)
110339 (9.44)
83149 (7.11)
50493 (4.32)
74524 (6.38)
64098 (5.48)
84279 (7.21)
46987 (4.02) 1168750
2006 497561 (32.72)
274882 (18.08)
130523 (8.58)
132930 (8.74)
80345 (5.28)
70836 (4.66)
108038 (7.10)
74252 (4.88)
105516 (6.94)
45758 (3.01) 1520642
IJSER

International Journal of Scientific & Engineering Research, Volume 5, Issue 10, October-2014 841 ISSN 2229-5518
IJSER © 2014 http://www.ijser.org
Year United
States Russian Federation
United Kingdom
Nigeria Germany South Africa
Brazil Vietnam Ukraine Netherlands Total Trade
2002 207538 (30.17)
97152 (14.13)
52115 (7.58)
73835 (10.74)
65272 (9.49)
20171 (2.93)
57483 (8.36)
47180 (6.86)
28368 (4.12)
38683 (5.62)
687796.6
2003 338467 (39.23)
126717 (14.69)
61612 (7.14)
73466 (8.52)
64498 (7.48)
24782 (2.87)
45451 (5.27)
53011 (6.14)
37930 (4.40)
36829 (4.27)
862762.9
2004 352427 (35.33)
152741 (15.31)
86955 (8.72)
92514 (9.27)
64181 (6.43)
37479 (3.76)
59887 (6.00)
52371 (5.25)
65710 (6.59)
33309 (3.34)
997573.4
2005 309256 (26.46)
213262 (18.25)
132362 (11.33)
110339 (9.44)
83149 (7.11)
50493 (4.32)
74524 (6.38)
64098 (5.48)
84279 (7.21)
46987 (4.02)
1168750
2006 497561 (32.72)
274882 (18.08)
130523 (8.58)
132930 (8.74)
80345 (5.28)
70836 (4.66)
108038 (7.10)
74252 (4.88)
105516 (6.94)
45758 (3.01)
1520642
2007 902080 (41.68)
279680 (12.92)
195767 (9.05)
142952 (6.61)
143122 (6.61)
111604 (5.16)
112940 (5.22)
99069 (4.58)
118693 (5.48)
58209 (2.69)
2164115
2008 1037176 (39.49)
340272 (12.96)
210115 (8.00)
204573 (7.79)
132221 (5.03)
197179 (7.51)
164153 (6.25)
106002 (4.04)
150743 (5.74)
83891 (3.19)
2626325
2009 1320730 (46.94)
265978 (9.45)
251418 (8.94)
180602 (6.42)
126908 (4.51)
193522 (6.88)
157105 (5.58)
122260 (4.35)
107984 (3.84)
87178 (3.10)
2813683
2010 1812120 (50.60)
296240 (8.27)
308383 (8.61)
193950 (5.42)
187132 (5.23)
257183 (7.18)
143994 (4.02)
123956 (3.46)
122879 (3.43)
135640 (3.79)
3581478
2011 2485558 (50.87)
534018 (10.93)
401347 (8.21)
277732 (5.68)
225899 (4.62)
318903 (6.53)
157038 (3.21)
167988 (3.44)
132267 (2.71)
185449 (3.80)
4886199
2012 3137276 (55.79)
490932 (8.73)
395117 (7.03)
287755 (5.12)
269031 (4.78)
315593 (5.61)
203849 (3.63)
174953 (3.11)
165268 (2.94)
183165 (3.26)
5622938
CGR 12.59 11.1 11.99 11.31 10.67 14.24 13.09 12.03 12.16 11.19 Average Share
30.02 17.5 7.48 10.02 12.78 3.55 4.18 5.26 3.66 5.53
Source: Calculated from World Integrated Trade Solution (WITS), 2012. Note: Values in parentheses shows the percentage share of different countries in India’s High Technology Product exports and (–) indicates no trade.
IJSER

International Journal of Scientific & Engineering Research, Volume 5, Issue 10, October-2014 842 ISSN 2229-5518
IJSER © 2014 http://www.ijser.org
Table 3.3: India’s Pharmaceutical Exports to USA (US$ Thousands)
Year 54131 54132 54133 54139 54151 54152 54153 54159 54161 54162 54163 54164 54211 54212 54213 54219 54221 54222 54223 54224 54229 Total
1991 NT NT NT 190 (17.61)
NT NT NT 171 (1.58)
NT 6 (0.56)
66 (6.12)
92 (8.53)
5 (0.46)
39 (3.61)
626 (58.02)
17 (1.58)
NT 10 (0.93)
11 (1.02)
NT NT 1079
1992 60 (5.45)
NT NT 28 (2.55)
NT NT NT NT NT NT NT 94 (8.55)
6 (0.55)
NT 449 (40.82)
346 (31.45)
NT NT 20 (1.82)
NT 97 (8.82)
1100
1993 219 (10.3)
NT NT 426 (20.20)
35 (1.66)
NT NT NT NT NT NT 237 (11.24)
6 (0.28)
NT 464 (22.00)
461 (21.86)
NT NT NT NT 261 (12.3)
2109
1994 109 (2.34)
NT NT 426 (9.14)
18 (0.39)
NT NT NT NT 24 (0.51)
205 (4.40)
261 (5.60)
24 (0.51)
718 (15.40)
1485 (31.86)
1019 (21.86)
NT 104 (2.23)
NT NT 268 (5.75)
4661 1995 653
(9.22) NT NT 813
(11.47) NT NT NT 28
(0.40) NT 209
(2.95) 566 (7.99)
289 (4.08)
27 (0.28)
378 (5.33)
2504 (35.34)
1489 (21.01)
NT 81 (1.14)
49 (0.69)
NT NT
7086 1996 1175
(12) NT NT 1474
(15.05) NT NT 21
(0.21) 70 (0.71)
NT 110 (1.12)
789 (8.06)
248 (2.53)
45 (0.46)
749 (7.65)
2870 (29.30)
1827 (18.65)
20 (0.20)
28 (0.29)
NT NT 369 (3.77) 9795
1997 239 (3.37)
NT 66 (0.93)
701 (9.87)
NT NT NT 450 (6.34)
NT 717 (10.10)
1033 (14.55)
408 (5.75)
692 (9.75)
12 (0.17)
1187 (16.72)
1433 (20.18)
NT 11 (0.15)
NT NT 152 (2.14)
7101
1998 673 (6.48)
NT 11 (0.11)
1466 (14.11)
NT 253 (2.44)
NT 92 (0.89)
NT 936 (9.01)
716 (6.89)
252 (2.43)
142 (1.37)
NT 2213 (21.30)
3158 (30.40)
NT 71 (0.68)
1 (0.01)
NT 404 (3.89)
10388
1999 1066 (9.96)
NT 176 (1.64)
1726 (16.13)
NT NT 8 (0.07)
202 (1.89)
125 (1.17)
117 (3.31)
951 (8.89)
5 (0.05)
NT NT 1555 (14.53)
4664 (43.59)
20 (0.19)
20 (0.19)
NT NT 65 (0.61)
10700
2000 752 (3.39)
3 (0.00)
66 (0.30)
389 (1.75)
NT NT NT 512 (2.31)
1154 (5.20)
735 (5.20)
1399 (6.30)
13 (0.06)
60 (0.27)
3 (0.01)
2891 (13.03)
7966 (35.90)
NT 296 (1.33)
5950 (26.8)
NT NT 22189
2001 1456 (2.21)
10 (0.01)
30 (0.05)
2424 (3.69)
NT NT 5 (0.01)
1443 (2.20)
3672 (5.59)
183 (5.59)
1099 (1.67)
21 (0.03)
485 (0.74)
0 6732 (10.24)
8014 (12.19)
NT 38069 (57.9)
2 (0.00)
NT 2095 (3.19)
65740
2002 213 (3.41)
41 (0.02)
126 (0.20)
5697 (9.12)
NT 5 (0.01)
16 (0.03)
3158 (5.05)
583 (0.93)
158 (0.93)
2275 (3.64)
179 (0.29)
1727 (2.76)
14158 (22.66)
9026 (14.44)
20389 (32.63)
19 (0.03)
225 (0.36)
0 NT 2581 (4.13)
62493
2003 1026 (1.16)
1 (0.07)
95 (0.11)
7886 (8.90)
36 (0.04)
NT 73 (0.08)
409 (0.46)
572 (0.65)
916 (0.65)
999 (1.13)
75 (0.08)
322 (0.36)
20098 (22.69)
10279 (11.61)
38756 (43.76)
8 (0.01)
386 (4.37)
1540 (1.74)
NT 1610 (1.82)
88569
2004 1333 (1.10)
0 (0.00)
15 (0.01)
4084 (3.37)
1130 (0.93)
NT 34 (0.03)
706 (0.58)
238 (0.20)
812 (0.20)
3115 (2.57)
13 (0.01)
2481 (2.05)
42954 (35.46)
15426 (12.73)
23877 (19.71)
0 (0.00)
16291 (13.45)
7910 (6.53)
NT 730 (0.60)
121149
Contd…
IJSER
International Journal of Scientific & Engineering Research, Volume 5, Issue 10, October-2014 843 ISSN 2229-5518
IJSER © 2014 http://www.ijser.org
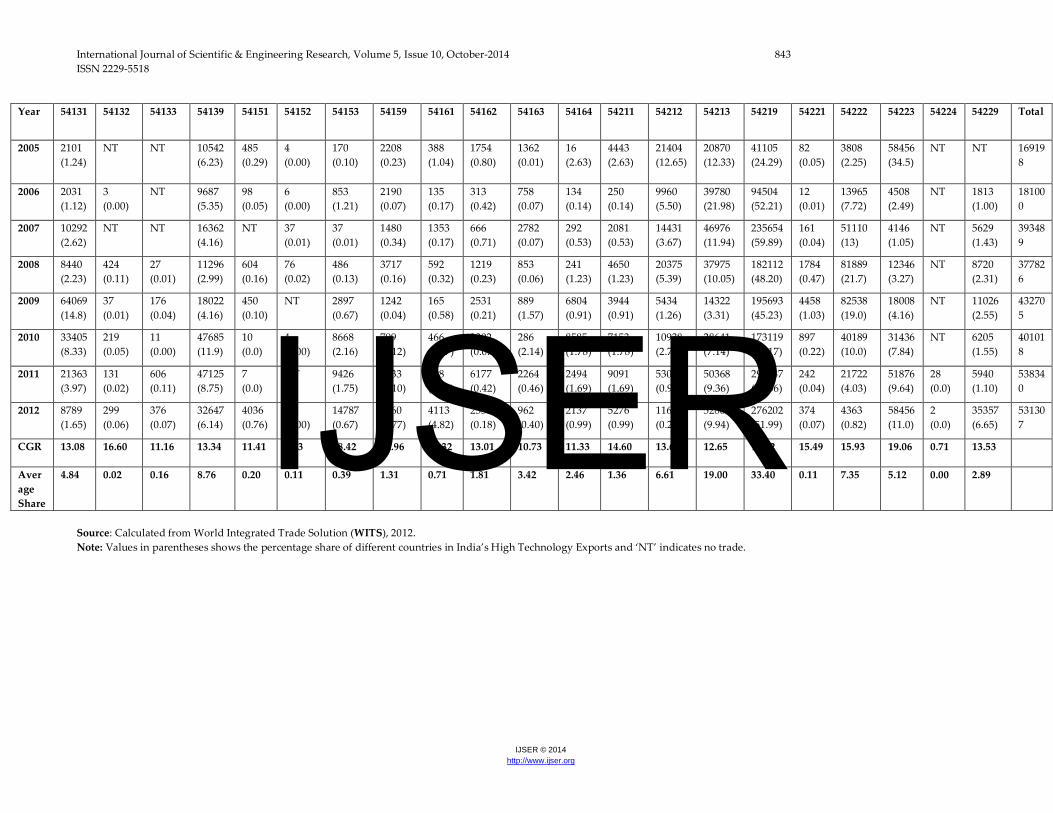
Year 54131 54132 54133 54139 54151 54152 54153 54159 54161 54162 54163 54164 54211 54212 54213 54219 54221 54222 54223 54224 54229 Total
2005 2101 (1.24)
NT NT 10542 (6.23)
485 (0.29)
4 (0.00)
170 (0.10)
2208 (0.23)
388 (1.04)
1754 (0.80)
1362 (0.01)
16 (2.63)
4443 (2.63)
21404 (12.65)
20870 (12.33)
41105 (24.29)
82 (0.05)
3808 (2.25)
58456 (34.5)
NT NT 169198
2006 2031 (1.12)
3 (0.00)
NT 9687 (5.35)
98 (0.05)
6 (0.00)
853 (1.21)
2190 (0.07)
135 (0.17)
313 (0.42)
758 (0.07)
134 (0.14)
250 (0.14)
9960 (5.50)
39780 (21.98)
94504 (52.21)
12 (0.01)
13965 (7.72)
4508 (2.49)
NT 1813 (1.00)
181000
2007 10292 (2.62)
NT NT 16362 (4.16)
NT 37 (0.01)
37 (0.01)
1480 (0.34)
1353 (0.17)
666 (0.71)
2782 (0.07)
292 (0.53)
2081 (0.53)
14431 (3.67)
46976 (11.94)
235654 (59.89)
161 (0.04)
51110 (13)
4146 (1.05)
NT 5629 (1.43)
393489
2008 8440 (2.23)
424 (0.11)
27 (0.01)
11296 (2.99)
604 (0.16)
76 (0.02)
486 (0.13)
3717 (0.16)
592 (0.32)
1219 (0.23)
853 (0.06)
241 (1.23)
4650 (1.23)
20375 (5.39)
37975 (10.05)
182112 (48.20)
1784 (0.47)
81889 (21.7)
12346 (3.27)
NT 8720 (2.31)
377826
2009 64069 (14.8)
37 (0.01)
176 (0.04)
18022 (4.16)
450 (0.10)
NT 2897 (0.67)
1242 (0.04)
165 (0.58)
2531 (0.21)
889 (1.57)
6804 (0.91)
3944 (0.91)
5434 (1.26)
14322 (3.31)
195693 (45.23)
4458 (1.03)
82538 (19.0)
18008 (4.16)
NT 11026 (2.55)
432705
2010 33405 (8.33)
219 (0.05)
11 (0.00)
47685 (11.9)
10 (0.0)
4 (0.00)
8668 (2.16)
799 (0.12)
466 (0.57)
2302 (0.07)
286 (2.14)
8585 (1.78)
7153 (1.78)
10938 (2.73)
28641 (7.14)
173119 (43.17)
897 (0.22)
40189 (10.0)
31436 (7.84)
NT 6205 (1.55)
401018
2011 21363 (3.97)
131 (0.02)
606 (0.11)
47125 (8.75)
7 (0.0)
NT 9426 (1.75)
7233 (0.10)
558 (1.15)
6177 (0.42)
2264 (0.46)
2494 (1.69)
9091 (1.69)
5302 (0.98)
50368 (9.36)
296387 (55.06)
242 (0.04)
21722 (4.03)
51876 (9.64)
28 (0.0)
5940 (1.10)
538340
2012 8789 (1.65)
299 (0.06)
376 (0.07)
32647 (6.14)
4036 (0.76)
0 (0.00)
14787 (0.67)
3560 (0.77)
4113 (4.82)
25599 (0.18)
962 (0.40)
2137 (0.99)
5276 (0.99)
1167 (0.22)
52805 (9.94)
276202 (51.99)
374 (0.07)
4363 (0.82)
58456 (11.0)
2 (0.0)
35357 (6.65)
531307
CGR 13.08 16.60 11.16 13.34 11.41 8.43 18.42 12.96 10.32 13.01 10.73 11.33 14.60 13.61 12.65 14.82 15.49 15.93 19.06 0.71 13.53
Average Share
4.84 0.02 0.16 8.76 0.20 0.11 0.39 1.31 0.71 1.81 3.42 2.46 1.36 6.61 19.00 33.40 0.11 7.35 5.12 0.00 2.89
Source: Calculated from World Integrated Trade Solution (WITS), 2012. Note: Values in parentheses shows the percentage share of different countries in India’s High Technology Exports and ‘NT’ indicates no trade.
IJSER

International Journal of Scientific & Engineering Research, Volume 5, Issue 10, October-2014 844 ISSN 2229-5518
IJSER © 2014 http://www.ijser.org
Table 3.4: India’s Pharmaceutical Imports from US (US$ Thousands)
SITC CODE
54131 54132 54133 54139 54151 54152 54153 54159 54161 54162 54163 54164 54211 54212 54213 54219 54221 54222 54223 54224 54229 Total Trade
1991 3056 (18.25)
NT 55 (0.33)
7174 (42.85)
92 (0.55)
1 (0.01)
359 (2.14)
1326 (7.92)
2 (0.01)
115 (0.69)
378 (2.26)
289 (1.73)
2 (0.01)
169 (1.01)
8 (0.05)
201 (1.20)
364 (2.17)
3031 (18.10)
0 (0.00)
119 (0.71)
2 (0.01)
16743
1992 676 (3.31)
58 (0.28)
146 (0.71)
10894 (53.34)
NT 44 (0.22)
2587 (12.67)
2204 (10.79)
3 (0.01)
121 (0.59)
2822 (13.82)
394 (1.93)
49 (0.24)
46 (0.23)
NT 40 (0.20)
7 (0.03)
38 (0.19)
3 (0.01)
193 (0.94)
100 (0.49)
20425
1993 3185 (17.23)
NT NT 7661 (41.45)
279 (1.51)
NT 2485 (13.44)
3251 (17.59)
16 (0.09)
13 (0.07)
928 (5.02)
322 (1.74)
17 (0.09)
113 (0.61)
22 (0.12)
2 (0.01)
NT 87 (0.47)
NT 95 (0.51)
7 (0.04)
18483
1994 2518 (11.44)
NT 3 (0.01)
13258 (60.23)
204 (0.93)
NT 1307 (5.94)
2689 (12.22)
33 (0.15)
36 (0.16)
891 (4.05)
242 (1.10)
115 (0.52)
93 (0.42)
432 (1.96)
16 (0.07)
NT 25 (0.11)
NT 42 (0.19)
107 (0.49)
22011
1995 3238 (8.45)
126 (0.33)
46 (0.12)
11607 (30.30)
340 (0.89)
NT 1554 (4.06)
2155 (5.62)
100 (0.26)
25 (0.07)
1675 (4.37)
16563 (43.23)
NT 35 (0.09)
146 (0.38)
541 (1.41)
NT 60 (0.16)
61 (0.16)
NT 41 (0.11)
38313
1996 3460 (19.37)
204 (1.14)
7 (0.04)
8475 (47.46)
1253 (7.02)
NT 360 (2.02)
1669 (9.35)
5 (0.03)
6 (0.03)
1392 (7.79)
539 (3.02)
NT 1 (0.01)
63 (0.35)
417 (2.33)
1 (0.01)
NT NT NT 7 (0.04)
17859
1997 3693 (11.11)
5 (0.02)
29 (0.09)
15279 (45.96)
1479 (4.45)
NT 780 (2.35)
4607 (13.86)
55 (0.17)
36 (0.11)
3902 (11.74)
1983 (5.92)
11 (0.03)
15 (0.05)
34 (0.10)
1042 (3.13)
NT 12 (0.04)
127 (0.38)
NT 157 (0.47)
33246
1998 2223 (7.48)
NT NT 20076 (67.58)
NT NT 262 (0.88)
2817 (9.48)
38 (0.13)
43 (0.14)
2835 (9.54)
616 (2.07)
NT NT 15 (0.05)
215 (0.72)
NT 450 (1.51)
59 (0.20)
NT 60 (0.20) 29709
1999 1079 (5.01)
15 (0.07)
43 (0.20)
13585 (63.06)
433 (2.01)
1 (0.00)
625 (2.90)
2965 (13.76)
198 (0.92)
77 (0.36)
1145 (5.31)
971 (4.51)
5 (0.02)
NT 353 (1.64)
26 (0.12)
2 (0.01)
10 (0.05)
NT NT 10 (0.05) 21543
2000 1065 (5.76)
0 34 (0.18)
10425 (56.38)
102 (0.55)
0 93 (0.50)
2152 (11.46)
65 (0.35)
41 (0.22)
1575 (8.52)
1342 (7.26)
NT NT 653 (3.53)
873 (4.72)
1 (0.01)
9 (0.05)
2 (0.01)
NT 58 (0.31) 18490
2001 240 (1.30)
4 (0.02)
0 9965 (53.87)
1266 (6.84)
NT 135 (0.73)
1980 (10.70)
33 (0.18)
71 (0.38)
1860 (10.06)
1856 (10.23)
12 (0.06)
NT 477 (2.58)
230 (1.24)
NT 4 (0.02)
NT NT 365 (1.97) 18498
2002 1631 (5.35)
NT 18 (0.06)
14072 (46.16)
123 (0.40)
NT NT 3730 (12.24)
81 (0.27)
183 (0.60)
6947 (22.79)
1753 (5.75)
5 (0.02)
NT 1677 (5.50)
103 (0.34)
NT 34 (0.11)
9 (0.03)
NT 117 (0.38) 30483
2003 1127 (2.79)
0 0 22611 (56.00)
3715 (9.20)
NT 904 (2.24)
3602 (8.92)
157 (0.39)
1 (0.00)
3977 (9.85)
867 (2.15)
2 (0.00)
NT 1504 (3.72)
74 (0.18)
3 (0.01)
254 (0.63)
NT 215 (0.53)
1367 (3.39) 40380
2004 261 (0.60)
3 (0.01)
0 23781 (55.01)
4811 (11.13)
1 (0.00)
1119 (2.59)
1747 (4.04)
586 (1.36)
81 (0.19)
5444 (12.59)
2591 (5.99)
11 (0.03)
1 (0.14)
1779 (4.12)
347 (0.80)
4 (0.01)
266 (0.62)
0 NT 394 (0.91) 43227
Contd…
IJSER

International Journal of Scientific & Engineering Research, Volume 5, Issue 10, October-2014 845 ISSN 2229-5518
IJSER © 2014 http://www.ijser.org
YEAR 54131 54132 54133 54139 54151 54152 54153 54159 54161 54162 54163 54164 54211 54212 54213 54219 54221 54222 54223 54224 54229 Total Trade
2005 795 (1.51)
1 (0.00)
0 25750 (48.90)
3387 (6.43)
3 (0.01)
1477 (2.80)
1530 (2.91)
1040 (1.98)
30 (0.06)
8531 (16.20)
4935 (9.37)
9 (0.02)
75 (0.22)
1995 (3.79)
904 (1.72)
NT 566 (1.07)
NT 106 (0.20)
1523 (2.89) 52657
2006 13 (0.02)
3 (0.00)
0 17912 (28.60)
5691 (9.09)
5 (0.01)
570 (0.91)
994 (1.59)
386 (0.62)
6 (0.01)
25836 (41.25)
3798 (6.06)
27 (0.04)
136 (0.01)
4307 (6.88)
1591 (2.54)
NT 203 (0.32)
69 (0.11)
304 (0.49)
787 (1.26) 62638
2007 8 (0.01)
2 (0.00)
1 (0.00)
41393 (43.60)
9969 (10.50)
NT 476 (0.50)
1000 (1.05)
277 (0.29)
272 (0.29)
29585 (31.16)
2788 (2.94)
169 (0.18)
5 (4.25)
5123 (5.40)
1995 (2.10)
NT 299 (0.31)
70 (0.07)
85 (0.09)
1430 (1.51) 94947
2008 472 (0.38)
9 (0.01)
64 (0.05)
48671 (39.36)
4352 (3.51)
2 (0.00)
1166 (0.94)
708 (0.57)
376 (0.30)
666 (0.54)
40196 (32.51)
5081 (4.11)
537 (0.43)
5250 (0.01)
6074 (4.91)
4418 (3.57)
NT 958 (0.77)
554 (0.45)
NT 4104 (3.32) 123658
2009 208 (0.14)
9 (0.01)
6 (0.00)
47276 (31.29)
8708 (5.76)
NT 1596 (1.06)
570 (0.38)
506 (0.33)
547 (0.36)
68095 (45.07)
5010 (3.32)
NT 13 (0.00)
7074 (4.68)
4568 (3.02)
NT 631 (0.42)
3 (0.00)
0 (0.00)
6272 (4.15) 151092
2010 532 (0.31)
7 (0.00)
66 (0.04)
59053 (34.30)
6049 (3.51)
NT 1126 (0.65)
1316 (0.76)
679 (0.39)
631 (0.54)
74747 (43.07)
5811 (3.38)
NT NT 5279 (3.07)
6888 (4.00)
NT 1094 (0.64)
2 (0.00)
1 (0.00)
8878 (5.16) 172159
2011 4789 (2.13)
847 (0.38)
237 (0.11)
55569 (24.74)
10398 (4.63)
NT 1804 (0.80)
3573 (1.59)
635 (0.28)
1206 (0.10)
87823 (39.10)
6644 (2.96)
NT 50 (0.02)
29963 (13.34)
NT NT 167 (0.07)
6130 (2.73)
20 (0.01)
7843 (3.49) 224593
2012 3116 (1.66)
197 (0.11)
246 (0.13)
31467 (16.78)
3722 (1.98)
NT 841 (0.45)
3511 (1.87)
1154 (0.62)
185 (0.27)
117831 (62.83)
12134 (6.47)
NT NT NT 12.94 NT 476 (0.25)
7641 (4.07)
0 (0.00)
5014 (2.67) 187535
CGR 9.01 9.71 10.30 10.95 12.29 9.49 10.12 9.73 12.90 11.30 12.80 11.54 10.80 10.08 14.26 1.66 7.88 11.12 11.91 9.12 14.13
Average share
5.62 0.11 0.09 44.87 4.13 0.01 2.75 7.22 0.41 0.27 19.97 6.14 0.08 0.32 3.01 33.40 0.10 1.18 0.23 0.17 1.51
Source: Calculated from World Integrated Trade Solution (WITS), 2012. Note: Values in parentheses shows the percentage share of different countries in India’s High Technology Product imports and ‘NT’ indicates that there is no trade.
IJSER

International Journal of Scientific & Engineering Research, Volume 5, Issue 10, October-2014 846 ISSN 2229-5518
IJSER © 2014 http://www.ijser.org
Table 3.5: India’s Pharmaceutical Exports to Russian Federation (US$ Thousands)
Year 54131 54132 54133 54139 54151 54152 54153 54159 54161 54162 54163 54164 54211 54212 54213 54219 54221 54222 54223 54224 54229 Total Trade
1992 3945 (2.54)
1 (0.0)
NT 13270 (8.56)
13 (0.01)
NT NT 879 (0.57)
219 (0.14)
561 (0.36)
2004 (1.29)
1547 (1.00)
438 (0.28)
1184 (0.76)
15048 (9.70)
43508 (28.05)
4 (0.00)
1843 (1.19)
41315 (26.64)
9774 (6.30)
19549 (12.60)
155102.3
1993 1402 (1.11)
NT NT 3160 (2.51)
NT 5 (0.02)
212 (0.17)
123 (0.10)
1162 (0.92)
760 (0.60)
1781 (1.42)
1835 (1.46)
1171 (0.93)
2983 (2.37)
5320 (4.23)
49530 (39.87)
339 (0.27)
703 (0.56)
17386 (13.81)
16902 (13.43)
21112 (16.77)
125885.3
1994 7096 (3.71)
10 (0.01)
38 (0.02)
9033 (4.73)
1629 (0.85)
50 (0.16)
764 (0.40)
376 (0.20)
74 (0.04)
88 (0.05)
6489 (3.40)
2410 (1.26)
2100 (1.10)
1546 (0.81)
12884 (6.74)
66616 (34.87)
92 (0.05)
8896 (4.66)
21068 (11.03)
17740 (9.29)
32050 (16.78)
191049.8
1995 6436 (3.78)
17 (0.01)
71 (0.04)
2670 (1.57)
6787 (3.99)
9 (0.05)
542 (0.32)
424 (0.25)
348 (0.20)
1168 (0.69)
8805 (5.18)
1798 (1.06)
2120 (1.25)
1997 (1.17)
13292 (7.81)
58209 (34.22)
NT 5160 (3.03)
25689 (15.10)
15619 (9.18)
18940 (11.13)
170102.2
1996 13442 (5.92)
58 (0.03)
517 (0.23)
4522 (1.99)
4295 (1.89)
77 (0.21)
260 (0.11)
389 (0.17)
304 (0.13)
1290 (0.57)
17978 (7.92)
5152 (2.27)
784 (0.35)
485 (0.21)
12377 (5.45)
63169 (27.82)
28 (0.01)
1723 (0.76)
48877 (21.53)
14905 (6.57)
36395 (16.03)
227026
1997 11922 (4.40)
213 (0.08)
496 (0.18)
6146 (2.27)
410 (0.15)
624 (1.10)
507 (0.19)
530 (0.20)
568 (0.21)
3410 (1.26)
19773 (7.31)
11860 (4.38)
983 (0.36)
866 (0.32)
10454 (3.86)
73125 (32.36)
117 (0.04)
3366 (1.24)
44562 (16.47)
23757 (8.78)
56952 (21.04)
270640.3
1998 7925 (3.61)
887 (0.40)
369 (0.17)
7587 (3.46)
970 (0.44)
93 (0.22)
80 (0.04)
441 (0.20)
510 (0.23)
1222 (0.56)
23511 (10.72)
5704 (2.60)
355 (0.16)
3155 (1.44)
8886 (4.05)
70964 (28.97)
2 (0.00)
1703 (0.78)
32441 (14.79)
10924 (4.98)
41598 (18.97)
219326.1
1999 6578 (3.32)
0 (0.0)
507 (0.26)
11178 (5.64)
30 (0.02)
35 (0.11)
834 (0.42)
400 (0.20)
583 (0.29)
1851 (0.93)
18004 (9.08)
6091 (3.07)
136 (0.07)
1994 (1.01)
7779 (3.92)
57463 (28.19)
6466 (3.26)
1532 (0.77)
30876 (15.57)
15174 (7.65)
30844 (15.55)
198354.3
2000 8037 (2.72)
109 (0.02)
475 (0.16)
11328 (3.84)
515 (0.17)
0 (0.00)
1228 (0.42)
698 (0.24)
2093 (0.71)
2307 (0.78)
31543 (10.69)
8118 (2.75)
839 (0.28)
704 (0.24)
9433 (3.20)
83155 (21.31)
31 (0.01)
2906 (0.99)
55911 (18.95)
24203 (8.20)
51398 (17.42)
295030.4
2001 8558 (1.95)
100 (0.01)
541 (0.12)
10400 (2.37)
747 (0.17)
NT 425 (0.10)
250 (0.06)
621 (0.14)
2577 (0.59)
62221 (14.15)
10669 (2.43)
753 (0.17)
1156 (0.26)
18124 (4.12)
93698 (28.19)
NT 6290 (1.43)
114536 (26.05)
38028 (8.65)
69960 (15.91) 439654
2002 5320 (1.52)
23 (0.02)
333 (0.10)
10910 (3.12)
18 (0.01)
65 (0.12)
553 (0.16)
443 (0.13)
1094 (0.31)
872 (0.25)
63772 (18.21)
18971 (5.42)
1077 (0.31)
912 (0.26)
15416 (4.40)
88969 (22.82)
NT 8058 (2.30)
42361 (12.10)
34578 (9.88)
56379 (16.10)
350123.2
2003 7181 (1.61)
111 (0.07)
282 (0.06)
11426 (2.56)
9 (0.00)
NT 571 (0.13)
198 (0.04)
1321 (0.30)
750 (0.17)
87550 (19.65)
18788 (4.22)
810 (0.18)
1064 (0.21)
23671 (5.31)
101670 (24.07)
NT 24272 (5.45)
52293 (11.74)
41245 (9.26)
72387 (16.24)
445598.6
2004 6365 (1.11)
414 (0.01)
456 (0.08)
10417 (1.82)
3 (0.00)
15 (0.02)
527 (0.09)
230 (0.04)
1603 (0.28)
1774 (0.31)
106565 (18.66)
35030 (6.13)
644 (0.11)
574 (0.10)
29376 (5.14)
137429 (24.92)
NT 14675 (2.57)
73652 (12.90)
55380 (9.70)
95874 (16.79)
571001.1
Contd...
IJSER

International Journal of Scientific & Engineering Research, Volume 5, Issue 10, October-2014 847 ISSN 2229-5518
IJSER © 2014 http://www.ijser.org
Year 54131 54132 54133 54139 54151 54152 54153 54159 54161 54162 54163 54164 54211 54212 54213 54219 54221 54222 54223 54224 54229 Total Trade
2005 4813 (0.59)
93 (0.01)
410 (0.05)
14862 (1.81)
8 (0.00)
NT 606 (0.07)
232 (0.03)
1390 (0.17)
3336 (0.41)
194791 (23.71)
43624 (5.13)
3374 (0.41)
445 (0.05)
38365 (4.67)
204732 (22.1)
67 (0.01)
2056 (0.25)
104050 (12.6)
82850 (10.0)
121296 (14.77) 821399.9
2006 5938 (0.45)
130 (0.01)
313 (0.02)
17362 (1.33)
417 (0.03)
NT 663 (0.05)
83 (0.01)
3293 (0.25)
989 (0.08)
437687 (33.43)
71071 (5.43)
5874 (0.45)
10695 (0.82)
64792 (4.95)
289383 (22.0)
NT 8605 (0.66)
89601 (6.84)
101750 (7.77)
200599 (15.32) 1309244
2007 4764 (0.33)
143 (0.01)
798 (0.06)
27044 (1.88)
2264 (0.16)
NT 1170 (0.08)
598 (0.04)
3847 (0.27)
1930 (0.13)
501050 (34.85)
104607 (7.27)
685 (0.05)
6371 (0.44)
66842 (4.65)
316756 (19.97)
6 (0.0)
19200 (1.34)
124427 (8.65)
104544 (7.27)
150891 (10.49) 1437938
2008 2739 (0.13)
18 (0.00)
121 (0.01)
27363 (1.33)
1670 (0.08)
NT 1064 (0.05)
1868 (0.09)
2365 (0.11)
26161 (1.27)
768343 (37.30)
162388 (7.88)
3863 (0.19)
12572 (0.61)
124351 (6.04)
411371 (19.97)
1 (0.0)
13925 (0.68)
131410 (6.38)
159701 (7.75)
208858 (10.14) 2060151
2009 3706 (0.19)
201 (0.01)
391 (0.02)
41202 (2.16)
2849 (0.15)
NT 614 (0.03)
871 (0.05)
2631 (0.14)
19700 (1.03)
708273 (37.12)
115157 (6.04)
129 (0.01)
9348 (0.49)
88021 (4.61)
362323 (18.99)
NT 3241 (0.17)
120433 (6.31)
176177 (9.23)
252783 (13.25) 1908051
2010 9931 (0.41)
321 (0.01)
153 (0.01)
48208 (1.99)
4707 (0.19)
2 (0.0)
12090 (0.50)
1418 (0.06)
4791 (0.20)
30359 (1.25)
868054 (35.75)
156596 (6.45)
72 (0.0)
3961 (0.16)
81843 (3.37)
541450 (22.30)
4 (0.0)
6523 (0.27)
197671 (8.14)
200786 (8.27)
259488 (10.69) 2428426
2011 6874 (0.22)
1106 (0.03)
1443 (0.05)
66184 (2.08)
5449 (0.17)
NT
2593 (0.08)
1165 (0.04)
7609 (0.24)
35183 (1.11)
1157377 (36.42)
259244 (8.16)
140 (0.0)
11564 (0.36)
212386 (6.68)
620402 (19.52)
251 (0.01)
6562 (0.21)
218735 (6.88)
262462 (8.26)
301409 (9.48) 3178138
2012 5235 (0.16)
576 (0.02)
1924 (0.06)
54992 (1.70)
9381 (0.29)
3 (0.0)
1742 (0.05)
1470 (0.05)
9551 (0.30)
36546 (1.13)
1183404 (36.64)
296487 (9.18)
381 (0.01)
14360 (0.44)
155896 (4.48)
699453 (21.65)
8 (0.00)
2446 (0.08)
204467 (6.33)
275397 (8.53)
276285 (8.55) 3230004
CGR 9.99 12.04 10.81 11.33 11.09 8.10 11.16 10.54 11.91 12.26 13.88 13.15 9.51 11.17 11.73 11.52 8.88 10.68 11.18 11.87 11.57 Average Share
1.90 0.04 0.08 2.80 0.42 0.02 0.16 0.13 0.27 0.64 19.18 4.46 0.32 0.60 5.13 26.00 0.17 1.40 13.28 8.52 14.48
Source: Calculated from World Integrated Trade Solution (WITS), 2012. Note: Values in parentheses shows the percentage share of different countries in India’s High Technology Product exports and ‘NT’ indicates no trade.
IJSER

International Journal of Scientific & Engineering Research, Volume 5, Issue 10, October-2014 848 ISSN 2229-5518
IJSER © 2014 http://www.ijser.org
Table 3.6: India’s Pharmaceutical Imports from Russian Federation (US$ Thousands)
Year 54131 54139 54152 54153 54159 54162 54164 54219 54221 54222 54223 54229 Total Trade
1992 370 (87.14)
34 (8.02)
NT NT NT 21 (4.84)
NT NT NT NT NT NT 424.63
1993 1023 (58.14)
720 (40.95)
NT NT NT NT NT NT 16 (0.91)
NT NT NT 1758.85
1994 1133 (95.29)
36 (3.06)
NT NT NT NT 20 (1.65)
NT NT NT NT NT 1188.83
1995 1729 (77.63)
498 (22.37)
NT NT NT NT NT NT NT NT NT NT 2227.37
1996 4070 (78.46)
980 (18.89)
NT 83 (1.61)
46 (0.89)
8 (0.15)
NT NT NT NT NT NT 5187.77
1997 2141 (37.55)
3245 (56.90)
190 (3.33)
NT NT 39 (0.68)
NT NT NT 88 (1.54)
NT NT 5702.36
1998 467 (8.71)
4686 (87.38)
NT NT NT 210 (3.92)
NT NT NT NT NT NT 5362.65
1999 2633 (53.67)
1874 (38.21)
NT NT NT 398 (8.11)
NT NT NT NT NT NT 4904.88
2000 4264 (68.21)
1431 (22.89)
NT NT NT 557 (8.90)
NT NT NT NT NT NT 6252.23
2001 1485 (25.43)
2677 (45.85)
NT NT NT 1676 (28.71)
NT NT NT NT NT NT 5837.32
2002 840 (23.67)
1874 (52.82)
NT NT 72 (2.02)
763 (21.49)
NT NT NT NT NT NT 3548.72
2003 NT 736 (33.91)
NT NT NT 1342 (61.82)
93 (1.28)
NT NT NT NT NT 2170.14
2004 NT 2588 (89.53)
NT NT NT 300 (10.37)
2 (0.06)
1 (0.04)
NT NT NT NT 2890.72
2005 NT 2743 (75.70)
NT NT NT 827 (22.83)
1 (0.04)
20 (0.54)
NT NT 32 (0.88)
NT 3623.40
2006 NT 5290 (82.36)
NT NT NT 1107 (17.24)
3 (0.05)
22 (0.35)
NT NT NT NT 6422.99
2007 NT 5384 (87.03)
NT NT NT 802 (12.97)
NT NT NT NT NT NT 6186.48
2008 NT 8507 (92.40)
NT NT NT 695 (7.55)
5 (0.05)
NT NT NT NT NT 9206.79
2009 NT 1760 (62.98)
NT NT NT 1034 (37.02)
NT NT NT NT NT NT 2793.93
2010 NT 17 (4.24)
NT NT NT 394 (95.76)
NT NT NT NT NT NT 410.97
2011 26 (0.82)
1346 (42.01)
NT NT NT 1772 (55.31)
13 (0.40)
NT NT NT NT 47 (1.46) 3204.13
2012 NT 772 (76.09)
NT NT NT 236 (23.21)
7 (0.70)
NT NT NT NT NT 1015.10
CGR 9.09 10.77 26.93 11.98 8.51 Average share
29.27 49.69 0.16 0.08 0.14 20.04 0.34 0.04 0.04 0.07 0.04 0.07
Source: Compiled from World Integrated Trade Solution (WITS), 2012. Note: Values in parentheses shows the percentage share of world in India’s high technology product
IJSER

International Journal of Scientific & Engineering Research, Volume 5, Issue 10, October-2014 849 ISSN 2229-5518
IJSER © 2014 http://www.ijser.org
Table 3.7: Revealed Comparative Advantage of Pharmaceutical Products of India with US
SITC code Name of the Product 1991-1995 1996-2000 2001-2005 2006-2010 2006-2012
54131 Pencillines and derivatives 0.30 0.84 1.54 17.37 16.54
54132 Streptomycin’s and derivatives - 0.26 1.44 3.53 3.43
54133 Tetracycline’s and derivatives - 0.18 0.07 0.06 0.14
54139 Other antibiotics(bulk) 0.11 0.27 0.85 2.94 2.74
54151 Insulin and its salts 12.73 - 4.52 1.38 6.99
54152 Pituitary/hormones etc. - 6.91 0.00 0.08 0.07
54153 Cortisone derivatives - 0.04 0.02 0.43 0.59
54159 Other hormones/devices etc. 0.25 0.26 1.29 0.59 0.90
54161 Glycosides and derivatives - 1.66 2.40 0.52 0.63
54162 Glands etc and extracts 0.11 0.44 0.38 0.32 0.79
54163 Antisera/Blood fracture/Vaccine 0.09 0.15 0.07 0.01 0.01
54164 Blood/Toxin/Cultures 0.71 0.46 0.04 0.25 0.23
54211 Penicillin non retail 0.10 0.97 25.66 30.38 33.16
54212 Antibiotic n.e.s non retail 5.22 0.99 38.71 18.97 14.29
54213 Penicillin/strept retail 3.70 7.08 6.57 8.79 8.33
54219 Antibiotic n.e.s retail 0.34 1.00 5.19 14.68 13.45
54221 Insulin formulated, bulk - 46.15 2.57 50.19 51.42
54222 Other hormones non retail 1.95 2.08 57.71 42.63 30.61
54223 Insulin retail pack 0.06 6.10 2.14 0.76 0.89
54224 Hormone ach retail pack - - - - 0.00
54229 Hormone n.e.s retail pack 0.20 0.05 0.13 0.31 0.39
Source: Calculated from World Integrated Trade Solution (WITS), 2012. Note: ‘-’ Indicates that the either the data was not available or there has no export in the corresponding period.
IJSER

International Journal of Scientific & Engineering Research, Volume 5, Issue 10, October-2014 850 ISSN 2229-5518
IJSER © 2014 http://www.ijser.org
Table 3.8: Revealed Symmetric Comparative Advantage of Pharmaceutical Products of India with US
SITC code Name of the Product 1991-1995 1996-2000 2001-2005 2006-2010 2006-2012
54131 Pencillines and derivatives -0.54 -0.09 0.21 0.89 0.89
54132 Streptomycin’s and derivatives -1.00 -0.58 0.18 0.56 0.55
54133 Tetracycline’s and derivatives -1.00 -0.70 -0.87 -0.89 -0.75
54139 Other antibiotics(bulk) -0.80 -0.57 -0.08 0.49 0.46
54151 Insulin and its salts 0.85 -1.00 0.64 0.16 0.75
54152 Pituitary/hormones etc. -1.00 0.75 -0.99 -0.85 -0.88
54153 Cortisone derivatives -1.00 -0.92 -0.96 -0.40 -0.25
54159 Other hormones/devices etc. -0.60 -0.59 0.13 -0.26 -0.05
54161 Glycosides and derivatives -1.00 0.25 0.41 -0.32 -0.23
54162 Glands etc and extracts -0.81 -0.39 -0.45 -0.51 -0.12
54163 Antisera/Blood fracture/Vaccine -0.83 -0.74 -0.86 -0.97 -0.98
54164 Blood/Toxin/Cultures -0.17 -0.37 -0.93 -0.60 -0.63
54211 Penicillin non retail -0.82 -0.02 0.92 0.94 0.94
54212 Antibiotic n.e.s non retail 0.68 -0.01 0.95 0.90 0.87
54213 Penicillin/strept retail 0.57 0.75 0.74 0.80 0.79
54219 Antibiotic n.e.s retail -0.49 0.00 0.68 0.87 0.86
54221 Insulin formulated, bulk -1.00 0.96 0.44 0.96 0.96
54222 Other hormones non retail 0.32 0.35 0.97 0.95 0.94
54223 Insulin retail pack -0.88 0.72 0.36 -0.13 -0.06
54224 Hormone ach retail pack -1.00 -1.00 -1.00 -1.00 -1.00
54229 Hormone n.e.s retail pack -0.67 -0.91 -0.76 -0.53 -0.44
Source: Calculated from World Integrated Trade Solution (WITS), 2012.
IJSER

International Journal of Scientific & Engineering Research, Volume 5, Issue 10, October-2014 851 ISSN 2229-5518
IJSER © 2014 http://www.ijser.org
Table 3.9: Revealed Comparative Advantage of Pharmaceutical Product of India with Russian Federation
SITC code Name of the Product 1992-1995 1996-2000 2001-2005 2006-2010 2006-2012
54131 Pencillines and derivatives 7.85 15.95 16.05 47.62 34.69
54132 Streptomycin’ and derivatives 0.00 2.32 0.00 6.62 4.73
54133 Tetracycline’s and derivatives 0.00 0.17 0.00 0.65 0.47
54139 Other antibiotics(bulk) 4.17 7.84 14.51 10.95 8.98
54151 Insulin and its salts 0.00 0.00 0.00 0.00 0.56
54152 Pituitary/hormones etc. 0.00 0.85 0.00 0.00 0.00
54153 Cortisone derivatives 5.40 0.84 6.37 10.89 8.13
54159 Other hormones/devices etc. 0.53 3.10 0.55 2.22 1.58
54161 Glycosides and derivatives 0.00 0.09 0.00 0.00 0.03
54162 Glands etc and extracts 11.39 6.99 38.02 12.06 8.66
54163 Antisera/Blood fracture/Vaccine 0.66 0.30 2.15 3.76 2.70
54164 Blood/Toxin/Cultures 16.98 14.26 0.83 0.64 0.47
54211 Penicillin non retail 17.58 24.28 72.23 90.13 67.07
54212 Antibiotic n.e.s non retail 10.21 10.09 39.86 169.25 121.96
54213 Penicillin/strept retail 15.99 12.61 9.29 12.01 16.57
54219 Antibiotic n.e.s retail 1.87 4.24 11.96 17.29 15.55
54221 Insulin formulated, bulk 28.01 2821.06 178.93 0.00 0.00
54222 Other hormones non retail 24.36 50.76 116.15 189.58 170.31
54223 Insulin retail pack 1.44 3.09 1.95 2.06 2.03
54224 Hormone ach retail pack 0.00 0.00 0.00 0.18 0.28
54229 Hormone n.e.s retail pack 3.76 3.77 3.81 8.15 10.37
Source: Calculated from World Integrated Trade Solution (WITS), 2012.
IJSER

International Journal of Scientific & Engineering Research, Volume 5, Issue 10, October-2014 852 ISSN 2229-5518
IJSER © 2014 http://www.ijser.org
Table 3.10: Revealed Symmetric Comparative Advantage of Pharmaceutical Products of India with Russian Federation
SITC code Name of the Product 1991-1995 1996-2000 2001-2005 2006-2010 2006-2012
54131 Pencillines and derivatives 0.77 0.88 0.88 0.96 0.94
54132 Streptomycin’s & derivatives -1.00 0.40 -1.00 0.74 0.65
54133 Tetracycline’s and derivatives -1.00 -0.71 -1.00 -0.21 -0.36
54139 Other antibiotics(bulk) 0.61 0.77 0.87 0.83 0.80
54151 Insulin and its salts -1.00 -1.00 -1.00 -1.00 -0.28
54152 Pituitary/hormones etc. -1.00 -0.08 -1.00 -1.00 -1.00
54153 Cortisone derivatives 0.69 -0.09 0.73 0.83 0.78
54159 Other hormones/devices etc. -0.31 0.51 -0.29 0.38 0.23
54161 Glycosides and derivatives -1.00 -0.84 -1.00 -1.00 -0.94
54162 Glands etc and extracts 0.84 0.75 0.95 0.85 0.79
54163 Antisera/blood fracture/vaccine -0.20 -0.53 0.37 0.58 0.46
54164 Blood/Toxin/Cultures 0.89 0.87 -0.09 -0.22 -0.36
54211 Penicillin non retail 0.89 0.92 0.97 0.98 0.97
54212 Antibiotic n.e.s non retail 0.82 0.82 0.95 0.99 0.98
54213 Penicillin/strept retail 0.88 0.85 0.81 0.85 0.89
54219 Antibiotic n.e.s retail 0.30 0.62 0.85 0.89 0.88
54221 Insulin formulated, bulk 0.93 1.00 0.99 -1.00 -1.00
54222 Other hormones non retail 0.92 0.96 0.98 0.99 0.99
54223 Insulin retail pack 0.18 0.51 0.32 0.35 0.34
54224 Hormone ach retail pack -1.00 -1.00 -1.00 -0.69 -0.57
54229 Hormone n.e.s retail pack 0.58 0.58 0.58 0.78 0.82
Source: Calculated from World Integrated Trade Solution (WITS), 2012.
IJSER

International Journal of Scientific & Engineering Research, Volume 5, Issue 10, October-2014 853 ISSN 2229-5518
IJSER © 2014 http://www.ijser.org
Table 3.11: India-US Bilateral Grubel-Lloyd Index
SITC code Name of the Product 1991-1995 1996-2000 2001-2005 2006-2010 2006-2012
54131 Pencillines and their derivatives 0.18 0.58 0.60 0.03 0.15
54132 Streptomycin’s and their derivatives 0.00 0.05 0.30 0.28 0.35
54133 Tetracycline’s and their derivatives 0.00 0.34 0.05 0.19 0.33
54139 Other antibiotics (bulk) 0.08 0.17 0.47 0.62 0.71
54151 Insulin and its salts 0.19 0.00 0.13 0.07 0.19
54152 Pituitary glands 0.00 0.00 0.31 0.23 0.19
54153 Cortisone derivative 0.00 0.03 0.10 0.49 0.41
54159 Other hormones/devices etc. 0.01 0.17 0.67 0.63 0.68
54161 Glycosides and derivative 0.00 0.18 0.36 0.59 0.62
54162 Glands etc. and extracts 0.25 0.32 0.34 0.42 0.35
54163 Antisera/blood fracture/vaccine 0.22 0.68 0.53 0.06 0.05
54164 Blood/Toxin/Cultures 0.56 0.32 0.08 0.40 0.41
54211 Penicillin/strept retail 0.37 0.01 0.02 0.11 0.08
54212 Antibiotic n.e.s non retail 0.10 0.29 0.00 0.09 0.07
54213 Penicillin/strept retail 0.82 0.17 0.22 0.33 0.34
54219 Antibiotic n.e.s retail 0.69 0.31 0.03 0.05 0.04
54221 Insulin formulated ,bulk 0.00 0.31 0.14 0.00 0.00
54222 Other hormones non retail 0.31 0.39 0.13 0.03 0.05
54223 Insulin retail pacts 0.39 0.01 0.02 0.03 0.08
54224 Hormones ach retail pack 0.00 - 0.00 0.00 0.14
54229 Hormone n.e.s retail pack 0.88 0.31 0.40 0.64 0.62
Source: Calculated from World Integrated Trade Solution (WITS), 2012. Note: ‘-’ Indicates that the either the data was not available or there has no trade in the corresponding period.
IJSER

International Journal of Scientific & Engineering Research, Volume 5, Issue 10, October-2014 854 ISSN 2229-5518
IJSER © 2014 http://www.ijser.org
Table 3.12: India-Russian Federation Bilateral Grubel-Lloyd Index
SITC code Name of the Product 1992-1995 1996-2000 2001-2005 2006-2010 2006-2012 54131 Pencillines and derivatives 0.71 0.71 0.35 0.00 0.01 54139 Other antibiotics (bulk) 0.53 0.52 0.51 0.37 0.49 54152 Pituitary/hormones etc. - 0.37 - - - 54153 Cortisone derivatives 0.50 0.00 0.00 0.00 0.00 54159 Other hormones/devices etc. 0.00 0.00 0.12 0.00 0.00 54162 Glands etc and extracts 0.00 0.39 0.59 0.16 0.19 54164 Blood/Toxin/Cultures 0.02 0.00 0.52 0.12 0.20 54219 Antibiotic n.e.s retail 0.00 0.00 0.00 0.00 0.00 54221 Insulin formulated bulk 0.05 0.00 0.00 - - 54222 Other hormones non retail 0.00 0.01 0.00 0.00 0.00 54223 Insulin retail pack 0.00 0.00 0.00 0.00 0.00 54229 Hormone n.e.s retail pack 0.00 0.00 0.00 0.00 0.00 Source: Calculated from World Integrated Trade Solution (WITS), 2012. Note: ‘-’ there has been no trade of that particular commodity in the corresponding period. Table 4.7 depicts RSCA with USA for pharmaceutical products during 1991-1995, 1996-2000, 2001-2005, 2006-2010 and 2006-2012. In 1991-1995, India has great extent of symmetric competitive advantage index with ‘insulin and salts’ (0.85) in 1991-95 followed by ‘Antibiotic n.e.s non retail’ (0.68), Penicillin/Strept Retail (0.57) and ‘Other hormones non-retail’ (0.32). Remaining pharmaceutical products namely ‘Pencillines and derivatives’ (-0.54), ‘Other antibiotics (bulk)’ (-0.80), ‘Other hormones/devices etc.’ (-0.60), ‘Glands etc. and extracts’ (-0.81), ‘Antisera/Blood fracture/Vaccine’ (-0.83), ‘Blood/Toxin/Cultures’ (-0.17), ‘Penicillin non retail’ (-0.82), ‘Antibiotic n.e.s retail’ (-0.49), ‘Insulin retail pack’ (-0.88) and ‘Hormone n.e.s retail pack’(-0.67) have revealed symmetric comparative disadvantage for the same study period. Perfect symmetric disadvantage has also been found in ‘Streptomycin’s and derivatives’, ‘Tetracycline’s and derivatives’, ‘Pituitary/hormones etc.’, ‘Cortisone derivatives’, ‘Glycosides and derivatives’, ‘Insulin formulated, bulk’ and ‘hormone n.e.s retail pack’ for the same period. Highest symmetric competitive advantage index is found in ‘Insulin formulated, bulk’ (0.96) followed by ‘Penicillin non retail’ (0.94), ‘Penicillin and derivatives’ (0.89), ‘Antibiotic n.e.s non retail’ (0.87), ‘Penicillin/Strept Retail’ (0.79) and ‘Insulin and its salts’ (0.75). Pharmaceutical products namely ‘Streptomycin’s and derivatives’, ‘Other antibiotics (bulk)’, ‘Penicillin non retail’, ‘Antibiotic n.e.s non retail’, ‘Antibiotic n.e.s retail’ and ‘Insulin formulated, bulk’ gained as they came to status from disadvantage to advantage throughout the study
period. Some pharmaceutical products namely ‘Tetracycline’s and derivatives’, ‘Pituitary/hormones etc.’ ‘Cortisone derivatives’, ‘Other hormones/devices etc.’ ‘Glycosides and derivatives’, ‘Glands etc. and extracts’, ‘Antisera/blood fracture/vaccine’, ‘Blood/toxin/cultures’, ‘Hormone ach retail pack’ and ‘Hormone n.e.s retail pack’ could not achieve symmetric advantage status. Table 4.8 shows India’s revealed Comparative Advantage in Pharmacy Sector with Russian federation from the period of 1992 to 2012. In 1992-1995, India has greater RCA with Russian federation in ‘Insulin formulated, bulk’ (28.01) followed by ‘Other hormones non retail’ (24.36), ‘Penicillin non retail’ (17.58), Blood/Toxin/Cultures (16.98), ‘Glands etc. and extracts’ (11.39), ‘Antibiotic n.e.s non retail’ (10.21), ‘Penicillin and derivatives’ (7.85), ‘Cortisone derivatives’ (5.40), ‘Other antibiotics (bulk)’ (4.17)’ ‘Hormones n.e.s retail pack’ (3.76), ‘Insulin retail pack’ (1.44). Highest comparative advantage have accounted in ‘Other hormones non retail’ (189.58) in the 2006-2010. While in 2006-2012, India has again registered great extent of competitive advantage for ‘Other hormones non retail’ with 170.3. ‘Antibiotic n.e.s non retail’ shows tremendous increase from 10.21 in 1991-1995 to 121.96 in 2006-2012. Value of RCA has decreased from 2006-10 to 2006-2012 for all products except ‘Insulin and its salts’, ‘Penicillin/strept retail’, ‘Hormone ach retail pack’ and ‘Hormone n.e.s retail pack’. This decrease is due to the impact of global financial crisis. During 1996-2005, the products namely ‘Pencillines and derivatives’, ‘other antibiotics (bulk)’, ‘Penicillin non
IJSER

International Journal of Scientific & Engineering Research, Volume 5, Issue 10, October-2014 855 ISSN 2229-5518
IJSER © 2014 http://www.ijser.org
retail’, ‘Antibiotic n.e.s retail’, ‘Other hormones non retail’ and ‘Hormone n.e.s retail pack’ have come into the category of higher comparative advantage. But during 2006-2012, ‘Pituitary/hormones etc.’ and ‘Insulin formulated, bulk came in under specialization. From the above description of Table 4.9, highest comparative advantage of India with Russian federation is in the ‘Insulin formulated bulk’ during 1992-2005. Since 2005, other pharmaceutical products namely ‘Penicillin and derivatives’, ‘Streptomycin’s and derivatives’, ‘Other antibiotics (bulk)’, ‘Insulin and its salt’, ‘Penicillin non retail’, ‘Antibiotic n.e.s non retail’, ‘Penicillin/strept retail’,
‘Insulin formulated, bulk’ and ‘Other hormones non retail’ gained its position. It is clear from the above analysis that greater RSCA value with Russian federation has been in the ‘Pencillines and derivatives’, ‘Penicillin non retail’, ‘Antibiotic n.e.s non retail’, ‘Antibiotic n.e.s retail’ and ‘other hormones non retail’ throughout the study period. Some products ‘Insulin and salts’, ‘Pituitary/hormones etc.’, ‘Glycosides and derivatives’ and ‘Hormone ach retail pack’ cannot maintain its status. But ‘Other hormones/devices etc.’ and ‘Antisera/blood fracture/vaccine’, are able to maintain its position from comparative disadvantage to advantage throughout the study period.
Table 4.11 highlights values of intra-industry trade measured by GL index between India and US for the average of 1991-1995, 1996 -2000, 2001-2005 and 2006- 2012. During 1991-1995, the level of intra industry trade shows that it is the highest for ‘Hormones n.e.s retail pack’ (0.88) followed by ‘Penicillin/strept retail’ with the value of 0.82, ‘Antibiotic n.e.s retail’ (0.69), ‘Blood/Toxin/Culture’ (0.56), ‘Insulin retail pack’ (0.39), ‘Penicillin /strept retail’ (0.82), ‘Other hormones non retail’ (0.31), ‘Glands etc and extracts’ (0.25) , ‘Antisera/blood fracture/vaccine’ (0.22), ‘Insulin and its salts’ (0.19), ‘Penicillin and derivatives’ (0.18), ‘Other antibiotic, bulk’ (0.08), and ‘Other hormone devices etc.’ (0.01) during 1991-1995. ‘Streptomycin’s and derivatives’ has no intra industry trade between India and US during 1991-1995 but it has been found at moderate level during remaining study period. In 2006-2012, it is found the highest for ‘Other antibiotics (bulk)’ (0.71) followed by ‘Other hormones/devices etc.’ (0.68), ‘Glycosides and derivatives’ (0.62) and ‘Blood/Toxin/Cultures’ (0.41). ‘Hormones n.e.s retail’ has maintained its position throughout study period as its intra industry trade index has been found maximum in many years. The intra industry trade has found increase in ‘Other antibiotics (bulk)’, ‘Insulin formulated, bulk’, and ‘Hormone n.e.s retail pack’ throughout the study period. ‘Streptomycin’s and their derivatives’, ‘Tetracycline’s and their derivatives’, ‘Pituitary glands’, ‘Cortisone derivative’, ‘Glycosides and derivatives’, ‘Insulin formulated, bulk’, and ‘hormones ach retail pack’ has found zero intra industry trade in many selected years as in these commodities India depends on USA’s imports. Table 4.12 shows that intra industry trade between India and Russian federation during 1992-1995, 1996-2000, 2001-2005, 2006-2010 and 2006-2012. During 1992-1995, intra industry trade between India and Russia federation is found zero for other hormones/devices etc, glands etc and extracts, antibiotic n.e.s retail, insulin retail pack, other hormones non retail and hormone n.e.s retail pack as for these commodities India does not depend on Russia. It is
found the highest for ‘Pencillines and derivatives’ (0.71) followed by ‘Other antibiotics (bulk)’ (0.53), ‘Cortisone derivative’ (0.50), ‘Insulin formulated, bulk’ (0.05) and ‘Blood/Toxin/Culture’ (0.02) during same period. During 2006-2012 highest intra industry trade between India and Russian federation is found in ‘Other antibiotic bulk’ (0.49) followed by ‘Blood/Toxin/Culture’ (0.20), ‘Glands etc. and extract’ (0.19) and then ‘Penicillin and derivatives' (0.01). The commodity ‘Antibiotic n.e.s retail’, ‘Other hormone non retail’,’ ‘Insulin retail pack’, and ‘Hormone n.e.s retail pack’ have found zero intra industry trade. But in other commodities ‘Cortisone derivatives’ have also found zero intra industry trade here India only exports to Russia. IJSER

International Journal of Scientific & Engineering Research, Volume 5, Issue 10, October-2014 856 ISSN 2229-5518
IJSER © 2014 http://www.ijser.org
4. TRIPS and Indian Pharmaceutical Exports
The share of manufactured trade particularly high technology products is increasing rapidly in developing countries. The high technology products were growing faster due to their higher income elasticity of demand, greater scope for product innovation and the formation of TRIPS. This is due to many factors, such as increase in their production, their low prices at international market, increase of their R&D expenditure etc. Therefore, in this section, an attempt is made to comprehend the emergence of TRIPS in India and also to discuss its one important issue related its impact on Indian pharmaceutical exports (Kiran & Mishra, 2011). India has a unique position in pharmaceutical industry in world as especially in production of generic medicines, which has been able to provide medicines at lower prices. For all this, credit goes to the India Patents Act that of 1970 (Deolalikar & Evenson, 1989). However, the Indian Patent Act of 1970 has not proved effectively for pharmaceuticals as there are impositions of an artificially low royalty ceiling on compulsory licenses and unavailability of product patents for pharmaceuticals. Indian Patent Act 1970 recognizes only process patents in pharmaceuticals and agro-chemicals, while the WTO agreement requires both product and process patents in all fields (Agarwal, 2001). Being a member of WTO, India amended its Patent Law on March 22, 2005, abolishing its “process” patents law and introduced “product patents’ for pharmaceuticals, food, and chemicals to meet its TRIPs obligations (Agarwal & Saibaba, 2001). The pharmaceuticals industry is one of the world’s most research-intensive industries, which is making enormous contributions to health care. In order to provide incentives to innovators to undertake research, many countries, especially the developed ones where major innovations take place, have a tradition of strong patent protection. The patent system has become more prevalent after the establishment of Trade-Related Intellectual Property Rights (TRIPS) Agreement in the World Trade Organization (WTO) which made it compulsory for WTO members to include drugs/medicines in their regime for product and process patents (Nair, 2008). After 2005, India’s leading drug companies recognized that they could not survive as global players without significant R&D capabilities. Its pharmaceutical companies can also operate at much lower profit margins that their western counterparts. According to Greece (2012), “ India can produce bulk drugs that cost 60 percent less than in the west and can open a production plant in India 40 percent cheaper the in developed countries because of this, India has become a hub for pharmaceutical research and development for many foreign pharmaceutical companies”
Traditionally, the vast majority of India’s pharmaceutical R&D spending was concentrated on reverse engineering and the adaptation of patented foreign drugs to the Indian market. As the pharmaceutical industry is a highly R&D-oriented sector. To comply with the WTO’s TRIPS agreement, India has reintroduced product patent protection in pharmaceuticals from 1 January 2005. With the reintroduction of product patents, leading Indian pharmaceutical are shifting their business strategies by placing greater focus on R&D. Many MNCs began re-entering the Indian pharmaceutical market by setting up their manufacturing and R&D facilities. This will gradually neutralize the cost advantages enjoyed Indian pharmaceutical majors (Correa, 2000). Table 4.1 shows the growth of R&D expenditure in the Indian pharmaceutical industry in the post-TRIPS period. R&D expenditure of domestic Indian companies increased from Rs.80.60 crores in 1995 to Rs. 3342.32 crores in 2010. Its growth has been fluctuating throughout the study period. The maximum growth has been found in 1996 i.e. (76.78). R&D expenditure of foreign companies has increased from Rs.64.13 crores to Rs.934 crores during the same period and its growth has also been found fluctuating and even found negative in 1999 and 2007. The compound growth rate of R&D expenditure has been found greater for domestic companies (12.29). R&D intensity of domestic companies and foreign companies increased from 1.34 percent and 0.77 percent in 1995 to 4.50 percent and 4.01 percent in 2010 respectively. From the table, it is clear that R&D expenditure and R&D intensity of Indian domestic companies is the higher as compared to foreign companies. The literature explained that even after implementation of TRIPS in India, foreign pharmaceutical companies are putting less investment in Indian Pharma Industry due to two reasons. Firstly, they are not much confident regarding the returns and profits. Secondly, they are getting no incentives for development of Indian R&D and train Indian people with the high tech knowledge or are basically pretentious about their R&D activities based in India. Therefore, R&D intensity could not grow faster. Table 4.2 and 4.3 shows the R&D intensity and export performance of 22 firms of the pharmaceutical sector. R&D intensity of Hester Biosciences Ltd has increased from 0 in March 2001 to 0.22 in March 2012 and its export performance also gone up from 0 in March 2001 to US$ 0.58 million in March 2012. Spending on R&D in manufacturing had a much larger impact on the probability of exporting, this suggests that spending on R&D was not simply to boost the probability of producing new goods and services, but it likely involved an additional impact of improving the establishment’s knowledge assets, which in help to boost
IJSER

International Journal of Scientific & Engineering Research, Volume 5, Issue 10, October-2014 857 ISSN 2229-5518
IJSER © 2014 http://www.ijser.org
the productions. The results here also supported the economic theory which explained that ‘spending on R&D in manufacturing had a much larger impact on the probability of exporting’ as is evident from the result of the study. The results shows that R&D intensity of Ranbaxy Laboratories Ltd increased sharply from 0 in March 2001 to 86 in March 2012 and its exports have also increased from US$ 161.05 million in Mach 2001 to US$ 1039.12 million in March 2012. Similarly, the result of all other firms revealed that with increase in intensity of R&D of the firms, exports performance of these firms has also increased such as Cipla Ltd., Merck Ltd., Mylan Laboratories Ltd. and Biocon Ltd. Their R&D intensity increased from 0, 0.13, 0 and 0 in March 2001 to 60.89, 0.73, 55.8 and 20.21 respectively. Export performance of Cipla Ltd., Merck Ltd., Mylan Laboratories Ltd. and Biocon Ltd. also gone up during the same period proportionally to the R&D intensity. Their
export performance has increased from US$ 57.11 million; US$ 3.72 million; US$ 0.98 million and US$ 5.87 million in March 2001 to US$ 739.54 million; US$ 10.26 million; US$ 679.04 million and US$ 134.47 million in March 2012 respectively. Since TRIPS enforcement in India, firms started to spend more money in R and D. This is clear from Table 4.2 that firms like Cipla Ltd. and Biocon Ltd are not investing in R&D till 2004, but since 2005, their intensity sharply increased from 27.09 and 4.16 in March 2006 to 60.89 and 20.21 respectively in March, 2012. Highest average share in R&D intensity during 2000- 2012 is found for Ranbaxy Laboratories limited (69.93 percent) followed by Cipla limited (27.53 percent) and Pfizer limited (1.81). Average share of exports is also highest for Indian Ranbaxy laboratories limited companies with average share of 45.29 followed by Cipla limited with average share of 28.25 percent and Malyon laborites limited (10. 82 percent).
Table 4.1: Growth of R &D Expenditure in Indian Pharmaceutical Companies
Year R&D Expenditure
R&D expenditure as % of sales
Domestic Company ( Rs.Crores)
Growth %
Foreign Company (Rs.Crores)
Growth %
Domestic Company
%
Growth %
Foreign Company
%
Growth %
1995 80.61 - 64.13 - 1.34 - 0.77 - 1996 142.50 76.78 83.37 30.00 1.71 27.61 0.91 18.18 1997 148.17 3.94 89.41 7.24 1.55 -9.30 0.95 4.40 1998 154.15 4.07 90.65 1.39 1.43 -7.74 0.88 -7.35 1999 218.66 41.85 79.78 -11.99 1.56 9.09 0.70 -20.43 2000 256.80 17.44 90.17 13.02 1.56 0.00 0.66 -5.71 2001 435.07 9.42 109.81 21.78 2.30 47.44 0.72 9.09 2002 597.91 37.43 110.04 0.21 2.64 14.78 0.65 -9.72 2003 686.74 14.86 232.73 111.50 2.93 10.98 0.71 9.23 2004 1084.20 57.89 346.69 48.97 3.81 30.03 1.16 54.93 2005 1527.24 40.86 510.50 47.25 4.98 30.71 1.63 48.18 2006 1850.97 21.20 816.02 59.85 5.35 7.43 2.39 46.63 2007 2371.79 28.14 695.62 -14.75 5.01 -6.36 2.67 11.72 2008 2772.63 16.90 700.18 0.66 4.78 -4.59 2.86 7.12 2009 2316.14 19.60 846.05 20.83 4.89 2.30 3.84 34.27 2010 3342.32 0.79 934.40 10.44 4.50 -7.98 4.01 4.43 CGR 12.95 26.03* 12.29 23.09* 11.11 9.63 11.25 13.26
Source: Ministry of Chemicals and Fertilizers, Department of Pharmaceuticals Annual Report 2011-12, *Represents average
IJSER

International Journal of Scientific & Engineering Research, Volume 5, Issue 10, October-2014 858 ISSN 2229-5518
IJSER © 2014 http://www.ijser.org
Table 4.2: Research and Development Intensity of Indian Pharmaceutical Companies
Source: Centre for Monitoring Indian Economy (CMIE), Prowess. Research and Development Intensity: Expenditure on R&D as a proportion of firm’s sales.
Name of the companies Mar 2001
Mar 2002
Mar 2003
Mar 2004
Mar 2005
Mar 2006
Mar 2007
Mar 2008
Mar 2009
Mar 2010
Mar 2011
Mar 2012
Average Share
Hester Biosciences Ltd. 0 0 0 0 0 0 0 0 0 0 0.15 0.22 0.03 Gujarat Themis Biosyn Ltd. 0 0 0 0 0 0 0 0.01 0 0 0 0 0.00 Ranbaxy Laboratories Ltd. 0 0 35.03 52.21 75.35 106.55 86.56 104.95 85.43 101.26 105.86 86 69.93 Cipla Ltd. 0 0 0 0 0 27.09 33.46 50.69 45.97 55.1 57.74 60.89 27.58 Pfizer Ltd. 0 0 0 0 0 0 0 6.16 5.73 6.27 2.31 1.22 1.81 Sanofi India Ltd. 0 0 0 0 0.91 0 0 1.15 0.96 1.1 0.81 0.76 0.47 GlaxoSmithKline Pharmaceuticals Ltd.
0 0 0 0 0 0 0 1.12 0.95 1 0.98 0.73 0.40
Merck Ltd. 0.13 0.08 0.06 0.03 0.06 0.13 0.23 0.31 0.31 0.39 0.54 0.59 0.24 Wyeth Ltd. 0 0 0 0 0 0 0 0.2 0.19 0.17 0.45 0.3 0.11
AstraZeneca Pharma India Ltd. 0 0 0 0 0 0 0.5 0.6 0.49 0.45 0.72 0.29 0.25
Abbott India Ltd. 0 0 0 0 0 0 0 0.79 0.91 0.24 0.37 0.23 0.21 Zenotech Laboratories Ltd. 0 0 0 0 0 0 0 0.85 1.07 0.52 0.27 0.17 0.24 Resonance Specialties Ltd. 0.03 0.03 0.02 0.05 0.05 0.05 0.07 0.09 0.09 0.25 0.19 0.11 0.09 Novartis India Ltd. 0 0 0 0 0 0 0 0.19 0.06 0.03 0.04 0.05 0.03 Vista Pharmaceuticals Ltd. 0 0 0 0 0 0 0 0 0 0 0 0.01 0.00 Kerala Ayurveda Ltd. 0.02 0.01 0.02 0.02 0.01 0.02 0.02 0.03 0.01 0.05 0.32 0.8 0.11 Wanbury Ltd. 0 0 0 0 0 0 0 1.19 0.37 1.27 1.28 0.95 0.42 Fermenta Biotech Ltd. 0 0 0 0 0 0 0.24 0.2 0.36 0.52 0.38 0.68 0.20 Themis Medicare Ltd. 0 0 0 0 0 0 0 0.42 0.38 0.27 0.63 0.4 0.18 Capsugel Healthcare Ltd. 0.01 0 0.01 0.01 0.01 0 0 0 0 0 0 0 0.00
IJSER

International Journal of Scientific & Engineering Research, Volume 5, Issue 10, October-2014 859 ISSN 2229-5518
IJSER © 2014 http://www.ijser.org
Source: Centre for Monitoring Indian Economy (CMIE), Prowess
Table 4.3: Export Performance of Indian Pharmaceutical Companies (US$ Million)
Name of the companies Mar-01 Mar-02 Mar-03 Mar-04 Mar-05 Mar-06 Mar-07 Mar-08 Mar-09 Mar-10 Mar-11 Mar-12 CGR Average
Share
Hester Biosciences Ltd. 0 0 0.05 0.02 0.04 0.07 0.05 0.17 0.13 0.17 0.73 0.58 14.17 0.01 Gujarat Themis Biosyn Ltd. 2.48 0.57 0.43 0.12 0.11 0.34 0.37 0 0 0 0 0 7.49 0.1 Ranbaxy Laboratories Ltd. 161.05 218.1 395.08 536.87 546.8 493.99 587.61 641.53 555.07 600.36 761.6 1039.12 11.32 45.69 Cipla Ltd. 57.11 101.92 120.26 192.54 250.57 349.63 421.78 558.8 577.8 671.31 759.34 739.54 12.61 28.17 Sanofi India Ltd. 9.63 21.46 26.58 32.73 45.7 48.68 49.47 42.28 42.25 48.92 46.11 42.63 11.05 3.36
GlaxoSmithKline Pharmaceuticals Ltd. 15.46 15.8 13.87 8.58 8.5 9.77 12.45 20.06 19.46 25.39 23.51 14.83 10.51 1.72 Merck Ltd. 3.72 2.7 2.71 4.09 3.27 3.54 3.93 5.02 6.17 11.22 10.41 10.26 11.37 0.49
AstraZeneca Pharma Ltd. 0.04 0 0.3 0.48 0.82 0.82 1.4 2.24 4.7 6.15 10.52 9.75 16.32 0.16
Pfizer Ltd. 3.05 4.1 4.63 5.95 5.33 5.9 6.36 5.6 4.69 5.5 8.47 4.39 10.38 0.54
Resonance Specialties Ltd. 0.84 0.36 0.35 0.16 0.03 0.01 0.36 0.08 0.06 0.07 1.37 2.81 10.56 0.06
Novartis India Ltd. 2.95 1.14 1.14 1.74 2.13 0.85 0.86 1.04 1.32 1.22 1.17 1.18 9.56 0.2 Abbott India Ltd. 0.7 0.35 0.33 0.45 0.61 0.73 0.72 0.88 0.89 0.94 1.65 1.12 11.14 0.07 Vista Pharmaceuticals Ltd. 0.33 0.22 0.29 0.25 0.23 0.23 0.25 0.25 0.36 0.18 1.26 0.72 10.84 0.04
Wyeth Ltd. 6.03 7.43 5.26 5.25 0.02 0.05 0.29 1.75 0.16 0.13 0.62 0.15 7.27 0.47 Zenotech Laboratories Ltd. 0 0 0 0.1 0 0.27 0.22 0.04 0.08 0.02 0.02 0 6.74 0.01
Kerala Ayurveda Ltd. 0.22 0.26 0 0.18 0.29 0.24 0.19 0.8 0.19 0.15 0.2 0.13 9.65 0.03
Mylan Laboratories Ltd. 0.98 1.97 59.11 66.11 77.04 87.74 113.44 151.75 238.96 337.87 520.65 679.04 16.49 10.82
Biocon Ltd. 5.87 9.73 22.74 66.74 86.11 80.66 108.16 129.46 92.09 109.12 153.41 134.47 12.92 5.81
Wanbury Ltd. 0.15 1.77 3.24 5.18 6.25 13.23 17.42 40.91 17.08 30.64 26.69 30.34 14.71 1.01
Fermenta Biotech Ltd. 1.25 1.51 0.89 0.67 1.62 3.9 4.26 5.38 4.39 7.5 9.86 15.54 12.89 0.32 Themis Medicare Ltd. 2.16 2.11 1.99 5.3 9.44 8.29 16.85 21.85 14.39 16.09 17.96 13.2 12.42 0.79 Capsugel Healthcare Ltd. 0.71 1.18 1.59 1.91 2.66 2.24 1.96 1.18 1.51 0.88 0.35 1.24 9.57 0.16
IJSER

International Journal of Scientific & Engineering Research, Volume 5, Issue 10, October-2014 860 ISSN 2229-5518
IJSER © 2014 http://www.ijser.org
Impact on Medicine Prices With the emergence of new patent act the producers intensified development of innovative new drugs, which has increased the profitability for MNCs. This increase profitability of MNCs forces Indian Pharmaceutical players to focus on R&D. It is observed that the increase in “appropriation rates” from R&D can lead to a greater supply of innovations. This lowered prices of innovations. As a consequence producers of consumption goods can offer goods at lower prices (Department of Pharmaceuticals Annual Report 2011-12). 5. CONCLUSION Analysis of the study indicates that among the exports of high technology products, the country has the highest share in pharmaceutical sector from 1991 to 2012. The study shows that USA is the top most destinations of India’s pharmaceutical exports followed by Russian Federation. Commodity wise analysis of India’s pharmaceutical exports with USA indicates that India has the highest share in the exports of product ‘Antibiotic n.e.s retail followed by ‘Penicillin/strept retail’ ‘Similarly, in case of Russia, India has the highest average share in the export of ‘Antibiotic n.e.s retail’ followed by ‘Antisera/blood fracture/vaccine’ Results show that value of intra-industry trade between India and US is the highest for ‘Hormones n.e.s retail’ throughout the study period. It has maintained its position throughout study period as its intra industry trade index has been found maximum in many years. The study claimed that India has higher revealed comparative advantage in pharmaceutical exports with USA and Russia. The 2005 Indian Amendment Act of Patent brings its pharmaceutical sector into the WTO-TRIPs agreement. After this Act of 2005 Indian drugs markers can no longer manufacture and market reverse-engineered of drugs patented by foreign drug producers. To replace sales lost to TRIPs action, many Indian leading pharmaceutical producers have increased their exports of generic drugs to the United States, Russia and Western European and
entered into research and development agreements with foreign pharmaceutical firms. After 2005, Indian leading drug companies recognized that they could not survive as global players without significant R&D capabilities. They started to increase expenditure in R&D resulting increase in the production as well as exports of pharmaceutical products. The pharmaceuticals sector, where India has emerged as the most reliable supplier of quality generic drugs to Russia, has potential for further cooperation. Under Pharma 2020 programme of the Russian Government which aims at developing domestic production base, leading Indian Pharma companies have started engaging with Russian partners to consider possibilities of joint investments. Thus it is clear that introduction of TRIPS Agreement, which mainly concerns product patents, has increased the length of patent to twenty years and affected India’s pharmaceutical sectors. Under Indian Patent Act of 1970, product patents were not allowed for pharmaceutical products, agricultural products, food products and any kind of chemical products. It seems from the preceding sections that grant of intellectual property rights for an invention is absolutely necessary in the domain of pharmaceutical sector. Though it creates a short term monopoly and loss in social welfare, but the long term benefits are enormous. Secondly, the idea of making India compliant with TRIPS policy thereby attracting more foreign direct investment or multi-national corporations in this sector, needs to be looked into carefully. According to Das, India is a net exporter of pharmaceutical products, mainly generic versions with an export growth rate of around 4.5 to 5 percent and import growth rate of around 0.7 percent during 2010-2011. So this sector needs proper regulation so that it can improve India’s balance of payment situation. Lastly, Indian pharmaceutical sector needs to be a highly regulated sector not only in terms of price and quantity, but also in the way it functions.
Bibliography Agarwal, P., & Saibaba, P. (2001). TRIPS and India’s Pharmaceuticals Industry. Economic and Political Weekly, 3787-3790. Balassa, B. (1965). Trade liberalization and “revealed” comparative advantage1. The Manchester School, 33(2), 99-123. Correa, C. M. (2000). Intellectual property rights, the WTO and developing countries: The TRIPS agreement and policy options. Zed books. Dennis, A. (2007). Trade costs, barriers to entry, and export diversification in developing countries (Vol. 4368). World Bank Publications.
Deolalikar, A. B., & Evenson, R. E (1989). Technology production and technology purchase in Indian industry: An econometric analysis. The Review of Economics and Statistics, 71(4), 689-92. Eaton, J., & Kortum, S. (2001). Technology, trade, and growth: A unified framework. European Economic Review, 45(4), 742-755. Falk, M. (2009). High-tech exports and economic growth in industrialized countries. Applied Economics Letters, 16(10), 1025-1028. Fan, J. P., Wong, T. J., & Zhang, T. (2007). Politically connected CEOs, corporate governance, and Post-IPO performance of China's newly partially privatized firms. Journal of Financial Economics, 84(2), 330-357.
IJSER

International Journal of Scientific & Engineering Research, Volume 5, Issue 10, October-2014 861 ISSN 2229-5518
IJSER © 2014 http://www.ijser.org
Fu, D., Wu, Y., & Tang, Y. (2010). Does innovation matter for Chinese high tech exports? A firm-level analysis, 1-44. Greene, W. (2007). The emergence of India's pharmaceutical industry and implications for the US generic drug market. US International Trade Commission, Office of Economics. Kiran, R., & Mishra, S. (2011). Research and Development, Exports and Patenting in the Indian Pharmaceutical Industry: A Post TRIPS Analysis. Eurasian Journal of Business and Economics, 4(7), 53-67. Kumar, N., & Pradhan, J. P. (2003). Economic reforms, WTO and Indian drugs and pharmaceuticals industry: Implications of emerging trends. CMDR Monograph Series, (42). LELIO IAPADRE, P. (2001). Measuring International Specialization, 7(3), 173-183. Ministry of Chemicals and Fertilizers, Department of Pharmaceuticals Annual Report 2011-12. Nair, G. G. (2008). Impact of TRIPS on Indian pharmaceutical industry. Journal of Intellectual Property Rights, 13(5), 432-441. Nayak, S., Aggarwal, V., & Mann, P. (2013). India’s Manufacturing Exports Dynamics: An Analysis of Technology Intensity Transition. Growth of Indian Pharmaceutical Industry: Impact of Indian, US and European Patent Laws and Regulatory Requirements. OECD, Science Technology and Industry Scoreboard, 2001. Pohit, S., & Basu, S. (2012). High Technology Merchandise Exports: Where does India Stand? South Asia Economic Journal, 13(2), 183-206.
Prasad, H. A. C. & Bhat, S. (1993). Strengthening India's Patent System Implications for Pharmaceutical Sector. Economic and Political Weekly, 28(21), 1037-1058. Sahoo, P., Rai, D. K., & Kumar, R. (2009). India-Korea Trade and Investment Relations. Indian Council for Research on International Economic Relations. Samen, S. (2010). ‘A Primer on Export Diversification: Key Concepts, Theoretical Underpinnings and Empirical Evidence’, Growth and Crisis Unit World Bank Institute. Spulber, D. F. (2008). Entrepreneurs in the Theory of the Firm. In prepared for presentation at the AEA Annual Meetings, New Orleans. Srholec, M. (2007). High-tech exports from developing countries: A symptom of technology spurts or statistical illusion? Review of World Economics, 143(2), 227-255. Stone, J. A., & Lee, H. H. (1995). Determinants of intra-industry trade: A longitudinal, cross-country analysis. Weltwirtschaftliches Archiv, 131(1), 67-85. Tebaldi, E. (2011). The Determinants of High-Technology Exports: A Panel Data Analysis. Atlantic Economic Journal, 39(4), 343-353. Wana Ismail, N. (2013). Innovation and High-Tech Trade in Asian Countries. International conference on recent developments in Asian trade policy and integration, 1-19. WITS COMTRADE Database, 2013. https://wits.worldbank.org/
IJSER