Embed Size (px)
Citation preview

Technology Demonstrations Project:
Environmental Impact Benefits with “TX Active” Concrete Pavement in Missouri DOT Two-Lift Highway Construction Demonstration
Final Report I October 2012
Sponsored throughFederal Highway Administration (DTFH-61-06-H-00011 (Work Plan 22))
About the National CP Tech Center
The mission of the National Concrete Pavement Technology Center is to unite key transportation stakeholders around the central goal of advancing concrete pavement technology through research, tech transfer, and technology implementation.
Disclaimer Notice
The contents of this report reflect the views of the authors, who are responsible for the facts and the accuracy of the information presented herein. The opinions, findings and conclusions expressed in this publication are those of the authors and not necessarily those of the sponsors.
The sponsors assume no liability for the contents or use of the information contained in this document. This report does not constitute a standard, specification, or regulation.
The sponsors do not endorse products or manufacturers. Trademarks or manufacturers’ names appear in this report only because they are considered essential to the objective of the document.
Non-Discrimination Statement
Iowa State University does not discriminate on the basis of race, color, age, religion, national origin, sexual orientation, gender identity, genetic information, sex, marital status, disability, or status as a U.S. veteran. Inquiries can be directed to the Director of Equal Opportunity and Compliance, 3280 Beardshear Hall, (515) 294-7612.

Technical Report Documentation Page
1. Report No. 2. Government Accession No. 3. Recipients Catalog No.
DTFH61-06-H-00011 Work Plan 22
4. Title and Subtitle 5. Report Date
Technology Demonstrations Project:
Environmental Impact Benefits with “TX Active” Concrete Pavement in Missouri
DOT Two-Lift Highway Construction Demonstration
October 2012
6. Performing Organization Code
7. Author(s) 8. Performing Organization Report No.
Tom Cackler, James Alleman, John Kevern, and Joel Sikkema
9. Performing Organization Name and Address 10. Work Unit No. (TRAIS)
National Concrete Pavement Technology Center
Iowa State University
2711 South Loop Drive, Suite 4700
Ames, IA 50010-8664
11. Contract or Grant No.
12. Sponsoring Organization Name and Address 13. Type of Report and Period Covered
Federal Highway Administration
U.S. Department of Transportation
1200 New Jersey Avenue SE
Washington, DC 20590
Final Report I
14. Sponsoring Agency Code
DTFH61-06-H-00011 Work Plan 22
15. Supplementary Notes
Visit www.cptechcenter.org for color PDF files of this and other research reports.
16. Abstract
This research effort evaluated the environmental impacts and benefits obtained from concrete paving materials blended with photo-
chemically-active titanium dioxide (TiO2). The project was completed in combination with a full-scale Missouri Department of
Transportation (MoDOT) two-lift paving demonstration project in the St. Louis, Missouri urban area. Two innovative photo-catalytic
concrete paving materials have been studied during this project, including: a) a photocatalytic concrete mainline pavement and b) a
photocatalytic pervious concrete shoulder pavement. The mainline pavement material was applied using a two-lift paving strategy,
where the lower, base-level layer was constructed with less expensive materials (e.g., a low cementitious-content base lift), and the
thinner top wearing course was then overlaid immediately with concrete containing photocatalytically active cement. The included
photocatalytic concrete paving material is marketed under the trade-name TX Active. The second shoulder pavement element involved a
similar, photocatalytic concrete material also containing the titanium dioxide additive, although in this instance the TiO2 was blended
into a pervious (rather than conventional) concrete for the roadside shoulder pavement material. Together, this set of innovative
mainline and shoulder paving materials, including both a two-lift photocatalytic mainline pavement and a photocatalytic pervious
shoulder pavement, is believed to represent one of the most technically advanced and environmentally-friendly concrete pavement
systems ever employed in the US. Field-scale assessment of this innovative highway involved both passive and active air quality NO
and NO2 testing, respectively using integrative Ogawa samplers and a 2B Technologies ozone titration analyzer. This field-scale
assessment also involves water-quality testing of mainline and shoulder pavement runoff.
17. Key Words 18. Distribution Statement
No restrictions.
19. Security Classification (of this
report)
20. Security Classification (of this
page)
21. No. of Pages 22. Price
Unclassified. Unclassified. 117 NA
Form DOT F 1700.7 (8-72) Reproduction of completed page authorized


TECHNOLOGY DEMONSTRATIONS PROJECT:
ENVIRONMENTAL IMPACT BENEFITS WITH
“TX ACTIVE” CONCRETE PAVEMENT
IN MISSOURI DOT TWO-LIFT
HIGHWAY CONSTRUCTION DEMONSTRATION
Final Report I
October 2012
Principal Investigators
Tom Cackler
James Alleman
John Kevern
Authors
Tom Cackler, James Alleman, John Kevern, and Joel Sikkema
Sponsored by
The Federal Highway Administration
DTFH-61-06-H-00011 (Work Plan 22)
A report from
National Concrete Pavement Technology Center
Iowa State University
2711 South Loop Drive, Suite 4700
Ames, IA 50010-8664
Phone: 515-294-8103
Fax: 515-294-0467
www.cptechcenter.org

v
TABLE OF CONTENTS
ACKNOWLEDGMENTS ............................................................................................................. xi
EXECUTIVE SUMMARY ......................................................................................................... xiii
General Synopsis ............................................................................................................. xiii
Air Quality Testing .......................................................................................................... xiv Water Quality Testing ........................................................................................................xv Pavement Coupon Testing ............................................................................................... xvi Additional Complementary Site and Meteorological Testing ......................................... xvi Upcoming Project Activity ............................................................................................. xvii
OVERVIEW OF UNIQUE RESEARCH PROJECT FEATURES .................................................1
PROJECT GOALS ..........................................................................................................................3
BACKGROUND .............................................................................................................................4
LITERATURE REVIEW ................................................................................................................7
Laboratory Evaluation of Photocatalytic Pavements .........................................................14 Environmental Variables ...................................................................................................18
Operational Variables Impacting Photocatalytic TX Active Performance ........................22 Combined Effects of Variables ..........................................................................................24 Field Evaluation of Photocatalytic Pavements ..................................................................24
Field Measurement of NO3- Deposition .............................................................................27
Modeling Efforts to Predict Field Observations ................................................................28
Research Gaps ....................................................................................................................29
Pervious Concrete Pavement .............................................................................................29
Global Breakdown of Academic and Industrial Research Activity Locations ..................30
MATERIALS AND METHODS ...................................................................................................33
General Site Location Details ............................................................................................33 Conventional Concrete Mixture Proportions .....................................................................35 Pervious Concrete Mixture Proportioning .........................................................................36 Specific Details with Field-Scale Air Sampling, Instrumentation, and Analyses .............38
Specific Details with Bench-Scale Air Sampling, Instrumentation, and Analyses ...........42 Experimental Apparatus.....................................................................................................42 Analysis of Bench-Scale Sample Specimens Using Scanning Electron Microscope-
Energy Dispersive Spectroscopy .......................................................................................45 Specific Details with Field-Scale Water Quality Instrumentation and Analyses ..............47
Additional Site Meteorological Testing .............................................................................51 Pavement Coupon Sampling and Analyses .......................................................................52
CONSTRUCTION CHRONOLOGY AND HIGHLIGHTS .........................................................54
October 24, 2011 ................................................................................................................54 November 1, 2011 ..............................................................................................................57 Winter 2011-2012 ..............................................................................................................57 Spring 2012 ........................................................................................................................57
vi
July 14, 2012 ......................................................................................................................57
EXPERIMENTAL RESULTS.......................................................................................................60
Materials Characterization .................................................................................................60 Bench-Scale Assessment of Pervious Concrete Air Quality Reactivity ............................61
Field Water Quality Testing...............................................................................................64 Traffic Safety Management ...............................................................................................70 Field-Scale Air Quality Testing .........................................................................................70 Urban Heat Island Testing .................................................................................................79
SUMMARY ...................................................................................................................................83
Appendices .........................................................................................................................84
REFERENCES ..............................................................................................................................85
APPENDIX A ................................................................................................................................93
APPENDIX B ................................................................................................................................97
vii
LIST OF FIGURES
Figure 1. Qualitative Schematic of Photocatalytic Oxidation of NO and NO2 by Concrete
Pavement Containing TiO2.............................................................................................. xiii Figure 2. Jubilee Church in Rome, Italy (http://students.egfi-k12.org/wp-
content/uploads/2009/10/jubilee11.jpg)...............................................................................4 Figure 3. Water-symbol pylons mounted on the new I-35 bridge in Minneapolis, Minnesota
(http://minnesota.publicradio.org/display/web/2008/09/24/substantial_completion/?refid=
0) ..........................................................................................................................................4 Figure 4. Qualitative Schematic of NOx Photocatalytic Oxidation and Removal at Varying
Heights Above TX Active Pavement (Reference: Rousseau, et al., 2009) ..........................5 Figure 5. Photocatalytic oxidation of NO and NO2 by concrete pavement containing TiO2 ........11 Figure 6. Photocatalytic oxidation steps (Adapted from Tompkins et al., 2005) ..........................13
Figure 7. Schematic of experimental apparatus (adapted from ISO, 2007). ..................................15 Figure 8. US research activity with photocatalytic concrete pavement .........................................31 Figure 9. Non-US research activity with photocatalytic concrete pavement .................................32
Figure 10. General Highway 141 project siting overview at St. Louis, Missouri .........................33 Figure 11. NO2 levels as a function of distance to roadway and total vehicle density. Note:
concentration was measured in µg/m3 not Hg/m3. (Adapted from data reported by Cape
et al. 2004) (HEI, 2009) .....................................................................................................34 Figure 12. Highway 141 design profile view.................................................................................34
Figure 13. Southbound Highway 141 perspective immediately after access ramp from Oliver
Road (Rt 340) .....................................................................................................................35 Figure 14. Impervious concrete aggregate gradations ...................................................................36
Figure 15. Potential and selected aggregate gradations .................................................................37 Figure 16. Ogawa sampler .............................................................................................................39
Figure 17. Ogawa sampler with protective shroud ........................................................................39 Figure 18. Ogawa analyzers mounted on adjacent crash barrier wall (i.e., including three upper
and three lower samplers per each location) ......................................................................40 Figure 19. Upper (~100 cm height) and lower (~30 cm height) Ogawa sample unit layout per
each test location ................................................................................................................40 Figure 20. On-site use of Active NOx 2B Technologies tnstrumentation .....................................41 Figure 21. Diagram of experimental apparatus (adapted) .............................................................43 Figure 22. Representative results from experimental bench-scale testing of photocatalytic mortar
specimens ...........................................................................................................................44 Figure 23. Collection and monitoring for TX Active section, representative of both sections (not
to scale) ..............................................................................................................................47 Figure 24. Typical trench drain section (not to scale) ...................................................................48
Figure 25. Polycast trench drain information ................................................................................48 Figure 26. Pervious concrete shoulder collection and monitoring (not to scale) ...........................49 Figure 27. TX Active testing layout ..............................................................................................49
Figure 28. Sensor vault and temporary weather station installation ..............................................51 Figure 29. Paving overview with top TX Active layer in foreground ..........................................52 Figure 30. Paving overview with top TX Active layer in foreground ...........................................55 Figure 31. Initial placement of TX Active mix ahead of Gomaco paver ......................................55 Figure 32. Dr. John Kevern (University of Missouri – Kansas City) collecting TX Active mix

viii
samples ...............................................................................................................................56
Figure 33. Jim Grove – FHWA Office of Pavement Technology .................................................56 Figure 34. Jim Grove – FHWA Office of Pavement Technology .................................................56 Figure 35. Operating Highway 141 perspective along southbound Olive Road ramp ..................58
Figure 36. Operating Highway 141 perspective within TX Active paving zone and showing
adjacent crash barrier and sound wall ................................................................................58 Figure 37. Highway 141 Opening Day festivities (July 14, 2012: S.K. Ong) ...............................59 Figure 38. Demonstration of self-cleaning ability .........................................................................61 Figure 39. Self-cleaning ability as measured by rodamine red degredation ..................................61
Figure 40. Pollutant Removal Ability ............................................................................................62 Figure 41. Pressure transducer placement in weir box ..................................................................64 Figure 42. Pressure transducer placement in weir box ..................................................................65 Figure 43. Weir box lab testing......................................................................................................65
Figure 44. Weir box calibration results ..........................................................................................66 Figure 45. Plan view of weir box locations (not to scale) .............................................................66
Figure 46. Base for weir box..........................................................................................................67 Figure 47. Weir box with base and supports..................................................................................67 Figure 48. Final locations of weir boxes in the control section .....................................................67
Figure 49. Final locations of weir boxes in the TX Active section ...............................................68 Figure 50. Two-gallon automated water sampler ..........................................................................68
Figure 51. Two one-gallon automated samplers ............................................................................69 Figure 52. Perforated stand pipe within aggregate base showing pressure sensor and
thermocouple wires ............................................................................................................69
Figure 53. Traffic safety in place during sampling with truck-mounted TMA .............................70 Figure 54. Traffic safety in place during sampling ........................................................................70
Figure 55. Ogawa sample collection underway .............................................................................71
Figure 56. Ogawa sampling results at lower 30 cm height for May 14, 2012 to June 14, 2012 ...71
Figure 57. Ogawa sampling results at lower 30 cm height for June 14, 2012 to July 13, 2012 ....72 Figure 58. Ogawa sampling results at lower 30 cm height for July 13, 2012 to August 1, 2012 ..72
Figure 59. Ogawa sampling results at upper 100 cm height for July 13, 2012 to August 1, 2012 73 Figure 60. Ogawa sampling results at upper 100 cm height for August 1, 2012 to August 14,
2012....................................................................................................................................73 Figure 61. Ogawa sampling results at upper 100 cm height for August 1, 2012 to August 14,
2012....................................................................................................................................74 Figure 62. Coupon placement at both paved shoulder (nine each) and top of crash barrier
locations (nine each) ..........................................................................................................76 Figure 63. Coupon placement at both paved shoulder (nine each) and top of crash barrier
(another nine each) locations .............................................................................................77
Figure 64. Closeup of coupon samples removed from paved shoulder locations .........................77
Figure 65. Coupon sample collection underway showing open pavement coupon mounting hole
with accompanying mounting bolt.....................................................................................78 Figure 66. View of embedded coupon holder with mounting bolt ................................................78 Figure 67. Preservative foil wrapping of coupon samples .............................................................79 Figure 68. Tipping bucket rain gauge (left) and weather station (right) ........................................80 Figure 69. Cross section of TX Active section with locations of thermocouple wires, denoted by
X (not to scale) ...................................................................................................................81

ix
Figure 70. Cross section of TX Active section with locations of thermocouple wires, denoted by
X (not to scale) ...................................................................................................................81 Figure 71. Albedometer used for initial reflectance measurements ..............................................82
x
LIST OF TABLES
Table 1. Emissions and TiO2-based photocatalytic reactions for mobile source pollutant
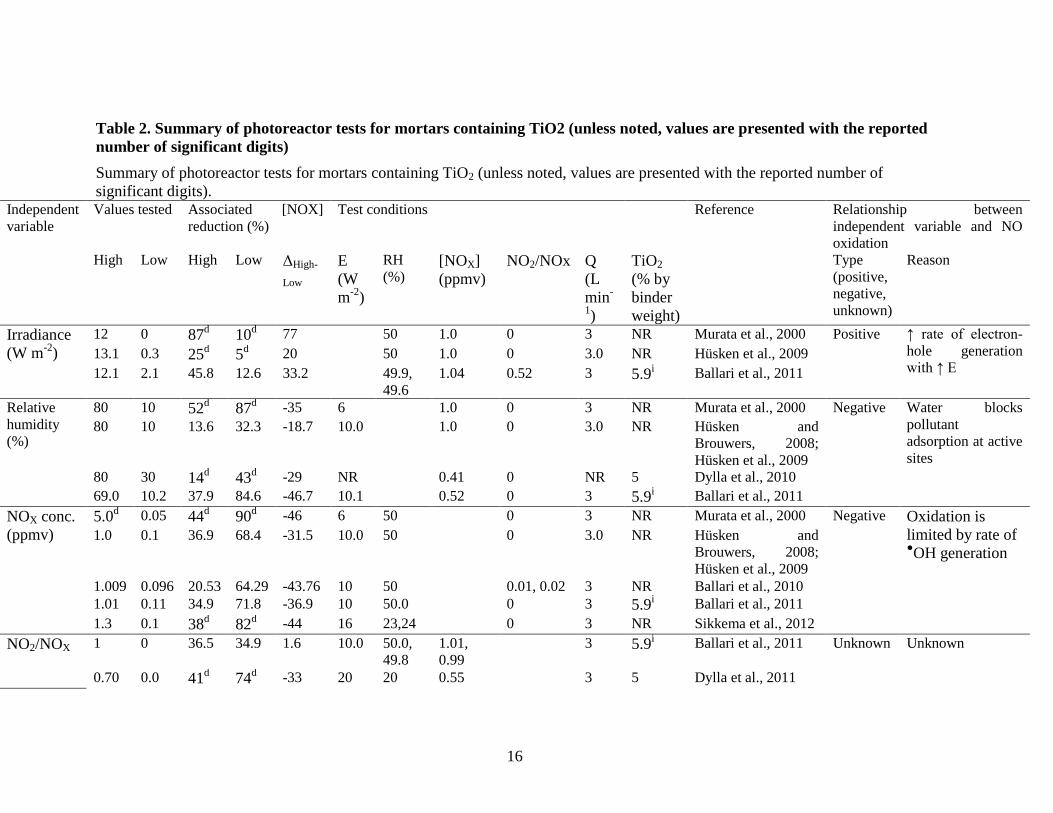
indicators ............................................................................................................................12 Table 2. Summary of photoreactor tests for mortars containing TiO2 (unless noted, values are
presented with the reported number of significant digits) .................................................16 Table 3. Locations of field comparison of photocatalytic and control sections ............................25 Table 4. Locations of other photocatalytic pavement field studies ...............................................26 Table 5. Concrete mixture proportions ..........................................................................................36 Table 6. Selected pervious concrete mixture proportions ..............................................................38
Table 7. Synopsis of bench-scale photoreactor research tests .......................................................46 Table 8. Hardened testing results ...................................................................................................60 Table 9. Narrative summary of Ogawa results recorded from May 14, 2012 through August 14,
2012....................................................................................................................................74 Table 10. Albedometer measurements ...........................................................................................82

xi
Acknowledgments
This research activity was jointly funded by the following sponsors:
- Federal US: Federal Highway Administration (FHWA)
- State: Missouri Department of Transportation (MoDOT)
- Academic: National Center for Concrete Paving Technology (Iowa State University)
- Industry: Essroc/Italcementi Group
- Industry: Lehigh Hanson/HeidelbergCement Group
In addition, the following organizations and agencies provided significant in-kind
complementary support in regards to construction assistance, technical guidance,
instrumentation, sample collection, and site traffic plus general safety control:
- Fred Weber, Inc.
- Missouri Department of Natural Resources
- Iowa Department of Transportation (IADOT)
- Portland Cement Association (PCA)
- Iowa Concrete Paving Association (ICPA)
- US Environmental Protection Agency
- 2B Technologies, Inc.
Overall, this project represents an extensive effort by many partners whose synergistic
contributions were greatly appreciated.


xiii
EXECUTIVE SUMMARY
General Synopsis
This research effort was developed to evaluate and establish the environmental impacts, and
projected benefits, obtained from concrete paving materials blended with photo-chemically-
active titanium dioxide (TiO2). The project was completed in combination with a full-scale
Missouri Department of Transportation (MoDOT) two-lift paving demonstration project in the
St. Louis, Missouri urban area.
Two innovative photo-catalytic concrete paving materials have been studied during this project,
including the following:
A photocatalytic concrete mainline pavement
A photocatalytic pervious concrete shoulder pavement
The first such mainline pavement material was applied using a two-lift paving strategy, where
the lower, base-level layer was constructed with less expensive materials (e.g., a low
cementitious-content base lift), and the thinner top wearing course was then overlaid
immediately with concrete containing photocatalytically active cement. The included
photocatalytic concrete paving material is marketed under the trade-name, TX Active (Figure 1).
Figure 1. Qualitative Schematic of Photocatalytic Oxidation of NO and NO2 by Concrete
Pavement Containing TiO2
The second shoulder pavement element of this research effort involved a similar, photocatalytic
concrete material also containing the titanium dioxide additive, although, in this instance, the
TX Active
Pavement
Environmental
Assessment Weather Station
With TX Active
Without TX Active
Active Ozone-Titration Air Sampler
Passive Ogawa Air Samplers
• Demonstration evaluation of TX Active drive lanes and pervious concrete shoulder environmental (air & water) beneficial impacts
• Storm runoff event water quality testing throughout an 18-month test period
• Long-term air quality testing using Ogawa time-integrated passive NO2 analysis during an 18-month test period
• Complementary short-term air quality NO2 testing using active/real-time ozone titration method
Runoff Water Collection System

xiv
TiO2 was blended into a pervious (rather than conventional) concrete for the roadside shoulder
pavement material. Together, this set of innovative mainline and shoulder paving materials,
including both a two-lift photocatalytic mainline pavement and a photocatalytic pervious
shoulder pavement, is believed to represent one of the most technically advanced and
environmentally-friendly concrete pavement systems ever employed in the US.
Our research efforts accordingly focused on two complementary environmental research aspects
connected with the use and behavior of these innovative materials, including both air-quality and
water-quality benefits observed with this full-scale photocatalytic concrete paving study. In both
cases, physically adjacent control paving sections (sections without the TiO2 present) were
similarly instrumented and tested for direct quantitative comparison between the observed air-
and water-quality levels.
In terms of the projects activity timeline, construction of the highway was begun during the
Summer of 2011 and completed in the following Summer of 2012. Public access to the highway
was allowed on July 14, 2012. Continuous passive gas-phase testing (using Ogawa analyzers) of
nitrogen oxide levels was completed for two months prior to the opening of the road. As such, as
of this reports date in late August 2012, the highway has been in use for approximately one
month. The existing field results presented within this Final Report I will consequently be further
validated using continued air- and water-quality monitoring extending over the coming year
(e.g., from September 2012 through August 2013). The associated details with the involved air-
and water-quality testing efforts are explained in the following sections.
Air Quality Testing
This testing effort was intended evaluate the abatement of vehicle nitrogen dioxide (NO2)
emissions in relation to a photo-catalytically-induced TiO2 conversion. Prior laboratory and real-
world studies on a limited, full-scale mainline paving, based outside the US, primarily with TiO2
pavers have been completed and show that the presence of the photo-reactive titanium dioxide
catalyst provides for the beneficial oxidation of nitrogen dioxide (e.g,. Cassar, 1997; Murata,
1999; Cassar et al., 1999a and b; Ehses, et al., 2001; Cassar, et al., 2003; Lackoff, 2003;
Beeldens, 2004; Vallee, et al., 2004; Bygott, et al., 2007; Gignoux, 2010; Guerrini, et al., 2010).
Prior atmospheric near-road NO2 testing has shown significant reduction, at levels reported to be
40 to 50%. This conversion is expected to subsequently create a nitrate product which physically
adsorbs to the pavement, and which is then washed off during rainfall, snowmelt, etc. periods as
a liquid-phase runoff residual.
An underlying regulatory motivation for this study is that the US EPAs National Ambient Air
Quality Standard (NAAQS) for nitrogen dioxide has been recently changed, adding a new one-
hour 100 ppb standard in addition to the previously established 53 ppb annual requirement. This
change reflects escalating USEPA concerns related to individuals challenged with elevated
exposures in near-road environments. Residents living near highways, students studying in
schools near highways, etc., can experience short- or even long-term NO2 exposures
considerably higher than encountered by at-large community populations. At-risk individuals
within this environment include those with asthma as well as children and elderly residents with

xv
diminished respiratory capacity. A related regulatory requirement of this latter change will also
be that near-road nitrogen dioxide levels must be measured starting this coming January 2013 in
large urban areas (e.g., greater than 500,000 populations) to confirm NAAQS compliance.
Therefore, our overall study was intended to validate these TiO2-derived benefits here in the US,
in relation to an overarching new motivation to reduce vehicle NO2 emission levels in urban
highway environments subject to high-level annual daily traffic levels.
Two different methods were used to measure on-site atmospheric NO2 levels, including one
active and one passive procedure. The passive strategy involved an Ogawa procedure where a
chemical complexing agent, triethanolamine (TEA) sorbs NO2 from the near-road air zone on an
extended, time-integrative timeframe (e.g., covering time periods between one and seven days).
Ogawa testing is conducted at both the conventional and TX Active pavement zones, and these
results represent our primary tool for measuring changes in NO2 removal between the TX Active
and control testing sites.
For the purposes of this project, our hypothesis with planning the involved air quality testing
effort has been that Ogawa passive testing would both be more appropriate given the methods
analytically integrative strategy, as well as the fact that the Ogawa method is considerably more
affordable over the extended timeframe of our extended testing period (i.e., compared to a more
sophisticated, and far more complicated, active chemiluminescent testing approach).
Our second, active analytical method for on-site NO2 testing involved a newly developed testing
protocol recommended for this study by the US EPAs Rich Baldauf (Baldauf, 2011). By
comparison, prior real-world TX Active performance testing has traditionally focused on the use
of yet another active, chemiluminescent testing protocol, which has been the method-of-choice
for prior testing studies of near-road NO2 levels.
Our projects innovative strategy, however, is based on the use of a new continuous ozone-
titration method, where the depletion of ozone by total NO is determined using UV absorbance.
Total NOx testing with this instrument is made possible by using a heated molybdenum pre-
processing converter, which oxidizes NO2 to NO, and a cyclic pumping scheme that sequentially
switches between NOx and NO testing. Further details regarding this “active” method can be
found at www.twobtech.com/.
Water Quality Testing
This testing effort is intended to determine whether the same photocatalytic mechanism for smog
reduction might further improve stormwater runoff quality by decomposing vehicle-emitted
pollutants. These compounds would predominantly be expected to include organic hydrocarbons
(e.g., engine and transmission oils) and glycol-type antifreeze contaminants. Long-term sample
collection using autosamplers for highway runoff, however, is not particularly well suited to
these compound-specific analytical goals, since hydrocarbon- and glycol-type samples tend to

xvi
degrade rather quickly. Therefore, chemical oxygen demand (COD) and dissolved organic
carbon (DOC, using filtered total organic carbon testing) are used as surrogate quality indicators.
Based on the expected NO2 to NO3- photocataylic conversion, our testing program has been
arranged to conduct nitrate tests on the runoff liquids in order to provide a secondary indication
of the aforementioned NO2 removal phenomenon in relation to air-quality benefits. This nitrate
testing establishes whether this release is taking place, or whether this nitrate product might be
more permanently adhered to the reactive concrete paving materials.
Our chronological plan for these water-quality tests involves runoff samples taken over the
course of a ~year-long period study, using a stormwater channeling and sampling collection
system built into the pavement shoulder, and will also include parallel sets of comparative (i.e.,
with and without TiO2) sample pavement sections. In both cases, these sample contaminant
levels offer a complementary means of characterizing the circumstance of TiO2-sustained
impacts.
Pavement Coupon Testing
Bench-scale assessment of representative pavement coupon samples using the aforementioned
active ozone-titration testing method provides a means of directly determining the specific
reactivity of TX Active materials under controlled conditions. In addition, our lab testing
intermittently used parallel chemiluminescent testing to cross-validate the ozone-titration
method. This comparative testing regime, therefore, provides an overall means of validating our
confidence with using the active, ozone-titration method for on-site testing.
Removable coupons of TX Active pavement were also embedded into the surface of the highway
at the same locations at which air quality sampling is being conducted. These coupons were
removed on a chronological basis during the study and returned for subsequent lab testing (i.e.,
bench-scale analysis of specific [per area basis] NO2 reduction rates), by which the aging of, and
temporal decrease in, photocatalytic reactivity with this pavement has been measured and
tracked. Nine such coupons were placed at each of the three TX Active sampling sites along the
highway test section (i.e., for a total set of twenty-seven coupons), and two each coupon samples
are being removed and replaced at each location on a quarterly basis.
Additional Complementary Site and Meteorological Testing
This projects air- and water-quality plus sample pavement coupon testing efforts have been
complemented with an additional set of site-specific physical measurements, including traffic
makeup and density, ambient wind (i.e., speed and direction), solar radiation intensity, ambient
temperature, and pavement albedo reflectivity measurements which complement the analytical
process of quantitatively evaluating the overall data to establish the magnitude of observed
environmental benefits.

xvii
Upcoming Project Activity
Lastly, this projects air- and water-quality monitoring program extends into the upcoming
Summer 2013, by which a multi-season assessment shall have been completed. This upcoming
data and evaluation will then be disseminated with a Final Report II publication expected in late
Summer 2013.


1
OVERVIEW OF UNIQUE RESEARCH PROJECT FEATURES
This research effort has several highly unique aspects, as explained with the following narrative
overview:
Unique aspect of two-lift pavement mechanism
This project represented one of only a limited number of full-scale demonstration applications
for a two-lift paving strategy in the US (i.e., see Grove and Taylor, 2009).
Unique aspect of photocatalytic concrete mainline paving
This project also represented the first-ever full-scale pavement study of Essrocs TX Active
concrete pavement material in the US, and one of less than a handful of such full-scale studies
worldwide (e.g., with the previous most significant tests completed in Italy and France).
Yet another unique aspect of this project is that it was believed to represent one of the first ever
full-scale TX Active mainline pavement applications on a higher-speed highway, as opposed to
the prior full-scale studies (e.g., in Bergamo, Italy or the Vanves area of Paris, France) where the
road setting was situated in an inner-city, slower-speed location.
Unique aspect of photocatalytic concrete pervious shoulder paving
This project represented the first-ever full-scale demonstration application of a photocatalytic
pervious concrete shoulder-paving concept.
Unique air-quality testing aspects in relation to photocatalytic concrete pavement
This project provided full-scale air-quality results focused on the mechanism of vehicular
nitrogen dioxide emission abatement using TiO2 within the near-road environment, of which
there are fewer than a handful of similar prior worldwide tests conducted on full-scale concrete
paving sections.
This project is one of less than a handful of full-scale, let alone at any scale, by which an
assessment of nitrogen dioxide abatement via TX Active paving has been completed using a
time-integrated analytical method (i.e., via Ogawa-type passive diffusion sampling with a
triethanolamine adsorbent). Here in the US, a prior test planned for Ogawa testing was developed
by the US Army in Fort Belvoir, Virginia, but the completion of this project could not be
confirmed. Passive NOx testing was conducted in another UK study in 2007 (Bygott et al.,
2007), but in this case the tested TX Active surface was a painted, southerly facing wall surface
rather than a horizontal, far-larger surface area pavement.
Uncertainty admittedly exists within the literature regarding near-road monitoring methods and
results for highway NOx/NO2 presence and fate. However, our project was not intended to
improve understanding of short-term fluctuations. Instead, our experimental testing plan was
developed to determine the overall cumulative effectiveness of TX Active concrete relative to a
control section on a moreso long-range timeframe. Average measurements over a time period
allowed for a better correlation to control sections. Our passive samplers were believed to be

2
well-suited to this type of work and are comparable to reference methods (Hagenbjörk-
Gustafsson et al., 2009; Mukerjee et al., 2009b; Sather et al., 2007).
With understanding that our time-integrative approach represents a new strategy to monitor near-
road pollutants, our passive air measurements with Ogawa samplers are effectively verified using
a 2B Technologies Inc. active testing ozone depletion method.
Extensive parallel testing of crystalized nitrate buildup on TX Active concrete coupons is also
being conducted during this project as a direct assessment of the involved photocatalytic NO2
conversion and possible age-related reduction in photo-catalytic behavior. This research effort
also represents a first-ever assessment of this phenomenon on a TX Active pavement…to our
understanding. Nitrate buildup was, however, previously measured on a TX Active wall surface
in the UK (Bygott et al., 2007).
Unique water-quality testing aspects in relation to photocatalytic concrete pavement
This project represents the first full-scale assessment of water-quality impact benefits observed
in relation to the use of TX Active concrete paving.
This project also involved the first full-scale, let alone at any scale, assessment of runoff nitrate
levels as a confirmative indicator of air-phase NO2 conversion, sorption, and runoff release.
Unique water-quality testing aspects in relation to pervious concrete pavement This is the first time pervious concrete has been used for stormwater management on a highway.
This also is the first time an internal curing agent has been used to eliminate plastic curing of
pervious concrete.

3
PROJECT GOALS
The goals for this project were as follows:
Characterize the NO2 removal levels of the TX Active mainline and shoulder paving
materials on a direct basis relative to conventional concrete pavement…using Ogawa time-
integrated NO2 analyses over routine one-week testing periods, as well as “active” testing
using both chemiluminescent and ozone-titration analytical methods
Evaluate pavement coupon samples in the laboratory in order to ascertain baseline
performance levels, as well as measuring aging impacts on the TX Active material specimens
as tested with older coupons
Measure and ascertain the NO2 removal levels of the TX Active pavement on an indirect
basis via nitrate runoff measurements relative to conventional concrete pavement
Measure and ascertain the water-quality related improvements provided with TX Active
pavement relative to conventional concrete pavement, using COD, DOC/TOC, and TSS as
key water quality indicators within runoff liquids
Evaluate aging-related (e.g., in relation to weathering, deteriorating, etc. conditions of the TX
Active surface, etc.) and seasonal-related (e.g., relative to weather conditions, angle of
sunlight incidence, wind direction, wind speed, duration and intensity of solar radiation, etc.)
variations in the latter TX Active contaminant removal levels
Correlate the average daily traffic (ADT) levels for these test highway sections with the latter
observed results
Correlate wind speed, wind director, and ambient air temperature levels on these test
highway sections in relation to the latter observed results
Establish standard civil engineering material properties of these two-lift pavements

4
BACKGROUND
This proposed full-scale study involves the use of a concrete material marketed under the trade
name TX Active by Essroc Inc., a subsidiary of the Italcementi Group headquartered in
Belgamo, Italy.
Today, this material is used in a variety of architectural and engineering applications, ranging
from surface coat applications on churches (Figure 2), wall and roof surfaces, office buildings,
artistic structures (Figure 3), sidewalk and street pavers, to concrete pavement.
Figure 2. Jubilee Church in Rome, Italy (http://students.egfi-k12.org/wp-
content/uploads/2009/10/jubilee11.jpg)
Figure 3. Water-symbol pylons mounted on the new I-35 bridge in Minneapolis, Minnesota
(http://minnesota.publicradio.org/display/web/2008/09/24/substantial_completion/?refid=0)
The history of titanium dioxide use as a photochemical reactant in relation to environmental
contaminants originally dates back to the mid 1970s (see Fujishima and Honda, 1975), and over
the next twenty years was extensively researched (e.g., Hoffman, et al., 1995). Patents connected
with the so-called smog eating capabilities of a titanium dioxide blended concrete material
surface were secured by Italcementi in the late 1990s (see referenced Patent-Italcementi listings
for 1999, 2000, and 2004), and published observations which confirmed this phenomenon were
then reported starting around 2000 to 2003. The specific concept of using TiO2-blended concrete
materials as either pavers or mainline pavement for NO2 abatement appears to date back in terms
of publications to the early 2000s. Over the last seven to ten years the published literature on this
material has progressively escalated, with the most recent 2010 publications covering full-scale
experimental paving projects, and full-scale NO2 observations in Paris and Italy (Gignoux,
2010).

5
Full-scale TX Active applications have included both a 2,000 m2 wall and a 35,000 m
2 low
pollution pavement (Rousseau, et al., 2009a and b). Experimental NO2 removal results appear, as
shown here, have ranged from about 30% at the pavement near-surface zone to about 12% as
measured at a height of approximately two meters above the pavement.
Figure 4. Qualitative Schematic of NOx Photocatalytic Oxidation and Removal at Varying
Heights Above TX Active Pavement (Reference: Rousseau, et al., 2009)
The Environmental Protection Agency (EPA) has cited stormwater runoff as the single biggest
contributor to surface water impairment (USEPA, 2012c). The clean water act has been revised
to include non-point pollution and provide an enforcement mechanism through the National
Pollutant Discharge Elimination System (NPDES) permit process. Municipalities are
undertaking large, system-wide changes to reduce high contaminant sources such as combined
sewer overflows and inadvertent water/sewer cross connections. However, a majority of
stormwater runoff is produced from impervious rooftops and pavements. Roof-produced
stormwater is relatively clean. Pavement produced stormwater contains oils and greases,
suspended solids, and nutrients attached to the suspended solids, in addition to metal contribution
from vehicles. Since 1999 the United States has undergone a fundamental change to the way
stormwater is handled. Stormwater Best Management Practices (BMPs) are deployed on to help
reduce the overall stormwater volume and provide pollutant reduction from construction sites
and permanent infrastructure.
BMPs are loosely grouped into structural and non-structural techniques. An example of a non-
structural technique includes street cleaning. Structural techniques include small rain gardens,
large bio-retention areas, detention/retention ponds, and in-line interceptors. Structural BMPs
can provide a stormwater volume reduction or only pollutant removal. Most structural BMPs
require some additional land area for implementation, reducing site utilization. One structural
BMP category that does not reduce site utilization is permeable pavements. Permeable
pavements are pavement systems with a high permeability surface which allows rapid water
exfiltration into a subsurface detention/retention area. The volume of the detention/retention area
and residence time can be modified without affecting the surface area required. Permeable

6
pavements include pervious concrete, porous asphalt, interlocking precast pavers, and a variety
of proprietary systems.
Pervious concrete is produced by balancing voids present in poorly-graded coarse aggregates
with enough cementitious paste for adequate load-carrying capacity (Kevern et al., 2009).
Typically 20% water-permeable voids produce sufficient strength (>3000 psi, 21MPa) and
infiltration capacity (>500 in./hr, 1200 cm/hr). Strength, durability, and permeability are all
controlled by the amount of voids. High void mixtures have good permeability, but poor strength
and durability. Low permeability mixtures have good strength and durability, but can clog easily.

7
LITERATURE REVIEW
Pavement containing the photocatalyst TiO2 exhibit unique properties, which result in the
oxidation of both organic and inorganic pollutants, including NOX. These pavements can serve as
a new NOX pollution mechanism for U.S. stakeholders, thereby improving the sustainability of
the transportation sector. Photoreactor studies have determined relationships between [NOX]
reduction and the multiple environmental factors. Field monitoring has provided documentation
that the pavement causes [NOX] reduction when used in paving blocks, concrete, and spray
coatings. While the body of literature is substantial, future research must use strengthen the link
between photoreactor and field studies, determine the environmental variables with the greatest
impact on [NOX] reduction, and develop models to facilitate selection of roadways for which
maximum [NOX] reduction can be achieved.
Introduction
Titania serves as the common name for titanium dioxide (TiO2) and fictions often-used name for
the queen of the fairies. This dual meaning provides an uncanny allusion to the compounds
nearly magical photocatalytic degradation of a broad set of organic and inorganic pollutants. In
the 1960s, Akira Fujishima and Honda (1972) carried out the first research yielding the potential
for practical applications. Their study found that light (λ < 415 nm) induced a photocurrent
between TiO2 and platinum electrodes immersed in an aqueous solution, resulting in oxygen and
hydrogen evolution. Following this discovery, initial research focused on enhancements to water
decomposition and by 1977 researchers began studying environmental applications. Frank and
Bard (1977) employed TiO2 as a photocatalyst to oxidize cyanide ions, which frequently occur as
a by-product of industrial processes. In this study, a samples cyanide concentration was reduced
by up to 54% when illuminated by a xenon lamp for 30 min in the presence of TiO2. When
samples were placed in sunlight for two days in excess of 99% removal was observed. These
new findings channeled interest towards environmental applications that address aqueous and
airborne pollutants.
Photocatalytic degradation of nitrogen oxides (NOX) from on-road motor vehicles by pavement
containing TiO2 has generated a substantial amount of research interest as an environmental
application of this compound. NOX—the sum of nitric oxide (NO), nitrogen dioxide (NO2), and
other oxides of nitrogen—are produced by high-temperature combustion processes. NOX
emissions result in a variety of detrimental effects to both respiratory systems and the natural
ecosystem. In addition, NOX contribute to the formation of tropospheric ozone when reacted with
volatile organic compounds (VOCs) in the presence of sunlight (USEPA, 2011a). Although NO
accounts for approximately 95% of NOX emissions, this pollutant is freely oxidized to NO2 in the
atmosphere; therefore, United States Environmental Protection Agency (USEPA) assumes all
NOX in emissions estimates to be in the form of NO2 (USEPA, 2001). NO2 is toxic when
inhaled at high concentrations and can cause respiratory ailments (e.g., respiratory infections,
bronchitis, and emphysema) at part-per-billion by volume (ppbv) levels of exposure (USEPA,
2011b). Within the United States, on-road motor vehicles account for 34% of NO2 emissions
(USEPA, 2001) Error! Reference source not found.. An estimated 35 million people (i.e.,
more than 10% of the U.S. population) live within 100 m (300 ft) ofmajor sources of on-road

8
vehicle emissions and are exposed to elevated concentrations of NOX (Thoma et al., 2008).
Furthermore, multiple health studies have linked an increase in the observation of negative health
effects with the proximity of people to major roadways (Brauer et al., 2002; Brunekreef et al.,
1997; Finkelstein et al., 2004; Garshick et al., 2003; Kim et al., 2004).
Conventional efforts to mitigate transportation sector air pollution focus on alternative vehicles
and fuels, transportation policy, and emissions control technologies. These strategies have
reached a point where additional improvements in air quality will require novel approaches and
significant expense. Advances in photocatalytic concrete pavements provide a new pathway to
improve the sustainability of transportation by reducing the negative impacts associated with
vehicle emissions. Photocatalytic reactions cause oxidation of a variety of organic and inorganic
pollutants. Notably, the photocatalytic property of these pavements causes oxidation of NOX. To
foster research in photocatalytic degradation of motor vehicle pollution by pavement containing
titanium dioxide, the following sections examine the field and identify research needs. While
these pavements catalyze oxidation of variety of organic and inorganic pollutants, this review
places focus on reactions with NOX.
Regulatory drivers and Conventional Mitigation Strategies
Within the United States, efforts to minimize the atmospheric concentration of NOX from on-
road motor vehicles are driven by National Ambient Air Quality Standards (NAAQS) and
vehicle emissions standards. Both of these regulatory classes receive their authority from the
Clean Air Act (CAA) and subsequent amendments.
National Ambient Air Quality Standards
NO2 is one of six principal pollutants regulated by National Ambient Air Quality Standards
(NAAQS) because exposure can cause respiratory ailments (e.g., infections, bronchitis, and
emphysema). NOX also presents other environmental concerns; small particles formed by
reaction of NOX with moisture and ammonia cause lung damage and NOX represents a critical
step in formation of tropospheric ozone, yet another NAAQS criteria pollutant due to detrimental
effects to natural ecosystems and the respiratory system. VOC emissions, while not regulated by
NAAQS, are also of similar concern because NOX and VOC reactions in the presence of sunlight
generate ozone (USEPA, 2011a).
USEPA NAAQS establish primary standards, which protect public health, and secondary
standards, which protect public welfare (Clean Air Act, 42 U.S.C. § 7409(b), 2008). 2010
revisions strengthened the NAAQS for NO2 by supplementing the existing annually averaged 53
ppbv NO2 primary and secondary standard with a primary standard that designates an area as
nonattainment if the 3-year average of the 98th
percentile of the annual distribution of the daily
maximum 1-hour average NO2 concentrations exceeds 100 ppbv (Primary National Ambient Air
Quality Standards for Nitrogen Dioxide, 75 Fed. Reg. 6474, 2010).
9
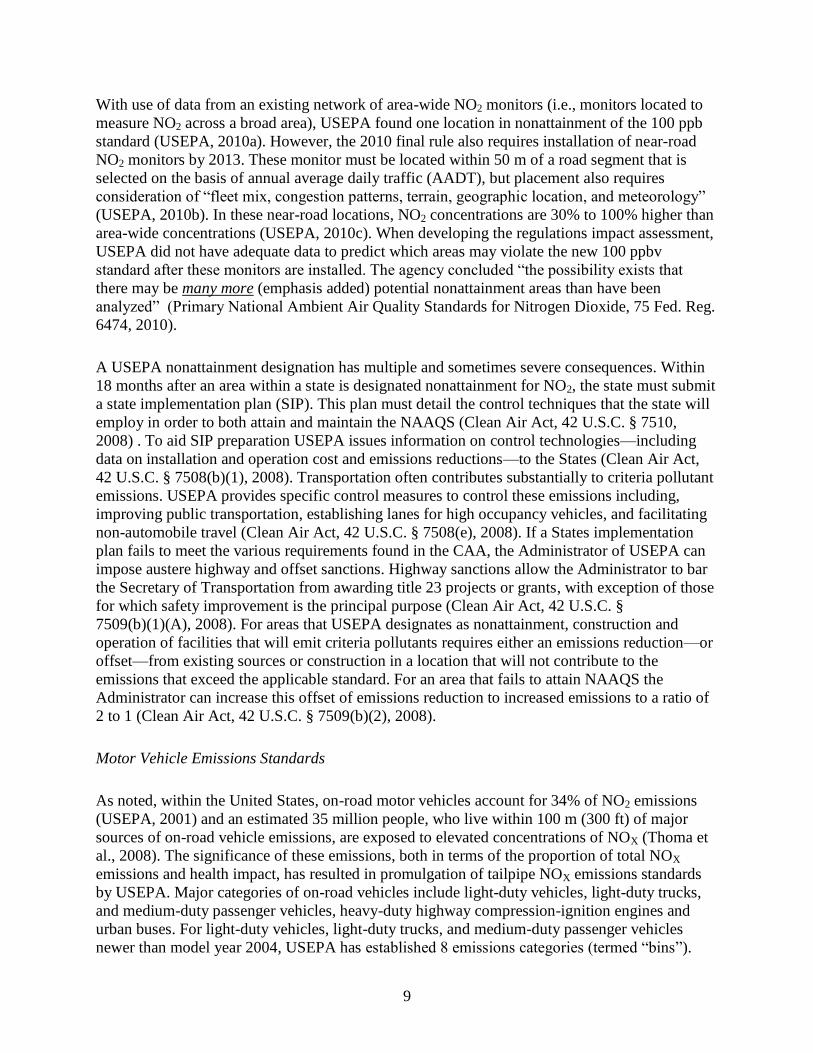
With use of data from an existing network of area-wide NO2 monitors (i.e., monitors located to
measure NO2 across a broad area), USEPA found one location in nonattainment of the 100 ppb
standard (USEPA, 2010a). However, the 2010 final rule also requires installation of near-road
NO2 monitors by 2013. These monitor must be located within 50 m of a road segment that is
selected on the basis of annual average daily traffic (AADT), but placement also requires
consideration of “fleet mix, congestion patterns, terrain, geographic location, and meteorology”
(USEPA, 2010b). In these near-road locations, NO2 concentrations are 30% to 100% higher than
area-wide concentrations (USEPA, 2010c). When developing the regulations impact assessment,
USEPA did not have adequate data to predict which areas may violate the new 100 ppbv
standard after these monitors are installed. The agency concluded “the possibility exists that
there may be many more (emphasis added) potential nonattainment areas than have been
analyzed” (Primary National Ambient Air Quality Standards for Nitrogen Dioxide, 75 Fed. Reg.
6474, 2010).
A USEPA nonattainment designation has multiple and sometimes severe consequences. Within
18 months after an area within a state is designated nonattainment for NO2, the state must submit
a state implementation plan (SIP). This plan must detail the control techniques that the state will
employ in order to both attain and maintain the NAAQS (Clean Air Act, 42 U.S.C. § 7510,
2008) . To aid SIP preparation USEPA issues information on control technologies—including
data on installation and operation cost and emissions reductions—to the States (Clean Air Act,
42 U.S.C. § 7508(b)(1), 2008). Transportation often contributes substantially to criteria pollutant
emissions. USEPA provides specific control measures to control these emissions including,
improving public transportation, establishing lanes for high occupancy vehicles, and facilitating
non-automobile travel (Clean Air Act, 42 U.S.C. § 7508(e), 2008). If a States implementation
plan fails to meet the various requirements found in the CAA, the Administrator of USEPA can
impose austere highway and offset sanctions. Highway sanctions allow the Administrator to bar
the Secretary of Transportation from awarding title 23 projects or grants, with exception of those
for which safety improvement is the principal purpose (Clean Air Act, 42 U.S.C. §
7509(b)(1)(A), 2008). For areas that USEPA designates as nonattainment, construction and
operation of facilities that will emit criteria pollutants requires either an emissions reduction—or
offset—from existing sources or construction in a location that will not contribute to the
emissions that exceed the applicable standard. For an area that fails to attain NAAQS the
Administrator can increase this offset of emissions reduction to increased emissions to a ratio of
2 to 1 (Clean Air Act, 42 U.S.C. § 7509(b)(2), 2008).
Motor Vehicle Emissions Standards
As noted, within the United States, on-road motor vehicles account for 34% of NO2 emissions
(USEPA, 2001) and an estimated 35 million people, who live within 100 m (300 ft) of major
sources of on-road vehicle emissions, are exposed to elevated concentrations of NOX (Thoma et
al., 2008). The significance of these emissions, both in terms of the proportion of total NOX
emissions and health impact, has resulted in promulgation of tailpipe NOX emissions standards
by USEPA. Major categories of on-road vehicles include light-duty vehicles, light-duty trucks,
and medium-duty passenger vehicles, heavy-duty highway compression-ignition engines and
urban buses. For light-duty vehicles, light-duty trucks, and medium-duty passenger vehicles
newer than model year 2004, USEPA has established 8 emissions categories (termed “bins”).

10
NOX emissions limits [at full useful vehicle life, 100,000-120,000 miles (approximately 160,000-
190,000 km)] in these bins range from 0.00 to 0.20 g mi-1
(0.12 g km-1
) (USEPA, 2007). Auto
manufacturers may sell vehicles that fall into any of the 8 bins, but the average emissions limit of
all vehicles sold must fall below the bin 5 limit, 0.07 g mi-1
(0.04 g km-1
) (USEPA, 2012a).
Heavy-duty highway compression-ignition engines and urban buses are regulated with a separate
set of emissions standards. For model year 2010 and newer, NOX emissions from these vehicles
are limited to 0.2 grams per brake horsepower-hour (g bhp-h-1
) (0.27 g kW-h-1
) (USEPA, 40
CFR 86.007-11, 2012b).
For vehicles in the light-duty category, the present bin 5 emissions limit represents a 98%
reduction from emissions prior to implementation of standards (USEPA, 2007). For heavy-duty
vehicles, the noted limits are a 98% reduction from 1985 emissions limits (USEPA, 2012b). To
achieve these levels of NOX emission control requires advanced and expensive tailpipe control
equipment. For example, retrofit installation of a selective catalytic reduction device on a heavy-
duty vehicle diesel engine costs between $12,000 and $20,000 when installed with an oxidation
catalyst or costs between $15,000 and $25,000 when installed with a diesel particulate filter
(MECA, 2007).
Principles of NOX Oxidation by Photocatalytic Pavement
In similarity with any other productive effort, the law of diminishing marginal returns governs
the effectiveness of conventional NOX mitigation strategies. Under conventional strategies, each
additional dollar spent is used less efficiently because the spending results in smaller and smaller
marginal reductions in ambient NOX concentrations. In the case of ambient NOX pollution,
documented negative health effects for those who live in near-road microenvironments indicate
that further reductions in NOX should be sought. Having reached a point low marginal return, if
policymakers operate under conventional strategies, achieving this goal will be expensive. In
order to achieve desired health impacts in a manner that efficiently uses whatever funding is
available, stakeholders must consider NOX mitigation strategies that fall outside of the current
paradigm and are governed by a separate input-output curve (i.e., dollars spent vs. NOX
reduction). Photocatalytic pavements are one of these new-paradigm strategies for motor-vehicle
pollution abatement. This technology must be evaluated with further laboratory and field
research.
Pavement-specific literature refers to NOX degradation as the DeNOx-process. This process has
one stage for NO2, two stages for NO, and is illustrated in Figure 3. The process begins when
NOx adsorbs on sites where ●OH is generated by exposed TiO2. Adsorbed NO is oxidized to
NO2 by the ●OH. NO2, both adsorbed from the air and formed by oxidation of NO, is oxidized to
nitrate (NO3-). It is possible for NO3
- to be bound to pavement surface by an alkali, but it is most
probable that this product is flushed by water from the surface (Husken et al., 2009). The high
probability that NO3- will be washed from the surface can be attributed to another unique photo-
induced TiO2 property, superhydrophilicity. Under sunlight, water on the surface of a pavement
containing TiO2 spreads into a thin film with a contact angle of nearly zero degrees. This low
contact angle allows water to penetrate between the pavements surface and adsorbed material.
This penetration lifts and flushes this material from the surface (A. Fujishima and Zhang, 2006).

11
Concentration of reaction products (i.e., NO2- and NO3
-) has not been measured in the field, but
one report estimates a maximum concentration of 1.2 mg/L-N, a value far below USEPAs 10
mg/L-N standard for drinking water (City Concept, 2004; USEPA, 2009).
Figure 5. Photocatalytic oxidation of NO and NO2 by concrete pavement containing TiO2
Photocatalytic pavements represent a novel approach that may serve as a means to effectively
mitigate NOX pollution. Current research has not expanded beyond this pollution abatement
effort. However, it should be noted that TiO2-based photocatalysts degrade an extensive range of
both organic and inorganic pollutants, which may well result in additional pollution abatement
benefits (Beeldens et al., 2011).
The wide range of pollutants degraded by TiO2-based photocatalysts dovetails with 1162
different air toxics found on the USEPAs Master List of Compounds Emitted by Mobile Sources
because these compounds are known or suspected to cause cancer or other serious health and
environmental effects (USEPA, 1994, 2006). For the USEPA, monitoring all mobile source air
toxics is impractical. In their case, the following six criteria pollutants have been selected as
indicators of air quality: carbon monoxide, lead, nitrogen oxides, ozone, particulate matter, and
sulfur oxides.
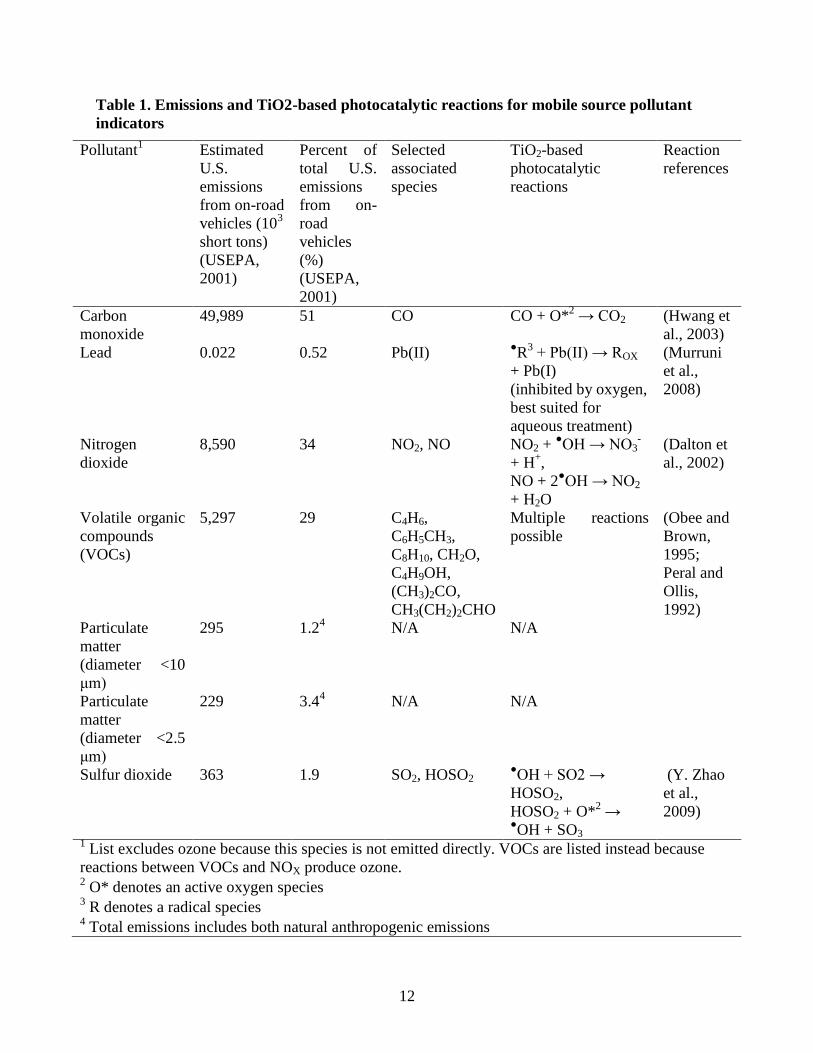
Table 1 uses a similar approach to indicate the suitability of TiO2 photocatalysts as a means to
mitigate mobile source pollution.
NO2
NO
site
siteNO2ads
NOads
●OHHNO2
●OH
H2O
NO3-H+
●OH
Runoff water with a projected low NO3
- presence
Water
12
Table 1. Emissions and TiO2-based photocatalytic reactions for mobile source pollutant
indicators
Pollutant1 Estimated
U.S.
emissions
from on-road
vehicles (103
short tons)
(USEPA,
2001)
Percent of
total U.S.
emissions
from on-
road
vehicles
(%)
(USEPA,
2001)
Selected
associated
species
TiO2-based
photocatalytic
reactions
Reaction
references
Carbon
monoxide
49,989 51 CO CO + O*2 → CO2 (Hwang et
al., 2003)
Lead 0.022 0.52 Pb(II) ●R
3 + Pb(II) → ROX
+ Pb(I)
(inhibited by oxygen,
best suited for
aqueous treatment)
(Murruni
et al.,
2008)
Nitrogen
dioxide
8,590 34 NO2, NO NO2 + ●OH → NO3
-
+ H+,
NO + 2●OH → NO2
+ H2O
(Dalton et
al., 2002)
Volatile organic
compounds
(VOCs)
5,297 29 C4H6,
C6H5CH3,
C8H10, CH2O,
C4H9OH,
(CH3)2CO,
CH3(CH2)2CHO
Multiple reactions
possible
(Obee and
Brown,
1995;
Peral and
Ollis,
1992)
Particulate
matter
(diameter <10
μm)
295 1.24 N/A N/A
Particulate
matter
(diameter <2.5
μm)
229 3.44 N/A N/A
Sulfur dioxide 363 1.9 SO2, HOSO2 ●OH + SO2 →
HOSO2,
HOSO2 + O*2 →
●OH + SO3
(Y. Zhao
et al.,
2009)
1 List excludes ozone because this species is not emitted directly. VOCs are listed instead because
reactions between VOCs and NOX produce ozone. 2 O* denotes an active oxygen species
3 R denotes a radical species
4 Total emissions includes both natural anthropogenic emissions

13
Notably, this table replaces ozone with VOCs because ozone is not emitted directly and VOCs
are a precursor to tropospheric ozone. With exception of particulate matter, photocatalytic
reactions have been reported for each pollutant. Furthermore, with exception of lead, each
reaction occurs in the gas phase.
Overview of Heterogeneous Photocatalysis Mechanism
Photocatalytic pavements have unique properties, which result in the oxidation of both organic
and inorganic pollutants (Beeldens et al., 2011). These properties arise because cements used in
these pavements contain TiO2, a photocatalyst. While other photocatalytic materials exists,
investigation has identified TiO2, with the anatase crystal structure, as the most effective (Ohama
and Van Gemert, 2011). The unique photocatalytic oxidation properties of TiO2 are chiefly due
to generation of hydroxyl radicals (●OH) under UV-A illumination (i.e., wavelength range of 300
nm to 400 nm) (A. Fujishima and Zhang, 2006). As illustrated in Figure 4, when nanoscale TiO2
particles absorb light with energy greater than the gap between valence and conduction bands
(i.e., 1-3.3 electron volts), valence band electrons are excited and move to the conduction band
(Tompkins et al., 2005). This electron movement produces electron-hole pairs. TiO2 particles,
which are n-type semiconductors, contain sufficient numbers of mobile electrons that generation
of electron-hole pairs do not significantly upset thermodynamic equilibrium. Therefore, the
energy from light can be stored without compromising TiO2 particle integrity. Once produced,
electron holes tend to recombine with an electron, eliminating the hole-pair and releasing the
stored energy as thermal energy or radiation. However, if the electron hole migrates to the
particle surface, oxidative reactions are possible. In the typical photocatalytic oxidation process,
an electron from a hydroxyl ion fills the TiO2 particles electron hole, creating a (●OH). This
radical is highly reactive and can then oxidize various pollutant molecules (Akira Fujishima et
al., 2000).
Figure 6. Photocatalytic oxidation steps (Adapted from Tompkins et al., 2005)
e-
h+
OH-
O2
Light
Eg ●OH
●O2-
Conduction Band
Reduction
Oxidation
Valence Band
3
1
2
H+ HO2
1 Light with energy greater thanband-gap energy (Eg) excites anelectron (e-) from the valence tothe conduction band creating avalence-band hole (h+).
2 h+ migrates to surface andoxidizes a hydroxyl ion (OH-) to ahydroxyl radical (●OH).
3 To maintain neutral charge theexcited electron migrates to thesurface and reduces molecularoxygen (O2) to a molecularoxygen radical (●O2
-).
14
Photocatalytic oxidation causes the TiO2 particle to gain electrons. A net gain of electrons
threatens the continued usability of the particles for photocatalytic oxidation because a negative
charge will develop if too many electrons are gained. This state has not been observed in
practice. Research indicates that in many cases, a neutral charge is maintained when electrons
leave TiO2 particles via reduction of molecular oxygen to radical oxygen (also illustrated in
Figure 4). The electron holes have a greater oxidizing power than the reducing power of excited
electrons; therefore, reduction of molecular oxygen does not cancel out the TiO2s oxidizing
power. Of note, radical oxygen when reacted with hydrogen produces the hydroperoxyl radical,
which also can oxidize certain molecules (A Fujishima et al., 1999).
Optimization of TiO2 for use as a photocatalyst is the subject of ongoing research. Anatase has
the highest photocatalytic activity levels of common TiO2 mineral forms due to comparatively
higher surface area and surface density of sites available for photocatalysis (Herrmann, 1999).
Although anatase TiO2 displays a comparatively high level of photo-activity, it only absorbs UV
light (which represents approximately 5% of sunlight). Enhanced photocatalytic activity could be
obtained if the spectrum of light that TiO2 absorbs is increased. Efforts to achieve this result have
included coupling with semiconductors, doping with metal, preparing TiO2 that is oxygen
deficient, and doping with non-metal anions (A. Fujishima et al., 2008). Non-metal anion doping
shows the greatest potential to achieve development of visible-light photocatalytsts. Publications
have reported that doping with nitrogen, carbon, sulfur, boron, phosphorus, and fluorine
increases the spectrum of light that TiO2 absorbs to the visible range (A. Fujishima et al., 2008).
These developments increase photocatalytic generation of ●OH, thereby increasing
photocatalytic degradation of various pollutants. Undoubtedly, future developments will also
enhance photo-degradation of NOX by pavement containing TiO2.
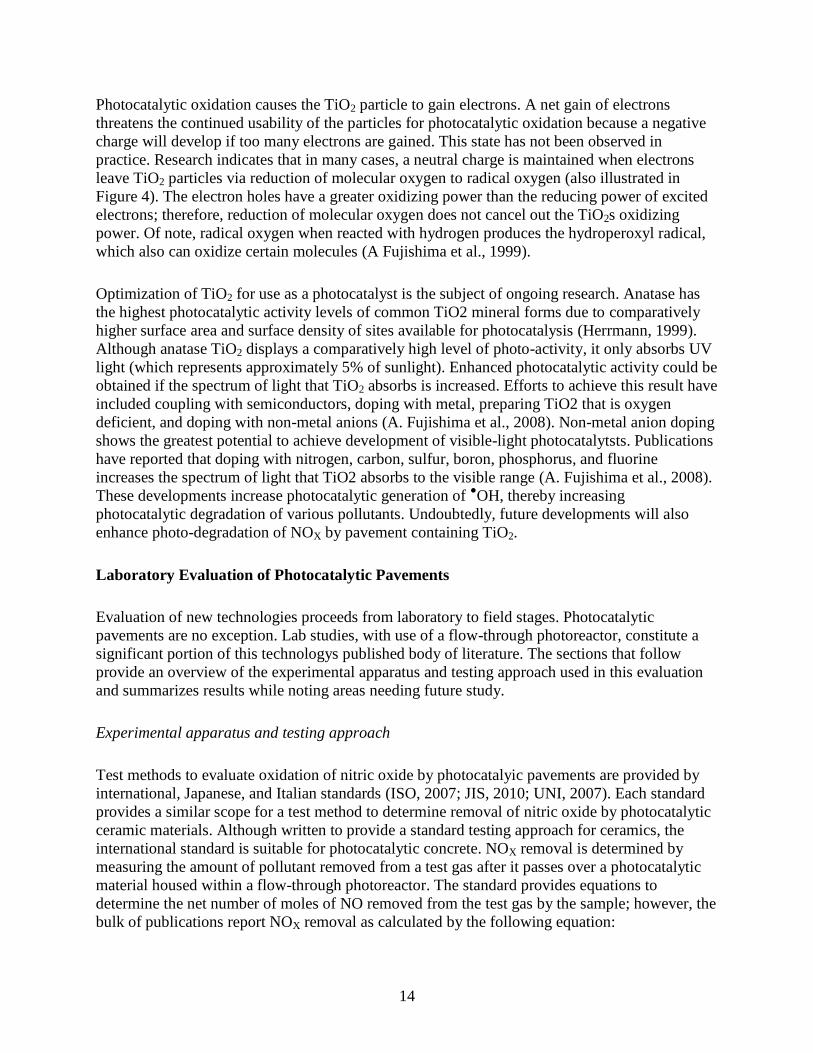
Laboratory Evaluation of Photocatalytic Pavements
Evaluation of new technologies proceeds from laboratory to field stages. Photocatalytic
pavements are no exception. Lab studies, with use of a flow-through photoreactor, constitute a
significant portion of this technologys published body of literature. The sections that follow
provide an overview of the experimental apparatus and testing approach used in this evaluation
and summarizes results while noting areas needing future study.
Experimental apparatus and testing approach
Test methods to evaluate oxidation of nitric oxide by photocatalyic pavements are provided by
international, Japanese, and Italian standards (ISO, 2007; JIS, 2010; UNI, 2007). Each standard
provides a similar scope for a test method to determine removal of nitric oxide by photocatalytic
ceramic materials. Although written to provide a standard testing approach for ceramics, the
international standard is suitable for photocatalytic concrete. NOX removal is determined by
measuring the amount of pollutant removed from a test gas after it passes over a photocatalytic
material housed within a flow-through photoreactor. The standard provides equations to
determine the net number of moles of NO removed from the test gas by the sample; however, the
bulk of publications report NOX removal as calculated by the following equation:

15
The apparatus required to complete this determination are divided into the following groups: test
gas supply, photoreactor, light source, and pollutant analyzer (see Figure 5 for schematic). The
standard proposes the following operating conditions: 1.0 ppmv NO input concentration, 50%
relative humidity, 3.0 L min-1
flow rate, 50 mm photoreactor width, 5.0 ± 0.5 mm air pathway
height, and 5 h sample irradiation length. In order to test [NOX] reduction under various
environments, these conditions are frequently modified.
Figure 7. Schematic of experimental apparatus (adapted from ISO, 2007).
Photoreactor studies
To predict the performance of photocatalytic pavements under field conditions, researchers use
photoreactor tests to measure [NOX] reduction under various environmental, material, and
operation conditions. The earliest publications varied environmental variables of irradiance,
relative humidity, NOX concentration, NO2/NOX fraction, and flow rate and the material
variable, TiO2 content. Table 2 presents a summary of these evaluations and the relationship
between each independent variable and the resulting [NOX] reduction. To achieve the maximum
NOX removal efficiency at minimum cost requires further investigation. The following sections
describe various environmental, material, and operation variables that impact NOX removal
efficiency and identify areas that require additional study.
Air compressor and purification
system
Standard gas (NO)
Humidifier Analyzer (NO, NOX)
UV-A light
Optical window
Test piece
Gas mixerMass flow controller
Vent
Test gas supply AnalyzerPhotoreactor and light source
16
Table 2. Summary of photoreactor tests for mortars containing TiO2 (unless noted, values are presented with the reported
number of significant digits)
Summary of photoreactor tests for mortars containing TiO2 (unless noted, values are presented with the reported number of
significant digits). Independent
variable
Values tested Associated [NOX]
reduction (%)
Test conditions Reference Relationship between
independent variable and NO
oxidation
High Low High Low ΔHigh-
Low
E
(W
m-2
)
RH
(%) [NOX]
(ppmv)
NO2/NOx Q
(L
min-
1)
TiO2
(% by
binder
weight)
Type
(positive,
negative,
unknown)
Reason
Irradiance
(W m-2
)
12 0 87d 10
d 77 50 1.0 0 3 NR Murata et al., 2000 Positive ↑ rate of electron-
hole generation
with ↑ E 13.1 0.3 25
d 5
d 20 50 1.0 0 3.0 NR Hüsken et al., 2009
12.1 2.1 45.8 12.6 33.2 49.9,
49.6
1.04 0.52 3 5.9i Ballari et al., 2011
Relative
humidity
(%)
80 10 52d 87
d -35 6 1.0 0 3 NR Murata et al., 2000 Negative Water blocks
pollutant
adsorption at active
sites
80 10 13.6 32.3 -18.7 10.0 1.0 0 3.0 NR Hüsken and
Brouwers, 2008;
Hüsken et al., 2009
80 30 14d 43
d -29 NR 0.41 0 NR 5 Dylla et al., 2010
69.0 10.2 37.9 84.6 -46.7 10.1 0.52 0 3 5.9i Ballari et al., 2011
NOX conc.
(ppmv)
5.0d 0.05 44
d 90
d -46 6 50 0 3 NR Murata et al., 2000 Negative Oxidation is
limited by rate of ●OH generation
1.0 0.1 36.9 68.4 -31.5 10.0 50 0 3.0 NR Hüsken and
Brouwers, 2008;
Hüsken et al., 2009
1.009 0.096 20.53 64.29 -43.76 10 50 0.01, 0.02 3 NR Ballari et al., 2010
1.01 0.11 34.9 71.8 -36.9 10 50.0 0 3 5.9i Ballari et al., 2011
1.3 0.1 38d 82
d -44 16 23,24 0 3 NR Sikkema et al., 2012
NO2/NOX 1 0 36.5 34.9 1.6 10.0 50.0,
49.8
1.01,
0.99
3 5.9i Ballari et al., 2011 Unknown Unknown
0.70 0.0 41d 74
d -33 20 20 0.55 3 5 Dylla et al., 2011

17
Q (L min-
1)
5 1 22.1 66.6 -44.5 10.0 50 1.0 0 NR Hüsken and
Brouwers, 2008;
Hüsken et al., 2009
Negative ↓ time of pollutant
exposure at active
sites with ↑ Q
5 3 15.72 21.10 -5.38 10 50 1.018,
1.019
0.2 NR Ballari et al., 2010
9 3 21d 61
d -40 NR NR 0.41 0 5 Dylla et al., 2010
TiO2 (%
by binder
weight)
10 3 18.1 6.2 11.9 10 50 1 0 3 Hüsken et al., 2009 Positive ↑ rate of electron-
hole generation
with ↑ TiO2
content
5 3 61d 56
d 5 NR ? 0.41 0 3 Dylla et al., 2010
5 3 26.9 18.0 8.9 NR 50 0.41 0 9.0 Hassan et al., 2010a;
Hassan et al., 2010b;
Hassan et al., 2010c;
d = digitized from figure NR = not reported, ↑ = increased, i = % by total weight, ↓ = decreased
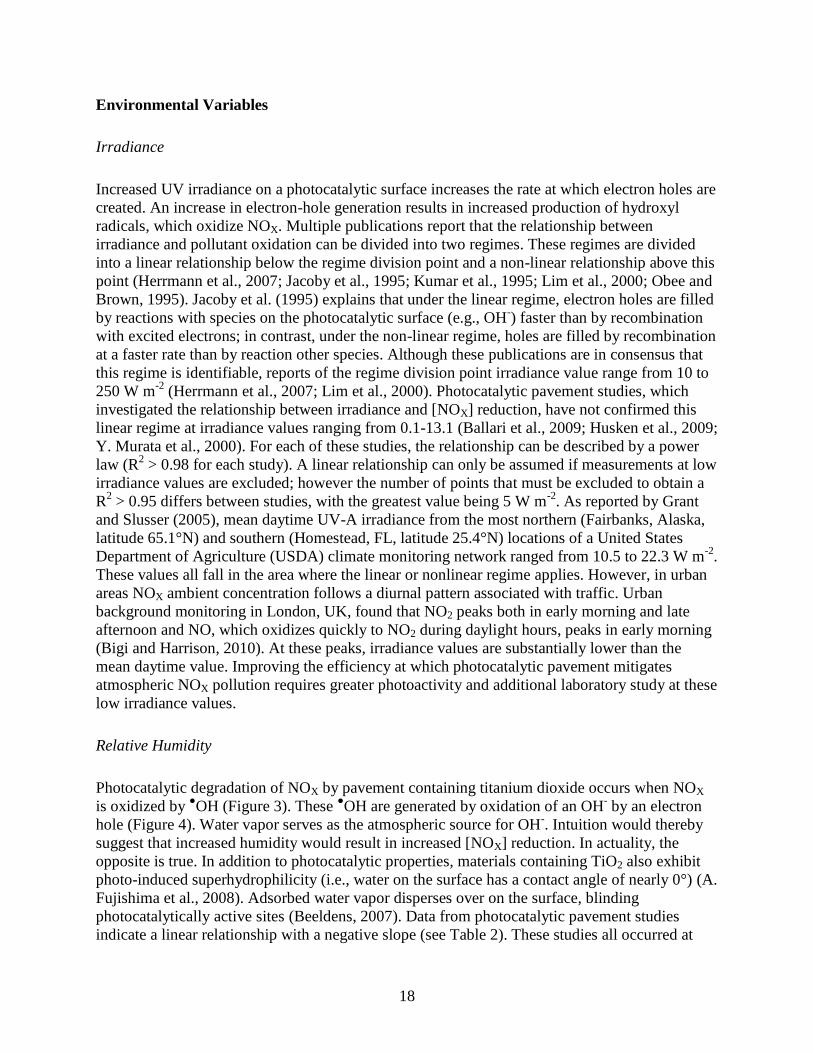
18
Environmental Variables
Irradiance
Increased UV irradiance on a photocatalytic surface increases the rate at which electron holes are
created. An increase in electron-hole generation results in increased production of hydroxyl
radicals, which oxidize NOX. Multiple publications report that the relationship between
irradiance and pollutant oxidation can be divided into two regimes. These regimes are divided
into a linear relationship below the regime division point and a non-linear relationship above this
point (Herrmann et al., 2007; Jacoby et al., 1995; Kumar et al., 1995; Lim et al., 2000; Obee and
Brown, 1995). Jacoby et al. (1995) explains that under the linear regime, electron holes are filled
by reactions with species on the photocatalytic surface (e.g., OH-) faster than by recombination
with excited electrons; in contrast, under the non-linear regime, holes are filled by recombination
at a faster rate than by reaction other species. Although these publications are in consensus that
this regime is identifiable, reports of the regime division point irradiance value range from 10 to
250 W m-2
(Herrmann et al., 2007; Lim et al., 2000). Photocatalytic pavement studies, which
investigated the relationship between irradiance and [NOX] reduction, have not confirmed this
linear regime at irradiance values ranging from 0.1-13.1 (Ballari et al., 2009; Husken et al., 2009;
Y. Murata et al., 2000). For each of these studies, the relationship can be described by a power
law (R2 > 0.98 for each study). A linear relationship can only be assumed if measurements at low
irradiance values are excluded; however the number of points that must be excluded to obtain a
R2 > 0.95 differs between studies, with the greatest value being 5 W m
-2. As reported by Grant
and Slusser (2005), mean daytime UV-A irradiance from the most northern (Fairbanks, Alaska,
latitude 65.1°N) and southern (Homestead, FL, latitude 25.4°N) locations of a United States
Department of Agriculture (USDA) climate monitoring network ranged from 10.5 to 22.3 W m-2
.
These values all fall in the area where the linear or nonlinear regime applies. However, in urban
areas NOX ambient concentration follows a diurnal pattern associated with traffic. Urban
background monitoring in London, UK, found that NO2 peaks both in early morning and late
afternoon and NO, which oxidizes quickly to NO2 during daylight hours, peaks in early morning
(Bigi and Harrison, 2010). At these peaks, irradiance values are substantially lower than the
mean daytime value. Improving the efficiency at which photocatalytic pavement mitigates
atmospheric NOX pollution requires greater photoactivity and additional laboratory study at these
low irradiance values.
Relative Humidity
Photocatalytic degradation of NOX by pavement containing titanium dioxide occurs when NOX
is oxidized by ●OH (Figure 3). These
●OH are generated by oxidation of an OH
- by an electron
hole (Figure 4). Water vapor serves as the atmospheric source for OH-. Intuition would thereby
suggest that increased humidity would result in increased [NOX] reduction. In actuality, the
opposite is true. In addition to photocatalytic properties, materials containing TiO2 also exhibit
photo-induced superhydrophilicity (i.e., water on the surface has a contact angle of nearly 0°) (A.
Fujishima et al., 2008). Adsorbed water vapor disperses over on the surface, blinding
photocatalytically active sites (Beeldens, 2007). Data from photocatalytic pavement studies
indicate a linear relationship with a negative slope (see Table 2). These studies all occurred at
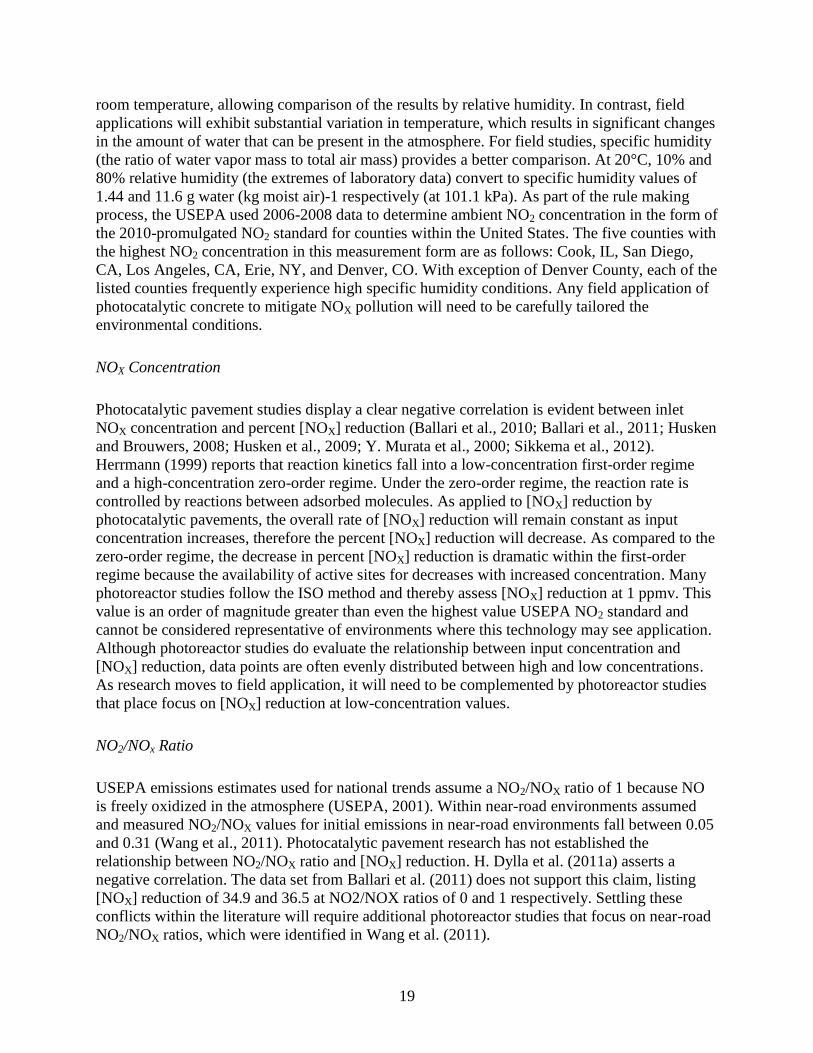
19
room temperature, allowing comparison of the results by relative humidity. In contrast, field
applications will exhibit substantial variation in temperature, which results in significant changes
in the amount of water that can be present in the atmosphere. For field studies, specific humidity
(the ratio of water vapor mass to total air mass) provides a better comparison. At 20°C, 10% and
80% relative humidity (the extremes of laboratory data) convert to specific humidity values of
1.44 and 11.6 g water (kg moist air)-1 respectively (at 101.1 kPa). As part of the rule making
process, the USEPA used 2006-2008 data to determine ambient NO2 concentration in the form of
the 2010-promulgated NO2 standard for counties within the United States. The five counties with
the highest NO2 concentration in this measurement form are as follows: Cook, IL, San Diego,
CA, Los Angeles, CA, Erie, NY, and Denver, CO. With exception of Denver County, each of the
listed counties frequently experience high specific humidity conditions. Any field application of
photocatalytic concrete to mitigate NOX pollution will need to be carefully tailored the
environmental conditions.
NOX Concentration
Photocatalytic pavement studies display a clear negative correlation is evident between inlet
NOX concentration and percent [NOX] reduction (Ballari et al., 2010; Ballari et al., 2011; Husken
and Brouwers, 2008; Husken et al., 2009; Y. Murata et al., 2000; Sikkema et al., 2012).
Herrmann (1999) reports that reaction kinetics fall into a low-concentration first-order regime
and a high-concentration zero-order regime. Under the zero-order regime, the reaction rate is
controlled by reactions between adsorbed molecules. As applied to [NOX] reduction by
photocatalytic pavements, the overall rate of [NOX] reduction will remain constant as input
concentration increases, therefore the percent [NOX] reduction will decrease. As compared to the
zero-order regime, the decrease in percent [NOX] reduction is dramatic within the first-order
regime because the availability of active sites for decreases with increased concentration. Many
photoreactor studies follow the ISO method and thereby assess [NOX] reduction at 1 ppmv. This
value is an order of magnitude greater than even the highest value USEPA NO2 standard and
cannot be considered representative of environments where this technology may see application.
Although photoreactor studies do evaluate the relationship between input concentration and
[NOX] reduction, data points are often evenly distributed between high and low concentrations.
As research moves to field application, it will need to be complemented by photoreactor studies
that place focus on [NOX] reduction at low-concentration values.
NO2/NOx Ratio
USEPA emissions estimates used for national trends assume a NO2/NOX ratio of 1 because NO
is freely oxidized in the atmosphere (USEPA, 2001). Within near-road environments assumed
and measured NO2/NOX values for initial emissions in near-road environments fall between 0.05
and 0.31 (Wang et al., 2011). Photocatalytic pavement research has not established the
relationship between NO2/NOX ratio and [NOX] reduction. H. Dylla et al. (2011a) asserts a
negative correlation. The data set from Ballari et al. (2011) does not support this claim, listing
[NOX] reduction of 34.9 and 36.5 at NO2/NOX ratios of 0 and 1 respectively. Settling these
conflicts within the literature will require additional photoreactor studies that focus on near-road
NO2/NOX ratios, which were identified in Wang et al. (2011).

20
Flow Rate
[NOX] reduction within a specific volume of test gas increases proportionally to the residence
time over a photocatalytic surface because greater time exists for pollutants to absorb and be
oxidized at active sites. As a result, literature demonstrates a clear negative correlation between
[NOX] reduction and flow rate. In each case the relationship appears linear, but each publications
supplies at most 3 data points (Ballari et al., 2010; Heather Dylla et al., 2010; Husken and
Brouwers, 2008; Husken et al., 2009). Tested flow rates (1-9 L min-1
) do not vary substantially
from the 3 L min-1
specified in the ISO (2007) standard. If the standards reactor dimensions are
also used, air velocity over the photocatalytic surface would measure 0.2 m s-1
. Although
considerable variation in wind velocity occurs within the field, in a relatively unobstructed
environment, a reasonable expectation would set wind velocities at least an order of magnitude
greater than the value specified by the standard (approximately 7 km h-1
). Wind velocity of this
magnitude would significantly reduce the effectiveness of field applications of photocatalytic
pavements, especially if the wind carried pollutants in a direction perpendicular to the roadway.
Street canyons may represent an optimal location for photocatalytic pavements. The structures
that border each side of these streets reduce natural ventilation and in many cases air pollution
rises well above background concentrations (Vardoulakis et al., 2003). While this reduced
airflow provides suitable site conditions for photocatalytic pavement, application of this
technology within a street canyon must take into account decreased irradiance during periods
when buildings obstruct sunlight.
Temperature
Available literature is vague in regards to the impact of temperature changes on NOX PCO
performance. Assertions are general and in most cases state that [NOX] reduction efficiency
increases with higher temperature (Beeldens et al., 2011) and that only large differences in
temperature (i.e., summer vs. winter) are significant (H. Dylla et al., 2011a). In addition to being
vague, the literature also is contradictory and one source reports a decrease in oxidation rate with
increased temperature (Chen and Chu, 2011). Cold temperature climates, such as those that occur
in northern and continental areas of the United Sates, may substantially reduce the pavements air
purification performance. To determine whether photocatalytic pavement can serve as a viable
method to address air pollution in these climates, the influence of temperature on the rate of NOX
PCO must be researched.
Material Variables RE: TiO2 Content
Photocatalytically active sites occur on the surface of pavement where TiO2 is exposed. An
increase in the amount of TiO2 contained in the photocatalytic material (often measured as a
percentage of binder mass) results in greater NOX removal (Heather Dylla et al., 2010; M. M.
Hassan et al., 2010a, 2010b; Marwa M. Hassan et al., 2010c; Husken et al., 2009). Although this
positive correlation is supported by literature, the relationship is non-linear. Studies of VOC
oxidation have found that grains catalytic activity diminish with increases in TiO2 content and
have proposed that optimal TiO2 content falls between 1 and 5% (Strini et al., 2005; Watts and
Cooper, 2008). This diminished return was attributed to catalyst aggregation and segregation that

21
resulted in a decrease in TiO2 concentration at the materials surface. Due to the nature of this
relationship, it is not apparent whether this benefit is justified by the unit cost of TiO2 (Heather
Dylla et al., 2010). It should be noted, TiO2 content is not frequently reported in photocatalytic
pavement studies. Within patents governing this technology TiO2 content as a percentage of
binder ranges from 2-10% (Paz, 2010). Specific values are not available, assumedly to protect
competitive advantage. Future stakeholders will need to rely on the research and development
process of the patent holders and on available data verifying the products performance.
Material Variables RE: TiO2 Properties
In addition to the content, the properties of TiO2 contained within a photocatalytic pavement also
impact NOX removal. TiO2 occurs in a variety of mineral forms, including anatase, brookite, and
rutile. Although each mineral form is photocatalytically active, direct comparison finds that
anatase is best-suited for photocatalytic oxidation applications because anatase is superior in both
the rate at which electron-hole pairs are generated and has a better ability to adsorb reactants
(Sclafani and Herrmann, 1996). Although anatase is a superior photocatalyst, mixtures of rutile
and anatase (e.g., Degussa P-25, which contains anatase and rutile at a 3:1 ratio) garner the
greatest photoactivity due to interaction between the minerals (Ohno et al., 2001). In addition to
an appropriate mixture of mineral forms, high specific surface area values have also been
demonstrated to enhance photocatalytic activity (Husken et al., 2009). Further discussion of TiO2
properties, which enhance photocatalytic activity falls outside of the scope of this review. If of
interest to the reader, the following publication would serve as a good starting point: Carp et al.
(2004). As noted by the article, particular research needs include development of photocatalysts
that can be activated by visible light and are selective in the pollutants that are oxidized.
Stakeholders considering use of photocatalytic pavements would be wise to follow developments
in TiO2 photocatalysts and if possible select a catalyst which incorporates worthwhile research
developments.
Material Variables RE: Mix Design and Surface Treatment
Even if the most photocatalytically efficient photocatalyst is selected for use in a pavement
application, substantial care needs to be taken in designing a mix and surface treatment in order
to garner the maximum removal of ambient NOX. In cementitious systems some pavements can
be made photocatalytic with addition of a thin mortar placed on the surface or a non-
photocatalytic component. TiO2 is added to either the cement or water components of the mortar
mix. Lab research indicates that TiO2 is more homogeneously distributed, resulting in greater
NOX removal, when TiO2 is mixed with water (Husken et al., 2009). The researchers quality
control may not be achievable in ready-mix plants. It is possible a more consistent distribution of
TiO2 in a photocatalytic mortar may be realized by tasking cement suppliers with the supplying
photocatalytic cement. A second method to produce a cementitious photocatalytic pavement is to
simply substitute photocatalytic cement in place of Type I cement when pouring concrete. With
present technology, this practice is expensive. The cost can be reduced to an extent by using a
two-lift pavement construction. Using widely accepted construction practice, a top layer could be
reduced a 4 cm thickness (Hall et al., 2007). This technique does substantially increase costs
(e.g., it requires two paving plants, two paving machines, and additional labor), but opens up
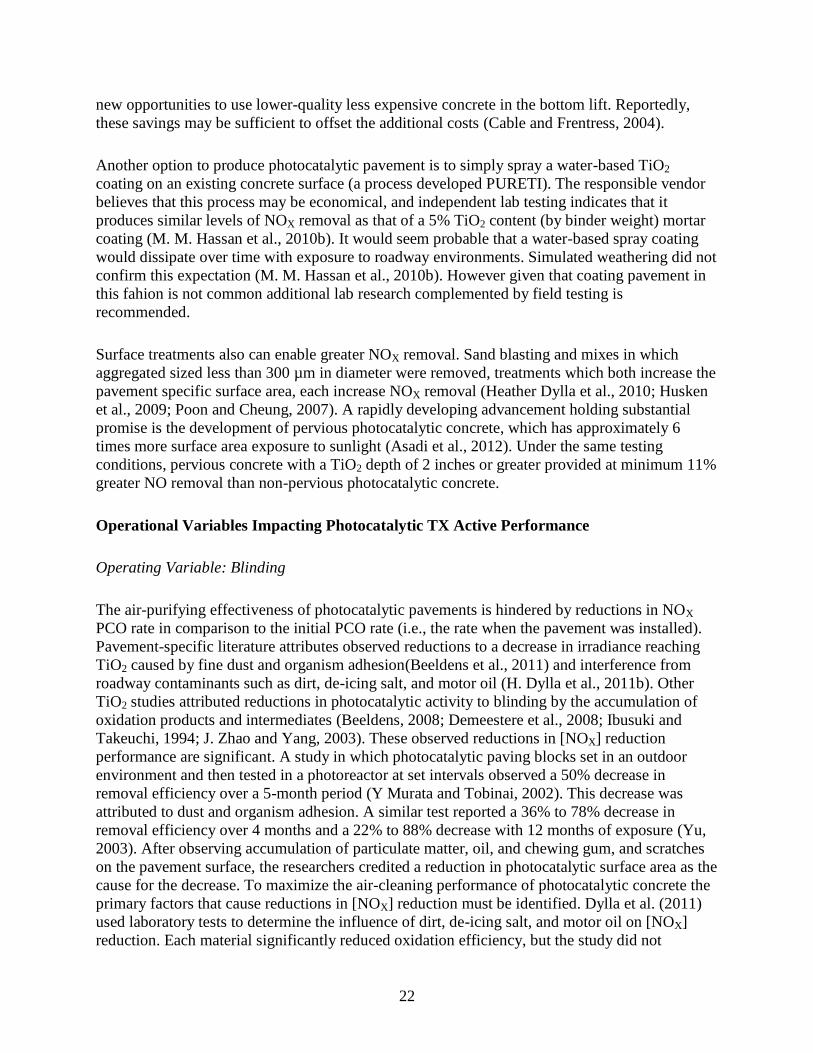
22
new opportunities to use lower-quality less expensive concrete in the bottom lift. Reportedly,
these savings may be sufficient to offset the additional costs (Cable and Frentress, 2004).
Another option to produce photocatalytic pavement is to simply spray a water-based TiO2
coating on an existing concrete surface (a process developed PURETI). The responsible vendor
believes that this process may be economical, and independent lab testing indicates that it
produces similar levels of NOX removal as that of a 5% TiO2 content (by binder weight) mortar
coating (M. M. Hassan et al., 2010b). It would seem probable that a water-based spray coating
would dissipate over time with exposure to roadway environments. Simulated weathering did not
confirm this expectation (M. M. Hassan et al., 2010b). However given that coating pavement in
this fahion is not common additional lab research complemented by field testing is
recommended.
Surface treatments also can enable greater NOX removal. Sand blasting and mixes in which
aggregated sized less than 300 µm in diameter were removed, treatments which both increase the
pavement specific surface area, each increase NOX removal (Heather Dylla et al., 2010; Husken
et al., 2009; Poon and Cheung, 2007). A rapidly developing advancement holding substantial
promise is the development of pervious photocatalytic concrete, which has approximately 6
times more surface area exposure to sunlight (Asadi et al., 2012). Under the same testing
conditions, pervious concrete with a TiO2 depth of 2 inches or greater provided at minimum 11%
greater NO removal than non-pervious photocatalytic concrete.
Operational Variables Impacting Photocatalytic TX Active Performance
Operating Variable: Blinding
The air-purifying effectiveness of photocatalytic pavements is hindered by reductions in NOX
PCO rate in comparison to the initial PCO rate (i.e., the rate when the pavement was installed).
Pavement-specific literature attributes observed reductions to a decrease in irradiance reaching
TiO2 caused by fine dust and organism adhesion(Beeldens et al., 2011) and interference from
roadway contaminants such as dirt, de-icing salt, and motor oil (H. Dylla et al., 2011b). Other
TiO2 studies attributed reductions in photocatalytic activity to blinding by the accumulation of
oxidation products and intermediates (Beeldens, 2008; Demeestere et al., 2008; Ibusuki and
Takeuchi, 1994; J. Zhao and Yang, 2003). These observed reductions in [NOX] reduction
performance are significant. A study in which photocatalytic paving blocks set in an outdoor
environment and then tested in a photoreactor at set intervals observed a 50% decrease in
removal efficiency over a 5-month period (Y Murata and Tobinai, 2002). This decrease was
attributed to dust and organism adhesion. A similar test reported a 36% to 78% decrease in
removal efficiency over 4 months and a 22% to 88% decrease with 12 months of exposure (Yu,
2003). After observing accumulation of particulate matter, oil, and chewing gum, and scratches
on the pavement surface, the researchers credited a reduction in photocatalytic surface area as the
cause for the decrease. To maximize the air-cleaning performance of photocatalytic concrete the
primary factors that cause reductions in [NOX] reduction must be identified. Dylla et al. (2011)
used laboratory tests to determine the influence of dirt, de-icing salt, and motor oil on [NOX]
reduction. Each material significantly reduced oxidation efficiency, but the study did not
23
compare the amount of material applied to test pieces to amounts observed on installed
pavements. This study also did not assess whether the oxidized product, NO3-, caused a reduction
in oxidation efficiency. To ensure long-term performance of photocatalytic pavement,
photoreactor studies must determine the primary factors that cause the field observed decrease in
[NOX] reduction performance.
Operating Variable: Pavement Age
As noted above, materials that interfere with catalytically active sites can cause decreases in
[NOX] reduction performance. Sufficient data does not exist to establish whether photocatalytic
activity also decreases with pavement age. One report notes that activity lasts for a least one
year, but acknowledges that longer duration tests are not complete (Cassar, 2004). Theoretically,
the pavement should maintain photocatalytic activity because TiO2 is not consumed by the
[NOX] reduction process. Furthermore, any abrasion that results from traffic should expose new
TiO2 particles. Nevertheless, these assertions have not been verified with robust laboratory or
field data. United States stakeholders will not progress with any large-scale projects unless
research establishes that pavement age does not have a significant impact on activity (Berdahl
and Akbari, 2007).
Operating Variable: Wash-off/Regeneration
Efficient use of photocatalytic pavement requires strategies to address the known decrease in
[NOX] reduction rate that occurs over time after the pavement is installed in a near-road
environment. Researchers have suggested shearing airflow, burning chemisorbed carbon species,
simulated rainfall, and road cleaning (Beeldens et al., 2011; Demeestere et al., 2008; J. Zhao and
Yang, 2003). Demeestere et al. (2008) found that airflow was a completely ineffective
regeneration mechanism. While, surface burning may be economical for some small-scale
applications, it is impractical for pavements. Some sources claim that rain or surface washing is
sufficient to regenerate photocatalytic activity (Beeldens, 2008; Beeldens et al., 2011). One
source noted the beneficial effect of rain, but still recommended surface washing at an interval of
two months (Yu, 2002). However, another researcher found that washing with a brush and
deionized water did not cause a statistically significant change (or increase) in the activity of
photocatalytic paving blocks that had been partially deactivated by outdoor exposure in a near-
road environment for a period of months (Yu, 2003). The conflicts that exist in published
literature point to a need for research that determines effective washing mechanisms to
regenerate the photocatalytic activity of these pavements. This research must tailor washing
mechanisms to the factors that cause [NOX] reduction rate reductions and estimate the required
washing frequency to maintain [NOX] reduction performance.
Operating Variable: Ecological Impact
Although the NO3- product that results from NOX PCO can be used as a plant nutrient, within the
United States, NO3- is a water pollutant where excessive concentrations in aquatic environments
causes eutrophication (The Cadmus Group, 2009). Research on this possible unintended
pollution is limited, but appears to suggest that concentrations are at levels that do not warrant
24
ecological concern. One example calculation yielded a concentration of 5.3 mg/L NO3- (City
Concept, 2004). A second publication asserts that NO3- becomes bound inside the concrete
matrix as calcium nitrate (CaNO3) and that dissolution into runoff water would be at a
concentration 10 times less than the first pollution level (PICADA, 2011). Another publication
seemingly acknowledges that a water pollution problem is possible by proposing that NO3- can
be extracted from runoff with a standard sewage plant (Husken et al., 2009). This solution may
be practical in the authors country of residence (the Netherlands) but within the United States,
the majority of road runoff travels directly to surface water. Potential stakeholders require
laboratory and field data that confirms NO3- in runoff will not exacerbate current water pollution
problems (Berdahl and Akbari, 2007).
Combined Effects of Variables
It warrants noting that the aforementioned individual variables do not operate in discrete fashion,
but rather that they are all likely to overlap in terms of impact at any time. As a result, this multi-
layered set of variables imposes a highly degree of complication with trying to develop an
appropriate model of expected real-world behavior with TX Active pavement performance.
Field Evaluation of Photocatalytic Pavements
Multiple field studies of photocatalytic pavements do exist (see Table 3), but documentation is
comparatively less extensive than that of laboratory research. Available field research can be
categorized as those that compare photocatalytic and control sections, measure NO3- deposition
as evidence of photocatalytic activity, and attempt to model observations. These categories of
field research are summarized in the sub-sections that follow.

25
Table 3. Locations of field comparison of photocatalytic and control sections
Location
Installation
type
Pavement
type
Surface
area (m2)
Traffic
volume
NOX conc.
change
(%) Measurement
type Reference
Antwerp,
Belgium
Parking
lanes of
urban road
Paving blocks 10,000 20 Beeldens, 2006
Via
Morandi,
Segrate,
Italy
Urban road Thin mortar
overlay
7,000 1000 veh
h-1
60 Max. Italcementi,
2006;
Essroc, 2008;
Italcementi,
2009;
50 Avg.
Calusco
dAdda,
Bergamo,
Italy
Industrial
site road
Paving blocks 8,000 45 Avg. Italcementi,
2006;
Italcementi,
2009
Porpora
Street,
Milan, Italy
Road
within
tunnel
Concrete,
photocatalytic
ceiling paint
728
(concrete)
30,000 veh
d-1
23 Min. UV
irradiance
Italcementi,
2006
Borgo
Palazzo,
Bergamo,
Italy
Urban Paving blocks 7,000 400 cars
h-1
40 Max. Italcementi,
2009 20 Min
12,000 66 Max. Guerrini and
Peccati, 2007 20 Min.
Rue Jean
Bleuzen,
Vanves,
France
Urban road Concrete
overlay
6,000 13,000
cars d-1
20 Min. Italcementi,
2009
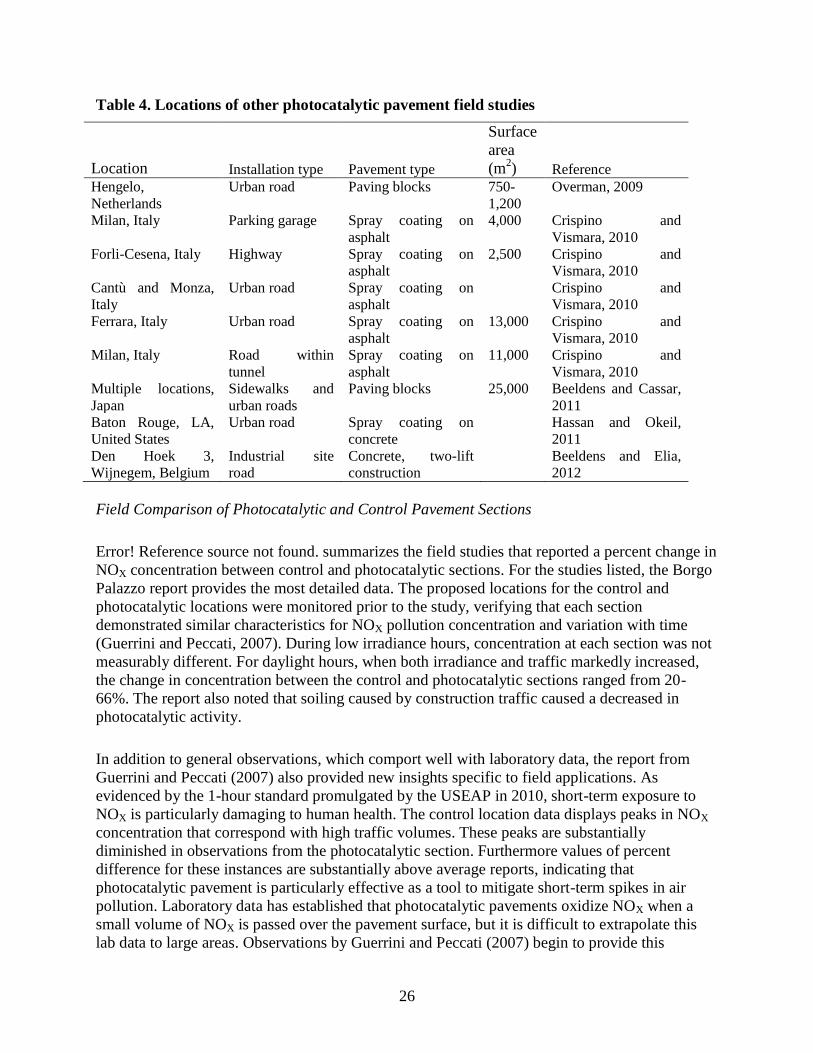
26
Table 4. Locations of other photocatalytic pavement field studies
Location Installation type Pavement type
Surface
area
(m2) Reference
Hengelo,
Netherlands
Urban road Paving blocks 750-
1,200
Overman, 2009
Milan, Italy Parking garage Spray coating on
asphalt
4,000 Crispino and
Vismara, 2010
Forli-Cesena, Italy Highway Spray coating on
asphalt
2,500 Crispino and
Vismara, 2010
Cantù and Monza,
Italy
Urban road Spray coating on
asphalt
Crispino and
Vismara, 2010
Ferrara, Italy Urban road Spray coating on
asphalt
13,000 Crispino and
Vismara, 2010
Milan, Italy Road within
tunnel
Spray coating on
asphalt
11,000 Crispino and
Vismara, 2010
Multiple locations,
Japan
Sidewalks and
urban roads
Paving blocks 25,000 Beeldens and Cassar,
2011
Baton Rouge, LA,
United States
Urban road Spray coating on
concrete
Hassan and Okeil,
2011
Den Hoek 3,
Wijnegem, Belgium
Industrial site
road
Concrete, two-lift
construction
Beeldens and Elia,
2012
Field Comparison of Photocatalytic and Control Pavement Sections
Error! Reference source not found. summarizes the field studies that reported a percent change in
NOX concentration between control and photocatalytic sections. For the studies listed, the Borgo
Palazzo report provides the most detailed data. The proposed locations for the control and
photocatalytic locations were monitored prior to the study, verifying that each section
demonstrated similar characteristics for NOX pollution concentration and variation with time
(Guerrini and Peccati, 2007). During low irradiance hours, concentration at each section was not
measurably different. For daylight hours, when both irradiance and traffic markedly increased,
the change in concentration between the control and photocatalytic sections ranged from 20-
66%. The report also noted that soiling caused by construction traffic caused a decreased in
photocatalytic activity.
In addition to general observations, which comport well with laboratory data, the report from
Guerrini and Peccati (2007) also provided new insights specific to field applications. As
evidenced by the 1-hour standard promulgated by the USEAP in 2010, short-term exposure to
NOX is particularly damaging to human health. The control location data displays peaks in NOX
concentration that correspond with high traffic volumes. These peaks are substantially
diminished in observations from the photocatalytic section. Furthermore values of percent
difference for these instances are substantially above average reports, indicating that
photocatalytic pavement is particularly effective as a tool to mitigate short-term spikes in air
pollution. Laboratory data has established that photocatalytic pavements oxidize NOX when a
small volume of NOX is passed over the pavement surface, but it is difficult to extrapolate this
lab data to large areas. Observations by Guerrini and Peccati (2007) begin to provide this

27
extrapolation by providing measurements at 0.3 and 1.8 m. While measurements at the lower
observation point indicate greater [NOX] reduction, even at 1.8 m the photocatalytic section
values are on average 20% lower than at the control location.
At the Baton Rouge site, NOX concentration was also measured simultaneously for a concrete
section coated sprayed with a TiO2 aqueous solution and a control section (M. M. Hassan and
Okeil, 2011). To compare the two sections, in one figure the authors reported total daily NOX
reduction in units of ppb. For each data point, the reported value was greater than 1000 ppb. The
statistical approach used is difficult to understand and does not facilitate comparisons with other
field or laboratory studies. Considering that this value is an order of magnitude greater than the
USEPA 1-hour standard, it is highly improbable that the statistic is the difference between
locations. Regardless, the report does provide evidence that the pavement oxidizes NOX in field
applications. Hassan and Okiels work also draws correlations between environmental factors and
NOx reduction observed. In concert with lab data, the authors observed that NOX reduction was
negatively correlated to relative humidity and wind speed and positively correlated to irradiance.
The authors consideration of wind direction warrants additional discussion. It is anticipated that
the majority field applications of photocatalytic pavement will occur in a street canyon where
both natural ventilation is reduced and heavy traffic represents the major portion of NOX
pollution. For the geometric configuration of a street canyon, longitudinal winds flush the area,
preventing accumulation of NOX. Under transverse winds, the residence time of the pollutant
molecule is increased, permitting more time for photocatalytic oxidation and thereby resulting in
increased percent NOX reduction. This study found that NOX reduction was higher when winds
were in a longitudinal direction than when winds blew transversely. The result can be explained
by the sites geometric conditions. Unlike anticipated applications, this study occurred in an area
free from buildings which would prevent natural ventilation. Instead of flushing the surface and
diminishing NOX reduction, longitudinal winds are associated with the highest NOX residence
time at this particular location. Of particular interest, the authors found that transverse winds
were especially negative. These winds carry the pollutant off of the pavement. Future
stakeholders will need to take time to consider where the install pavements. As mentioned
previously, a street canyon may be especially good location. Due to a lack of natural ventilation
residence time of the pollutant above the photocatalytic surface is increased, enhancing
photocatalytic oxidation.
Available field studies that compare photocatalytic and control sections of pavement highlight
multiple factors that influence photocatalytic oxidation and the difficulty in providing data that
provides sufficient evidence that will persuade stakeholders to adopt this technology. The
reported studies are worthwhile, but additional work must provide more detailed data and data
that is collected for a longer duration than that of the present work.
Field Measurement of NO3- Deposition
The comparative approach, which evaluates photocatalytic pavement with reference to a control
section, requires significant expenses of both time and dollars. Furthermore, the data obtained
can be difficult to evaluate because of multiple factors influence both the concentration of NOX
28
pollution in an area and the effectiveness of photocatalytic oxidation. An alternative approach
measures NO3-—the final product of NOX photocatalytic oxidation–that accumulates on the
surface of a pavement containing TiO2. For photoreactor tests, this approach is described by an
international standard (ISO, 2007). Osborn et al. (2012) applied this approach in an effort
evaluate photocatalytic pavements in the field. A section of the pavement surface was isolated
and soaked with water. This water was then analyzed for [NO3-]. For a 7 day observation period,
[NO3-] on the photocatalytic section averaged 0.04 mg l-1 as N whereas the control section
averaged 0.003 mg l-1 as N. While the method holds promise, deficiencies must be addressed in
order to use this approach to evaluate photocatalytic pavements. Foremost, the author does not
provide evidence that the procedure removes all NO3- from the pavement surface or provide a
factor to account for the amount of NO3- that remains on the surface following use of the
washing technique. Additionally, the author assumes that all NO3- oxidized remains on the
surface and that water is the only factor that can remove the compound. Without factors that
account for these uncertainties, the application is quite limited.
Modeling Efforts to Predict Field Observations
Comparative field studies and studies that measure products of NO3- on the photocatalytic
surface represent worthwhile steps to validate photocatalytic pavements in the field. However, it
is probable that the most useful tool to persuade future stakeholders will be models that can
accurately predict NOX concentration for photocatalytic and non-photocatalytic pavements. This
type of model, would then serve as a tool by which a particular area could be evaluated as a
candidate for photocatalytic pavement. After determining an expected decrease in NOX
concentration for the area, the stakeholders could then determine whether the cost of constructing
a photocatalytic roadway outweighs other pollution mitigation options.
Based on field data, M. M. Hassan and Okeil (2011) provide a nonlinear regression model
governed variables of traffic volume, relative humidity, wind speed, temperature, and irradiance
factors. Considering the multiple factors involved, the models reported 0.70 R2 value appears
quite high. However application to other test locations is severely limited because upper
boundaries are set at values of 52 vehicle h-1
, 2.7 m s-1
, and 20°C for traffic volume, wind speed,
and temperature respectively. Furthermore, the model does not distinguish whether the output
result is for the breathing height of an adult or directly at the pavement surface. Although a
stakeholder will be regulated by the concentration recorded at a near-road or area-wide monitor,
true concern is human welfare. Therefore, models should allow users to determine an estimate of
concentration at the breathing heights of both children and adults.
A deliverable from the PICADA project provides a second option to predict the NOX abatement
effectiveness of photocatalytic materials (Barmpass et al., 2006). The fluid dynamics-based
model was developed for photocatalytic coatings on buildings, but could be adapted for
photocatalytic pavements. A reference scenario is developed with inputs of street and building
dimensions, wind speed and direction, and average observed NOX concentration. The scenario is
then adjusted for photocatalytic oxidation of NOX by inclusion of a deposition velocity variable.
Incorporating all environmental factors that influence photocatalytic oxidation into a single

29
variable severely limits the model. As noted by the authors this model should only be used as a
“rough guide”.
Overmans two-dimensional model is based on both fluid dynamics and kinetic equations for
photocatalytic oxidation and atmospheric reactions (Overman, 2009). The fluid dynamics
components are governed by building and street geometry along with wind speed and direction.
The photocatalytic oxidation kinetics component is based data obtained by Ballari et al. (2010)
and includes inputs to account for irradiance, relative humidity, and NO and NO2 concentration.
In addition, with input of O3, the model accounts atmospheric photolysis of NO2 by UV
irradiance. This model was applied to a road in Hengelo, Netherlands, with predicted reduction
ranging from 2-6% and 10-19% for NO and NO2 respectively. The two-dimensional component
of the model allows for prediction of concentration at varied heights; however, wind direction is
always assumed to be transverse. To account for other wind directions, a three-dimensional
model would be required. Unfortunately, while calibrated against observations prior to
photocatalytic pavement installation, a report is not available that assesses the predicted results
after construction. This follow-up modeling effort would provide substantial
Research Gaps
Photocatalytic pavements have generated high interest from researchers and potential
stakeholders. With an ever-increasingly stringent regulatory environment, it is highly probable
that new approaches will be needed to mitigate NOX pollution. Furthermore, while this review
places focus on photocatalytic reactions with NOX, benefits exist that cause oxidation of other
pollutants detrimental to both the human welfare and the natural environment. At present,
multiple areas exist in both laboratory and field research for which additional knowledge is
needed. While the body of literature is substantial, future research must use strengthen the link
between photoreactor and field studies, determine the environmental variables with the greatest
impact on [NOX] reduction, and develop models to facilitate selection of roadways for which
maximum [NOX] reduction can be achieved. While the field is novel and fascinating to study, the
amount of work to be overcome is still significant. Multiple researchers are needed to address
this problem and each will only be able to incrementally move the state of knowledge forward.
However, it is the authors hope that with collective efforts of researchers in this field, a
technology that meaningfully abates NOX pollution can be developed.
Pervious Concrete Pavement
Pervious concrete is a rigid pavement and is structurally designed as such. Rigid pavement
design considerations specific to pervious concrete are lower flexural strength, lower modulus of
elasticity, and subgrade design assuming saturated conditions. AASHTO, ACI, or PCA design
procedures are appropriate, however fatigue relationships have not been established or field
verified so designs should provide a higher design reliability (Delatte, 2007). Results reported in
the literature show a linear decrease in modulus of elasticity values for pervious concrete with
increased void content, similar to relationships for strength. Reported modulus of elasticity for
pervious concretes with 25% voids was around 3.6 million psi (24,800 MPa) and decreased to
1.5 million psi (10,300 MPa) at 40% voids, for mixtures using limestone aggregate (Crouch et

30
al., 2007). Oftentimes the aggregate base depth is controlled by the required water storage
capacity and soil infiltration rate. In cold climates the aggregate base depth can normally be 12 to
18 inches (300-450 mm) or more. In most cases the additional aggregate base required for the
hydrologic design will balance the lower modulus of the surface concrete. While standard rigid
pavement designs are appropriate conservative inputs for modulus of elasticity and fatigue
performance should be used.
The hydrologic design of pervious concrete has the most available guidance since the storage
design is basically that of a traditional detention/retention area. The infiltration type depends on
soil infiltration capacity and amount of recovery time desired between storm events. Most
systems are designed to empty before 48 to 72 hours. Designs can either infiltrate all of the
stormwater (full infiltration), some of the stormwater such as the water quality volume (partial
infiltration), or be lined to prevent infiltration (no infiltration). For pervious concrete shoulders a
drain tile is recommended to prevent any lateral flow of water towards the mainline pavement.
The shoulder stormwater design should be either designed for no infiltration or partial
infiltration.
The hydraulic design of the surface of pervious concrete is the least researched and most difficult
to provide exact values for recommendation purposes. The pervious concrete pore size should be
sufficiently large to allow the vast majority of suspended solids to pass through into the detention
layer. If the pores are too small or the infiltration rate to low, particles become trapped in the
surface and the pavement clogs. The ASTM C1701 test for the infiltration rate of in place
pervious concrete has allowed actual testing of pavement capacity over time. The author has
tested many pervious concrete pavements in various stages of clogging and has proposed some
design targets based on the results (Kevern, 2011). Pervious concrete pavements with infiltration
rates greater than 500 in./hr (1,250 cm/hr) tended to have lower instances of clogging than those
below 250 in./hr. (600 cm/hr) Pervious concrete pavements with infiltration rates above 1,000
in./hr. (2,500 cm/hr) appeared to have some self-cleaning ability and were able to flush even
larger amounts of soil through the surface with time. While there is currently no precision and
bias statement for the ASTM C1701 test, consideration of infiltration capacity during the design
process will reduce instances of clogging.
Global Breakdown of Academic and Industrial Research Activity Locations
The following two figures (i.e., Figures 6 and 7) respectively provide a visual breakdown of
academic and industrial research activities aligned to the use and performance of photocatalytic
concrete materials.
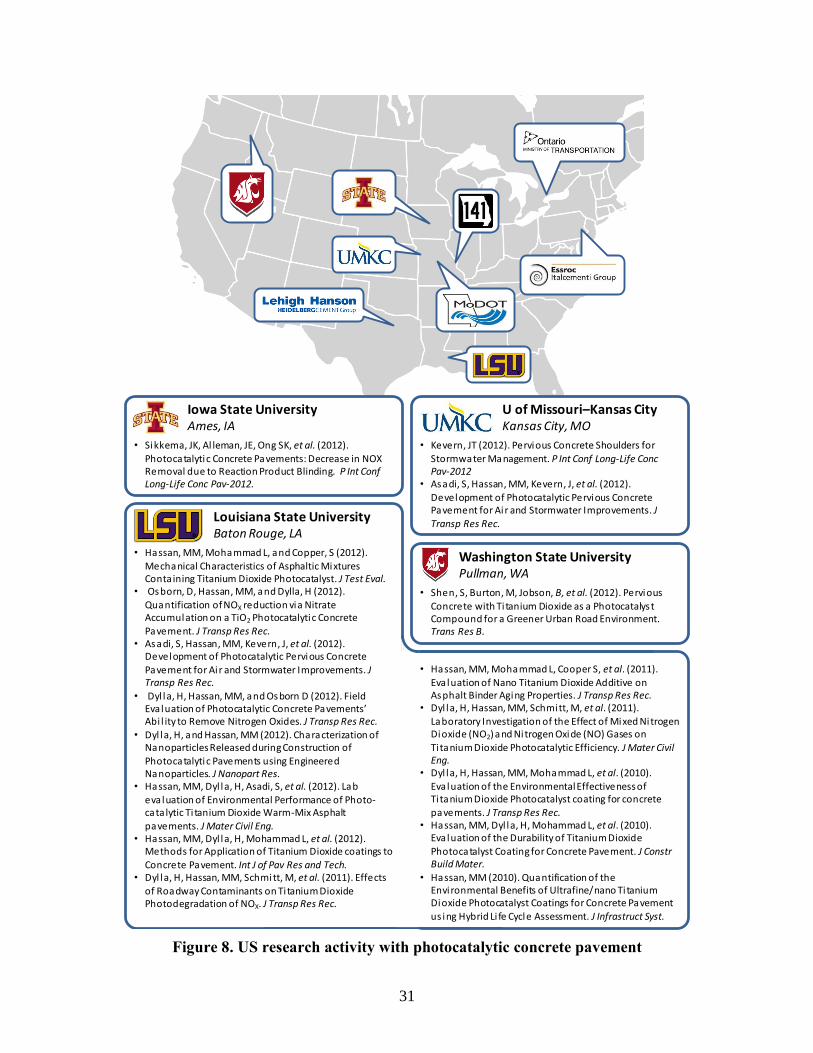
31
Figure 8. US research activity with photocatalytic concrete pavement
Iowa State UniversityAmes, IA
• Sikkema, JK, Al leman, JE, Ong SK, et al. (2012). Photocatalytic Concrete Pavements: Decrease in NOX Removal due to Reaction Product Blinding. P Int ConfLong-Life Conc Pav-2012.
Louisiana State UniversityBaton Rouge, LA
• Hassan, MM, Mohammad L, and Copper, S (2012). Mechanical Characteristics of Asphaltic Mixtures Containing Titanium Dioxide Photocatalyst. J Test Eval.
• Osborn, D, Hassan, MM, and Dylla, H (2012). Quantification of NOX reduction via Nitrate Accumulation on a TiO2 Photocatalytic Concrete Pavement. J Transp Res Rec.
• Asadi, S, Hassan, MM, Kevern, J, et al. (2012). Development of Photocatalytic Pervious Concrete
Pavement for Ai r and Stormwater Improvements. J Transp Res Rec.
• Dyl la, H, Hassan, MM, and Osborn D (2012). Field Evaluation of Photocatalytic Concrete Pavements’ Abi l ity to Remove Nitrogen Oxides. J Transp Res Rec.
• Dyl la, H, and Hassan, MM (2012). Characterization of Nanoparticles Released during Construction of Photocatalytic Pavements using Engineered Nanoparticles. J Nanopart Res.
• Hassan, MM, Dyl la, H, Asadi, S, et al. (2012). Lab evaluation of Environmental Performance of Photo-cata lytic Ti tanium Dioxide Warm-Mix Asphalt pavements. J Mater Civil Eng.
• Hassan, MM, Dyl la, H, Mohammad L, et al. (2012). Methods for Application of Titanium Dioxide coatings to
Concrete Pavement. Int J of Pav Res and Tech. • Dyl la, H, Hassan, MM, Schmitt, M, et al. (2011). Effects
of Roadway Contaminants on Ti tanium Dioxide Photodegradation of NOX. J Transp Res Rec.
Washington State UniversityPullman, WA
• Shen, S, Burton, M, Jobson, B, et al. (2012). Pervious
Concrete with Ti tanium Dioxide as a PhotocatalystCompound for a Greener Urban Road Environment. Trans Res B.
• Kevern, JT (2012). Pervious Concrete Shoulders for Stormwater Management. P Int Conf Long-Life ConcPav-2012
• Asadi, S, Hassan, MM, Kevern, J, et al. (2012).
Development of Photocatalytic Pervious Concrete Pavement for Air and Stormwater Improvements. J
Transp Res Rec.
U of Missouri–Kansas CityKansas City, MO
• Hassan, MM, Mohammad L, Cooper S, et al. (2011).
Evaluation of Nano Titanium Dioxide Additive on Asphalt Binder Aging Properties. J Transp Res Rec.
• Dyl la, H, Hassan, MM, Schmitt, M, et al. (2011). Laboratory Investigation of the Effect of Mixed Nitrogen Dioxide (NO2) and Nitrogen Oxide (NO) Gases on Titanium Dioxide Photocatalytic Efficiency. J Mater Civil Eng.
• Dyl la, H, Hassan, MM, Mohammad L, et al. (2010). Eva luation of the Environmental Effectiveness of Ti tanium Dioxide Photocatalyst coating for concrete pavements. J Transp Res Rec.
• Hassan, MM, Dyl la, H, Mohammad L, et al. (2010). Eva luation of the Durability of Titanium Dioxide
Photocatalyst Coating for Concrete Pavement. J ConstrBuild Mater.
• Hassan, MM (2010). Quantification of the Environmental Benefits of Ultrafine/nano Titanium Dioxide Photocatalyst Coatings for Concrete Pavement us ing Hybrid Li fe Cycle Assessment. J Infrastruct Syst.

32
Figure 9. Non-US research activity with photocatalytic concrete pavement
University of TwenteEnschede, Netherlands
• Bal lari, MM. Yu, QL, & Brouwers, HJH (2011).
Experimental study of the NO and NO2 degradation by photocatalytically active concrete. Catal Today.
• Bal lari, MM, Hunder, M, Husken, G et al. (2010). Model ling and experimental study of the NO x photocatalytic degradation employing concrete
pavement with titanium dioxide. Catal Today.• Bal lari, MM, Hunger, M, Husken, G, et al. (2010). NOx
photocatalytic degradation employing concrete
pavement containing ti tanium dioxide. Appl Catal B-Environ.
• Hunger, M, Husken, G, & Brouwers, HJH (2010). Photocatalytic degradation of air pollutants – From modeling to large scale application. Cement Concrete
Res.• Bal lari, MM, Hunger, M, Husken, G et al. (2009).
Heterogeneous Photocatalysis Applied to Concrete Pavement for Air Remediation. P 3rd Int Sym Nanotech in Constr.
• Husken, G, Hunger, M, & Brouwers HJH (2009). Experimental study of photocatalytic concrete products
for a i r purification. Build Environ.• Hunger, M, Husken, G, & Brouwers, HJH (2008).
Photocatalysis applied to concrete products: Part 1: Principles and test procedure. ZKG Int.
• Hunger, M, Husken, G, & Brouwers, HJH (2008).
Photocatalysis applied to concrete products: Part 2: Influencing factors and product performance. ZKG Int.
• Hunger, M, Husken, G, & Brouwers, HJH (2008).
Photocatalysis applied to concrete products: Part 3: Practical relevance and modeling of the degradation process. ZKG Int.
• Husken, G & Brouwers, HJH (2008). Ai r purification by cementitious materials: Eva luation of air purifying
properties. P Int Conf Constr Build Mater 2008.• Husken, G., Hunger, M, & Brouwers HJH (2007).
Comparative s tudy on cementitious products containing ti tanium dioxide as photo-catalyst. Int RILEM Sym TDP 2007.
• Beeldens, A, & El ia, B (2012). A double layered
photocatalytic concrete pavement: a durable application with a ir-purifying properties. 10th Int ConfConc Pav.
• Beeldens, A, Cassar, L, & Murata, Y (2011). Applications of TiO2 Photocatalysis for Air Puri fication In Y. Ohama &
D. Van Gemert (Eds.), Application of Titanium Dioxide Photocatalysis to Construction Materials (1st ed.): Springer.
• Beeldens, A (2008). Ai r purification by pavement blocks: final results of the research at the BRRC. Transport Res Arena Eur.
• Beeldens, A (2007). Ai r purification by road materials: Results of the test project in Antwerp. Int RILEM Sym
TDP 2007.• Beeldens, A (2006). Envrionemtnal friendly concrete
pavement blocks: Air purification in the centre of Antwerp. 8th Int Conf Conc Block Pav.
• Beeldens, A (2006). An environmental friendly solution
for a i r purification and self-cleaning effect: the application of TiO2 as photocatalyst in concrete.
Transport Res Arena Eur.
Belgium Road Research CentreBrussels, Belgium
ItalcementiBergamo, Italy
• Crispino, M, Brovelli, C, Guerrini, GL, et al. (2011).
Innovation materials for road construction: Photocatalytic road pavements. 24th World Road Congress.
• Beeldens, A, Cassar, L, & Murata, Y (2011). Applications of TiO2 Photocatalysis for Air Puri fication In Y. Ohama &
D. Van Gemert (Eds.), Application of Titanium Dioxide Photocatalysis to Construction Materials (1st ed.): Springer.
• Guerrini, GL & Peccati, E (2007). Photocatalytic cementitious roads for depollution. Int RILEM Sym TDP 2007.

33
MATERIALS AND METHODS
General Site Location Details
Highway Siting, Expected Traffic Density, and Test Section Size
Highway 141 is situated within the western St. Louis metropolitan region. The general north-
south alignment of this project site is bounded on its north and south ends by intersecting Olive
(Rt 340) and Ladue Roads, respectively. This stretch of highway was originally known as Woods
Mill Road, where the original alignment of the road was located approximately one-quarter mile
to the west (see adjacent Figure 10).
Figure 10. General Highway 141 project siting overview at St. Louis, Missouri
Construction of this new highway section, therefore, significantly improves north-south traffic
flow through this area, prospectively enhances ambient air and water quality, and improves
vehicular safety for adjacent community vehicles still using the original Woods Mill Road. Both
the TX Active and conventional pavement test sections were situated on the southbound side of
this highway.
MoDOT has projected that the average daily traffic (AADT) for this newly installed section will
be approximately 46,000. When originally evaluating prospective new highway locations with
which this research project would be completed, it was believed that this traffic density would be
acceptable in terms of the correspondingly expected NO2 concentration. As reported in Cape et
al., 2004, NO2 concentrations can be expected to increase dramatically between an ADT of 0 and
26,000. However, above 26,000, NO2 concentration increases only slightly with increases in
ADT. The data from Cape et al., 2004, was compiled into a figure (i.e., see Figure 11) by HEI,
2009. At the projected AADT, our paving selection falls on the portion of the graph where the
slope of the NO2 concentration vs. distance to highway line is quite low.(Cape et al., 2004).
1500 ft
Olive St
Ladue St
1500 ft
Conventional
TX Active
TX Active
Conventional
Old Woods Mill Road

34
Figure 11. NO2 levels as a function of distance to roadway and total vehicle density. Note:
concentration was measured in µg/m3 not Hg/m3. (Adapted from data reported by Cape et
al. 2004) (HEI, 2009)
The site test section paved with TX Active material, as well as the complementary control
section paved with conventional concrete, was designed and constructed with a linear run of
1,500 ft (457 m), with an overall area of ~5,300 m2. This length and area is somewhat smaller
than the European TX Active paving study in Segrate, Italy and Vanves, France [7000 and 6000
m2 respectively with respective ADTs of 24,000 and 13,000 (Essroc, 2009; Italcementi, 2009)].
However, given the wind-blocking sound wall siting and orientation (see following section
narrative), these test section length and area was considered appropriate for the projects intended
assessment.
Figure 12. Highway 141 design profile view
Southbound
Test Pavement
Zone

35
Intent on matching wind conditions, sunlight incidence angles, sound wall shading impacts, etc.,
we situated both pavement test sections at the more northern end of the new Highway 141
section, immediately south of the southbound ramp leaving Olive Rd on the north side of the
project area. Figure 13 shows the southbound perspective of this highway section within the TX
Active test zone, with the adjacent sound all seen on the right side of this view.
Figure 13. Southbound Highway 141 perspective immediately after access ramp from
Oliver Road (Rt 340)
Admittedly, our team did have a related concern about variable vehicle speeds (i.e., escalating)
for traffic heading south away from the Olive Rd. ramp, where there would be an inherent
change in engine efficiency and varied release of NO2 emissions. However, we concluded that
vehicles have reached a near-steady speed by the time they enter our first set of environmental
testing stations approximately 2000 ft beyond the end point of the Olive Road ramp.
In turn, all air, water, and test coupon samples secured during our study were obtained on the
western side of these pavement sections, within the shoulder region of these test pavement
sections (i.e., again, see red circled zone in the preceding Figure 12).
Conventional Concrete Mixture Proportions
The mainline two-lift pavement mixtures were developed by Fred Weber Inc. with guidance
from Essroc/Italicementi regarding use of the TX Active material. The coarse aggregate used
was St. Louis formation limestone with a MoDOT “D” gradation. The coarse aggregate specific
gravity was 2.64 with an absorption of 1.08%. The aggregate gradations along with the coarse
aggregate specifications are shown in Figure 14. The fine aggregate was Missouri River sand
with a specific gravity of 2.63 and absorption of 0.40%.

36
Figure 14. Impervious concrete aggregate gradations
The concrete mixture proportions are shown in Table 5. The bottom lift was a lean concrete with
25% Class C fly ash. The top lift only contained TX Active cement as to not dilute the
photoreactive properties.
Table 5. Concrete mixture proportions
Bottom Lift Top Lift
Material (pcy) (pcy)
Type I/II Cement 345 0
TX Active Cement 0 541
Fly Ash "C" 115 0
Coarse Agg. 1888 1882
Fine Agg. 1369 1226
Water 193 227
Air 6% 6%
Pervious Concrete Mixture Proportioning
Pervious concretes are a hybrid of a traditional pavement surface, a stormwater detention basin,
and a filter. Consequently, successful designs should address all three aspects. The requirements
for pervious concrete for use as a shoulder are as follows:
Strong enough to function as a shoulder pavement
Durable enough to prevent excessive concrete material-related maintenance
High enough permeability to minimize clogging maintenance
Proper hydrologic design to minimize lateral water movement
0
10
20
30
40
50
60
70
80
90
100
0.001 0.01 0.1 1
Pe
rce
nt
Pas
sin
g
Sieve Size (in.)
Max
Min
MoDOT D
PCC Sand
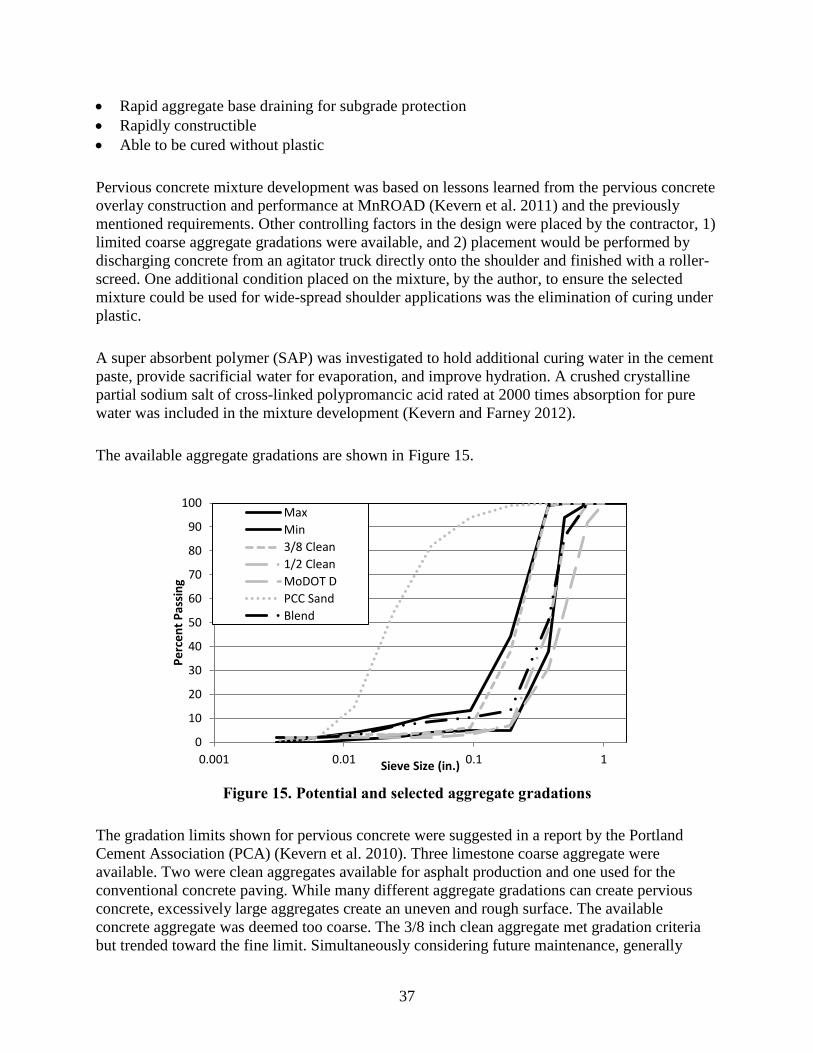
37
Rapid aggregate base draining for subgrade protection
Rapidly constructible
Able to be cured without plastic
Pervious concrete mixture development was based on lessons learned from the pervious concrete
overlay construction and performance at MnROAD (Kevern et al. 2011) and the previously
mentioned requirements. Other controlling factors in the design were placed by the contractor, 1)
limited coarse aggregate gradations were available, and 2) placement would be performed by
discharging concrete from an agitator truck directly onto the shoulder and finished with a roller-
screed. One additional condition placed on the mixture, by the author, to ensure the selected
mixture could be used for wide-spread shoulder applications was the elimination of curing under
plastic.
A super absorbent polymer (SAP) was investigated to hold additional curing water in the cement
paste, provide sacrificial water for evaporation, and improve hydration. A crushed crystalline
partial sodium salt of cross-linked polypromancic acid rated at 2000 times absorption for pure
water was included in the mixture development (Kevern and Farney 2012).
The available aggregate gradations are shown in Figure 15.
Figure 15. Potential and selected aggregate gradations
The gradation limits shown for pervious concrete were suggested in a report by the Portland
Cement Association (PCA) (Kevern et al. 2010). Three limestone coarse aggregate were
available. Two were clean aggregates available for asphalt production and one used for the
conventional concrete paving. While many different aggregate gradations can create pervious
concrete, excessively large aggregates create an uneven and rough surface. The available
concrete aggregate was deemed too coarse. The 3/8 inch clean aggregate met gradation criteria
but trended toward the fine limit. Simultaneously considering future maintenance, generally
0
10
20
30
40
50
60
70
80
90
100
0.001 0.01 0.1 1
Pe
rce
nt
Pas
sin
g
Sieve Size (in.)
Max
Min
3/8 Clean
1/2 Clean
MoDOT D
PCC Sand
Blend

38
pervious concretes with large pores and high permeability have less clogging than finer mixtures
(Kevern 2011). Consequently the ½ inch (12.5 mm) clean gradation was selected. Since the
coarse aggregate contained a large portion of voids, a relatively high sand content (22% by mass)
was used to provide sufficient strength.
The selected mixture proportions are shown in Error! Reference source not found.. The water
content shown includes a water-to-cement ratio (w/c) of 0.35 and an additional 0.05 required for
internal curing (RILEM 2007). The extra water is absorbed into the SAP, which swells.
Balancing the desired amount of voids required decreasing the cement content to maintain
appropriate mortar volume. Compared to most other pervious concrete mixtures, the mixture
shown in Error! Reference source not found. has a lower cement content and higher w/c ratio.
Admixtures include SAP at 1.5 oz/cwt (1 mL/kg) , polycarboxylate water reducer at 4 oz/cwt (3
mL/kg) , hydration stabilizer at 4 oz/cwt (3 mL/kg), and air entrainer at 1 oz/cwt (0.7 mL/kg).
One additional benefit of the SAP is better admixture efficiency provided by lubrication of the
hydrated SAP gel. Typically a one-third to one-half reduction of the admixtures used for
conventional pervious concrete produce the same results with the SAP mixtures.
At equal void contents a baseline pervious concrete mixture without SAP would contain 575 pcy
(341 kg/m3) of cement and a w/c of 0.30. When the extra cost of SAP combined with the
reductions in cement content and admixtures are factored, the SAP mixture costs $1.70 extra per
cubic yard. Additional cost savings from eliminating plastic materials and labor are highly
specific, but generally result in savings versus the control mixture.
Table 6. Selected pervious concrete mixture proportions
Specific Details with Field-Scale Air Sampling, Instrumentation, and Analyses
Both short-term active and long-term passive air monitoring methods were used during this
study, by which we might quantify the benefits to the urban environment using concrete
produced with photocatalytic cement through NO2 abatement. Of course, nitrogen dioxide levels
were measured in each case alongside pavements both with and without TX Active materials.
The latter passive method used a time-integrative diffusion reaction method for NOX, NO2,
and NO analysis, commonly referred to as an Ogawa- or Palmes-type method. Our research team
Material Amount (pcy)
TX Active Cement 510
Coarse Agg. 2030
Fine Agg. 360
Fibers 1.5
Water 200
Design Voids 24%
Design UW 114.75 pcf

39
felt that passive samplers were well-suited to this type of performance assessment, and published
results for passive testing have validated that the obtained results have been comparable to
reference methods (Hagenbjörk-Gustafsson et al., 2009; Mukerjee et al., 2009; Sather et al.,
2007).
The following four figures depict Ogawa samplers used at the 141 site, as were affixed to the
crash barriers adjacent to each pavement test section.
Figure 16. Ogawa sampler
Figure 17. Ogawa sampler with protective shroud
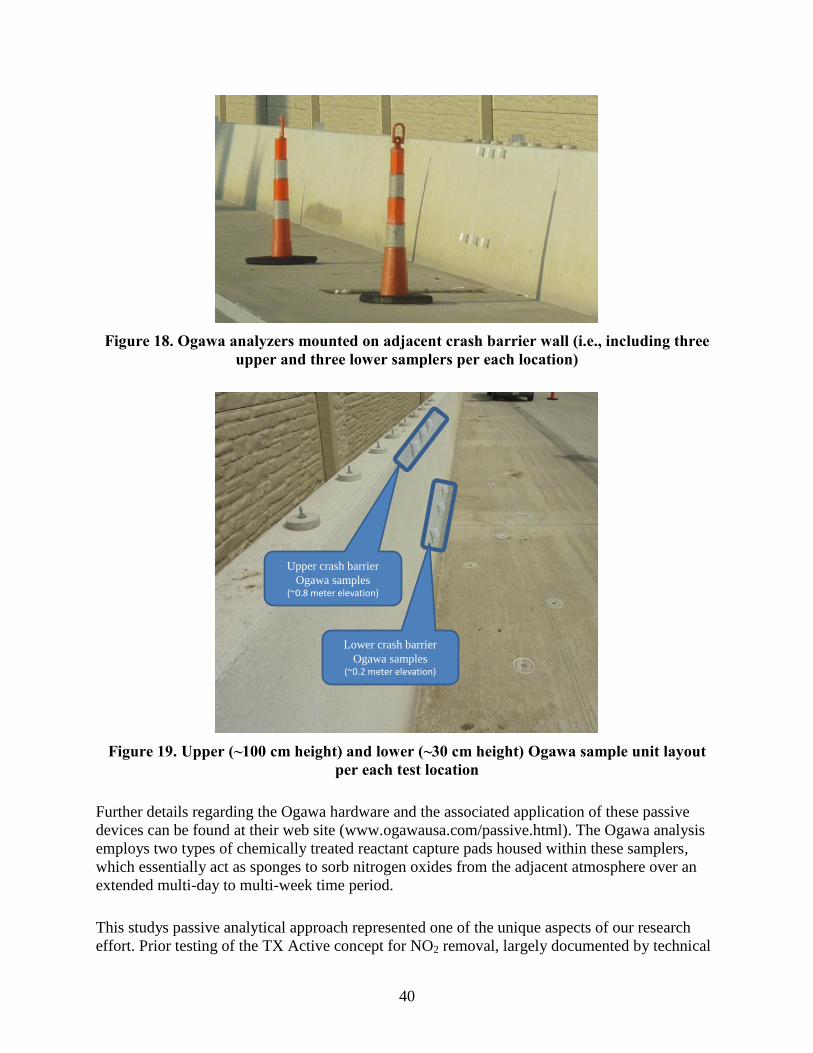
40
Figure 18. Ogawa analyzers mounted on adjacent crash barrier wall (i.e., including three
upper and three lower samplers per each location)
Figure 19. Upper (~100 cm height) and lower (~30 cm height) Ogawa sample unit layout
per each test location
Further details regarding the Ogawa hardware and the associated application of these passive
devices can be found at their web site (www.ogawausa.com/passive.html). The Ogawa analysis
employs two types of chemically treated reactant capture pads housed within these samplers,
which essentially act as sponges to sorb nitrogen oxides from the adjacent atmosphere over an
extended multi-day to multi-week time period.
This studys passive analytical approach represented one of the unique aspects of our research
effort. Prior testing of the TX Active concept for NO2 removal, largely documented by technical
Upper crash barrier
Ogawa samples(~0.8 meter elevation)
Lower crash barrier
Ogawa samples(~0.2 meter elevation)
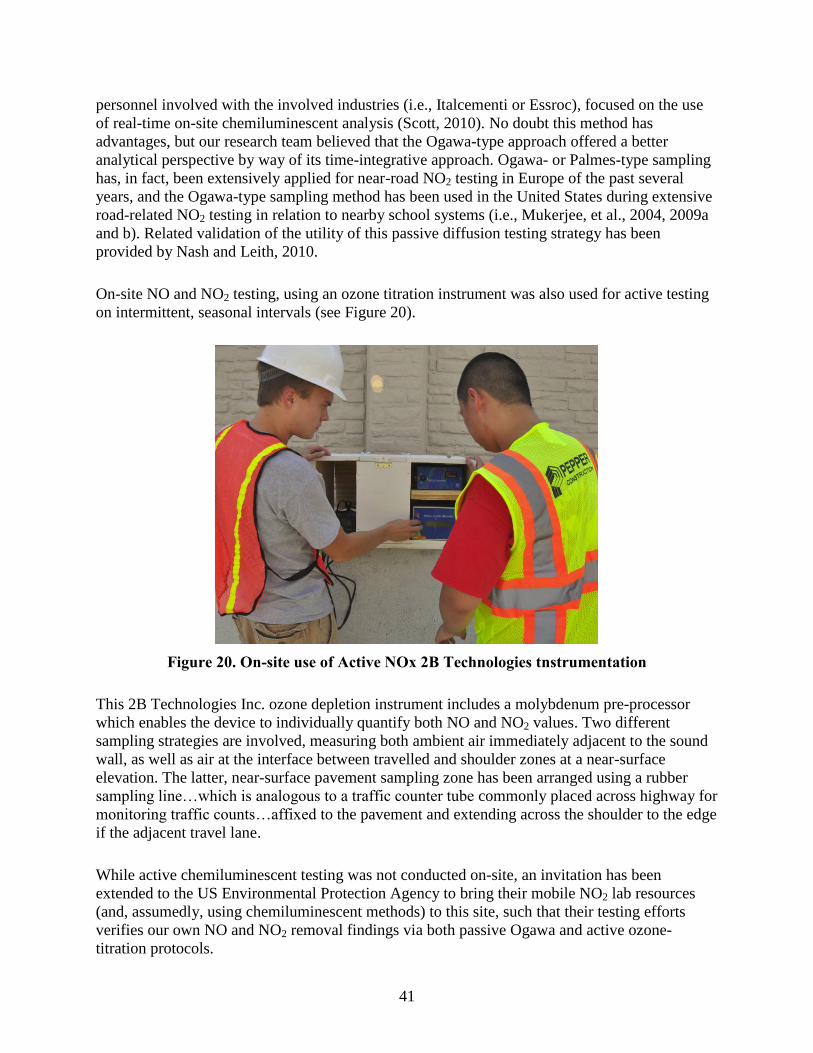
41
personnel involved with the involved industries (i.e., Italcementi or Essroc), focused on the use
of real-time on-site chemiluminescent analysis (Scott, 2010). No doubt this method has
advantages, but our research team believed that the Ogawa-type approach offered a better
analytical perspective by way of its time-integrative approach. Ogawa- or Palmes-type sampling
has, in fact, been extensively applied for near-road NO2 testing in Europe of the past several
years, and the Ogawa-type sampling method has been used in the United States during extensive
road-related NO2 testing in relation to nearby school systems (i.e., Mukerjee, et al., 2004, 2009a
and b). Related validation of the utility of this passive diffusion testing strategy has been
provided by Nash and Leith, 2010.
On-site NO and NO2 testing, using an ozone titration instrument was also used for active testing
on intermittent, seasonal intervals (see Figure 20).
Figure 20. On-site use of Active NOx 2B Technologies tnstrumentation
This 2B Technologies Inc. ozone depletion instrument includes a molybdenum pre-processor
which enables the device to individually quantify both NO and NO2 values. Two different
sampling strategies are involved, measuring both ambient air immediately adjacent to the sound
wall, as well as air at the interface between travelled and shoulder zones at a near-surface
elevation. The latter, near-surface pavement sampling zone has been arranged using a rubber
sampling line…which is analogous to a traffic counter tube commonly placed across highway for
monitoring traffic counts…affixed to the pavement and extending across the shoulder to the edge
if the adjacent travel lane.
While active chemiluminescent testing was not conducted on-site, an invitation has been
extended to the US Environmental Protection Agency to bring their mobile NO2 lab resources
(and, assumedly, using chemiluminescent methods) to this site, such that their testing efforts
verifies our own NO and NO2 removal findings via both passive Ogawa and active ozone-
titration protocols.
42
In both instances, the air sampling equipment was situated in the near-road zone, either affixed to
the Type D barrier adjacent to the tested highway sections (i.e., as in the case of our Ogawa
testing units) or sitting just behind the crash barrier (i.e., as in the case of our active NOx
instrument) and sniffing air immediately adjacent to this barrier in direct proximity to the nearby
travel lane. Our air sampling locations were positioned at each of the one-thirds length points
along their respective 1,500 foot TX Active and control pavement zones so that diluting effects
of unreacted vehicle exhaust pulled into the zone from the preceding un-reactive pavement, or
crossing over from the opposing lane, could be accounted for. In order to improve the statistical
quality of the results, triplicate sets of Ogawa samplers were mounted at each of these third-point
sampling locations at two different heights, approximately 30 and 100 cm, on the Type D barrier,
which itself is situated approximately 2 meters off the travelled pavement edge. These samplers
are being left in place for a consistent sequence of fourteen-day testing periods throughout the
duration of our study. At the end of each such two-week period, the samplers are removed for
analysis and replaced with a fresh new set of sorbent test pads.
Specific Details with Bench-Scale Air Sampling, Instrumentation, and Analyses
Bench-Scale Photoreactor Testing and Related Mortar Slab Preparations
Mortar slabs measuring 152 mm (6 in) × 152 mm (6 in) × 25 mm (1 in) were constructed. The
proportions of the cement (TX Active or Type I), water, and fine aggregate (ASTM C778
standard sand, U.S. Silica Co.) were recorded as 624 kg m-3
(1052 lb yd-3
), 262 kg m-3
(442 lb
yd-3
), and 1412 kg m-3
(2380 lb yd-3
) respectively. Given the small size of the slabs constructed,
the mix did not include coarse aggregate. Except for the coarse aggregate, the proportions used
for the laboratory mortar slabs were similar to the photocatalytic concrete paved on Route 141
near St. Louis, Missouri, where field tests are conducted Error! Reference source not found.
The slab pour used a two-lift procedure with equal volumes of a Type I cement bottom lift
followed by a TX Active photocatalytic cement top lift. Following the pour, a damp cloth and
plastic sheet were laid over the slab surface for a 24-hr period while the slab cured. In an attempt
to remove excess calcium hydroxide, the top surface was immersed in water containing
approximately 0.5% carbonic acid (i.e., carbonated water) and rigorously scoured with a plastic
bristle brush. Following this treatment the slabs were fully immersed in water (Type I reagent
grade) for 2 hours and oven-dried at 60°C (140°F) for 24 hr.
Experimental Apparatus
A bench-scale flow-through poly(methyl methacrylate) (PPMA) photoreactor served as the
primary component of the experimental apparatus. Figure 21 shows the photoreactor, along with
the NO test gas supply system, UV-A light source, and NOX analyzer.

43
Figure 21. Diagram of experimental apparatus (adapted)
The international standard, ISO 22197-1:2007(E), provided information on the construction and
operation of the set-up (ISO, 2007). The test gas supplied to the photoreactor was a mixture of
breathing air (grade D, Airgas, Inc.) and 51.6 ± 1% ppmv NO balanced in nitrogen (EPA
protocol gas, Praxair, Inc.) adjusted to obtain a desired NO concentration of 100-1500 ppbv,
relative humidity between 20-25%, and a flow rate of 3 L min-1
(0.8 gal min-1
). A UV-A light
(XX-15BLB, Ultra-Violet Products, LLC), directed at the quartz optical window located at the
top of the photoreactor, activated the photocatalytic properties of the mortar slab. The measured
irradiance on the slab surface was 16 W m-2
(1.1 ft lbf s-1
ft-2
). Within the reactor, 25 mm (1 in)
wide PMMA spacers secured the slabs position and were set at a height flush with the slab
surface. The gas flowed over the slab through a cross section with a width of 152 mm (6 in) and
a height of 6.35 mm (0.25 in). Turbulent airflow over the slab would introduce additional
variability in the test. Using the approach detailed in Husken et al. ((2009). Reynolds number
was calculated to be 42.6 using an air kinematic viscosity of 1.54 × 10⁻⁵
m2 s
-1 (1.66 × 10
-5 ft
2 s
-1)
and an air flow rate of 3 L min-1
(0.8 gal min-1
). The length (Ld) for a parabolic velocity profile to
develop in the photoreactor was estimated to be approximately 27.1 mm (1.1 in) by the following
equation:
The estimated length was slightly longer than the length of the PMMA spacers, which means that
about only 1.1% of the slab surface did not have a fully developed parabolic velocity profile.
A NOX analyzer, 2B Technologies Model 410 Nitric Oxide Monitor with a Model 401 NO2
Converter, completes the experimental apparatus. The monitor recorded the gas concentrations at
10 s intervals and cycled between NO and NOX measurements at 5 min intervals. Unlike
chemiluminescence instruments, which detect the light produced when NO reacts with ozone
(O3), the Model 410 measures the change in UV absorbance at 254 nm when O3 is consumed
AirNO
Gas-
washing
Bottle
Variable
Area Flow
Meter
Flow-Through
Photoreactor NOx
Analyzer
&
Computer
UV-A Light
Temp. &
Humidity
Sensor

44
upon reaction with NO. UV absorbance is an absolute method; therefore, the analyzer requires
calibration annually to correct for non-linearity that exists in the photodiode response and
associated electronics.
Bench-Scale Photoreactor Testing Procedure and Program
Figure 22 shows a typical set of results of the testing procedure for an airflow of 3 L min-1
(0.8
gal min-1
) and a relative humidity of 23%.
Figure 22. Representative results from experimental bench-scale testing of photocatalytic
mortar specimens
Initially, the supplied test gas was bypassed directly to the NOX monitor without passing through
the photoreactor. After adjusting parameters to desired values, the gas supply was redirected
through the photoreactor (see point 1 in Figure 22). Flow was maintained through the
photoreactor for a period sufficient to reach steady-state conditions (typically 2 h for the
researchers apparatus). Testing of the slabs photocatalytic properties began when the UV-A light
was turned on (at point 2 in Figure 20) and continued for a 5-h period. To finish the test, the UV-
A and NO gas supply were turned off and air supply was maintained for a 30 min period (see
point 3 in Figure 22). The inlet NO concentration was tracked by bypassing the airflow directly
to the NOX monitor at intermittent periods.
0
200
400
600
800
1000
1200
1400
0 1 2 3 4 5 6 7 8
Con
cen
trati
on
(p
pb
v)
Time (hr)
(1)
NO concentration at reactor inlet
NOX concentration at reactor outlet
NO concentration at reactor outlet
(2) (3)
(1) Begin test gas contact with slab
(2) Turn UV-A light on
(3) Turn UV-A light and NO gas supply off, maintain air supply

45
Of note, because the experimental apparatus was constructed using high-precision valves (as
opposed to a gas calibrator or mass flow controllers) inlet NO concentration increased with time
during each test but this gradual increase did not interfere with evaluation of the decrease in NOX
removal.
Following completion of these tests, percent NOX removal was calculated for various times
throughout each test as follows:
where,
and
.
Analysis of Bench-Scale Sample Specimens Using Scanning Electron Microscope-Energy
Dispersive Spectroscopy
Following the photo-reactor tests, a FEI Quanta 250 was used to collect Scanning Electron
Microscope-Energy Dispersive Spectroscopy (SEM-EDS) data from a subsection of mortar
separated from each slab. Investigation of the removal of reaction products from the slab surface
was facilitated by using the microscope to collect data from a subsection of each slab that was
washed by multiple one hour immersions in water (Type I reagent grade).
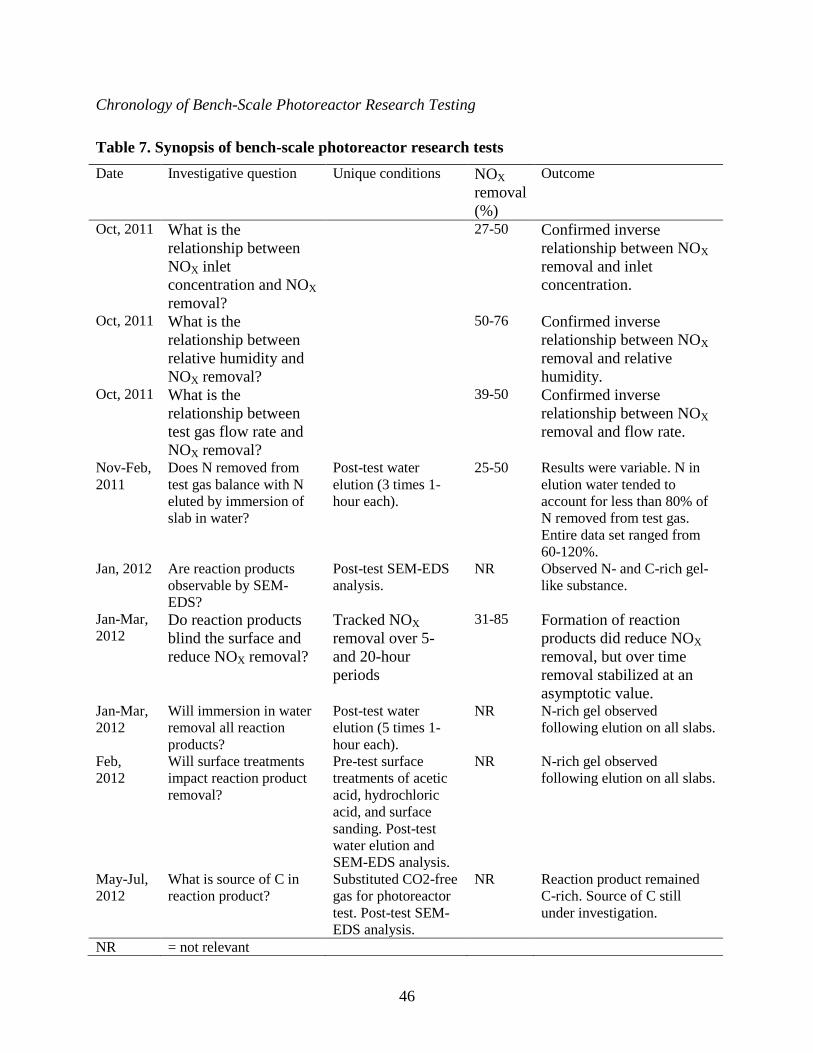
46
Chronology of Bench-Scale Photoreactor Research Testing
Table 7. Synopsis of bench-scale photoreactor research tests
Date Investigative question Unique conditions NOX
removal
(%)
Outcome
Oct, 2011 What is the
relationship between
NOX inlet
concentration and NOX
removal?
27-50 Confirmed inverse
relationship between NOX
removal and inlet
concentration.
Oct, 2011 What is the
relationship between
relative humidity and
NOX removal?
50-76 Confirmed inverse
relationship between NOX
removal and relative
humidity. Oct, 2011 What is the
relationship between
test gas flow rate and
NOX removal?
39-50 Confirmed inverse
relationship between NOX
removal and flow rate.
Nov-Feb,
2011
Does N removed from
test gas balance with N
eluted by immersion of
slab in water?
Post-test water
elution (3 times 1-
hour each).
25-50 Results were variable. N in
elution water tended to
account for less than 80% of
N removed from test gas.
Entire data set ranged from
60-120%.
Jan, 2012 Are reaction products
observable by SEM-
EDS?
Post-test SEM-EDS
analysis.
NR Observed N- and C-rich gel-
like substance.
Jan-Mar,
2012 Do reaction products
blind the surface and
reduce NOX removal?
Tracked NOX
removal over 5-
and 20-hour
periods
31-85 Formation of reaction
products did reduce NOX
removal, but over time
removal stabilized at an
asymptotic value. Jan-Mar,
2012
Will immersion in water
removal all reaction
products?
Post-test water
elution (5 times 1-
hour each).
NR N-rich gel observed
following elution on all slabs.
Feb,
2012
Will surface treatments
impact reaction product
removal?
Pre-test surface
treatments of acetic
acid, hydrochloric
acid, and surface
sanding. Post-test
water elution and
SEM-EDS analysis.
NR N-rich gel observed
following elution on all slabs.
May-Jul,
2012
What is source of C in
reaction product?
Substituted CO2-free
gas for photoreactor
test. Post-test SEM-
EDS analysis.
NR Reaction product remained
C-rich. Source of C still
under investigation.
NR = not relevant

47
Specific Details with Field-Scale Water Quality Instrumentation and Analyses
The water-quality related objective of this research project was intended to quantify the benefits
to the urban environment of concrete produced with photocatalytic cement through stormwater
runoff testing and temperature measurements. Representative stormwater runoff samples are
collected from a standard roadway control section, the section containing photocatalytic two-lift
concrete, after additional treatment through a photocatalytic pervious concrete shoulder section,
and compared with treatment through a conventional pervious concrete shoulder section.
Embedded temperature sensors and determination of actual material thermal capacities are used
to model heat storage and release using multiphysical modeling.
Urbanization allows concentrated centers for societal development. Unfortunately, urbanization
also negatively changes the environment and is impacting the global climate. Large areas of
impervious surfaces are needed for buildings and roadways to allow society to flourish.
However, runoff from urban areas is a leading cause of surface water impairment. Impervious
surfaces increase stormwater runoff volume and rates, concentrates pollutants, raises air
temperatures causing the urban heat island, and decreases air quality. Cool pavements and most
recently research on pervious concrete pavements are technologies to help mitigate the urban
heat island. TX Active concrete containing titanium dioxide which acts as a catalytic surface for
degradation of affixed pollutants. The white color reduces energy absorbed by the surface and
the photocatalyst degrades the pollutants before being washed off in the stormwater runoff. The
high exposed surface area of pervious concrete allows more contact with air pollutants, possibly
further cleaning the stormwater.
The stormwater collection and monitoring of the TX Active travel lane section is shown in
Figure 23.
Figure 23. Collection and monitoring for TX Active section, representative of both sections
(not to scale)
A 25 ft trench drain was installed at the edge of pavement. Water is directed to a center catch
basin which drains to a 6 inch pipe day-lighted to the ditch. An additional conduit was installed

48
as a wire chase back to the monitoring equipment. The automated sampling tube was installed at
the bottom of the catch basin. A pressure transducer determines the water height above a V-notch
weir while a conductivity sensor initiates sampling. A rain gauge and air temperature sensor
were mounted at the location of the TX Active runoff autosampler equipment.
An additional wire chase conduit was installed between the TX Active surface collection and the
pervious concrete shoulder subsurface collection for routing temperature sensor wires.
Temperature sensors were hand-installed into the travel lane pavement section just prior to, and
during, paving. Temperature sensors were installed in the aggregate base, at aggregate base/base
concrete lift interface, at base concrete lift/TX Active interface, and at mid-level in the TX
Active overlay.
Figure 24 shows the typical trench drain section. Figure 25 shows the selected product and
installation prior to concrete paving.
Figure 24. Typical trench drain section (not to scale)
Figure 25. Polycast trench drain information
The molded polycarbonate sections are attached to the underlying soil. The grates are ductal iron
mounted slightly lower than the pavement surface and attached with flush bolts to prevent snow
plow damage. The side sections drain to a center catch basin with knockout for a 6 in. discharge
pipe to the ditch.

49
TX Active with Water Collection after Pervious Shoulder System
The installation configuration for the pervious concrete shoulder section is shown in Figure 26.
Figure 26. Pervious concrete shoulder collection and monitoring (not to scale)
The pervious concrete test section was located 25 ft from the surface runoff section to minimize
impacting stormwater volume. A 6 in. slotted PVC standpipe was installed into the aggregate
base/soil interface to the pavement surface for sensor access (see Figure 27).
Figure 27. TX Active testing layout
A 25 ft 6 in. pvc tile pipe was installed horizontally at 3 in. above the natural soil level allowing
infiltration of the water quality volume, but preventing water being held against the roadway
subgrade. The standpipe/tile section was discharged to the ditch. The standpipe top was installed
slightly lower than final grade with a removable screw cap to ensure the pipe will not interfere
with snowplowing operations. A conduit pipe chase was installed between the standpipe and the
sensor vault.

50
Temperature sensors were installed throughout the pervious concrete TX Active section and
routed to the standpipe conduit. Temperature sensors were hand-installed into the pervious
pavement section just prior to, and during, paving.
Figure 27 shows the layout of the test sections and location of monitoring equipment. The
shoulder and pavement test sections are 25 ft long separated by a 25 ft section which contains the
pavement temperature sensors. The monitoring equipment is centrally-located on the outside of
the soundwall.
Control Pavement Section with Standard Shoulder
Control values for stormwater runoff volume, rate, and pollutant concentration will be obtained
from a nearby standard pavement section located at STA 223+50. A trench drain setup was
installed adjacent to the shoulder as detailed for section 1. The control and TX Active sections
are 300 ft apart. All equipment installed and described for the TX Active section was installed in
the control section, except the weather station. Only one site weather station was installed at the
location of the TX Active test site.
Analytical Testing
The sections will be monitored for stormwater volume, stormwater pollutant concentration, and
thermal behavior. Automated samplers will obtain water samples for collecting representative
stormwater samples. The primary pollutants of concern in relation to pavement runoff are
hydrocarbons (i.e., vehicle fuels and lubricant grease and oils) and suspended solids. Since
autosamplers are not particularly suited to the collection of hydrocarbon or grease-oil samples,
chemical oxygen demand (COD) will be used as surrogate indicators of their presence. Should
hydrocarbons levels be lower than the COD test limit, COD testing will be discontinued. Other
water quality indicators will include total suspended solids (TSS), turbidity, and pH. The
pressure sensors for water quantity will also determine water temperature. Another unique aspect
of this water-quality testing effort is that nitrate testing will also be conducted with these runoff
samples, as a secondary indication of NO2 removal as mentioned in relation to air-quality
benefits. Nitrate content will be determined using a cadmium reduction technique.
Water quality concentrations are affected by antecedent dry days, and total rainfall and ADT.
The testing plan is anticipated to encompass all significant influencing factors over the project
duration. Traffic counters will be installed at the site, immediately south of the ramp and north of
the two test sections to allow collection of traffic count, composition, and vehicle speed.
Temperature will also be monitored at each boundary layer in the concrete systems and at the
center of the TX Active overlay and the pervious concrete shoulder. Surface temperature will be
manually-collected on days samples and data are downloaded from the site. It is expected that
the site will be visited at least every two-weeks. No rainfall occurred during construction and
prior to opening and there was no opportunity for background data collection.

51
Since pavement albedo and solar reflectance index (SRI) are important for green building
certification and urban heat island modeling, SRI are being measured throughout the project.
Typical concrete pavement initially has a high SRI and then decreases with usage. The self-
cleaning aspect of the TX Active should be demonstrated using SRI values over time. The raw
energy balance used to calculate SRI will also be used in the multi-physical model for heat
transfer.
Initial field infiltration was measured on the pervious concrete shoulder using a randomized
testing plan. Additional testing will be performed every 3 months afterward to determine the
reduction in permeability over time.
Additional Site Meteorological Testing
The project site has been equipped with a weather station, with wind speed, wind direction, solar
irradiation, and temperature gauge (i.e., see Figure 28). The instruments included within this
weather station are a thermometer/relative humidity sensor (Campbell Scientifics CS215),
pyranometer (Campbell Scientifics CS300), wind speed and direction sensor (RM Young 03002-
5), and a tipping bucket rain gauge (Hydrological Services TB4).
Figure 28. Sensor vault and temporary weather station installation

52
Pavement Coupon Sampling and Analyses
Bulk slab specimens were created for both the TX Active overlay and the pervious concrete
shoulder. Actual specific heat capacity is being measured using a semi-adiabatic setup developed
for quantifying actual construction material thermal capacities. Samples will also be treated with
various levels of pollutants and exposed to UV light. Albedo and simulated stormwater runoff
water quality will be measured.
Complementary Lab Assessment of TX Active Coupons
Photo-reactive conversion of NO2 and deposition of ionic nitrate onto the TX Active surface will
be further quantified and characterized with use of sample coupons. These coupons will be
mounted on top of the concrete barrier (approximately 1 m above the roadway) and set in wells
cut into the concrete shoulder. Figure 29 offers an approximate sense of this mounting approach.
Figure 29. Paving overview with top TX Active layer in foreground
When installed in, the coupons will be flush with the pavement to minimize any change in the
shoulder safety performance. At each Ogawa sampling point, 40 to 50 coupons will be placed.
These coupons can be exchanged at various intervals to document NO2 removal effectiveness of
both fresh and aged materials. This strategy that directly measures nitrate formation and adhesion
will provide the study with direct procedures for quantifying NO/NO2 removal and conversation
to bound nitrate by way of photo-reactive conversion.
TX ACTIVE CONCRETE COUPON #2
BARRIER CURB (TYPE D)
Wall-mounted Ogawa samplers
Wall-mounted Ogawa samplers
Wall-mounted Ogawa samplers
Barrier-mounted Ogawa samplersBarrier-mounted Ogawa samplers
for NO2 and NOx testing
RECESSED MOUNTING BOLT
TX ACTIVE CONCRETE COUPON #1
TX ACTIVE CONCRETE COUPON MOUNTING
TX ACTIVE CONCRETE COUPON SET
TX ACTIVE CONCRETE COUPON SET

53
As mentioned previously, following invitation, active chemiluminescent testing will be
conducted in parallel with a second, active ozone-titration method, such that both sets of results
can be directly compared. This parallel testing scheme will then validate our use of the active
ozone-titration method for on-site field testing in lieu of the more commonly employed
chemiluminescent method.

54
CONSTRUCTION CHRONOLOGY AND HIGHLIGHTS
October 24, 2011
The southbound 141 mainline two-lane section was paved on this day using a two-lift
placement with a top TX Active section at a depth of approximately 2 inches (~5 cm).
Representatives from MoDOT, FHWA, Essroc, Iowa State University, and University of
Missouri-Kansas City were present for this initial pour.
A schematic overview of this location is given on the following page.
Google Earth or Bing Maps coordinates for this location are as follows: 38°4026.25"N
90°2938.39"W
Approximately 1,500 linear feet of the southbound two-lane mainline paving was placed at
this time.
Representative photographs taken during this paving activity are provided on the following
pages. Web archived photographs and video (including alternative *.WMV, MPG, and MTS
video formats) taken this day are also available at the following Web URL:
http://home.eng.iastate.edu/~jea/TX-Active-Project

55
Figure 30. Paving overview with top TX Active layer in foreground
Figure 31. Initial placement of TX Active mix ahead of Gomaco paver
TX Active Travel LanesPaved 24 October 2011
Southbound, 1500’ length, 24’width
TX Active Auxiliary LanePaved 1 November 2011
Southbound, 1500’ length, 12’ width
TX Active Pervious ShoulderPaving scheduled for early Spring 2012
Southbound, 75’ length, 5’ width

56
Figure 32. Dr. John Kevern (University of Missouri – Kansas City) collecting TX Active
mix samples
Figure 33. Jim Grove – FHWA Office of Pavement Technology
Figure 34. Jim Grove – FHWA Office of Pavement Technology

57
November 1, 2011
Another mainline single-lane section was paved on this day, again using a two-lift placement
with a top TX Active section at a depth of approximately 2 inches (~5 cm).
The location of this section is also shown on the preceding schematic.
Approximately 1,500 linear feet of this two-lane mainline paving was placed at this time.
Winter 2011-2012
Instrumentation used for meteorological and solar radiation monitoring immediately adjacent
to the TX Active pavement area will be mounted to this sound wall and activated.
Paving of the remaining control and non-research highway sections was started.
Spring 2012
The final TX Active paving section featuring a pervious concrete shoulder was poured in the
spring.
Paving of the remaining control and non-research highway sections was completed.
The sound wall adjacent to the west side of the new road section was built during the late
Spring 2012.
Runoff collection lines used to capture representative pavement and shoulder storm-water
samples was installed during the Spring 2012 in conjunction with the latter shoulder paving
activity.
Field evaluation of NO2 and NOX presence was started in May 2012, using both Ogawa
passive samplers and 2BTechnologies active testing (i.e., based on ozone depletion protocol).
Ogawa testing was then continued on a monthly basis from May 2012 through mid August
2012.
July 14, 2012
The new highway was placed into operation.
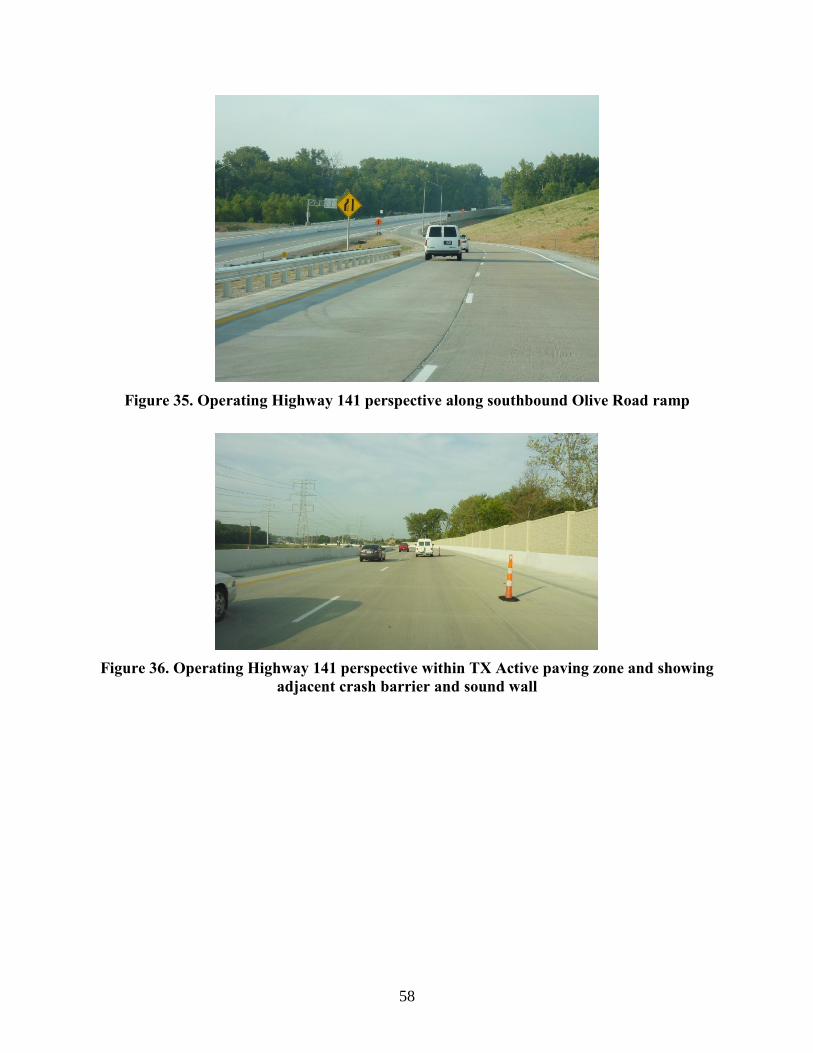
58
Figure 35. Operating Highway 141 perspective along southbound Olive Road ramp
Figure 36. Operating Highway 141 perspective within TX Active paving zone and showing
adjacent crash barrier and sound wall

59
Figure 37. Highway 141 Opening Day festivities (July 14, 2012: S.K. Ong)

60
EXPERIMENTAL RESULTS
Materials Characterization
Pervious Concrete
The standard hardened pervious concrete properties are shown in Table 8. Voids were
determined according to ASTM C1754 Standard Test Method for Density and Void Content of
Hardened Pervious Concrete (ASTM, 2012). Measured voids were higher than designed most
likely due to the edge effects caused by poor particle packing of the large aggregate along the
walls of the relatively small (4 in. by 8 in.) cylinders. The compressive strength was tested
according to ASTM C39 on sulfur-capped specimens. Sample density was fixed to control
variability. Permeability was tested using a falling-head device on 4 inch (100 mm) diameter and
6 inch (150 mm) length specimens using the procedure developed for the American Concrete
Institute (ACI) pervious concrete student competition, where specimens are covered in heat
shrink plastic and confined in a rubber membrane before testing from a water height of 9 inches
(200 mm). The high permeability was desirable for long maintenance cycles between cleaning
and for resistance to clogging.
Table 8. Hardened testing results
Results from SAP testing in pervious concrete showed a 16% increase in the degree of hydration
for sample cured at 50% relative humidity. Moisture loss testing showed the SAP mixtures
including the additional water had similar evaporation. When the extra water was considered
sacrificial, the SAP mixtures had significantly less evaporation. When ring shrinkage was tested
the SAP mixtures developed higher strength, had increased time to cracking, and retained higher
residual strength than the control mixtures. Additional information on using internal curing to
improve pervious concrete performance can be found in the author’s 2012 TRB paper “Reducing
Curing Requirements for Pervious Concrete Using a Superabsorbent Polymer for Internal
Curing” (Kevern and Farney, 2012).
Figure 38 A, B, and C shows a demonstration of the self-cleaning ability of the pavement using a
red rhodamine dye. For testing 1 mL of a 5% solution of rhodamine dye was applied to a 3 in2
(20 cm2) area. Figure 38A shows the sample before application. Figure 38B shows the sample
after the dye was applied and allowed to dry overnight. After drying the samples were placed
outside in sunlight for five hours per day from 10am to 3pm. Figure 38C shows the sample after
4 days of testing. One area of concern for future use of photocatalytic concrete is unwanted
interactions with curing compounds. Membrane-forming curing compounds prevent the air
Property Results
Voids 28%
Unit Weight 114.75pcf
Permeability 2050 in./hr
7d Comp. Str. 3200 psi
28d Comp. Str. 3355 psi
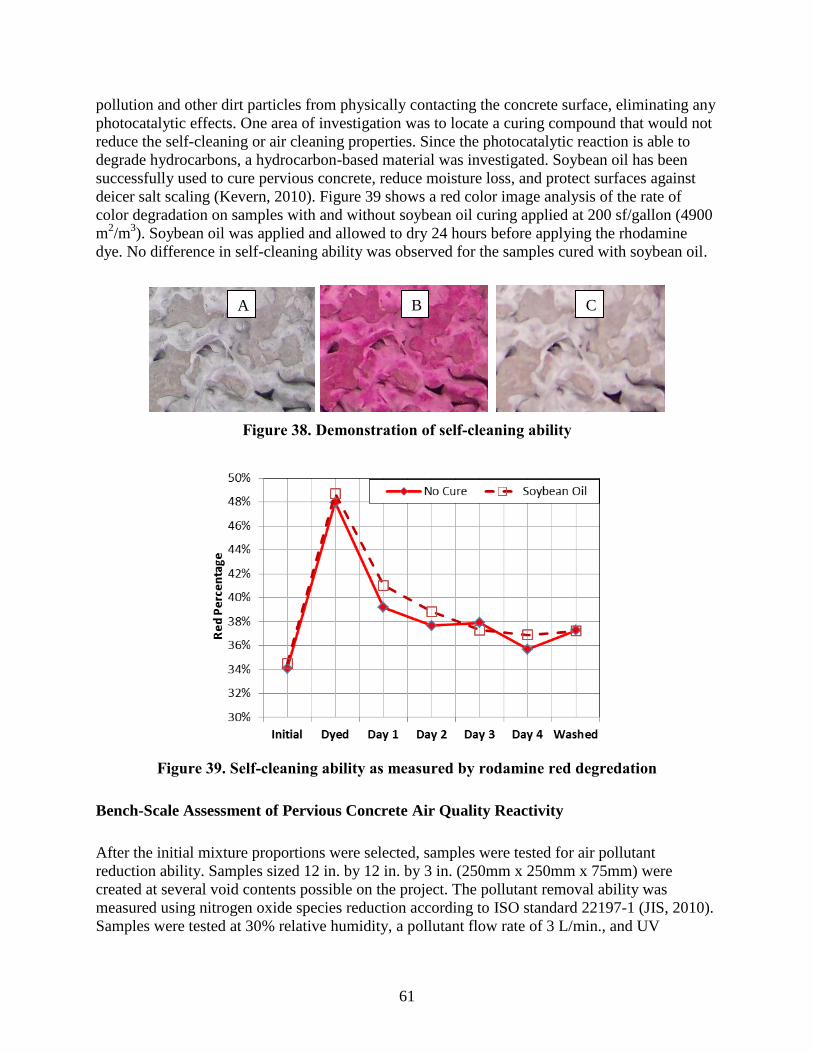
61
pollution and other dirt particles from physically contacting the concrete surface, eliminating any
photocatalytic effects. One area of investigation was to locate a curing compound that would not
reduce the self-cleaning or air cleaning properties. Since the photocatalytic reaction is able to
degrade hydrocarbons, a hydrocarbon-based material was investigated. Soybean oil has been
successfully used to cure pervious concrete, reduce moisture loss, and protect surfaces against
deicer salt scaling (Kevern, 2010). Figure 39 shows a red color image analysis of the rate of
color degradation on samples with and without soybean oil curing applied at 200 sf/gallon (4900
m2/m
3). Soybean oil was applied and allowed to dry 24 hours before applying the rhodamine
dye. No difference in self-cleaning ability was observed for the samples cured with soybean oil.
Figure 38. Demonstration of self-cleaning ability
Figure 39. Self-cleaning ability as measured by rodamine red degredation
Bench-Scale Assessment of Pervious Concrete Air Quality Reactivity
After the initial mixture proportions were selected, samples were tested for air pollutant
reduction ability. Samples sized 12 in. by 12 in. by 3 in. (250mm x 250mm x 75mm) were
created at several void contents possible on the project. The pollutant removal ability was
measured using nitrogen oxide species reduction according to ISO standard 22197-1 (JIS, 2010).
Samples were tested at 30% relative humidity, a pollutant flow rate of 3 L/min., and UV
A B C

62
intensity of 2.4 mW/cm2. In Figure 40, the error bars represent 1 standard deviation from the
mean.
Figure 40. Pollutant Removal Ability
Photocatalytic pervious concrete selected for this project had higher removal rates than
impervious photocatalytic concrete. Across the range of voids expected on the project there was
no difference in removal capacity. More information on the ability of photocatalytic pervious
concrete to remove air pollutants can be found in the Transportation Research Board paper by
Hassan (Asadi et al., 2012).
Initial testing confirmed the relationships between NOX inlet concentration, relative humidity,
and flow rate with the work of other researchers (e.g., Murata et al., 2000, Hüsken and Brouwers,
2008, Dylla et al., 2010, Ballari et al., 2011). Testing also attempted to demonstrate that N
removed from the gas stream balanced with N that has adsorbed on the slab and was converted to
a reaction product (i.e., NO3- and HNO2). These balances ranged between 60 and 120%;
however, in the great majority of cases the balance fell below 80%. This finding indicates that
either not all N from reaction products was removed by the water elution procedure or that one
of the systems N outlets was not accounted for. In a separate investigation, analysis by SEM-
EDS found that the reaction products were observable on the slab surface. With this knowledge,
the elution procedure was tested to determine whether immersing the slab in water for additional
1-hour periods would remove all reaction products from the slab surface. When tested by SEM-
EDS, the reaction products were observable even on the slabs immersed in water for a total of 5
hours (1 hour each immersion). Various pre-photoreactor test surface treatments were also tested
to determine if the reaction product would be completely eluted if the sample was prepared in a
different fashion. SEM-EDS analysis also revealed that the reaction product was rich in C.
Although N-based reaction products should not have a strong association with the product
surface, the researchers considered that the C in the product may have a different interaction with
the slab and may be more difficult to remove. Prepared slabs were quite fresh (i.e., formed less
than 1 month before the photoreactor test); therefore, the surface carbonation reaction [CO2 +
Ca(OH)2 → CaCO3 + H2O] had not gone to completion. The researchers attempted to speed up
carbonation by treating the surface with acetic acid (CH3CO2H). Slabs treated with acetic acid
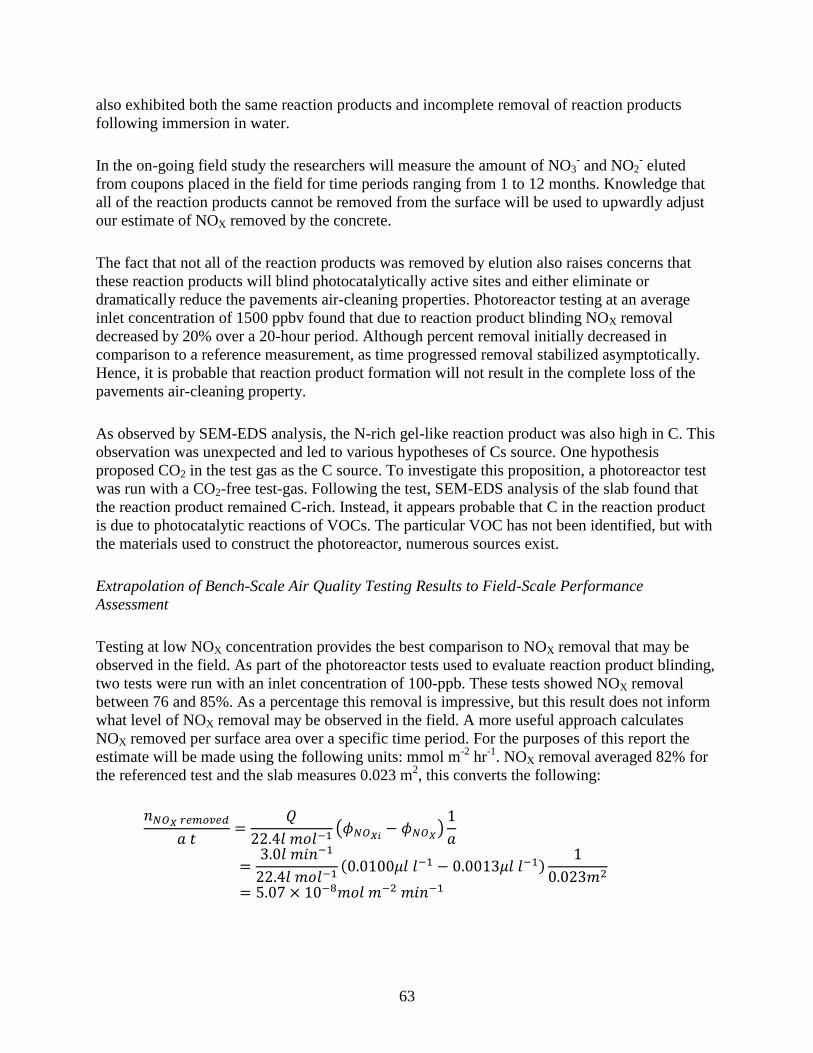
63
also exhibited both the same reaction products and incomplete removal of reaction products
following immersion in water.
In the on-going field study the researchers will measure the amount of NO3- and NO2
- eluted
from coupons placed in the field for time periods ranging from 1 to 12 months. Knowledge that
all of the reaction products cannot be removed from the surface will be used to upwardly adjust
our estimate of NOX removed by the concrete.
The fact that not all of the reaction products was removed by elution also raises concerns that
these reaction products will blind photocatalytically active sites and either eliminate or
dramatically reduce the pavements air-cleaning properties. Photoreactor testing at an average
inlet concentration of 1500 ppbv found that due to reaction product blinding NOX removal
decreased by 20% over a 20-hour period. Although percent removal initially decreased in
comparison to a reference measurement, as time progressed removal stabilized asymptotically.
Hence, it is probable that reaction product formation will not result in the complete loss of the
pavements air-cleaning property.
As observed by SEM-EDS analysis, the N-rich gel-like reaction product was also high in C. This
observation was unexpected and led to various hypotheses of Cs source. One hypothesis
proposed CO2 in the test gas as the C source. To investigate this proposition, a photoreactor test
was run with a CO2-free test-gas. Following the test, SEM-EDS analysis of the slab found that
the reaction product remained C-rich. Instead, it appears probable that C in the reaction product
is due to photocatalytic reactions of VOCs. The particular VOC has not been identified, but with
the materials used to construct the photoreactor, numerous sources exist.
Extrapolation of Bench-Scale Air Quality Testing Results to Field-Scale Performance
Assessment
Testing at low NOX concentration provides the best comparison to NOX removal that may be
observed in the field. As part of the photoreactor tests used to evaluate reaction product blinding,
two tests were run with an inlet concentration of 100-ppb. These tests showed NOX removal
between 76 and 85%. As a percentage this removal is impressive, but this result does not inform
what level of NOX removal may be observed in the field. A more useful approach calculates
NOX removed per surface area over a specific time period. For the purposes of this report the
estimate will be made using the following units: mmol m-2
hr-1
. NOX removal averaged 82% for
the referenced test and the slab measures 0.023 m2, this converts the following:
(
)

64
The surface area of the photocatalytic pavement at the field site near St. Louis measures 5000
m2. Assuming 12 hours of daylight (when the pavement is photocatalytically active), the
calculation below determines possible daily NOX removal:
As a rough extrapolation, consider a 5000 m3 volume of air (i.e., the pavement surface area and a
1 m upper boundary) that is highly polluted (i.e., the NOX concentration is at the 1-hour NO2
NAAQS, 100 ppbv). If one mole of a gas occupies 0.0224 m3, this volume of air contains 0.022
moles of NOX. A multitude of other factors will also influence the actual amount of NOX
removed by the pavement, but given that these two numbers differ by an order of magnitude, the
pavement does hold promise as an air pollution mitigation technology.
Field Water Quality Testing
Water analysis consisted of water quantity measurement and water sampling for quality analysis.
V-notch weir boxes were constructed out of schedule 40 sheet PVC, with a 30 degree V-notch
for each of the four pipes day lighted from the pervious concrete sections. A pressure transducer
was installed at the bottom of weir box, directly behind V-notch as shown in Figure 41 for water
height and temperature measurements.
Figure 41. Pressure transducer placement in weir box
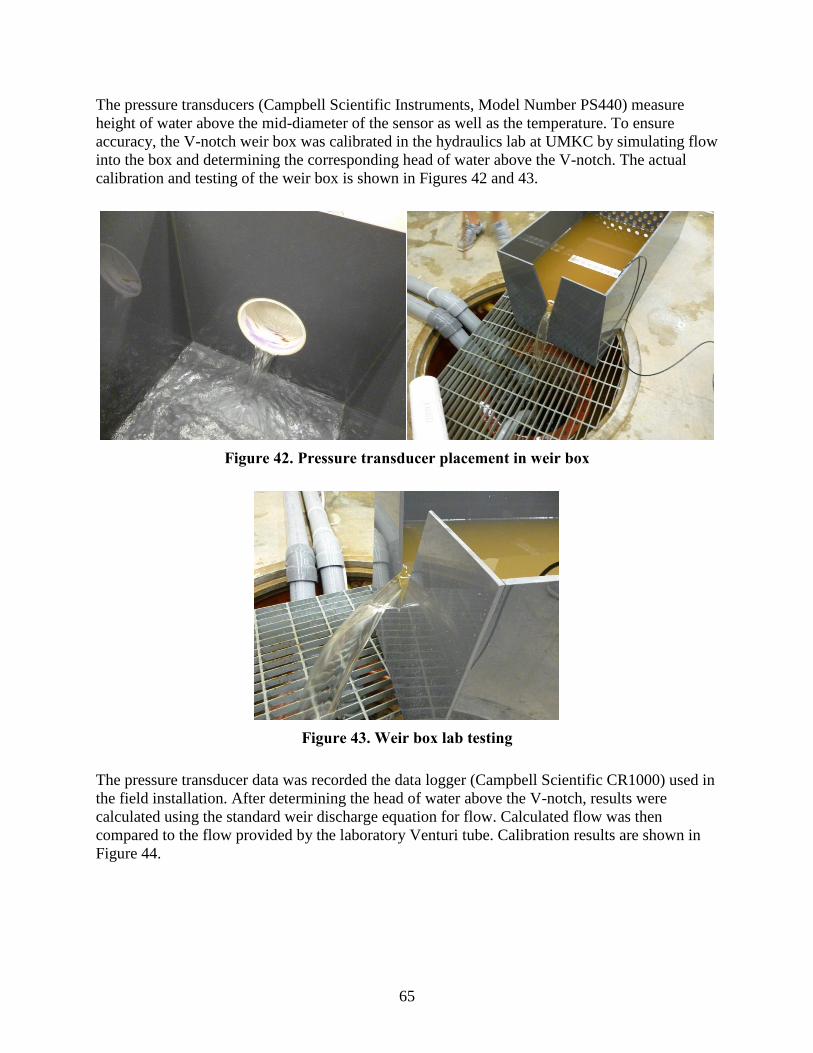
65
The pressure transducers (Campbell Scientific Instruments, Model Number PS440) measure
height of water above the mid-diameter of the sensor as well as the temperature. To ensure
accuracy, the V-notch weir box was calibrated in the hydraulics lab at UMKC by simulating flow
into the box and determining the corresponding head of water above the V-notch. The actual
calibration and testing of the weir box is shown in Figures 42 and 43.
Figure 42. Pressure transducer placement in weir box
Figure 43. Weir box lab testing
The pressure transducer data was recorded the data logger (Campbell Scientific CR1000) used in
the field installation. After determining the head of water above the V-notch, results were
calculated using the standard weir discharge equation for flow. Calculated flow was then
compared to the flow provided by the laboratory Venturi tube. Calibration results are shown in
Figure 44.

66
Figure 44. Weir box calibration results
Four weir boxes were placed in total. Figure 45 depicts a plan view of each site showing the
locations as well as the respective effective watersheds of two weir boxes. Both sections had the
same plan view, thus the figure is representative of both the photocatalytic pavement section as
well as the control section. The diagram does not show the sound wall or the barrier curb, and is
not to scale. Figures 45 show the base, the placement with support, and the final locations of the
boxes. The weather stations shown in Figure 47 were temporarily installed on the concrete vault
prior to soundwall installation. The wind speed and direction equipment were relocated to the top
of the soundwall.
Figure 45. Plan view of weir box locations (not to scale)
0.00
0.05
0.10
0.15
0.20
0.25
0 2 4 6 8 10 12 14 16 18 20
Dis
char
ge (
cfs)
Head (cm)
Weir Reiding
Venturi Reading
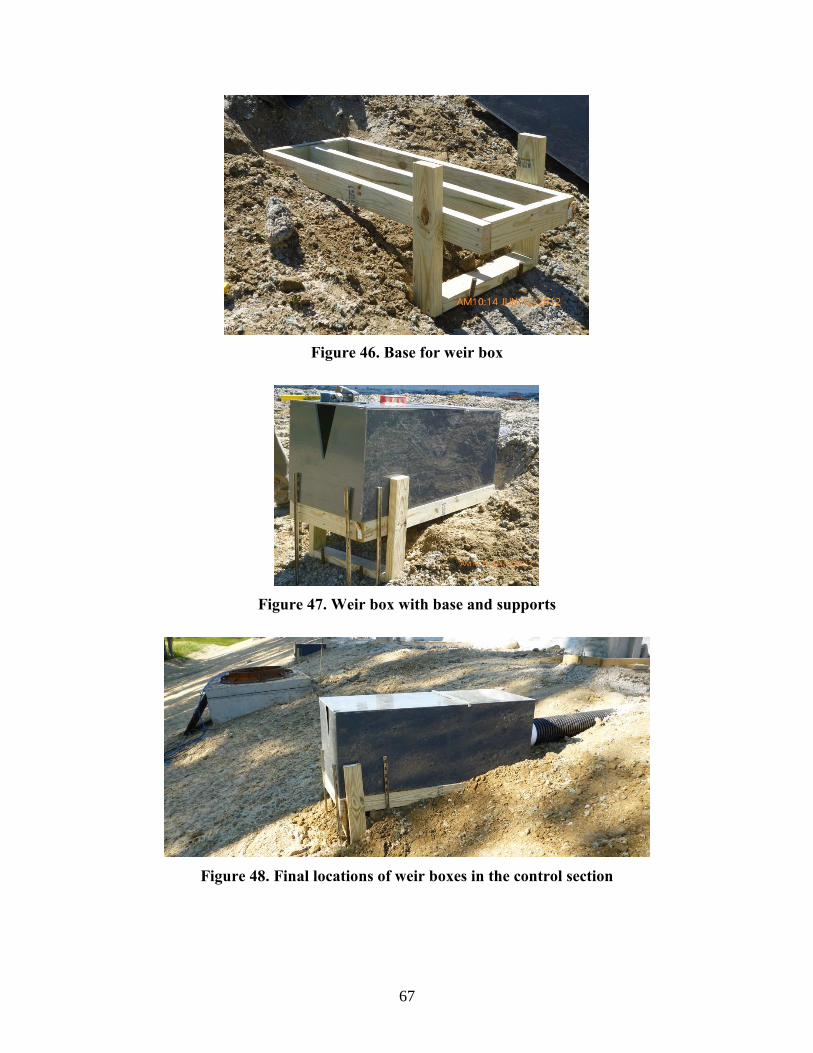
67
Figure 46. Base for weir box
Figure 47. Weir box with base and supports
Figure 48. Final locations of weir boxes in the control section

68
Figure 49. Final locations of weir boxes in the TX Active section
Each of the vaults contain two water samplers (Global Water WS700, WS750) with the intake
hose located adjacent to the pressure transducer in the weir box. The weir box from the pervious
concrete base was connected to the WS700 that has a single two gallon container (Figure 50).
The WS700 samplers are programmed to capture the first flush. Under actual conditions the
WS700 sampler is filled in approximately 35-40 minutes, with a 1000 milliliter sample collected
every five minutes. The weir box collecting the runoff from the roadway were connect to the
WS750 samplers which have two one gallon containers (Figure 51). Sampling from the roadway
surface captures both the first flush and the entire storm event. For the entire storm event a 50
milliliter sample is collected every five minutes, while first flush is 600 milliliters every five
minutes.
Figure 50. Two-gallon automated water sampler
69
Figure 51. Two one-gallon automated samplers
Water quality testing consists of determining the total suspended solids (TSS), pH, turbidity, and
nitrate concentrations. Electronic sensors are used to measure pH and turbidity. Nitrate is
determined using cadmium reduction. TSS is determined by mass retained on a glass filter. At
this time no water samples have been collected due to lack of electricity on the site.
Also, pressure sensors (CS450) were installed at the bottom of the pervious concrete aggregate
base to determine the water level within the pervious concrete shoulders. The pressure sensors
will be used to measure the rate of water level change over time for infiltration and water balance
calculations. Figure 52 shows the perforated standpipe in the aggregate base, pressure sensor,
and thermocouple wires.
Figure 52. Perforated stand pipe within aggregate base showing pressure sensor and
thermocouple wires
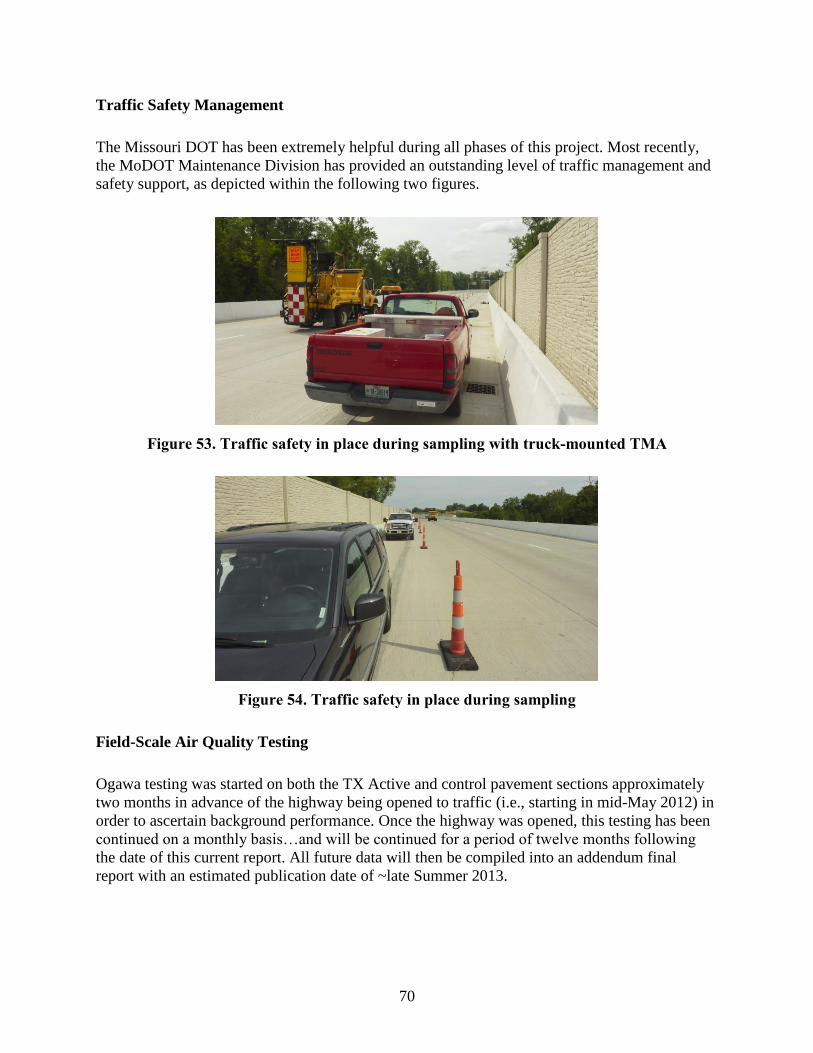
70
Traffic Safety Management
The Missouri DOT has been extremely helpful during all phases of this project. Most recently,
the MoDOT Maintenance Division has provided an outstanding level of traffic management and
safety support, as depicted within the following two figures.
Figure 53. Traffic safety in place during sampling with truck-mounted TMA
Figure 54. Traffic safety in place during sampling
Field-Scale Air Quality Testing
Ogawa testing was started on both the TX Active and control pavement sections approximately
two months in advance of the highway being opened to traffic (i.e., starting in mid-May 2012) in
order to ascertain background performance. Once the highway was opened, this testing has been
continued on a monthly basis…and will be continued for a period of twelve months following
the date of this current report. All future data will then be compiled into an addendum final
report with an estimated publication date of ~late Summer 2013.
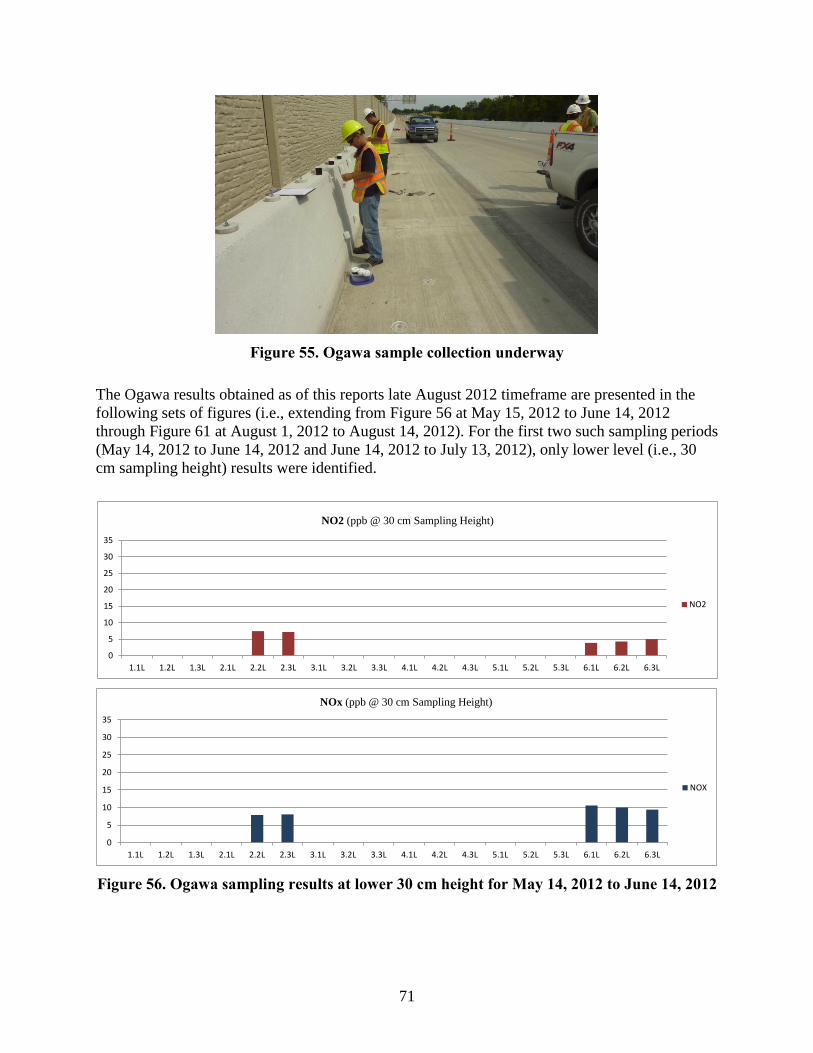
71
Figure 55. Ogawa sample collection underway
The Ogawa results obtained as of this reports late August 2012 timeframe are presented in the
following sets of figures (i.e., extending from Figure 56 at May 15, 2012 to June 14, 2012
through Figure 61 at August 1, 2012 to August 14, 2012). For the first two such sampling periods
(May 14, 2012 to June 14, 2012 and June 14, 2012 to July 13, 2012), only lower level (i.e., 30
cm sampling height) results were identified.
Figure 56. Ogawa sampling results at lower 30 cm height for May 14, 2012 to June 14, 2012
0
5
10
15
20
25
30
35
1.1L 1.2L 1.3L 2.1L 2.2L 2.3L 3.1L 3.2L 3.3L 4.1L 4.2L 4.3L 5.1L 5.2L 5.3L 6.1L 6.2L 6.3L
NOx (ppb @ 30 cm Sampling Height)
NOX
0
5
10
15
20
25
30
35
1.1L 1.2L 1.3L 2.1L 2.2L 2.3L 3.1L 3.2L 3.3L 4.1L 4.2L 4.3L 5.1L 5.2L 5.3L 6.1L 6.2L 6.3L
NO2 (ppb @ 30 cm Sampling Height)
NO2
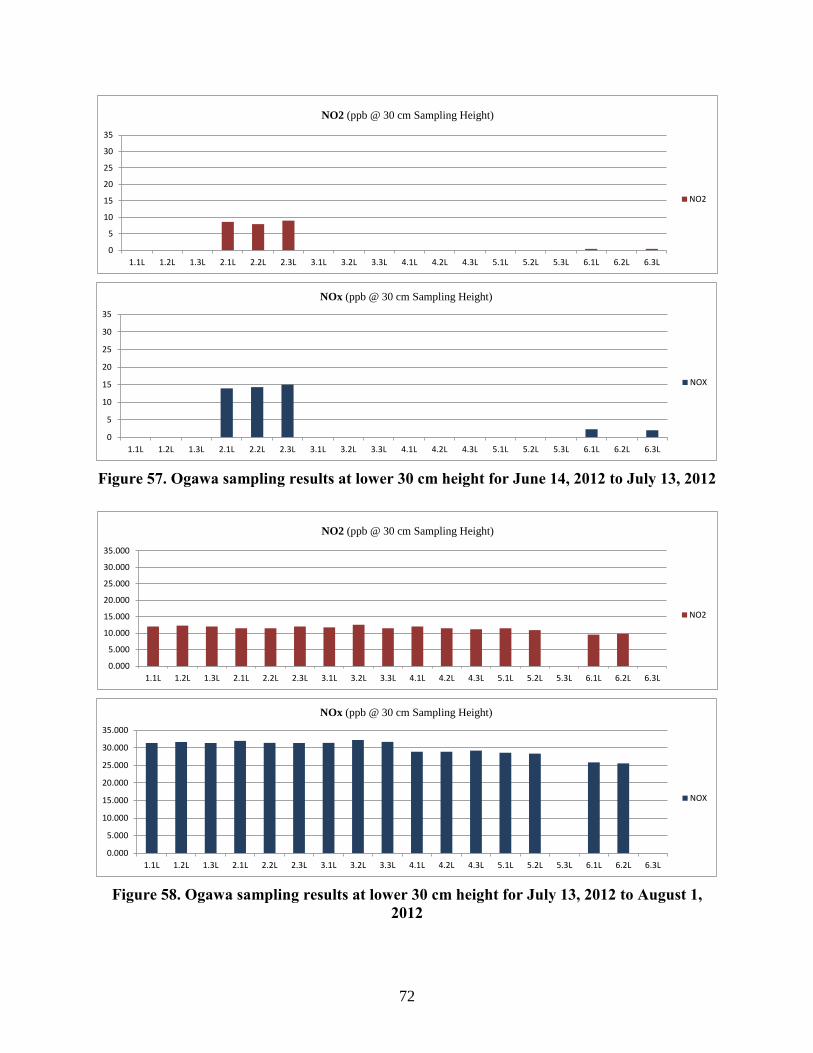
72
Figure 57. Ogawa sampling results at lower 30 cm height for June 14, 2012 to July 13, 2012
Figure 58. Ogawa sampling results at lower 30 cm height for July 13, 2012 to August 1,
2012
0
5
10
15
20
25
30
35
1.1L 1.2L 1.3L 2.1L 2.2L 2.3L 3.1L 3.2L 3.3L 4.1L 4.2L 4.3L 5.1L 5.2L 5.3L 6.1L 6.2L 6.3L
NO2 (ppb @ 30 cm Sampling Height)
NO2
0
5
10
15
20
25
30
35
1.1L 1.2L 1.3L 2.1L 2.2L 2.3L 3.1L 3.2L 3.3L 4.1L 4.2L 4.3L 5.1L 5.2L 5.3L 6.1L 6.2L 6.3L
NOx (ppb @ 30 cm Sampling Height)
NOX
0.000
5.000
10.000
15.000
20.000
25.000
30.000
35.000
1.1L 1.2L 1.3L 2.1L 2.2L 2.3L 3.1L 3.2L 3.3L 4.1L 4.2L 4.3L 5.1L 5.2L 5.3L 6.1L 6.2L 6.3L
NO2 (ppb @ 30 cm Sampling Height)
NO2
0.000
5.000
10.000
15.000
20.000
25.000
30.000
35.000
1.1L 1.2L 1.3L 2.1L 2.2L 2.3L 3.1L 3.2L 3.3L 4.1L 4.2L 4.3L 5.1L 5.2L 5.3L 6.1L 6.2L 6.3L
NOx (ppb @ 30 cm Sampling Height)
NOX
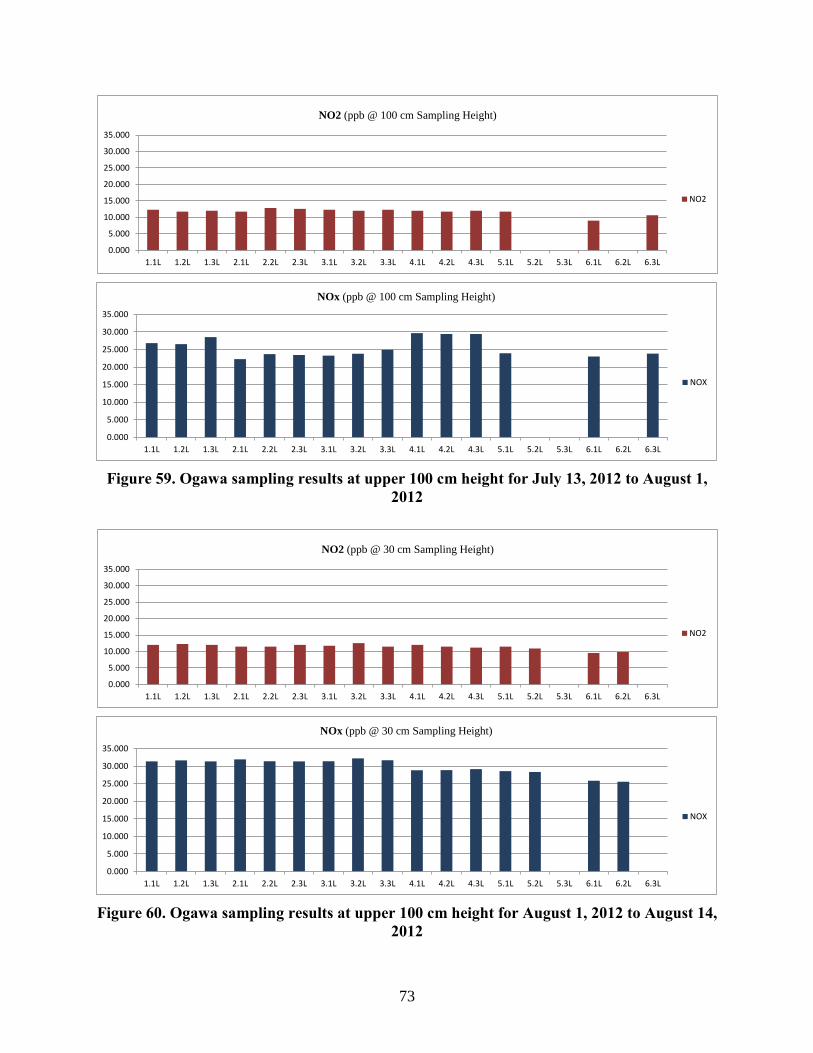
73
Figure 59. Ogawa sampling results at upper 100 cm height for July 13, 2012 to August 1,
2012
Figure 60. Ogawa sampling results at upper 100 cm height for August 1, 2012 to August 14,
2012
0.000
5.000
10.000
15.000
20.000
25.000
30.000
35.000
1.1L 1.2L 1.3L 2.1L 2.2L 2.3L 3.1L 3.2L 3.3L 4.1L 4.2L 4.3L 5.1L 5.2L 5.3L 6.1L 6.2L 6.3L
NOx (ppb @ 100 cm Sampling Height)
NOX
0.000
5.000
10.000
15.000
20.000
25.000
30.000
35.000
1.1L 1.2L 1.3L 2.1L 2.2L 2.3L 3.1L 3.2L 3.3L 4.1L 4.2L 4.3L 5.1L 5.2L 5.3L 6.1L 6.2L 6.3L
NO2 (ppb @ 100 cm Sampling Height)
NO2
0.000
5.000
10.000
15.000
20.000
25.000
30.000
35.000
1.1L 1.2L 1.3L 2.1L 2.2L 2.3L 3.1L 3.2L 3.3L 4.1L 4.2L 4.3L 5.1L 5.2L 5.3L 6.1L 6.2L 6.3L
NOx (ppb @ 30 cm Sampling Height)
NOX
0.000
5.000
10.000
15.000
20.000
25.000
30.000
35.000
1.1L 1.2L 1.3L 2.1L 2.2L 2.3L 3.1L 3.2L 3.3L 4.1L 4.2L 4.3L 5.1L 5.2L 5.3L 6.1L 6.2L 6.3L
NO2 (ppb @ 30 cm Sampling Height)
NO2

74
Figure 61. Ogawa sampling results at upper 100 cm height for August 1, 2012 to August 14,
2012
Table 9 provides a narrative overview of what these schematic results are believed to show.
Table 9. Narrative summary of Ogawa results recorded from May 14, 2012 through August
14, 2012
Sampling
Timeframe
Upper NO2
Results
Lower NO2
Results
Upper NOx
Results
Lower NOx
Results
May 14, 2012 to
June 14, 2012
- No
measurements
- The lower NO2
values were ~3-4
ppb
- No
measurements
- The lower
NOx values
ranged from
~7 ppb to 10
ppb
Conclusions:
- Without any traffic on the highway at this time, the NO2 and NOx values
were low, as expected
- Given the low level NOx levels, given the low level NOx levels, these
results did not show NO2 depletion for sampling sites 1, 2, and 3 (i.e., with
TX Active pavement) versus 4, 5, and 6
June 14, 2012 to
July 13, 2012
- No
measurements
- The lower NO2
values were ~7-8
ppb
- No
measurements
- The lower
NOx values
ranged from
~3 ppb to 15
ppb
0.000
5.000
10.000
15.000
20.000
25.000
30.000
35.000
1.1L 1.2L 1.3L 2.1L 2.2L 2.3L 3.1L 3.2L 3.3L 4.1L 4.2L 4.3L 5.1L 5.2L 5.3L 6.1L 6.2L 6.3L
NOx (ppb @ 100 cm Sampling Height)
NOX
0.000
5.000
10.000
15.000
20.000
25.000
30.000
35.000
1.1L 1.2L 1.3L 2.1L 2.2L 2.3L 3.1L 3.2L 3.3L 4.1L 4.2L 4.3L 5.1L 5.2L 5.3L 6.1L 6.2L 6.3L
NO2 (ppb @ 100 cm Sampling Height)
NO2
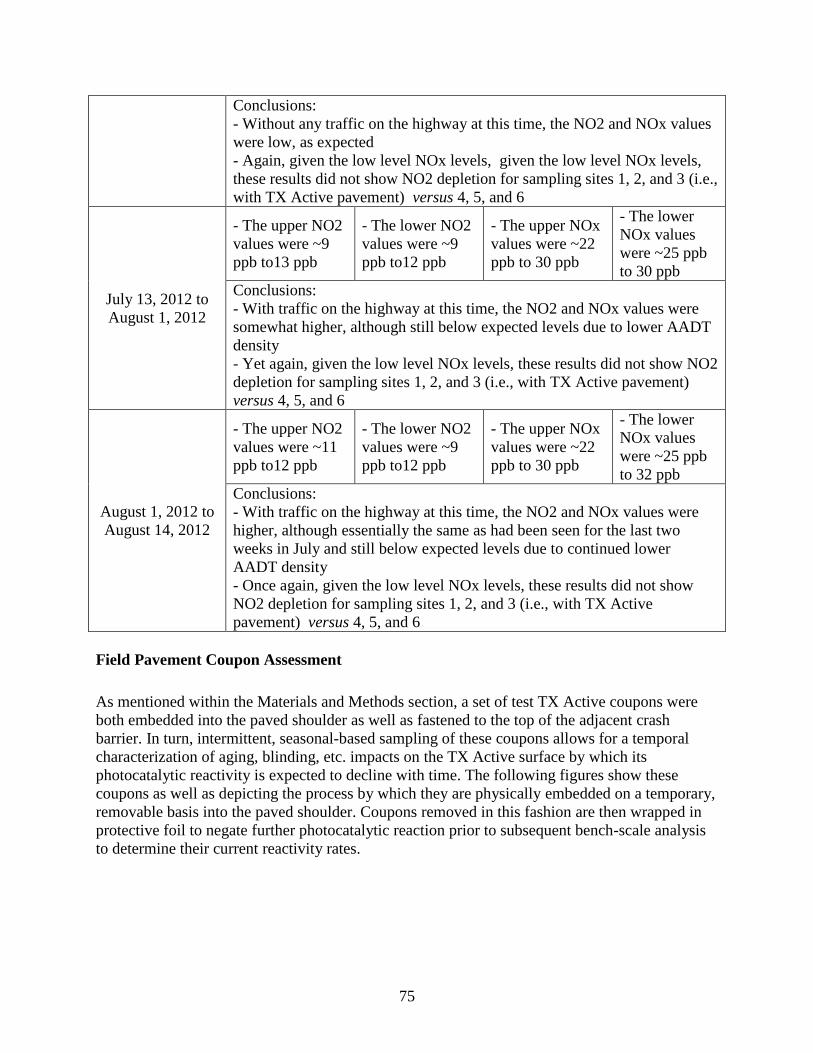
75
Conclusions:
- Without any traffic on the highway at this time, the NO2 and NOx values
were low, as expected
- Again, given the low level NOx levels, given the low level NOx levels,
these results did not show NO2 depletion for sampling sites 1, 2, and 3 (i.e.,
with TX Active pavement) versus 4, 5, and 6
July 13, 2012 to
August 1, 2012
- The upper NO2
values were ~9
ppb to13 ppb
- The lower NO2
values were ~9
ppb to12 ppb
- The upper NOx
values were ~22
ppb to 30 ppb
- The lower
NOx values
were ~25 ppb
to 30 ppb
Conclusions:
- With traffic on the highway at this time, the NO2 and NOx values were
somewhat higher, although still below expected levels due to lower AADT
density
- Yet again, given the low level NOx levels, these results did not show NO2
depletion for sampling sites 1, 2, and 3 (i.e., with TX Active pavement)
versus 4, 5, and 6
August 1, 2012 to
August 14, 2012
- The upper NO2
values were ~11
ppb to12 ppb
- The lower NO2
values were ~9
ppb to12 ppb
- The upper NOx
values were ~22
ppb to 30 ppb
- The lower
NOx values
were ~25 ppb
to 32 ppb
Conclusions:
- With traffic on the highway at this time, the NO2 and NOx values were
higher, although essentially the same as had been seen for the last two
weeks in July and still below expected levels due to continued lower
AADT density
- Once again, given the low level NOx levels, these results did not show
NO2 depletion for sampling sites 1, 2, and 3 (i.e., with TX Active
pavement) versus 4, 5, and 6
Field Pavement Coupon Assessment
As mentioned within the Materials and Methods section, a set of test TX Active coupons were
both embedded into the paved shoulder as well as fastened to the top of the adjacent crash
barrier. In turn, intermittent, seasonal-based sampling of these coupons allows for a temporal
characterization of aging, blinding, etc. impacts on the TX Active surface by which its
photocatalytic reactivity is expected to decline with time. The following figures show these
coupons as well as depicting the process by which they are physically embedded on a temporary,
removable basis into the paved shoulder. Coupons removed in this fashion are then wrapped in
protective foil to negate further photocatalytic reaction prior to subsequent bench-scale analysis
to determine their current reactivity rates.
76
Figure 62. Coupon placement at both paved shoulder (nine each) and top of crash barrier
locations (nine each)

77
Figure 63. Coupon placement at both paved shoulder (nine each) and top of crash barrier
(another nine each) locations
Figure 64. Closeup of coupon samples removed from paved shoulder locations
Nine top-mounted crash
barrier coupon samples(~1 meter elevation)
Nine surface –level coupon
samples
(0 meter elevation)

78
Figure 65. Coupon sample collection underway showing open pavement coupon mounting
hole with accompanying mounting bolt
Figure 66. View of embedded coupon holder with mounting bolt

79
Figure 67. Preservative foil wrapping of coupon samples
Urban Heat Island Testing
Urban heat island instrumentation is a combination of thermocouples installed throughout the
pavement systems, albedo measurements, and a full weather station. The instruments included
within this weather station are a thermometer/relative humidity sensor (Campbell Scientifics
CS215), pyranometer (Campbell Scientifics CS300), wind speed and direction sensor (RM
Young 03002-5), and a tipping bucket rain gauge (Hydrological Services TB4). This sentry is
shown attached to the vault behind the TX active section in Figure 68.

80
Figure 68. Tipping bucket rain gauge (left) and weather station (right)
All pressure sensors, including those in the weir boxes measure temperature which will be used
to monitor water temperature through the installation. Figure 69 shows the thermocouple wire
locations in the TX Active concrete pavement and shoulder and Figure 70 shows the control
section thermocouple wire locations. The wires used were T-wire thermocouple wire.

81
Figure 69. Cross section of TX Active section with locations of thermocouple wires, denoted
by X (not to scale)
Figure 70. Cross section of TX Active section with locations of thermocouple wires, denoted
by X (not to scale)
Initial solar reflectance was determined according to ASTM E1918 using the dual pyranometer
(Campbell Scientific CMP3) setup (Figure 71). Initial testing was performed just prior to the
road opening and visually the surface contained a significant amount of soil from construction.
It is anticipated that all albedo values will increase after a flushing rain event. The initial albedo

82
results are shown in Table 10. Both TX Active sections had higher reflectance than the control
section.
Figure 71. Albedometer used for initial reflectance measurements
Table 10. Albedometer measurements
Location Albedo
TX Active Roadway 0.33
Control Roadway 0.31
TX Active Pervious Shoulder 0.33
Control Pervious Shoulder 0.29
83
SUMMARY
The following narrative details cover the summary highlights for this project:
1. Construction with this innovative highway has been finished, and the road was opened for
public use on 14 July 2012.
2. Our extensive setup with field water sampling equipment is in place, such that leachate and
runoff sample collection from both the TX Active and control pavement sections is ongoing.
3. Our similarly extensive set of field air sampling equipment is also in place, such that both
passive and active air monitoring of NOx levels from both the TX Active and control
pavement sections is ongoing.
4. Our similarly extensive set of field pavement and meteorological sampling equipment is also
in place to capture site temperature, rainfall, wind speed and direction, etc. conditions.
5. Field results are now being collected which track water, air, and test coupon performance.
Two months of passive Ogawa air quality testing has been completed prior to opening the
highway, where this data serves as a baseline for comparison with findings observed during
highway operation.
6. Extensive lab testing has also been completed, and also continues in support of incoming
new coupon tests. Multiple tests have been completed with lab-scale photoreactor studies.
These latter lab tests were used to quantify the expected photoreactivity of the employed TX
Active materials on a specific basis (i.e., rate of NOx removal per unit surface area). In
addition, these lab tests have involved fundamental assessments of related photocatalytic
mechanisms in terms of reactant consumption relative to product formation under standard
and non-standard (e.g., reduced temperature) environmental conditions.
7. As of the date of this Final Report I publication, the speed limit along the highway
temporarily remains limited to 30 MPH…at which point traffic density on the highway
remains low.
8. Commensurate with the latter, reduced AADT levels, current vehicle emission and ambient
NO2 levels (i.e., measured with the Ogawa samples) during the first month of highway
operation have been sizably lower than expected, in the neighborhood of ~10 ppb, and NOx
levels of ~30 ppb.
9. With these low AADT and low vehicle NOx emission levels, therefore, the observed TX
Active reactivity has been similarly reduced to this point.

84
10. The latter circumstance of lower AADT, lower vehicle emission, and nominal TX Active
reactivity will shortly change in sequential fashion, where escalating AADT will generate a
substantial increase in NOx emission and, in turn, a far higher reactivity of the TX Active
due to the higher reactant concentration gradient.
11. Placement and data collection with field traffic counters to obtain AADT levels is currently
being started.
12. Parallel bench-scale testing of reactivity rates with representative TX Active specimens well
suggests that the full-scale 141 highway will exhibit a significant level of NO2 removal once
traffic AADT levels escalate to expected levels and NO2 emissions correspondingly increase.
13. In fact, lab-scale assessment of the potential reactivity rate of the employed TX Active
material (i.e., at ambient NO2 levels in the 100 ppb range) versus expected vehicular
emission rate essentially showed a ten-fold difference.
14. Only limited active testing of NO and NO2 has as yet been conducted at the full-scale site
using the 2B Technologies ozone depletion instrument. These results, though, were quite
similar (i.e., with NO2 levels in the single-digit level) to the previously observed field Ogawa
results.
15. Testing of aged, on-site coupons is currently being started, for the first such set of six aged
couples collected two weeks ago.
Lastly, the findings presented within this current (August 2012) Final Report I publication will
be augmented with a forthcoming, August 2013 Final Report II edition which covers additional
lab- and field-scale testing results for an upcoming additional year.
Appendices
The following appendices are included within this report:
A Wind-Rose Patterns for St. Louis, Missouri and Related Project
Site Selection Perspectives
B Project National Steering Committee

85
REFERENCES
Asadi, S., Hassan, M. M., Kevern, J. T., and Rupnow, T. (2012). Development of Photocatalytic
Pervious Concrete Pavement for Air and Stormwater Improvements. Transportation
Research Record.
ASTM, Standard C-1754/1754M, “Standard Test Method for Density and Void Content of
Hardened Pervious Concrete,” Annual Book of ASTM Standards Vol. 4(2), ASTM
International, West Conshohocken, PA: ASTM International, 2012.
Ballari, M. M., Hunger, M., Husken, G., and Brouwers, H. J. H. (2009). Heterogeneous
Photocatalysis Applied to Concrete Pavement for Air Remediation. Nanotechnology in
Construction 3, Proceedings, 409-414.
Ballari, M. M., Hunger, M., Husken, G., and Brouwers, H. J. H. (2010). NOx photocatalytic
degradation employing concrete pavement containing titanium dioxide. Applied Catalysis
B-Environmental, 95(3-4), 245-254. doi: 10.1016/j.apcatb.2010.01.002
Ballari, M. M., Yu, Q. L., and Brouwers, H. J. H. (2011). Experimental study of the NO and
NO2 degradation by photocatalytically active concrete. Catalysis Today, 161(1), 175-180.
doi: 10.1016/j.cattod.2010.09.028
Barmpass, P., Moussiopoulos, N., and Vlahocostas, C. (2006). De-Pollution Prediction Tool and
Integrated Economic Assessment PICADA Project.
Beeldens, A. (2007, October 8-9). Air Purification by Road Materials: Results of the Test Project
in Antwerp. Paper presented at the International RILEM Symposium on Photocatalysis,
Environment and Construction Materials - TDP 2007, Florence, Italy.
Beeldens, A. (2008). Air purification by pavement blocks: final results of the research at
the BRRC. Ljubljana, Slovenia.
Beeldens, A., Cassar, L., and Murata, Y. (2011). Applications of TiO2 Photocatalysis for Air
Purification In Y. Ohama and D. Van Gemert (Eds.), Application of titanium Dioxide
Photocatalysis to Construction Materials (1st ed.): Springer.
Berdahl, P., and Akbari, H. (2007). Evaluation of Titanium Dioxide as a Photocatalyst
for Removing Air Pollutants
Bigi, A., and Harrison, R. M. (2010). Analysis of the air pollution climate at a central urban
background site. Atmospheric Environment, 44(16), 2004-2012. doi:
10.1016/j.atmosenv.2010.02.028
Brauer, M., Hoek, G., Van Vliet, P., Meliefste, K., Fischer, P. H., Wijga, A., Brunekreef, B.
(2002). Air pollution from traffic and the development of respiratory infections and
asthmatic and allergic symptoms in children. American Journal of Respiratory and Critical
Care Medicine, 166(8), 1092-1098. doi: DOI 10.1164/rccm.200108-007OC
Brunekreef, B., Janssen, N. A. H., deHartog, J., Harssema, H., Knape, M., and vanVliet, P.
(1997). Air pollution from truck traffic and lung function in children living near motorways.
Epidemiology, 8(3), 298-303.
Cable, J. K., and Frentress, D. P. (2004). Two-Life Portland Cement Concrete Pavements to
Meet Public Needs. Ames, IA: Center for Portland Cement Concrete Pavement Technology.
Cape JN, Tang YS, van Dijk N, Love L, Sutton MA, Palmer SCF. Concentrations of ammonia
and nitrogen dioxide at roadside verges, and their contribution to nitrogen deposition.
Environmental Pollution 2004; 132: 469-478.

86
Carp, O., Huisman, C. L., and Reller, A. (2004). Photoinduced reactivity of titanium dioxide.
[Review]. Progress in Solid State Chemistry, 32(1-2), 33-177. doi:
10.1016/j.progsolidstchem.2004.08.001
Cassar, L. (2004). Photocatalysis of cementitious materials: Clean buildings and clean air.
[Article]. Mrs Bulletin, 29(5), 328-331.
Chen, M., and Chu, J. W. (2011). NO(x) photocatalytic degradation on active concrete road
surface - from experiment to real-scale application. [Article]. Journal of Cleaner Production,
19(11), 1266-1272. doi: 10.1016/j.jclepro.2011.03.001
City Concept. (2004). D-NOx: The concrete paving block for atmospheric purification
Tessenderlo, Belgium.
Clean Air Act, 42 U.S.C. § 7401 et seq. (2008).
Crouch, L., Pitt, J., and Hewitt, A. “Aggregate Effects on Pervious Portland Cement Concrete
Static Modulus of Elasticity,” Journal of Materials in Civil Engineering, Vol. 19, No. 7,
2007.
Dalton, J. S., Janes, P. A., Jones, N. G., Nicholson, J. A., Hallam, K. R., and Allen, G. C. (2002).
Photocatalytic oxidation of NOx gases using TiO2: a surface spectroscopic approach.
Environmental Pollution, 120(2), 415-422. doi: 10.1016/s0269-7491(02)00107-0
Delatte, N. “Structural Design of Pervious Concrete Pavements,” Transportation Research Board
Annual Meeting, TRB 2007 Annual Meeting CD, 16pg.
Demeestere, K., Dewulf, J., De Witte, B., Beeldens, A., and Van Langenhove, H. (2008).
Heterogeneous photocatalytic removal of toluene from air on building materials enriched
with TiO2. Building and Environment, 43(4), 406-414. doi: 10.1016/j.buildenv.2007.01.016
Dylla, H., Hassan, M. M., Mohammad, L. N., Rupnow, T., and Wright, E. (2010). Evaluation of
Environmental Effectiveness of Titanium Dioxide Photocatalyst Coating for Concrete
Pavement. Transportation Research Record(2164), 46-51. doi: 10.3141/2164-06
Dylla, H., Hassan, M. M., Schmitt, M., Rupnow, T., and Mohammad, L. N. (2011a). Laboratory
Investigation of the Effect of Mixed Nitrogen Dioxide and Nitrogen Oxide Gases on
Titanium Dioxide Photocatalytic Efficiency in Concrete Pavements. Journal of Materials in
Civil Engineering, 23(7), 1087-1093. doi: 10.1061/(asce)mt.1943-5533.0000248
Dylla, H., Hassan, M. M., Schmitt, M., Rupnow, T., Mohammad, L. N., and Wright, E. (2011b).
Effects of Roadway Contaminants on Titanium Dioxide Photodegradation of NOx. Paper
presented at the Transportation Research Board 90th Annual Meeting, Washington, DC.
Essroc. TX Active, Photocatalytic Concrete Technology. Essroc, Italcementi Group, Bergamo,
Italy, 2009.
Finkelstein, M. M., Jerrett, M., and Sears, M. R. (2004). Traffic air pollution and mortality rate
advancement periods. American Journal of Epidemiology, 160(2), 173-177. doi: Doi
10.1093/Aje/Kwh181
Frank, S. N., and Bard, A. J. (1977). Heterogeneous Photocatalytic Oxidation of Cyanide Ion in
Aqueous-Solutions at Tio2 Powder. Journal of the American Chemical Society, 99(1), 303-
304.
Fujishima, A., and Honda, K. (1972). Electrochemical Photolysis of Water at a Semiconductor
Electrode. [10.1038/238037a0]. Nature, 238(5358), 37-38.
Fujishima, A., and Zhang, X. T. (2006). Titanium dioxide photocatalysis: present situation and
future approaches. Comptes Rendus Chimie, 9(5-6), 750-760. doi: DOI
10.1016/j.crci.2005.02.055

87
Fujishima, A., Hashimoto, K., and Watanabe, T. (1999). TiO2 photo catalysis: fundamentals and
applications. Tokyo: BKC, Inc.
Fujishima, A., Rao, T. N., and Tryk, D. A. (2000). Titanium dioxide photocatalysis. Journal of
Photochemistry and Photobiology C: Photochemistry Reviews, 1(1), 1-21. doi:
10.1016/s1389-5567(00)00002-2
Fujishima, A., Zhang, X. T., and Tryk, D. A. (2008). TiO(2) photocatalysis and related surface
phenomena. [Review]. Surface Science Reports, 63(12), 515-582. doi:
10.1016/j.surfrep.2008.10.001
Garshick, E., Laden, F., Hart, J. E., and Caron, A. (2003). Residence near a major road and
respiratory symptoms in US veterans. Epidemiology, 14(6), 728-736. doi: DOI
10.1097/01.ede.0000082045.50073.66
Grant, R. H., and Slusser, J. R. (2005). Estimation of ultraviolet-A irradiance from measurements
of 368-nm spectral irradiance. Journal of Atmospheric and Oceanic Technology, 22(12),
1853-1863. doi: 10.1175/jtech1823.1
Guerrini, G. L., and Peccati, E. (2007, October 8-9). Photocatalytic Cementitious Roads for
Depollution. Paper presented at the International RILEM Symposium on Photocatalysis,
Environment and Construction Materials - TDP 2007, Florence, Italy.
Hagenbjörk-Gustafsson A, Eriksson K, Forsberg B. Field Evaluation of the Ogawa Diffusive
Sampler for NO2/ NOX in a Cold Climate. Epidemiology 2009; 20: S161
10.1097/01.ede.0000362548.83420.d7.
Hall, K., Dawood, D., Vanikar, S., Tally, R., Cackler, T., Correa, A, Voigt, G. (2007). Long-Life
Concrete PAvements in Europe and Canda: Federal Highway Administration.
Hassan, M. M., and Okeil, A. (2011). Field and Laboratory Investigation of Photocatalytic
Pavements: Final Report. Baton Rouge, LA: Gulf Coast REsearch Center for Evacuation
and Transportation Resiliency.
Hassan, M. M., Dylla, H., Mohammad, L. N., and Rupnow, T. (2010a, April). Durability of
Titanium Dioxide Photocatalytic Layer for Pavement Surfaces. Paper presented at the 46th
Annual Conference of the Associated Schools of Construction, Boston, Massachusetts.
Hassan, M. M., Dylla, H., Mohammad, L. N., and Rupnow, T. (2010b). Effect of Application
Methods on the Effectiveness of Titanium Dioxide as a Photocatalyst Compound to
Concrete Pavement. Paper presented at the Transportation Research Board 89th Annual
Meeting, Washington, D.C.
Hagenbjörk-Gustafsson A, Eriksson K, Forsberg B. Field Evaluation of the Ogawa Diffusive
Sampler for NO2/ NOX in a Cold Climate. Epidemiology 2009; 20: S161
10.1097/01.ede.0000362548.83420.d7.
Hassan, M. M., Dylla, H., Mohammad, L. N., and Rupnow, T. (2010c). Evaluation of the
durability of titanium dioxide photocatalyst coating for concrete pavement. Construction
and Building Materials, 24(8), 1456-1461. doi: 10.1016/j.conbuildmat.2010.01.009
HEI. Traffic-Related Air Pollution: A Critical Review of the Literature on Emissions, Exposure,
and Health Effects. Health Effects Institute, Boston, MA, 2009.
Herrmann, J. M. (1999). Heterogeneous photocatalysis: fundamentals and applications to the
removal of various types of aqueous pollutants. Catalysis Today, 53(1), 115-129.
Herrmann, J. M., Péruchon, L., Puzenat, E., and Guillard, C. (2007, October 8-9). Photocatalysis:
from fundamentals to self-cleaning glass applications. Paper presented at the International
RILEM Symposium on Photocatalysis, Environment and Construction Materials - TDP
2007, Florence, Italy.

88
Husken, G., and Brouwers, H. J. H. (2008, June 16-20). Air purification by cementitious
materials: Evaluation of air purifying properties. Paper presented at the International
Conference on Construction and Building Technology, Kuala Lumpur, Malaysia.
Husken, G., Hunger, M., and Brouwers, H. J. H. (2009). Experimental study of photocatalytic
concrete products for air purification. Building and Environment, 44(12), 2463-2474. doi:
10.1016/j.buildenv.2009.04.010
Hwang, S., Lee, M. C., and Choi, W. (2003). Highly enhanced photocatalytic oxidation of CO on
titania deposited with Pt nanoparticles: kinetics and mechanism. Applied Catalysis B-
Environmental, 46(1), 49-63. doi: 10.1016/s0926-3373(03)00162-0
IADOT. Traffic Flow Map of Ames C Story County, 2007 Annual Average Daily Traffic. Iowa
Department of Transportation, Ames, IA, 2007. [Cited: May 4, 2011]
http://www.iowadot.gov/maps//msp/traffic/2007/cities/amesc.pdf.
Ibusuki, T., and Takeuchi, K. (1994). Removal of Low Concentration Nitrogen Oxides Through
Photoassisted Heterogenous Catalysis. Journal of Molecular Catalysis, 88(1), 93-102. doi:
10.1016/0304-5102(93)e0247-e
ISO. (2007). Fine ceramics (advanced ceramics, advanced technical ceramics)--Test method for
air-purification performance of semiconducting photocatalytic materials--Part 1: Removal of
nitric oxide. (ISO 22197-1:2007(E)). Geneva, Switzerland.
Italcementi. TX Active, The Photocatalytic Active Principle, Technical Report. Italcementi,
Bergamo, Italy, 2009.
Jacoby, W. A., Blake, D. M., Noble, R. D., and Koval, C. A. (1995). KINETICS OF THE
OXIDATION OF TRICHLOROETHYLENE IN AIR VIA HETEROGENEOUS
PHOTOCATALYSIS. Journal of Catalysis, 157(1), 87-96. doi: 10.1006/jcat.1995.1270
JIS. (2010). Fine ceramics (advanced ceramics, advanced technical ceramics)--Test method for
air-purification performance of semiconducting photocatalytic materials--Part 1: Removal of
nitric oxide. (JIS R 1701-1:2010). Tokyo, Japan.
Kevern, J. T., Wang, K., and Schaefer, V. R. “Evaluation of Pervious Concrete Workability
Using Gyratory Compaction.” American Society of Civil Engineers Journal of Materials in
Civil Engineering, Vol.21, No. 12, Dec, 2009.
Kevern, J.T. “Using Soybean Oil to Improve the Durability of Concrete Pavements,”
International Journal of Pavement Research and Technology, Sustainable Concrete
Pavements Special Edition, V.3, No. 5, Sept. 2010.
Kevern, J.T. “Operation and Maintenance of Pervious Concrete Pavements,” 90th Annual
Transportation Research Board Annual Meeting, Washington D.C., Jan 23-27, 2011.
Kevern, J.T. and Farney, C. “Reducing Curing Requirements for Pervious Concrete Using a
Superabsorbent Polymer for Internal Curing.” Transportation Research Record: Journal of
the Transportation Research Board (TRB), Construction 2012, Transportation Research
Board of the National Academies, Washington D.C. (accepted for publication)
Kim, J. J., Smorodinsky, S., Lipsett, M., Singer, B. C., Hodgson, A. T., and Ostro, B. (2004).
Traffic-related air pollution near busy roads - The East Bay childrens respiratory health
study. American Journal of Respiratory and Critical Care Medicine, 170(5), 520-526. doi:
DOI 10.1164/rccm.200403-2810C
Kumar, P., Dushenkov, V., Motto, H., and Raskin, I. (1995). Phytoextraction – The Use of Plants
to Remove Heavy Metals from Soils. Environmental Science and Technology, 29(5), 1232-
1238. doi: 10.1021/es00005a014
89
Lim, T. H., Jeong, S. M., Kim, S. D., and Gyenis, J. (2000). Photocatalytic decomposition of NO
by TiO2 particles. Journal of Photochemistry and Photobiology a-Chemistry, 134(3), 209-
217. doi: 10.1016/s1010-6030(00)00265-3
MECA. (2007). Frequently Asked Questions about the Installation of Emission Control
Technology on Existing Diesel Engines Washington, D.C.: Manufacturers of Emission
Controls Association Retrieved from http://www.meca.org/galleries/default-
file/diesel%20retrofit%20FAQ%200507.pdf.
Mukerjee S, Oliver KD, Seila RL, Jacumin Jr HH, Croghan C, Daughtrey Jr EH, et al. Field
comparison of passive air samplers with reference monitors for ambient volatile organic
compounds and nitrogen dioxide under week-long integrals. Journal of Environmental
Monitoring 2009; 11: 220-227.
Murata, Y., and Tobinai, K. (2002). Influence of various factors on NOx removal performance of
permeable interlocking block based on photocatalysis. Journal of Structural and
Construction Engineering(Transactions of AIJ)(555), 9-15.
Murata, Y., Kamitani, K., and Takeuchi, K. (2000). Air Purifying Blocks Based on
Photocatalysis. Paper presented at the Japan Interlocking BLock Pavement Engineering
Association World Congress 2000, Tokyo, Japan.
Murruni, L., Conde, F., Leyva, G., and Litter, M. I. (2008). Photocatalytic reduction of Pb(II)
over TiO(2): New insights on the effect of different electron donors. [Article]. Applied
Catalysis B-Environmental, 84(3-4), 563-569. doi: 10.1016/j.apcatb.2008.05.012
Obee, T. N., and Brown, R. T. (1995). TIO2 Photocatalysis for Indoor Air Applications – Effects
of Humidity and Trace Contaminant Levels on the Oxidation Levels of the Oxidation Rates
of Formaldehye, Toluene, and 1,3-Butadiene. Environmental Science and Technology,
29(5), 1223-1231. doi: 10.1021/es00005a013
Ohama, Y., and Van Gemert, D. (2011). Introduction. In Y. Ohama and D. Van Gemert (Eds.),
Application of titanium Dioxide Photocatalysis to Construction Materials (1st ed.): Springer.
Ohno, T., Sarukawa, K., Tokieda, K., and Matsumura, M. (2001). Morphology of a TiO2
photocatalyst (Degussa, P-25) consisting of anatase and rutile crystalline phases. [Article].
Journal of Catalysis, 203(1), 82-86. doi: 10.1006/jcat.2001.3316
Osborn, D., Hassan, M. M., and Dylla, H. (2012). Quantification of NOX reduction via Nitrate
Accumulation on a TiO2 Photocatalytic Concrete Pavement. Transportation Research
Record(??), ??
Overman, H. T. J. (2009). Simulation model for NOX distributions in a street canyon with air
purifying pavement. (Master: Civil Engineering and Management), University of Twente,
Eschede, Netherlands.
Paz, Y. (2010). Application of TiO2 photocatalysis for air treatment: Patents overview. Applied
Catalysis B-Environmental, 99(3-4), 448-460. doi: 10.1016/j.apcatb.2010.05.011
Peral, J., and Ollis, D. F. (1992). Heterogenous Photocatalytic Oxidation of Gas-Phase Organics
for Air Purification – Acentone, 1-Butanol, Butyraledhyde, Formaldehyde, and Meta-Xylen
Oxidation. Journal of Catalysis, 136(2), 554-565. doi: 10.1016/0021-9517(92)90085-v
PICADA. (2011). Guideline for end-users, GROWTH Project GRD1-2001-40449.
Poon, C. S., and Cheung, E. (2007). NO removal efficiency of photocatalytic paving blocks
prepared with recycled materials. Construction and Building Materials, 21(8), 1746-1753.
doi: 10.1016/j.conbuildmat.2006.05.018
Primary National Ambient Air Quality Standards for Nitrogen Dioxide: Final Rule, 75 Fed. Reg.
6474 (2010), (to be codified at 40 C.F.R. pts. 50 and 58).

90
Rousseau, P., Drouadaine, I., Maze, M., Vaton,G., Souprayen, C., and Tripathi, A. (2009).
Impact du procédé NOxer sur la dispersion atmosphérique de NOx issus du trafic routier,
EUROVIA Centre de Recherche Poster Presentation, Saint-Denis, France.
Sather M, Slonecker E, Mathew J, Daughtrey H, Williams D. Evaluation of ogawa passive
sampling devices as an alternative measurement method for the nitrogen dioxide annual
standard in El Paso, Texas. Environmental Monitoring and Assessment 2007; 124: 211-221-
221.
Sclafani, A., and Herrmann, J. M. (1996). Comparison of the photoelectronic and photocatalytic
activities of various anatase and rutile forms of titania in pure liquid organic phases and in
aqueous solutions. Journal of Physical Chemistry, 100(32), 13655-13661. doi:
10.1021/jp9533584
Sikkema, J. K., Alleman, J. E., Ong, S. K., Koziel, J. A., Taylor, P. C., and Bai, H. (2012,
September 18-21). Photocatalytic Concrete Pavements: Decrease in NOX Oxidation due to
Reaction Product Blinding. Paper presented at the International Conference on Long-Life
Concrete Pavement-2012, Seattle, Washington.
Stone, W., Jonas, J., Grytza, S.P., Alleman, J., Kevern, J.T., Brooks, J.L., and Hilton, N.R. Route
141 Environmentally Friendly Project: MoDOT Green Road Initiative Project. Presented at
MO/KS Chapter, ACPA 32nd Annual Portland Cement Concrete Paving Conference,
Kansas City, MO, 2012.
Strini, A., Cassese, S., and Schiavi, L. (2005). Measurement of benzene, toluene, ethylbenzene
and o-xylene gas phase photodegradation by titanium dioxide dispersed in cementitious
materials using a mixed flow reactor. Applied Catalysis B-Environmental, 61(1-2), 90-97.
doi: 10.1016/j.apcatb.2005.04.009
The Cadmus Group, I. (2009). Nutrient Control Design Manual: State of Technology Review
Report.
Thoma, E. D., Shores, R. C., Isakov, V., and Baldauf, R. W. (2008). Characterization of near-
road pollutant gradients using path-integrated optical remote sensing. Journal of the Air and
Waste Management Association, 58(7), 879-890. doi: Doi 10.3155/1047-3289.58.7.879
Tompkins, D. T., Lawnicki, B. J., Zeltner, W. A., and Anderson, M. A. (2005). Evaluation of
photocatalysis for gas-phase air cleaning - Part 1: Process, technical, and sizing
considerations. Ashrae Transactions 2005, Vol 111, Pt 2, 111, 60-84.
UNI. (2007). (UNI 1247:2007). Milan, Italy.
USEPA. (1994). Environmental Fact Sheet: Air Toxics from Motor Vehicles. (EPA400-F-92-
004). Washington, D.C.
USEPA. (2001). National Air Quality and Emissions Trends Report, 1999. (EPA 454/R-01-004).
Washington, D.C.
USEPA. (2006). The Master List of Compounds Emitted by Mobile Sources - 2006. (EPA420-B-
06-002).
USEPA. (2007). Summary of Current and Historical Light-Duty Vehicle Emission Standards.
Washington, D.C.: Retrieved from http://www.epa.gov/greenvehicles/detailedchart.pdf.
USEPA. (2009). National Primary Drinking Water Regulations. (EPA 816-F-09-004).
Washington, D.C.
USEPA. (2010a). Design Values (Average 1-Hour 98th Percentiles over 3 Years) by County for
Nitrogen Dioxide Research Triangle Park, NC: Retrieved from
http://www.epa.gov/oaqps001/nitrogenoxides/pdfs/NO2_final_designvalues_0608_Jan22.pd
f.

91
USEPA. (2010b). Fact Sheet: Final Revisions to the National Ambient Air Quality Standards for
Nitrogen Dioxide. Research Triangle Park, NC: Retrieved from
http://www.epa.gov/oaqps001/nitrogenoxides/pdfs/20100122fs.pdf.
USEPA. (2010c). Final Regulatory Impact Analysis (RIA) for the NO2 National Ambient Air
QUality Standards (NAAQS). Research Triangle Park, NC: Retrieved from
http://www.epa.gov/ttnecas1/regdata/RIAs/FinalNO2RIAfulldocument.pdf.
USEPA. (2011a, July 6). Ground-level Ozone: Basic Information Retrieved September 27,
2011, from http://www.epa.gov/groundlevelozone/basic.html
USEPA. (2011b, July 6). Nitrogen Dioxide: Health Retrieved September 27, 2011, from
http://www.epa.gov/air/nitrogenoxides/health.html
USEPA. (2012a, July 20). Green Vehicle Guide: Frequent Questions Retrieved July 20, 2012,
from http://www.epa.gov/greenvehicles/Faq.do
USEPA. (2012b, July 5). Heavy-Duty Highway Compression-Ignition Engines And Urban Buses
-- Exhaust Emission Standards Retrieved July 19, 2012, from
http://epa.gov/oms/standards/heavy-duty/hdci-exhaust.htm
USEPA. (2012c). “Polluted Runoff (non-point source pollution)” Basic Information Retrieved
March 16, 2012, from http://www.epa.gov/owow_keep/NPS/whatis.html
Vardoulakis, S., Fisher, B. E. A., Pericleous, K., and Gonzalez-Flesca, N. (2003). Modelling air
quality in street canyons: a review. Atmospheric Environment, 37(2), 155-182. doi:
10.1016/s1352-2310(02)00857-9
Wang, Y. J., DenBleyker, A., McDonald-Buller, E., Allen, D., and Zhang, K. M. (2011).
Modeling the chemical evolution of nitrogen oxides near roadways. Atmospheric
Environment, 45(1), 43-52. doi: 10.1016/j.atmosenv.2010.09.050
Watts, M. J., and Cooper, A. T. (2008). Photocatalysis of 4-chlorophenol mediated by TiO(2)
fixed to concrete surfaces. Solar Energy, 82(3), 206-211. doi: 10.1016/j.solener.2007.08.001
Yu, J. C. (2002). Ambient Air Treatment by Titanium Dioxide (TiO2 ) Based Photocatalyst in
Hong Kong Hong Kong.
Yu, J. C. (2003). Deactivation and Regeneration of Environmentally Exposed Titanium Dioxide
(TiO2 ) Based Products Hong Kong.
Zhao, J., and Yang, X. D. (2003). Photocatalytic oxidation for indoor air purification: a literature
review. Building and Environment, 38(5), 645-654. doi: 10.1016/s0360-1323(02)00212-3
Zhao, Y., Han, J., Shao, Y., and Feng, Y. (2009). Simultaneous SO(2) and NO removal from flue
gas based on TiO(2) photocatalytic oxidation. Environmental Technology, 30(14), 1555-
1563. doi: 10.1080/09593330903313786


93
APPENDIX A
_________________________________________________________________________________
Wind-Rose Patterns for St. Louis, Missouri
and Related Project Site Selection Perspectives _________________________________________________________________________________
Overview:
Matching the directional alignment of the project paving sections with the regional wind rose
patterns was originally considered while evaluating how the air-sample collection effort might be
optimized. As can been seen in the wind-rose data given below, however, the prevailing winds in
the St. Louis area change considerably in both their direction and speed during the course of a
year…to the point where there really is not an optimal road alignment for this upcoming
sampling effort.
During cold weather months (e.g., see February below), it would appear that the wind typically
passes from the northwest to the southeast, and that there is less directional variation throughout
the month. The colder months also appear to have the highest wind speeds.
During warmer months (i.e., see August on the following page), wind speeds tend to be lower
and more spread out in terms of direction. The dominant wind direction during warmer summer
months appears to be from the south.
Prior near-road NO2 testing conducted by the US EPA, has also shown that there is considerable
traffic-induced turbulence of the air mass, and contaminants, immediately overlying a high-
traffic urban highway (Baldauf, 2009). Taking into account this vehicle-induced turbulence with
the seasonal variability of wind direction and speed, and also factoring in the time-integrative
nature of Ogawa-type passive NO2 sampling, the concluding sense of this issue is that factoring
wind direction into a decision about road alignment is probably an unnecessary step. Even then,
there is little if any precedent in the literature where other researchers have made attempts to
match the placement or on-off manipulation of air sampling equipment with ambient wind
direction,

94
Wind Rose Plots: (see URL:
http://www.isws.illinois.edu/atmos/statecli/Roses/wind_climatology.htm)
Month Wind-Rose Plot Prevailing Wind
Direction
February
Predominantly from the
northwest
April
From the
northwest…but also
from the southeast
June
Predominantly from the
south
August
Predominantly from the
south to southeast

95
October
Predominantly from the
south to southeast
December
Predominantly from the
west-northwest


97
APPENDIX B
_________________________________________________________________________________
Project National Steering Committee _________________________________________________________________________________
(24 current members)
FHWA
(4 each):
Suneel Vanikar, Office of Pavement
Technology
FHWA Office of Pavement Technology
HIPT-20, Washington, DC 20590
Phone: 202- 366-0120
Email: [email protected]
Gina Ahlstrom, Office of Pavement
Technology
Email: [email protected]
Victoria Martinez, Office of Natural
Environment
Email: victoria.martinez@ dot.gov
Dawn Perkins, Missouri Division
Email: [email protected]
US EPA
(3 each): Laura Bachle
Dr. Rich Baldauf, US EPA – Risk
Management Air Research, EPA Office of
Research and Development, National Risk
Management Laboratory, Air Pollution
Prevention and Control Division (APPCD),
Emissions Characterization and Prevention
Branch (ECPB)
Office: 919-541-4386
Email: [email protected]
Lisa Hair, PE
Room 7333E EPA West
Mailing address for items sent via US
Mail:
US EPA Office of Water (4503-T)
1200 Pennsylvania Avenue, N.W.
Washington, D.C. 20460

98
Actual address:
USEPA Office of Water (4503-T)
1301 Constitution Avenue, N.W.
Room 7424
Washington, D.C. 20004
Phone: 202-566-1043
Fax: 202-566-1332
Email: [email protected]
Missouri
DOT
(3 each):
Bill Stone, PE
Organizational Performance Administrator,
MoDOT
Phone: 573-526-4328
Email: [email protected]
Nancy Leroney
Email: [email protected]
Brett Trautman
Email: [email protected]
Missouri
DNR
(2 each)
Steven Hall Air Quality Monitoring
Phone: 573-751-8406
Email: [email protected]
Jerry Downs Near Roadway NO2 Ambient Air
Monitoring
Email: [email protected]
Curtis Gately, Chief
NPDES Permits Unit
Water Protection Program
Phone: (573) 526-1155
Email: [email protected]
Essroc
Italcementi
Group
(3 each)
Dan Schaffer
Email: dan.schaffer @essroc.com
Steve Grytza, Territory Manager
Email: [email protected]
Gian Luca Guerrini, Direzione
Innovazione, Italcementi Group
Email: [email protected]
Lehigh
Hanson
(Heidelberg
Lori Tiefenthaler, VP Sustainability and
Marketing Communications
Email: [email protected]
om;

99
Cement
Group)
(3 each)
Morgan Johnson, Technical Services
Representative
Email: [email protected]
Wolfgang Dienemann, Director Global
Research and Development Heidelberg
Cement Technology Center
Email: Wolfgang.Dienemann@htc-
gmbh.com;
wolfgang.dienemann@htc-
gmbh.com;
Fred Weber,
Inc. Justin Brooks, Senior Project Manager
Construction Services
Phone: 314-792-6931
Email: [email protected]
Iowa State
University
and
CP Tech
Center
(InTrans)
(5 each)
Dr. James Alleman, ISU
Email: [email protected]
Dr. Say Kee Ong, ISU
Email: [email protected]
Dr. Peter Taylor, National Concrete
Pavement Technology Center, ISU
Email: [email protected]
Tom Cackler, National Concrete
Pavement Technology Center, ISU
Email: [email protected]
Joel Sikkema, ISU Doctoral Candidate
Email: [email protected]
University
of Missouri
– Kansas
City
School of
Computing
and
Engineering
Dr. John Kevern
UMKC School of Computing and
Engineering
University of Missouri – Kansas City
370H Flarsheim Hall, 5100 Rockhill Road
Kansas City, MO 64110
Phone: 816-235-5977
Email: [email protected]