Embed Size (px)
Citation preview

Technology CountsIT & Telecoms Insights 2010
United Kingdom England Northern Ireland ScotlandWales

© Copyright e-skills UK Sector Skills Council Ltd 2000-2009
Technology Counts IT & Telecoms Insights 2010
© 2009 Reserved, e-skills UK
All rights reserved. No part of this material protected by this copyright may be reproduced or utilised in any form, or by any means, electronic or mechanical, including photocopying, recording, or by any information storage and retrieval system without prior authorisation and credit to e-skills UK.
An e-skills UK publication
For further information please contact:
e-skills UK The Sector Skills Council for Business and Information Technology, including Software, Internet & Web, IT Services, Telecommunications and Business Change.
Creating the skills for Digital Britain Rated Outstanding - Sector Skills Councils Relicensing 2009
1 Castle Lane London SW1E 6DR UK t: +44 (0)20 7963 8920f: +44 (0)20 7592 9138e: [email protected]: www.e-skills.com

© Copyright e-skills UK Sector Skills Council Ltd 2000-2009
e-skills UK Board List
IT & Telecoms Industry Board
David Thomlinson Country Managing Director, UK & Ireland Accenture
Sally Davis Chief Executive BT
John Pluthero Executive Chairman, UK Cable & Wireless
Phil Smith VP and Chief Executive, UK & Ireland Cisco
Craig Wilson Managing Director and VP, UK and Ireland HP Enterprise Services
Larry Hirst (Chair, e-skills UK) Chair, EMEA IBM
Andy Green (Chair) CEO Logica
Gordon Frazer MD, UK and VP, MS International Microsoft
David Callaghan Senior Vice President Oracle
Gayna Hart MD Quicksilva
A. S. Lakshminarayanan Vice President and Head - Europe Tata Consultancy Services
Nick Read CEO of Asia-Pacific & Middle East Regions Vodafone
CIO Board
Paul Coby (Chair) CIO British Airways
Lesley Hume CIO Cabinet Office
Simon Post Chief Technology Officer Carphone Warehouse
Peter Pedersen Chief Technology Officer Figleaves
Ailsa Beaton Director of Information Metropolitan Police Service
David Lister CIO National Grid
Catherine Doran Director Corporate Development Network Rail
Robin Dargue Group CIO and Technology Director Royal Mail Group
Rob Fraser IT Director Sainsburys
Richard Thwaite CTO, Global Asset Management UBS
Neil Cameron CIO Unilever
Ben Wishart Change and Information Director Whitbread

© Copyright e-skills UK Sector Skills Council Ltd 2000-2009
Employers in Wales Board
Rick Cooper Director Alcatel-Lucent University Alcatel Lucent
Ronan Miles Director of Collaborative Solutions Practice, BT BT Client Services
Chris Goldoni Director Cardiff Financial Partnership
Richard Sheppard Managing Director Draig Technology
Mike Greenway Commercial Director EADS
David Morgan Applications Product Marketing Manager EDS
Alan Pound Head of Public Sector Fujitsu
Ian Clarke Engineering Operations Manager General Dynamics
Terry Killer Skills Manager Microsoft
Cenydd Burden Head of EMEA Client Services Mitel
Christine Bampford Director of OD NLIAH
Joanne Preece Wales Director Steria
Penny Copner Co-ordinator The Regional Social Care Partnership for Wales Andrew Jones Head of Public Sector Valtech
Acknowledgements
e-skills UK would like to thank the following for their contributions:
• e-skills UK board members, and more than 2,300 employers across the UK who participated in new research into employers needs and training.
• Gartner Executive Programs for their insights into global trends.
• Experian for their work on employment forecasting.
• Adroit Economics and Regeneris Consulting for their analysis of the impact of ICT on productivity.

© Copyright e-skills UK Sector Skills Council Ltd 2000-2009
Executive Summary 1
1.0 Introduction 10
2.0 The importance of IT & Telecoms 11 2.1 Scope of the sector 11 2.2 Globalisation and economic developments 14 2.3 Creating ‘Digital Britain’ 16
3.0 The economic and policy environment in Wales 17 3.1 Key economic data 17 3.2 Industries and employment in Wales 18 3.3 Skills and employment policy context 19
4.0 IT & Telecoms in Wales: the current position 21 4.1 The IT & Telecoms industry 21 4.2 The IT & Telecoms workforce 24
5.0 The changing environment - horizon scan 33 5.1 Emerging trends 33 5.2 Implications of emerging trends 37
6.0 Recruitment into IT & Telecoms 39 6.1 IT & Telecoms workforce growth dynamics 2009-2018 39 6.2 Recruitment needs by occupation, growth and replacement demand 41 6.3 Current demand for IT & Telecoms professionals 44
7.0 Skills of the workforce 47 7.1 IT & Telecoms professionals skills 47
8.0 Students and education 53 8.1 Higher Education 53 8.2 Further Education 61 8.3 Schools and Colleges in Wales 65 8.4 Gender 67
9.0 The wider population and use of IT 69
Annex A: IT & Telecoms Professional Occupations 73 Annex B: IT & Telecoms Industrial Classifications 75 Annex C: Glossary 77 Annex D: e-skills procom 78 Annex E: Key Sources of Information 79
Contents
Since 1998 IT & Telecoms GVA contribution in Wales has grown by 84%
© Copyright e-skills UK Sector Skills Council Ltd 2000-2009
Executive Summary
1
1. Introduction (see section 1)
This document summarises the findings of e-skills UK’s recent research to provide an in-depth understanding of the existing IT & Telecoms landscape and forecasts of the future based on the best available intelligence, with new input from over 2,300 employers across the UK including 145 in Wales. On the basis of this research, e-skills UK will continue work with employers and partners across the four nations of the UK. This work will help to ensure that Wales and the UK have the skills for Digital Britain, to secure Britain’s place at the forefront of the global digital economy.
2. The importance of IT & Telecoms (see section 2)
The IT & Telecoms sector provides the engine for productivity and future growth across the whole of the UK economy.
Wales is highly dependent on the IT & Telecoms workforce - it underpins the economy and is integral to information, business and consumer services, health and leisure and modern day social networking. Evidence of the sector's growing importance is illustrated by IT & Telecoms annual Gross Value Added (GVA) contribution having grown by 84% in Wales since 1998, totalling £1.2 billion in 2007.
The UK also has one of the best track records in the world for developing IT-enabled business solutions focused on delivering business value. Specifically, the effective exploitation of Information and Communications Technology (ICT) is one of the biggest levers Wales has in achieving wholesale productivity gains across the economy. Based on historical evidence, it has been possible to assess the future productivity gains that could be accrued by different sectors and geographies. It is estimated that the continued adoption and exploitation of ICT could generate an additional £1.4 billion of GVA to the Welsh economy over the coming 5 to 7 years, provided companies - particularly smaller companies - take action on the key factors of management & leadership skills, investment and the IT enablement of employees.
3. The economic policy and environment (see section 3)
6% of the 1.25 million people of working age in Wales are unemployed. Those who are in work receive on average £410 per week which is 9% below the UK average. More than half (51%) of this workforce are employed in either Public Administration, Education and Health or Distribution, Hotels and Restaurants. Financial (12%) and Manufacturing (11%) sectors are also notable employers in Wales.
A summary of the skills and employment related policy environment in Wales is included in chapter 3.
The continued adoption and exploitation of ICT could generate an additional £1.4 billion of GVA to the economy of Wales

© Copyright e-skills UK Sector Skills Council Ltd 2000-2009
The IT & Telecoms professional workforce in Wales has more than doubled since 1992
The IT & Telecoms workforce in Wales is highly qualified
1 in 25 people employed in Wales work in IT & Telecoms
2
4. IT & Telecoms in the UK - the current position (see section 4)
There are nearly 4,000 workplaces in the IT & Telecoms industry in Wales - 80% of which are IT and 20% Telecoms. 84% of these are services orientated. Micro firms make up 95% of the number of IT & Telecoms workplaces in Wales but employ just 29% of the actual workforce. By contrast, those with 200 or more employees make up less than 1% of the number of workplaces but employ 36% of the workforce.
4% of people employed in Wales work in the IT & Telecoms workforce (44,000 people). This comprises around 19,000 in the IT & Telecoms industry itself and a further 26,000 working as IT or Telecoms professionals in other industries.
Employment in IT professional occupations in Wales (within and outside of the IT & Telecoms industry itself) has more than doubled since the early 1990s. 34% are now employed as ICT Managers or IT Strategy & Planning Professionals with a further 32% being employed as Software Professionals.
Globalisation is affecting the age profile of IT & Telecoms professionals. The proportion aged 16-29 has dropped from 36% in 2001 to 14% in 2009 as the sector favours experienced workers from other sectors over young recruits from the education system.
The IT & Telecoms workforce is highly qualified. 58% of IT & Telecoms professionals in Wales hold a qualification at Level 4 or higher (undergraduate or degree level), compared to 35% for its overall working population. Moreover, only 1% of IT & Telecoms professionals are not qualified to Level 2, compared to 14% of the overall employed workforce.
Gender remains a significant issue, and in 2009, only 17% of IT & Telecoms professionals in Wales were female.

© Copyright e-skills UK Sector Skills Council Ltd 2000-2009 3
5. The changing environment - horizon scan (see section 5)
Emerging trends
A key element of the research behind this report was to understand the changing global environment with regard to IT & Telecoms, and its implications. Key forces for change were identified which are shaping the development of technology, the nature of business and the wider economy, including:
• Businessandeconomicfactorssuchastheimpactofglobalisation;theimportanceoftechnology-enabledbusinesstransformation;andthepressureforconstantinnovationin technology-intensive products and services.
• Technologydriven factors suchas increasedstandardisationand industrialisationofIT; convergenceofplatforms,devicesandservices; and theconsequent impactonmarkets and business models.
• Socialfactorssuchasenvironmentalconcernsandthedesirefor‘greenIT’;theriseof social computing and increased power to the consumer to determine content and services;andtheimpactofthenewgenerationof‘digitalnatives’andtheexpectationsthey bring to the workplace and the market.
Specific focus was given to Telecoms, and the impact of changes such as the establishment of a packet-based Internet Protocol (IP) network in the UK, convergence of IT & Telecoms services, and the introduction of new technologies such as WiMAX (Worldwide Interoperability for Microwave Access).
Implications
Understanding the effects of these forces for change on the workforce is essential if the UK is to take action to remain competitive. The over riding fact is that all communities - the IT & Telecoms workforce, business leaders and managers, and IT users - will require increasingly complex skills at ever higher levels.
The IT & Telecoms workforce
Both software development and many traditional ‘entry level’ jobs are more frequently located off shore, whilst work in the UK is increasingly focused on the application of technology to improve business performance. As IT moves deeper into the heart of businesses, growing importance will be placed on skills such as relationship management, business process analysis and design, project and programme management, business change management, systems architecture, networking, risk management and security. Web and internet specialist skills will be progressively more in demand, as will the partner and contract management skills to manage outsourced work. More generally, IT & Telecoms professionals are increasingly expected to be multi-skilled, with sophisticated business and interpersonal skills as well as technical competence.
The changing environment is having a particular impact on Telecoms professionals, with a decrease in the need for many of the existing, lower level roles, and much greater demand for higher level networking and software orientated roles.

© Copyright e-skills UK Sector Skills Council Ltd 2000-2009
Business leaders need to be able to release the transformational power of IT
4
Business leaders and managers
It will become ever more important for all organisations to be able to release the transformational power of IT, which requires a co-ordinated and integrated business and IT strategy. There is therefore a rapidly increasing need for business leaders and managers todevelop technology-relatedskills; the technologycompetenceof leaders will soon become as important as their financial competence.
IT users
Workers in virtually all occupations need to be able to use more sophisticated IT systems more effectively to create new sources of customer value. Users will need not only increased levels of skills in basic desktop technology, but they will also increasingly need to be skilled in security management and IT support processes and tools.

Employment in IT & Telecoms professional occupations is predicted to grow ten times the average for Wales
© Copyright e-skills UK Sector Skills Council Ltd 2000-2009 5
6. Recruitment into IT & Telecoms (see section 6)
IT & Telecoms workforce growth dynamics
Work with the forecasting experts Experian concluded that the growth of the IT & Telecoms sector in Wales is predicted to continue strongly to 2018. While employment in the overall workforce in Wales is forecast to increase at just 0.1% per annum for the coming decade, the IT & Telecoms professional workforce is predicted to grow ten times this rate (1% per annum) with growth primarily in ICT Manager, IT Strategy & Planning and Software Professional roles. The number of people employed in lower skilled roles will continue to contract.
However the Telecoms industry is predicted to decline slightly to 2018, at -0.1% per annum, leading to growth of 0.3% per annum for the IT & Telecoms industry combined.
Recruitment needs
In addition to catering for continued growth, recruitment into IT & Telecoms needs to also address ‘replacement demand’ - replacing those who leave the sector due to retirement or for other reasons. This has been modelled for 2008-2013 with detailed information about predicted replacement, growth rates and the sources of new entrants. On top of ‘churn’1 within IT & Telecoms occupations, there is a need for an average of 3,520 new entrants a year into IT & Telecoms professional job roles. Based on current data, the make up of this intake is expected to be as follows:
• 1,840 people a year coming from occupations other than IT or Telecoms (i.e.experienced workers who can be re-trained as IT & Telecoms professionals).
• 660peopleayearcomingfromeducation(predominantlygraduatelevelandhigher).
• 1,020peopleayearcomingfromothersources(e.g.re-enteringtheworkforceafter a career break, early retirement or unemployment).
Current demand
As with many other sectors, demand for IT & Telecoms professionals has declined over the past year as a result of the economic slowdown, both within the UK as a whole and within Wales more specifically. During the second quarter of 2009, there are estimated to have been approximately 640 positions advertised for IT & Telecoms professionals in Wales.
Skills shortages
As for the UK as a whole, the economic downturn has brought with it a significant fall in demand for IT & Telecoms professionals in Wales with the number of positions falling by 40% between 2008-2009 to approximately 640 vacancies during the second quarter of the year.
Less than one in twenty Welsh firms seeking to recruit IT & Telecoms professionals during the final quarter of 2008 stated that they were experiencing difficulties finding applicants with the right skills, qualifications or experience - a much lower proportion than that recorded across the UK as a whole (where around one in ten, or 11%, stated this to be the case).
1 Movement from one IT & Telecoms occupation to another IT & Telecoms occupation
3,520 new entrants a year are required to fill IT & Telecoms professional job roles in Wales
Less than one in twenty firms recruiting IT & Telecoms staff report difficulty finding candidates with the required skills, qualifications or experience

© Copyright e-skills UK Sector Skills Council Ltd 2000-2009
One in ten firms with IT & Telecoms professionals report gaps in the skills of these staff
6
Skills shortages were most often reported by (UK) firms recruiting for programming, technical support and IT & Telecoms management posts. More generally, employers were often found to take issue with the business, technical and sector specific skills/knowledge of candidates for IT & Telecoms posts.
7. Skills of the workforce (see section 7)
Training
Historically, IT & Telecoms professionals in Wales have been more likely than other workers tohave received job-relatededucation/training; adecline indevelopment activityoverrecent years has reversed this trend. As a result, during the second quarter of 2009, whilst 24% of IT & Telecoms professionals in Wales were thought to have received some form of job-related education/training (development), the comparison figure for the workforce overall was higher at 30%. IT & Telecoms staff in Wales are however, more likely to have been offered education/training than other workers - 83% stating this to have been the case during the second quarter of 2009.
Where education/training has been received, it is most likely to have been technical in nature, delivered off-the-job and from an educational institution of some sort though employer premises, home learning and training centres are all common options for delivery (UK data). In contrast to other employers across the UK, education/training activity is more likely to be delivered according to a structured approach in Wales as around one half of Welsh firms with IT & Telecoms professionals stated that they have a formal and regular process for identifying and addressing the development needs of these staff.
Current and future skills needs
One in ten Welsh companies with IT & Telecoms professionals consider the skills held by these workers to be at a level below that needed of them (Q1.09), these ‘skills gaps’ are likely to be the result of staff being unable to train due to work commitments (UK).
To bring the skills of IT & Telecoms professionals in line with those currently required by their employers in Wales would require the delivery of approximately 286,000 development units, whilst a further 388,000 additional units are needed over the following 3 years if the balance between skills held by IT & Telecoms professionals and the needed from them is to be maintained.
Initially, development would be required mainly at Lead and Principal level and in the areas of: Programme, Project and Supplier Management, Service Management and Delivery, Leadership and Personal Skills Development. Subsequent development activity would also be required primarily at these levels although there is also a noticeable increase in the requirement for development at Associate and Professional levels. Future activity is tending to be much more heavily targeted at Service Management and Delivery skills with a high volume of training also needed in the areas of Personal Skills Development and Programme, Project and Supplier Management.

Despite the number of applicants to Mathematical and Computer Sciences courses growing since 2004, overall numbers have still declined by 14% since 2002
© Copyright e-skills UK Sector Skills Council Ltd 2000-2009 7
8. Students and education (see section 8)
Higher Education
From 2002-2008 the total number of applicants to all degree courses in Wales has increased by 7%. By contrast (and despite numbers growing since 2004) the number of applicants to Mathematical and Computer Science courses has declined by 14% over the same time period.
Whilst acceptances over the last four years onto Mathematical and Computer Sciences courses in Wales have grown by 31% the number of qualifiers from Higher Education Institutions (HEI's) in Wales has remained static.
Further Education
IT & Telecoms professional
Of the 9,000 people taking Further Education IT & Telecoms professional courses in Wales during the academic year 2007/08, 90% were delivered through Further Education Institutions, 7% through Adult and Community Learning and 3% via Work Based Learning (WBL).
People choosing the Work Based Learning route were the most and those undertaking Adult and Community Learning the least likely to ‘withdraw’ from their learning. Whilst Further Education had the highest number of completions, Adult and Community Learning had the highest proportion of completions.
Although the majority (56%) of people taking IT & Telecoms qualifications in Wales in 2007/08 were male, notable differences existed depending on route. For example, Work Based Learning courses (77%) and Further Education (57%) were dominated by males whilst those taking the Adult and Community Learning route were largely female.
IT user
Nearly 118,000 people, the majority female, were on IT user courses in Wales during 2007/08. 81% of these were doing so through Further Education Institutions. 78% of all Further Education, Work Based Learning and Adult and Community Learning IT user learning being taken in Wales in 2007/08 were at levels 1 or 2. A further 10% is at entry level or level unknown.
Although both the Adult and Community Learning and Further Education routes had completion rates of 69%, Further Education had, in number, almost 30 times as many completions as those seen through Adult and Community Learning.

© Copyright e-skills UK Sector Skills Council Ltd 2000-2009
ICT A-level uptake in Wales has grown by 153% since 2005
Just over one in six businesses in Wales report having gaps in the IT user skills of their staff
8
Schools and Colleges
Whilst the decline in students in Wales taking A-level Computing mirrors that seen across the UK (a 32% and 35% decrease in numbers respectively), the trend in Wales in the uptake of ICT A-levels is the reverse of that seen across the UK. Numbers in Wales taking ICT A-levels have increased by 153% from 2005 to 2009, whilst across the UK numbers have fallen by 20% over the same time period.
Gender
As is the case in industry, gender imbalance is prevalent and worsening overtime and throughout the education system in IT-related courses and across the UK. In Wales, however, the proportion of females in the various stages of IT education is equal to or greater than UK averages and, in the case of A-level computing, more than double the UK proportion (22% females in Wales and 10% in the UK).
9. The wider population and use of IT (see section 9)
Recruitment
Although almost a third of employers thought the level of applicant IT user skills were generally below that required by the firm (UK), virtually all non-IT & Telecoms positions (96%) advertised by recruiters in Wales during the final quarter of 2008 were thought to require at least some level of IT user skill.
Training
Overall, 9% of UK workers receive IT user skills training each quarter and, in general, individuals are much more likely to have acquired IT user skills via self study or social/work networks as opposed to training organised by their employer (UK).
Current and future skills needs
Just over one in six (17%) Welsh employers reported the existence of gaps in their IT users' skills during the first quarter of 2009 - more than the average figure for the UK as a whole (11%).
To fully bring the skills of IT users in line with those needed by employers in Wales, would require the delivery of around 1.9 million development units, primarily at intermediate level and, for the major part, focused on the area of ‘Using IT to Find & Exchange Information’.
A further 5.3 million development units would then be needed over the coming three years to ensure that employer skills needs and IT user abilities remain in balance - in this case mainly at advanced level and focused primarily on: ‘Improving Productivity Using IT’, ‘Using IT to Find & Exchange Information’ and ‘Using Productivity Tools & Applications’.

© Copyright e-skills UK Sector Skills Council Ltd 2000-2009 9

© Copyright e-skills UK Sector Skills Council Ltd 2000-2009
2 Sector Skills Councils (SSC) are employer-led organisations that cover specific economic sectors within the UK;theyaimtoimproveproductivityandskills,reduceskillsgapsandshortagesandimprovethelearningsupply within their given sector. SSCs are licensed by the Government and through the UK Commission for Employment and Skills (UKCES)
10
The IT & Telecoms sector is recognised as being essential to unlocking potential, contributing to a more prosperous and inclusive society and ensuring that Wales is a global leader in the digital economy. This is evidenced with the Welsh Assembly Government (WAG) describing technology as “having an increasing impact on every element of your life”.
e-skills UK is the Sector Skills Council2 for Business and Information Technology; anemployer-led organisation rated as ‘outstanding’ in the re-licensing of the Sector Skills Councils in 2009. e-skills UK’s objective is to work with employers, educators and Government to ensure the UK has the technology skills for Digital Britain.
Building on previous findings, e-skills UK has undertaken research into the UK’s IT & Telecoms workforce, technology trends, opportunities and challenges in order to deliver authoritative labour market intelligence which enables effective influence on policy, strategy and solution development. The resultant suite of publications, ‘Technology Counts: IT & Telecoms Insights 2010’ sets out the current reality, forecasts the future based on the best available intelligence, and assesses the implications for the IT & Telecoms sector.
The reports for the UK, England, Northern Ireland, Scotland and Wales build on existing knowledge with new primary research amongst 145 employers in Wales; an analysisoftechnology-relatedtrendsandtheir implicationsforthefuture;updatedemploymentforecastinginlightoftherecession(inpartnershipwithExperian);andadetailedanalysisof the workforce profile and current skills provision.
These reports will inform e-skills UK, government, education providers, employers and the IT & Telecoms sector of the implications of the emerging trends and the changing environment.
On the basis of this research, e-skills UK will continue to work with employers and partners to refine and implement the Strategic Plan for 2009-2014 for Wales, providing:
• Thelatestexpertinputintoe-skillsUK’sstrategyandsectorsolutionsdevelopment.
• Accessibleresearchandintelligenceforemployers,educatorsandothersneedinganin-depth understanding of employer skills needs.
• Influenceongovernmentpolicydevelopmentonbehalfofthesector.
The delivery of this strategic plan will help to ensure that Wales is world class in technology skills - equipped to play a full role in the e-economy over the coming decade, and able to derive maximum benefit from the power of technology to transform business competitiveness, productivity and social inclusion.
1.0 Introduction
“Technology is having an increasing impact on every element of your life. Your career, your business, your child's education, even doing your shopping is being improved through effective use of Information and Communication Technology (ICT)”
Welsh Assembly Government

© Copyright e-skills UK Sector Skills Council Ltd 2000-2009
2.0 The importance of IT & Telecoms
11
This section considers the scope of the sector, the importance of IT & Telecoms to the economy of Wales and describes how it fits into efforts to create a ‘Digital Britain’.
2.1 Scope of the sector
The IT & Telecoms sector includes all those employed in the IT & Telecoms industries and those in IT or Telecoms occupations in other sectors. Figure 1 below shows the high level segmentation of this workforce.
Figure 1: IT & Telecoms Workforce in Wales - High Level Segmentation
Population (A)2,959,000
Workforce (B)1,248,000
Total IT & T industry
(C+D)18,600
IT & T professionals in IT & T industry
(C) 10,900 IT & T professionals in other sectors
(E) 25,500All other occupations in
the IT & T industry (D) 7,700
0.0
5.4South East England
London 5.4
3.6North West England
East of England 3.4
2.9West Midlands
Scotland 2.8
2.7Yorkshire & Humber
South West England 2.7
East Midlands 2.4
Wales 1.4
North East England 1.2
Northern Ireland 0.8
1.0 2.0 3.0 4.0 5.0 6.0
GVA (£bn)
Total IT & T workforce (C+D+E) 44,100
Total IT & T professionals (C+E) 36,400
0
25%
50%
75%
100%
1-10 11-49 50-199 200+
Workplaces Employees
0%
1%
2%
8%
8%
10%
13%
25%
33%
0 5% 10% 15% 20% 25% 35%30% 40%
Agriculture Forestry & Fishing
Energy & Water
Distribution, Hotels & Restaurants
Other services
Construction
Manufacturing
Public Administration, Education & Health
Banking & Finance
Transport & Communication
0
5,000
10,000
15,000
20,000
25,000
30,000
35,000
1992 1993 1994 1995 1996 1997 1998 1999 2000 2001 2002 2003 2004 2005 2006 2007 2008 2009
£600
£400
£200
£0
36%29%
24%30%
37%28% 27%
20%14%
35%39%
38% 23%16%
23%35%
35% 41%
24%
21%21%
29%34% 34%
31%
26%30%
12% 17% 18% 13% 14%6%
20%15%
0%
25%
50%
75%
100%
2001 2002 2003 2004 2005 2006 2007 2008 2009
16-29 30-39 40-49 50+
80%
70%
60%
50%
40%
30%
20%
10%
0%
ACLWBLFE
39%
61%
39%
61%56%
44%
57%
43%
28%
72%
28%
72%
FoundationTrends
1995 2000
Skill changes New skills
2005 2007 2010 2015 2020
Industrialisation of technology
Security and Data Protection
Communications convergence and integration
Innovation
Transformation through IT
The pool of talent and gender balance
Information and analytics
Consumerisation and convergence of IT
Green IT: environmental computing
Social Computing and Web 2.0
Digital Natives
Unemployment500
Retire160
Non IT&T Job Switcher
1,930
IT&T JobSwitcher
620
Look afterfamily
90
Become a student
220
Otherinactive
300
Job switcher fromIT & Telecomsoccupations
610
Entrants to IT & Telecoms occupations
3,520
Job switchers fromNon IT & Telecoms
occupations1,840
Unemployment580
Education660
Other Inactive440
NET change inemploymentOccupation
320
Gross JobOpportunities
4,130
ReplacementJobs3,810
Internet 2%
Database 4%
Networking 4%
Management 5%
SoftwareEngineering
7%
Technical/PC support
22%
Systems design/development
55%
47%
38%
44%
48%
82%
75%
71%
27%
22%
22%
9%
21%
26%
2%52%
35%
34%
29%
9%
4%
3%
Client/customer interaction skills
Other interpersonal skills
Business skills
Skills in general
Sector knowledge/experience
Other non-technical skills
Higher level technical IT skills
Below the level required Equal to the level required Above the level required
56%
57%
77%
69%
68%
68%
71%
15%
2%
15%
21%
23%
25%
15%29%
28%
21%
17%
12%
9%
4%
General software skills/knowledge
Email/Internet skills
Database skills
Overall IT user skills
General hardware skills/knowledge
Word-processing skills
Spreadsheet skills
Below the level required Equal to the level required Above the level required
0
30%
20%
10%
40%
50%
60%
Q2.01 Q2.02 Q2.03 Q2.04 Q2.05 Q2.06 Q2.07 Q2.08 Q2.09
All ICT staff All workers
29%Staff are new to the job/company
5%Staff cannot reach required skill levels even with training
77%Staff unable to train due to work commitments
41%New projects/products/ services being launched
5%Budgets/ lack of funds
60%Company doesn’t train/train enough
8%Other
69%New systems/processes/equipment introduced
48%Technical IT/Telecoms (professional level)
23%Management (other)
21%Management (IT/Telecoms related)
21%Other (IT/Telecoms related)
17%Personal development training
16%General company
15%IT User skills
15%Generic employment training
11%Function specific training
6%Other (general)
4%Finance
0
4,000
6,000
5,000
1,000
3,000
2,000
2002 2003 2004 2005 2006 2007 2008Year
0
5000
10,000
15,000
20,000
25,000
30,000
35,000
2002 2003 2004 2005 2006 2007 2008
G Group Accepts: Mathematical & Computing Science Computing Accepts
0
200
400
600
800
1,000
1,200
1,400
2002 2003 2004 2005 2006 2007 2008
39%Staff are new to the job/company
14%Staff cannot reach required skill levels even with training
64%Staff unable to train due to work commitments
53%New projects/products/ services being launched
1%Budgets/ lack of funds
56%Company doesn’t train/train enough
15%Other
48%New systems/processes/equipment introduced
0% 10% 20% 30% 40% 50% 60% 70% 80% 90% 100%
UK
South West
South East
London
East of England
West Midlands
East Midlands
Yorkshire & Humber
North West
North East
England
Scotland
Northern Ireland
Wales
Agriculture forestry and fishing Distribution Hotels & Restaurants Other services
Energy & Water Transport & Communication NA / DNA
Manufacturing Banking & Finance
Construction Public administration, Education & Health
ICT Managers/IT Strategy & Planning Professionals
Software Professionals
201820092001
45,000
30,000
15,000
05,900
6,700
12,700
11,700
11,400
12,900
13,600
13,900
12,800
IT Operations Technicians/IT User Support Technicians/Database Assistants & Clerks/Telecoms Engineers/Line Repairers & Cable Jointers/Computer Engineers
Computing & Telecoms Graduatesin employment (490)
IT & Telecoms industry: new graduate recruits (300)
IT & Telecoms professionals: new graduate recruits (445)
Graduates of subjects other than Computing & Telecoms (300) are shown in RedEntrants to the IT & Telecoms Workforce (560) are shown in italics
230
140100
15 120
60
125
10% 12
%
12%
12%
13% 14%
14%
14% 15
%
15%
16%
16%
17%
17%
17%
0
5%
10%
15%
20%
25%
30%
Aus
tria
Por
tuga
l
Italy
Nor
way
Pol
and
Slo
veni
a
Cze
ch R
epub
lic
Spa
in
Net
herla
nds
Slo
vaki
a
Ger
man
y
Den
mar
k
Irela
nd UK
Sw
eden
18%
Finl
and
21%
Hun
gary
23%
Rom
ania
23%
Bul
garia
18%
Wal
es
95%
4% 1% 1%
29%
13%
21%
36%
All IT & Telecoms Professionals
£500
£410
Average across Wales
£450
Average across the UK
1,080
Q2.08
1,200
Q3.08
990
Q4.08
770
Q1.09
640
Q2.09
Number of applicants to G Mathematical & Comp Sci (Group) in Wales
0
10,000
5,000
15,000
20,000
25,000
30,000
35,000
2002 2003 2004 2005 2006 2007 2008 2009
Year
IT P
rofe
ssio
nal w
orkf
orce
0
1,000
2,000
3,000
4,000
5,000
6,000
App
lican
ts
Applicants to Mathematical and Computer Science courses
IT Professional workforce
Some other way 2%
Training course - not organised/paid forby an employer 18%
Self-study using books, CD-ROMs, etc 21%
Training course - organised/paid for byan employer 30%
Formalised educational institution(school/college/university) 34%
Informal assistance from colleagues,relatives, friends etc 54%
Self-study (learning by doing) 59%
2006/07 2007/08 2006/07 2007/08 2006/07 2007/08
Male Female
100%
75%
50%
25%
0%
ACL TOTALWBLFE
55%
45%
57%
43%
87%
13%
77%
23%
39%
61%
35%
65%
55%
45%
56%
44%
2006/07 2007/08 2006/07 2007/08 2006/07 2007/08 2006/07 2007/08
Male Female
0
600
400
200
800
1,000
1,200
1,400
1,600
2005 2006 2007 2008 2009
ICT Computing
EmergingTrends
Source: e-skills UK / Office for National Statistics Labour Force Survey (ONS LFS) April-June 2009
Figures may not sum due to rounding
The IT & Telecoms sector consists of:
• Business services such as consulting, business process re-engineering and change management.
• IT services including solution design, systems integration, internet and web.
• Software development including applications and games.
• IT operations including information management, security, service delivery and systems maintenance.
• Networking and communications, including mobile and fixed line telecommunications.
• IT project and supplier management.
A full list of IT % Telecoms related Standard Industrial Classifications (SIC) can be found in Annex B.
e-skills UK has the responsibility for the IT-related skills needs of business leaders and managers, who need to exploit the potential of IT for their businesses, and the IT-related skills needs of IT users who make use of IT as a tool to support their everyday life and work.
2.1.1 Productivity and competitiveness of IT & Telecoms
Information and Communication Technology (ICT) has a key role to play in the Welsh economy and will continue to drive global competitiveness and productivity amongst all sectors.

© Copyright e-skills UK Sector Skills Council Ltd 2000-2009
3 ‘Raising UK Productivity: Unlocking the Potential of ICT’, Department for Business, Enterprise and Regulatory Reform June 2007
4 ‘It ain’t what you do it’s the way that you do I.T. Testing explanations of productivity growth using US affiliates.’ Nick Bloom, Raffaella Sadun and John Van Reenen, Centre for Economic Performance LSE July 2005
5 ‘IT investment, ICT Use and UK Firm Productivity’ Rafaella Sadun, Shikeb Farooki, Giles Gale, Mark Lever, Office for National Statistics August 2005
6 ‘The 2008 Productivity and Competitiveness Indicators: ICT and Productivity’, Department for Business, Enterprise and Regulatory Reform
7 ‘The Communications Market 2009: Key Market Trends’, Ofcom8 GVA measures the contribution to the economy of each individual producer, industry or sector in the UK. It is
the difference between the value of goods and services produced and the cost of the raw materials and other inputs which are used up in production, in any given sector or industry. GVA + taxes on products - subsidies on products = Gross Domestic Product (GDP). GDP is a key indicator of the state of the whole economy
9 Office for National Statistics (ONS) ABI GVA 2007 data, for IT & Telecoms SIC 22.33, 30.02, 32.2, 64.2 & 72 10 Output consists of those goods or services that are produced within an establishment that become available
for use outside that establishment, plus any goods and services produced for own final use11 Office for National Statistics (ONS) Supply and Use Tables July 2009. 2004-2007 data for IT & Telecoms SIC
64.2 and 7212 The total regional estimate for a variable summed across all regions within any industry will not necessarily
equal the UK industry estimate of the variable. This is due to the method of calculating estimated regional data. The regional estimates are constrained to the UK data at the all-industry level. Source http://www.statistics.gov.uk/abi/regional_data.asp
13 SIC 64 includes Telecommunications and Post (At UK level Telecommunications makes up 80% of total GVA for Post and Telecommunications)
Since 1998 Wales’s IT & Telecoms industry GVA contribution has grown by 84%
12
Research shows that a strong IT & Telecoms sector underpins the UK economy3 with ICT contributing to productivity growth by raising the level of capital and technology available to workforces and enabling the development of more profitable business models.
Directly linked to this, there is growing evidence that effective application of IT by companies delivers identifiable productivity improvements. A recent paper from the London School of Economics (LSE) concludes that half of Europe’s productivity gains in recent years can be attributed to IT investments4. This impact has, however, emerged unevenly across firms, sectors and countries.
Studies have investigated the causes of these differences, in particular to understand the better productivity gains in the United States (US) compared to the UK and the comparative differences across Europe. One such study undertaken by the LSE found that US multinational firms are on average 8.5% more productive than UK domestic owned firms, and that almost all of this difference is due to the higher productivity impact of their use of ICT. Further research by the Office for National Statistics (ONS) also concluded that over 80% of this productivity advantage is explained by better use of IT5.
The investment into digital technology, particularly broadband networks also promotes productivity and encourages competition as it reduces costs to consumers6. As a result, the availability of high speed broadband has risen on a global scale and the Government’s ‘Digital Britain’ report sets out the goal of delivering high broadband speeds as a minimum by 20127.
The UK’s IT & Telecoms industry produces an annual Gross Value Added (GVA)8 of£71 billion, 8.4% of the total UK economy9. GVA at current basic prices for the industry grew by 114% between 1997 and 2007 compared to a growth of 63% for the whole economy. IT & Telecoms industry output10 in 2007 was 4% of the total UK economy having grown by 13% between 2004 and 200711.
Between 1998 and 2007 GVA for the IT & Telecoms industry in Wales grew by 84%, totalling £1.2 billion12 in 2007. This makes up 5%13 of Wales’s and 0.2% of the UK’s total economy.

Technology related skills are of critical importance to the future economic and social success of Wales
Continued adoption and exploitation of ICT could generate an additional £1.4 billion of GVA across the Welsh economy
© Copyright e-skills UK Sector Skills Council Ltd 2000-2009 13
Not withstanding the direct contribution of the sector IT & Telecoms is also recognised as being at the centre of the Welsh social agenda and the importance of ICT skills to the economy and in employment is well known14. It is widely recognised by citizens, commerce and the Government that the benefits of digital technology can be powerful both socially and economically15.
It is therefore clear that technology related skills are a major factor in economic and social success. This affects not only the 44,000 people in the IT & Telecoms workforce in Wales, but also the 162,000 business managers and 911,000 employees who use IT in their daily work.
2.1.2 ICT adoption, contribution and exploitation
Work has been undertaken to assess the extent to which the adoption and exploitation of ICT could contribute to the economies of England, Scotland, Wales and Northern Ireland in the future. Based on historical evidence, it has been possible to assess the future productivity gains that could be accrued by businesses in different industry sectors. The volume and mix of businesses within a particular geography (i.e. its current starting point) will give rise to different levels of available productivity gain at the regional and national levels.
This modelling work suggests that continued adoption and exploitation of ICT could generate an additional £1.4billion GVA in the Welsh economy over the coming 5 to 7 years.
Figure 2: Potential productivity uplift from ICT over the next 5 to 7 years
Source: ‘IT & Telecoms Insights 2008: The impact of ICT on UK Productivity’, e-skills UK / Adroit Economics and
Regeneris Consulting 2008
These benefits assume the rate of investment in ICT is maintained at current rates. The research concludes that, if more were invested, in more advanced ICT, especially by small firms (because of their relatively poor level of adoption of technology), then there are even greater opportunities for productivity improvement16.
14 ‘Independent Review of ICT User Skills’ Baroness Estelle Morris, June 200915 ‘Delivering Digital Inclusion: An Action Plan for Consultation’ Alliance for Digital Inclusion, 200816 ‘IT & Telecoms Insights 2008: The Impact of ICT on UK Productivity’, e-skills UK / Adroit Economics and
Regeneris Consulting, 2008
Population (A)2,959,000
Workforce (B)1,248,000
Total IT & T industry
(C+D)18,600
IT & T professionals in IT & T industry
(C) 10,900 IT & T professionals in other sectors
(E) 25,500All other occupations in
the IT & T industry (D) 7,700
0.0
5.4South East England
London 5.4
3.6North West England
East of England 3.4
2.9West Midlands
Scotland 2.8
2.7Yorkshire & Humber
South West England 2.7
East Midlands 2.4
Wales 1.4
North East England 1.2
Northern Ireland 0.8
1.0 2.0 3.0 4.0 5.0 6.0
GVA (£bn)
Total IT & T workforce (C+D+E) 44,100
Total IT & T professionals (C+E) 36,400
0
25%
50%
75%
100%
1-10 11-49 50-199 200+
Workplaces Employees
0%
1%
2%
8%
8%
10%
13%
25%
33%
0 5% 10% 15% 20% 25% 35%30% 40%
Agriculture Forestry & Fishing
Energy & Water
Distribution, Hotels & Restaurants
Other services
Construction
Manufacturing
Public Administration, Education & Health
Banking & Finance
Transport & Communication
0
5,000
10,000
15,000
20,000
25,000
30,000
35,000
1992 1993 1994 1995 1996 1997 1998 1999 2000 2001 2002 2003 2004 2005 2006 2007 2008 2009
£600
£400
£200
£0
36%29%
24%30%
37%28% 27%
20%14%
35%39%
38% 23%16%
23%35%
35% 41%
24%
21%21%
29%34% 34%
31%
26%30%
12% 17% 18% 13% 14%6%
20%15%
0%
25%
50%
75%
100%
2001 2002 2003 2004 2005 2006 2007 2008 2009
16-29 30-39 40-49 50+
80%
70%
60%
50%
40%
30%
20%
10%
0%
ACLWBLFE
39%
61%
39%
61%56%
44%
57%
43%
28%
72%
28%
72%
FoundationTrends
1995 2000
Skill changes New skills
2005 2007 2010 2015 2020
Industrialisation of technology
Security and Data Protection
Communications convergence and integration
Innovation
Transformation through IT
The pool of talent and gender balance
Information and analytics
Consumerisation and convergence of IT
Green IT: environmental computing
Social Computing and Web 2.0
Digital Natives
Unemployment500
Retire160
Non IT&T Job Switcher
1,930
IT&T JobSwitcher
620
Look afterfamily
90
Become a student
220
Otherinactive
300
Job switcher fromIT & Telecomsoccupations
610
Entrants to IT & Telecoms occupations
3,520
Job switchers fromNon IT & Telecoms
occupations1,840
Unemployment580
Education660
Other Inactive440
NET change inemploymentOccupation
320
Gross JobOpportunities
4,130
ReplacementJobs3,810
Internet 2%
Database 4%
Networking 4%
Management 5%
SoftwareEngineering
7%
Technical/PC support
22%
Systems design/development
55%
47%
38%
44%
48%
82%
75%
71%
27%
22%
22%
9%
21%
26%
2%52%
35%
34%
29%
9%
4%
3%
Client/customer interaction skills
Other interpersonal skills
Business skills
Skills in general
Sector knowledge/experience
Other non-technical skills
Higher level technical IT skills
Below the level required Equal to the level required Above the level required
56%
57%
77%
69%
68%
68%
71%
15%
2%
15%
21%
23%
25%
15%29%
28%
21%
17%
12%
9%
4%
General software skills/knowledge
Email/Internet skills
Database skills
Overall IT user skills
General hardware skills/knowledge
Word-processing skills
Spreadsheet skills
Below the level required Equal to the level required Above the level required
0
30%
20%
10%
40%
50%
60%
Q2.01 Q2.02 Q2.03 Q2.04 Q2.05 Q2.06 Q2.07 Q2.08 Q2.09
All ICT staff All workers
29%Staff are new to the job/company
5%Staff cannot reach required skill levels even with training
77%Staff unable to train due to work commitments
41%New projects/products/ services being launched
5%Budgets/ lack of funds
60%Company doesn’t train/train enough
8%Other
69%New systems/processes/equipment introduced
48%Technical IT/Telecoms (professional level)
23%Management (other)
21%Management (IT/Telecoms related)
21%Other (IT/Telecoms related)
17%Personal development training
16%General company
15%IT User skills
15%Generic employment training
11%Function specific training
6%Other (general)
4%Finance
0
4,000
6,000
5,000
1,000
3,000
2,000
2002 2003 2004 2005 2006 2007 2008Year
0
5000
10,000
15,000
20,000
25,000
30,000
35,000
2002 2003 2004 2005 2006 2007 2008
G Group Accepts: Mathematical & Computing Science Computing Accepts
0
200
400
600
800
1,000
1,200
1,400
2002 2003 2004 2005 2006 2007 2008
39%Staff are new to the job/company
14%Staff cannot reach required skill levels even with training
64%Staff unable to train due to work commitments
53%New projects/products/ services being launched
1%Budgets/ lack of funds
56%Company doesn’t train/train enough
15%Other
48%New systems/processes/equipment introduced
0% 10% 20% 30% 40% 50% 60% 70% 80% 90% 100%
UK
South West
South East
London
East of England
West Midlands
East Midlands
Yorkshire & Humber
North West
North East
England
Scotland
Northern Ireland
Wales
Agriculture forestry and fishing Distribution Hotels & Restaurants Other services
Energy & Water Transport & Communication NA / DNA
Manufacturing Banking & Finance
Construction Public administration, Education & Health
ICT Managers/IT Strategy & Planning Professionals
Software Professionals
201820092001
45,000
30,000
15,000
05,900
6,700
12,700
11,700
11,400
12,900
13,600
13,900
12,800
IT Operations Technicians/IT User Support Technicians/Database Assistants & Clerks/Telecoms Engineers/Line Repairers & Cable Jointers/Computer Engineers
Computing & Telecoms Graduatesin employment (490)
IT & Telecoms industry: new graduate recruits (300)
IT & Telecoms professionals: new graduate recruits (445)
Graduates of subjects other than Computing & Telecoms (300) are shown in RedEntrants to the IT & Telecoms Workforce (560) are shown in italics
230
140100
15 120
60
125
10% 12
%
12%
12%
13% 14%
14%
14% 15
%
15%
16%
16%
17%
17%
17%
0
5%
10%
15%
20%
25%
30%
Aus
tria
Por
tuga
l
Italy
Nor
way
Pol
and
Slo
veni
a
Cze
ch R
epub
lic
Spa
in
Net
herla
nds
Slo
vaki
a
Ger
man
y
Den
mar
k
Irela
nd UK
Sw
eden
18%
Finl
and
21%
Hun
gary
23%
Rom
ania
23%
Bul
garia
18%
Wal
es
95%
4% 1% 1%
29%
13%
21%
36%
All IT & Telecoms Professionals
£500
£410
Average across Wales
£450
Average across the UK
1,080
Q2.08
1,200
Q3.08
990
Q4.08
770
Q1.09
640
Q2.09
Number of applicants to G Mathematical & Comp Sci (Group) in Wales
0
10,000
5,000
15,000
20,000
25,000
30,000
35,000
2002 2003 2004 2005 2006 2007 2008 2009
Year
IT P
rofe
ssio
nal w
orkf
orce
0
1,000
2,000
3,000
4,000
5,000
6,000
App
lican
ts
Applicants to Mathematical and Computer Science courses
IT Professional workforce
Some other way 2%
Training course - not organised/paid forby an employer 18%
Self-study using books, CD-ROMs, etc 21%
Training course - organised/paid for byan employer 30%
Formalised educational institution(school/college/university) 34%
Informal assistance from colleagues,relatives, friends etc 54%
Self-study (learning by doing) 59%
2006/07 2007/08 2006/07 2007/08 2006/07 2007/08
Male Female
100%
75%
50%
25%
0%
ACL TOTALWBLFE
55%
45%
57%
43%
87%
13%
77%
23%
39%
61%
35%
65%
55%
45%
56%
44%
2006/07 2007/08 2006/07 2007/08 2006/07 2007/08 2006/07 2007/08
Male Female
0
600
400
200
800
1,000
1,200
1,400
1,600
2005 2006 2007 2008 2009
ICT Computing
EmergingTrends

© Copyright e-skills UK Sector Skills Council Ltd 2000-2009
17 'Technology adoption fuels recovery tipping point for UK SMEs: Innovation and optimism at the launch of Small Business Week.' Vanson Bourne and BT Business, 2009
Globalisation will continue to facilitate growth, as more technology-enabled projects become possible
Technologists need to be increasingly more business focused whilst business leaders need to be more technology savvy
The IT professional workforce will be central to Wales's recovery from the recession
14
2.2 Globalisation and economic developments
Globalisation has changed the Welsh economy, competitiveness and productivity. The IT & Telecoms sector has experienced the effects of globalisation for some years with the sourcing of certain IT activities from well skilled, lower cost countries (geosourcing) now well established. This gives rise to challenges in the development pathways for new IT & Telecoms professionals, as many of the traditional entry level roles are less prevalent in Wales. However, globalisation will continue to facilitate growth, as more technology enabled projects become possible lower development and delivery costs make more business cases for such projects viable.
Recent developments have seen an economic downturn that has affected the global economies impacting on business start ups and failures, recruitment and employment levels and industry turnover. The IT & Telecoms sector is far from immune from the recession but has various strengths. These include the lessons of the dotcom bubble expansion of 2001 encouraging technology companies to adopt increasingly flexible business models, which allow for a swift response to changing global markets.
Small businesses bringing in new technology have been found to have been least affected by the recession. Companies with a positive attitude to technology adoption had a 69% better than average experience of the recession, whereas technology laggards suffered a 34% worse recession experience than average17.
A significant part of an organisation’s IT budget is spent on the ongoing management and maintenance of technology systems. These systems are now the backbone of most companies, critical for everything from service delivery to financial management.
There is a growing appreciation that IT can help companies weather the downturn. Making the most of technology will help organisations to achieve their business objectives, whether these are to better manage costs, reach new markets, or boost productivity.
As a result of the strength of the IT & Telecoms sector, the IT professional workforce will be central to Wales’s recovery from recession.
All industries need, and will continue to require, highly skilled technical professionals. There is an arguably even greater need for business-focused technologists who can understand business needs, know how to apply IT to solve business problems, and can manage technology projects to deliver direct business value.
The pace of technological change continues to accelerate. To make the most of this - not just now, but to aid recovery, and long after the recession is over - Wales must continue to invest in the technology skills pool from the IT professionals who create the systems, to the business managers who need to be able to exploit them for business benefit, to the individuals who need to be able to use them in their day to day jobs.

© Copyright e-skills UK Sector Skills Council Ltd 2000-2009 15
2.2.1 Convergence
The IT & Telecoms sector is at an advantage as companies are no longer confined to their own markets and convergence is prominent across all the research. Telecoms convergence expands across multiple industries with fixed, mobile and IP service providers offering services to the end user. This convergence is a combination of these services operating on one platform and moving from hardware intensive to software intensive platforms. Subsequently, the management of voice, data and images will converge in information based services.
Software is at the heart of this converged world and it is central to the internet, to phones, mobile devices and the media experience as new generations of internet services are emerging. Consumers are increasingly looking for high speed access to any content or application using any device.
For the Telecoms industry, this means that simple connectivity is increasingly commoditised, and value is created by providing sophisticated services and solutions. Of particularly highimpactare:voice,dataandimageconvergence;fixed/wireless/mobileconvergence;telecom/media/contentservicesconvergence;InternetProtocol/ITnetworkarchitectureconvergence and device convergence (consumer electronics/telecoms).
Both IT & Telecoms companies are changing their offerings and partnerships to take advantage of global opportunities in mobile communications, business consulting, networked information services and entertainment.

© Copyright e-skills UK Sector Skills Council Ltd 2000-2009
18‘DigitalBritain;FinalReport’DepartmentforCulture,MediaandSportandDepartmentforBusinessInnovation and Skills, June 2009
19 ‘It ain’t what you do it’s the way that you do I.T. Testing explanations of productivity growth using US affiliates.’ Nick Bloom, Raffaella Sadun and John Van Reenen, Centre for Economic Performance, London School of Economics
20‘DigitalBritain;FinalReport’DepartmentforCulture,MediaandSportandDepartmentforBusinessInnovation and Skills, June 2009
21 Welsh Assembly Government’s response to the Digital Britain Interim Report, March 2009
“...we welcome plans to develop a realistic and deliverable universal service model as part of Digital Britain...”
Ieuan Wyn Jones, Deputy First Minister
16
2.3 Creating ‘Digital Britain’
The Government published the Digital Britain Report in June 2009, its strategic vision for ensuring that the UK is at the leading edge of the global digital economy and positioning the UK as a ‘long-term leader in communications’18.
The report introduces policies to maximise the social and economic benefits from digital technologies and provides actions for recommendations to promote and protect talent and innovation in our creative industries. It also distinguishes the importance of digital technologies to the UK’s long term future and acknowledges the need to take action on skills if we are to make the most of them.
Half of Europe’s productivity gains can be attributed to IT investments19. As such, it is evident that the Government views IT & Telecoms as a crucial sector in achieving the vision set out in ‘Digital Britain’ and recognises the need for capitalising on the benefits of the digital revolution.20
It is clear, therefore that digital economy and digital work skills are needed within the IT & Telecoms sector if the UK’s economy is to become part of the government’s social and digital incentive and achieve its vision of a ‘Digital Britain’.
The Welsh Assembly Government welcomes the publication of the UK Government's ‘Digital Britain’ Report particularly the introduction of a Universal Service Commitment of at least 2Mbps broadband by 2012 and the stated desire to deliver next generation networks to the majority of the UK population. Deputy First Minister Ieuan Wyn Jones stated “...we welcome plans to develop a realistic and deliverable universal service model as part of Digital Britain...”.21

Welsh GVA per head is the lowest of all nations/regions within the UK
© Copyright e-skills UK Sector Skills Council Ltd 2000-2009
3.0 The economic and policy environment in Wales
17
This section sets out the economic background for Wales and the IT & Telecoms industry within it. It also gives an overview of the current policy environment with particular reference to skills policy.
3.1 Key economic data
Table 1 presents some key economic statistics for Wales with the UK offered as a comparison.
Table 1: Economic statistics for Wales and the rest of the UK
Region / Nation
Population Workforce GVA per Head (£)
Unemployment rate
Average gross weekly earnings (£)
Wales 2,959,000 1,249,000 15,000 6% 410
Scotland 5,103,000 2,371,000 19,000 6% 430
Northern Ireland
1,759,000 718,000 16,000 5% 390
England 51,144,000 23,161,000 20,000 6% 450
North East 2,553,000 1,070,000 16,000 8% 390
North West 6,853,000 3,013,000 17,000 7% 400
Yorkshire & Humber
5,191,000 2,282,000 17,000 7% 400
East Midlands 4,411,000 2,039,000 18,000 6% 430
West Midlands
5,378,000 2,308,000 17,000 9% 400
East of England
5,676,000 2,651,000 21,000 5% 490
London 7,627,000 3,524,000 30,000 7% 540
South East 8,297,000 3,921,000 23,000 5% 500
South West 5,159,000 2,353,000 18,000 5% 420
United Kingdom
60,966,000 27,498,000 20,000 6% 450
Source: Office for National Statistics Labour Force Survey (ONS LFS) April-June 2009 / ABI 2007
6% of the 1.25 million people of working age in Wales are unemployed. Those who are in work receive on average22 £410 per week which is 9% below the UK average.
22 Full time gross weekly earnings

© Copyright e-skills UK Sector Skills Council Ltd 2000-2009 18
3.2 Industries and employment in Wales
Figure 3: Proportion of the workforce involved in each major industry by nation and region
Source: Office for National Statistics Labour Force Survey (ONS LFS) April-June 2009
Figure 3 identifies that more than half (51%) of those working in Wales are employed in either Public administration, Education and Health or Distribution, Hotels and Restaurants. Financial (12%) and Manufacturing (11%) sectors are also notable employers in Wales.
Population (A)2,959,000
Workforce (B)1,248,000
Total IT & T industry
(C+D)18,600
IT & T professionals in IT & T industry
(C) 10,900 IT & T professionals in other sectors
(E) 25,500All other occupations in
the IT & T industry (D) 7,700
0.0
5.4South East England
London 5.4
3.6North West England
East of England 3.4
2.9West Midlands
Scotland 2.8
2.7Yorkshire & Humber
South West England 2.7
East Midlands 2.4
Wales 1.4
North East England 1.2
Northern Ireland 0.8
1.0 2.0 3.0 4.0 5.0 6.0
GVA (£bn)
Total IT & T workforce (C+D+E) 44,100
Total IT & T professionals (C+E) 36,400
0
25%
50%
75%
100%
1-10 11-49 50-199 200+
Workplaces Employees
0%
1%
2%
8%
8%
10%
13%
25%
33%
0 5% 10% 15% 20% 25% 35%30% 40%
Agriculture Forestry & Fishing
Energy & Water
Distribution, Hotels & Restaurants
Other services
Construction
Manufacturing
Public Administration, Education & Health
Banking & Finance
Transport & Communication
0
5,000
10,000
15,000
20,000
25,000
30,000
35,000
1992 1993 1994 1995 1996 1997 1998 1999 2000 2001 2002 2003 2004 2005 2006 2007 2008 2009
£600
£400
£200
£0
36%29%
24%30%
37%28% 27%
20%14%
35%39%
38% 23%16%
23%35%
35% 41%
24%
21%21%
29%34% 34%
31%
26%30%
12% 17% 18% 13% 14%6%
20%15%
0%
25%
50%
75%
100%
2001 2002 2003 2004 2005 2006 2007 2008 2009
16-29 30-39 40-49 50+
80%
70%
60%
50%
40%
30%
20%
10%
0%
ACLWBLFE
39%
61%
39%
61%56%
44%
57%
43%
28%
72%
28%
72%
FoundationTrends
1995 2000
Skill changes New skills
2005 2007 2010 2015 2020
Industrialisation of technology
Security and Data Protection
Communications convergence and integration
Innovation
Transformation through IT
The pool of talent and gender balance
Information and analytics
Consumerisation and convergence of IT
Green IT: environmental computing
Social Computing and Web 2.0
Digital Natives
Unemployment500
Retire160
Non IT&T Job Switcher
1,930
IT&T JobSwitcher
620
Look afterfamily
90
Become a student
220
Otherinactive
300
Job switcher fromIT & Telecomsoccupations
610
Entrants to IT & Telecoms occupations
3,520
Job switchers fromNon IT & Telecoms
occupations1,840
Unemployment580
Education660
Other Inactive440
NET change inemploymentOccupation
320
Gross JobOpportunities
4,130
ReplacementJobs3,810
Internet 2%
Database 4%
Networking 4%
Management 5%
SoftwareEngineering
7%
Technical/PC support
22%
Systems design/development
55%
47%
38%
44%
48%
82%
75%
71%
27%
22%
22%
9%
21%
26%
2%52%
35%
34%
29%
9%
4%
3%
Client/customer interaction skills
Other interpersonal skills
Business skills
Skills in general
Sector knowledge/experience
Other non-technical skills
Higher level technical IT skills
Below the level required Equal to the level required Above the level required
56%
57%
77%
69%
68%
68%
71%
15%
2%
15%
21%
23%
25%
15%29%
28%
21%
17%
12%
9%
4%
General software skills/knowledge
Email/Internet skills
Database skills
Overall IT user skills
General hardware skills/knowledge
Word-processing skills
Spreadsheet skills
Below the level required Equal to the level required Above the level required
0
30%
20%
10%
40%
50%
60%
Q2.01 Q2.02 Q2.03 Q2.04 Q2.05 Q2.06 Q2.07 Q2.08 Q2.09
All ICT staff All workers
29%Staff are new to the job/company
5%Staff cannot reach required skill levels even with training
77%Staff unable to train due to work commitments
41%New projects/products/ services being launched
5%Budgets/ lack of funds
60%Company doesn’t train/train enough
8%Other
69%New systems/processes/equipment introduced
48%Technical IT/Telecoms (professional level)
23%Management (other)
21%Management (IT/Telecoms related)
21%Other (IT/Telecoms related)
17%Personal development training
16%General company
15%IT User skills
15%Generic employment training
11%Function specific training
6%Other (general)
4%Finance
0
4,000
6,000
5,000
1,000
3,000
2,000
2002 2003 2004 2005 2006 2007 2008Year
0
5000
10,000
15,000
20,000
25,000
30,000
35,000
2002 2003 2004 2005 2006 2007 2008
G Group Accepts: Mathematical & Computing Science Computing Accepts
0
200
400
600
800
1,000
1,200
1,400
2002 2003 2004 2005 2006 2007 2008
39%Staff are new to the job/company
14%Staff cannot reach required skill levels even with training
64%Staff unable to train due to work commitments
53%New projects/products/ services being launched
1%Budgets/ lack of funds
56%Company doesn’t train/train enough
15%Other
48%New systems/processes/equipment introduced
0% 10% 20% 30% 40% 50% 60% 70% 80% 90% 100%
UK
South West
South East
London
East of England
West Midlands
East Midlands
Yorkshire & Humber
North West
North East
England
Scotland
Northern Ireland
Wales
Agriculture forestry and fishing Distribution Hotels & Restaurants Other services
Energy & Water Transport & Communication NA / DNA
Manufacturing Banking & Finance
Construction Public administration, Education & Health
ICT Managers/IT Strategy & Planning Professionals
Software Professionals
201820092001
45,000
30,000
15,000
05,900
6,700
12,700
11,700
11,400
12,900
13,600
13,900
12,800
IT Operations Technicians/IT User Support Technicians/Database Assistants & Clerks/Telecoms Engineers/Line Repairers & Cable Jointers/Computer Engineers
Computing & Telecoms Graduatesin employment (490)
IT & Telecoms industry: new graduate recruits (300)
IT & Telecoms professionals: new graduate recruits (445)
Graduates of subjects other than Computing & Telecoms (300) are shown in RedEntrants to the IT & Telecoms Workforce (560) are shown in italics
230
140100
15 120
60
125
10% 12
%
12%
12%
13% 14%
14%
14% 15
%
15%
16%
16%
17%
17%
17%
0
5%
10%
15%
20%
25%
30%
Aus
tria
Por
tuga
l
Italy
Nor
way
Pol
and
Slo
veni
a
Cze
ch R
epub
lic
Spa
in
Net
herla
nds
Slo
vaki
a
Ger
man
y
Den
mar
k
Irela
nd UK
Sw
eden
18%
Finl
and
21%
Hun
gary
23%
Rom
ania
23%
Bul
garia
18%
Wal
es
95%
4% 1% 1%
29%
13%
21%
36%
All IT & Telecoms Professionals
£500
£410
Average across Wales
£450
Average across the UK
1,080
Q2.08
1,200
Q3.08
990
Q4.08
770
Q1.09
640
Q2.09
Number of applicants to G Mathematical & Comp Sci (Group) in Wales
0
10,000
5,000
15,000
20,000
25,000
30,000
35,000
2002 2003 2004 2005 2006 2007 2008 2009
Year
IT P
rofe
ssio
nal w
orkf
orce
0
1,000
2,000
3,000
4,000
5,000
6,000
App
lican
ts
Applicants to Mathematical and Computer Science courses
IT Professional workforce
Some other way 2%
Training course - not organised/paid forby an employer 18%
Self-study using books, CD-ROMs, etc 21%
Training course - organised/paid for byan employer 30%
Formalised educational institution(school/college/university) 34%
Informal assistance from colleagues,relatives, friends etc 54%
Self-study (learning by doing) 59%
2006/07 2007/08 2006/07 2007/08 2006/07 2007/08
Male Female
100%
75%
50%
25%
0%
ACL TOTALWBLFE
55%
45%
57%
43%
87%
13%
77%
23%
39%
61%
35%
65%
55%
45%
56%
44%
2006/07 2007/08 2006/07 2007/08 2006/07 2007/08 2006/07 2007/08
Male Female
0
600
400
200
800
1,000
1,200
1,400
1,600
2005 2006 2007 2008 2009
ICT Computing
EmergingTrends

© Copyright e-skills UK Sector Skills Council Ltd 2000-2009 19
3.3 Skills and employment policy context
This summary provides an overview of the skills and employment related policy environment in Wales.
This includes, in particular:
• The ‘OneWales’agenda tocreateacompetitiveandsustainableeconomyand theobjectives and outcomes in The Learning Country: Vision into Action, promoting a culture of lifelong learning.
• Supportingbusinessandindividualsduringtheeconomicdownturnthroughupskillingemployees and funding towards training for those who have been made or threatened with redundancy.
• ‘Leading Wales out of Recession’ by taking steps to ensure that Wales is well positioned to take advantage of the economic upturn, particularly through innovation and green jobs.
• The principles and actions from the Welsh Assembly Government’s Skills andEmployment Strategy Skills that work for Wales, in particular harnessing IT to provide individuals with the knowledge and skills they need, to provide businesses with a skilled workforce, and to drive economic and social development.
• WorkingwiththeWalesEmploymentandSkillsBoardtodriveforwardtheimplementationof Skills That Work for Wales.
• Laith pawb, the Welsh language policy (currently under review) and the Welsh-medium Education Strategy which aims to develop effective provision across the education spectrum.
• The introduction of Principal learning in Information Technology to the WelshBaccalaureate from 2009 as a subject-specific option to complement the core learning.
• ThepoorperformanceofWalesinGDPgrowthrelativetotheUKandothersmallEuropean countries.

© Copyright e-skills UK Sector Skills Council Ltd 2000-2009 20
e-skills UK is dedicated to working in partnership with Welsh employers and key stakeholders to address the IT & Telecoms issues that will have the most significant impact on the success of the Welsh economy. Our action in Wales is guided by our strategic plan - 'Creating The IT Nation: Strategic Plan for Wales 2009-2014'. The plan is based on the findings of our major research report carried out in 2008 - 'Technology Counts Wales' and will be further informed by this latest Sector Skills Assessment.
e-skills UK have a Welsh Language Scheme and are working to support the Welsh Language in Wales, within our means and remit.

© Copyright e-skills UK Sector Skills Council Ltd 2000-2009
4.0 IT & Telecoms in Wales: the current position
21
This section sets out key statistics regarding IT & Telecoms workplaces and the current IT & Telecoms workforce.
4.1 The IT & Telecoms industry
4.1.1 Number of workplaces
There are nearly 4,000 workplaces in the IT & Telecoms industry in Wales, representing 3% of the total across all industries in Wales. Of these, 80% are IT and 20% are Telecoms. 84% of IT & Telecoms workplaces are Services workplaces, 12% Wholesale and Retail and 4% Manufacturing.
Table 2: Number of workplaces in the IT & Telecoms industry
Classification / SIC Wales UK
IT Services 2,710 120,965
IT Manufacturing 75 2,670
IT Wholesale / Retail 165 6,035
Total IT 2,950 129,670
Telecoms Services 360 9,795
Telecoms Manufacturing 80 1,985
Telecoms Wholesale / Retail 275 7,710
Telecoms Total 715 19,490
Total IT & Telecoms industry 3,665 149,160
All industries 115,520 2,634,790
Source: Inter Departmental Business Register (IDBR) 2009 Analysis of Local Units in VAT based Enterprises

© Copyright e-skills UK Sector Skills Council Ltd 2000-2009
2% of the UK’s IT & Telecoms workplaces are located in Wales
22
Geographic distribution of workplaces
There is substantial geographic variation in the distribution of the UK’s IT & Telecoms workplaces. 44% are in London and the South East of England (compared to 30% of all workplaces), whilst only 8% are in Scotland, Wales and Northern Ireland combined (compared to 14% of all workplaces). Table 3 shows the geographic distribution of the IT & Telecoms industry compared to the distribution of workplaces in all sectors.
Table 3: Distribution of IT & Telecoms workplaces by geography
Geography % of UK total Delta
IT & Telecoms industry
All industries
Wales 2% 4% -2%
Scotland 5% 7% -2%
Northern Ireland 1% 3% -2%
England (Total) 92% 85% 7%
North East 2% 3% -1%
North West 8% 10% -2%
Yorkshire & Humber 5% 7% -2%
East Midlands 5% 7% -2%
West Midlands 7% 8% -1%
East of England 12% 10% 2%
London 22% 15% 7%
South East 22% 15% 7%
South West 8% 9% -1%
Source: Inter Departmental Business Register (IDBR) 2009 Analysis of Local Units in VAT based Enterprises

Large firms make up just 1% of the number of IT & Telecoms workplaces, but account for the largest proportion of the industry workers
© Copyright e-skills UK Sector Skills Council Ltd 2000-2009 23
4.1.2 Size of workplace
The IT & Telecoms industry in Wales is made up from a large proportion (95%) of micro firms23 when compared to the average across all industries (83%).
Although micro firms comprise the large majority of IT & Telecoms workplaces in Wales, large firms, those with 200 or more employees, still account for the largest proportion of the IT & Telecoms industry workers. Micro firms make up 95% of the number of IT & Telecoms businesses in Wales but employ just 29% of the actual workforce. By contrast, those with 200 or more employees make up just 1% of the number of workplaces but employ 36% of the workforce.
Figure 4: Distribution of IT & Telecoms workplaces compared to the proportion of the workforce they employ
Source: ABI Workplace Analysis 2007
23 Workplaces with 1-10 employees
Population (A)2,959,000
Workforce (B)1,248,000
Total IT & T industry
(C+D)18,600
IT & T professionals in IT & T industry
(C) 10,900 IT & T professionals in other sectors
(E) 25,500All other occupations in
the IT & T industry (D) 7,700
0.0
5.4South East England
London 5.4
3.6North West England
East of England 3.4
2.9West Midlands
Scotland 2.8
2.7Yorkshire & Humber
South West England 2.7
East Midlands 2.4
Wales 1.4
North East England 1.2
Northern Ireland 0.8
1.0 2.0 3.0 4.0 5.0 6.0
GVA (£bn)
Total IT & T workforce (C+D+E) 44,100
Total IT & T professionals (C+E) 36,400
0
25%
50%
75%
100%
1-10 11-49 50-199 200+
Workplaces Employees
0%
1%
2%
8%
8%
10%
13%
25%
33%
0 5% 10% 15% 20% 25% 35%30% 40%
Agriculture Forestry & Fishing
Energy & Water
Distribution, Hotels & Restaurants
Other services
Construction
Manufacturing
Public Administration, Education & Health
Banking & Finance
Transport & Communication
0
5,000
10,000
15,000
20,000
25,000
30,000
35,000
1992 1993 1994 1995 1996 1997 1998 1999 2000 2001 2002 2003 2004 2005 2006 2007 2008 2009
£600
£400
£200
£0
36%29%
24%30%
37%28% 27%
20%14%
35%39%
38% 23%16%
23%35%
35% 41%
24%
21%21%
29%34% 34%
31%
26%30%
12% 17% 18% 13% 14%6%
20%15%
0%
25%
50%
75%
100%
2001 2002 2003 2004 2005 2006 2007 2008 2009
16-29 30-39 40-49 50+
80%
70%
60%
50%
40%
30%
20%
10%
0%
ACLWBLFE
39%
61%
39%
61%56%
44%
57%
43%
28%
72%
28%
72%
FoundationTrends
1995 2000
Skill changes New skills
2005 2007 2010 2015 2020
Industrialisation of technology
Security and Data Protection
Communications convergence and integration
Innovation
Transformation through IT
The pool of talent and gender balance
Information and analytics
Consumerisation and convergence of IT
Green IT: environmental computing
Social Computing and Web 2.0
Digital Natives
Unemployment500
Retire160
Non IT&T Job Switcher
1,930
IT&T JobSwitcher
620
Look afterfamily
90
Become a student
220
Otherinactive
300
Job switcher fromIT & Telecomsoccupations
610
Entrants to IT & Telecoms occupations
3,520
Job switchers fromNon IT & Telecoms
occupations1,840
Unemployment580
Education660
Other Inactive440
NET change inemploymentOccupation
320
Gross JobOpportunities
4,130
ReplacementJobs3,810
Internet 2%
Database 4%
Networking 4%
Management 5%
SoftwareEngineering
7%
Technical/PC support
22%
Systems design/development
55%
47%
38%
44%
48%
82%
75%
71%
27%
22%
22%
9%
21%
26%
2%52%
35%
34%
29%
9%
4%
3%
Client/customer interaction skills
Other interpersonal skills
Business skills
Skills in general
Sector knowledge/experience
Other non-technical skills
Higher level technical IT skills
Below the level required Equal to the level required Above the level required
56%
57%
77%
69%
68%
68%
71%
15%
2%
15%
21%
23%
25%
15%29%
28%
21%
17%
12%
9%
4%
General software skills/knowledge
Email/Internet skills
Database skills
Overall IT user skills
General hardware skills/knowledge
Word-processing skills
Spreadsheet skills
Below the level required Equal to the level required Above the level required
0
30%
20%
10%
40%
50%
60%
Q2.01 Q2.02 Q2.03 Q2.04 Q2.05 Q2.06 Q2.07 Q2.08 Q2.09
All ICT staff All workers
29%Staff are new to the job/company
5%Staff cannot reach required skill levels even with training
77%Staff unable to train due to work commitments
41%New projects/products/ services being launched
5%Budgets/ lack of funds
60%Company doesn’t train/train enough
8%Other
69%New systems/processes/equipment introduced
48%Technical IT/Telecoms (professional level)
23%Management (other)
21%Management (IT/Telecoms related)
21%Other (IT/Telecoms related)
17%Personal development training
16%General company
15%IT User skills
15%Generic employment training
11%Function specific training
6%Other (general)
4%Finance
0
4,000
6,000
5,000
1,000
3,000
2,000
2002 2003 2004 2005 2006 2007 2008Year
0
5000
10,000
15,000
20,000
25,000
30,000
35,000
2002 2003 2004 2005 2006 2007 2008
G Group Accepts: Mathematical & Computing Science Computing Accepts
0
200
400
600
800
1,000
1,200
1,400
2002 2003 2004 2005 2006 2007 2008
39%Staff are new to the job/company
14%Staff cannot reach required skill levels even with training
64%Staff unable to train due to work commitments
53%New projects/products/ services being launched
1%Budgets/ lack of funds
56%Company doesn’t train/train enough
15%Other
48%New systems/processes/equipment introduced
0% 10% 20% 30% 40% 50% 60% 70% 80% 90% 100%
UK
South West
South East
London
East of England
West Midlands
East Midlands
Yorkshire & Humber
North West
North East
England
Scotland
Northern Ireland
Wales
Agriculture forestry and fishing Distribution Hotels & Restaurants Other services
Energy & Water Transport & Communication NA / DNA
Manufacturing Banking & Finance
Construction Public administration, Education & Health
ICT Managers/IT Strategy & Planning Professionals
Software Professionals
201820092001
45,000
30,000
15,000
05,900
6,700
12,700
11,700
11,400
12,900
13,600
13,900
12,800
IT Operations Technicians/IT User Support Technicians/Database Assistants & Clerks/Telecoms Engineers/Line Repairers & Cable Jointers/Computer Engineers
Computing & Telecoms Graduatesin employment (490)
IT & Telecoms industry: new graduate recruits (300)
IT & Telecoms professionals: new graduate recruits (445)
Graduates of subjects other than Computing & Telecoms (300) are shown in RedEntrants to the IT & Telecoms Workforce (560) are shown in italics
230
140100
15 120
60
125
10% 12
%
12%
12%
13% 14%
14%
14% 15
%
15%
16%
16%
17%
17%
17%
0
5%
10%
15%
20%
25%
30%
Aus
tria
Por
tuga
l
Italy
Nor
way
Pol
and
Slo
veni
a
Cze
ch R
epub
lic
Spa
in
Net
herla
nds
Slo
vaki
a
Ger
man
y
Den
mar
k
Irela
nd UK
Sw
eden
18%
Finl
and
21%
Hun
gary
23%
Rom
ania
23%
Bul
garia
18%
Wal
es
95%
4% 1% 1%
29%
13%
21%
36%
All IT & Telecoms Professionals
£500
£410
Average across Wales
£450
Average across the UK
1,080
Q2.08
1,200
Q3.08
990
Q4.08
770
Q1.09
640
Q2.09
Number of applicants to G Mathematical & Comp Sci (Group) in Wales
0
10,000
5,000
15,000
20,000
25,000
30,000
35,000
2002 2003 2004 2005 2006 2007 2008 2009
Year
IT P
rofe
ssio
nal w
orkf
orce
0
1,000
2,000
3,000
4,000
5,000
6,000
App
lican
ts
Applicants to Mathematical and Computer Science courses
IT Professional workforce
Some other way 2%
Training course - not organised/paid forby an employer 18%
Self-study using books, CD-ROMs, etc 21%
Training course - organised/paid for byan employer 30%
Formalised educational institution(school/college/university) 34%
Informal assistance from colleagues,relatives, friends etc 54%
Self-study (learning by doing) 59%
2006/07 2007/08 2006/07 2007/08 2006/07 2007/08
Male Female
100%
75%
50%
25%
0%
ACL TOTALWBLFE
55%
45%
57%
43%
87%
13%
77%
23%
39%
61%
35%
65%
55%
45%
56%
44%
2006/07 2007/08 2006/07 2007/08 2006/07 2007/08 2006/07 2007/08
Male Female
0
600
400
200
800
1,000
1,200
1,400
1,600
2005 2006 2007 2008 2009
ICT Computing
EmergingTrends

© Copyright e-skills UK Sector Skills Council Ltd 2000-2009
The IT & Telecoms workforce has grown to over 44,000 people in Wales
24
4.2 The IT & Telecoms workforce
4.2.1 Size of workforce
The IT & Telecoms workforce comprises:
• Employees in the IT&Telecoms industry (thoseemployed inany role incompanieswhose primary activity is IT or Telecoms as defined by Standard Industrial Classification (SIC) codes).
• IT&Telecomsprofessionals inother industries (thosewhoseprimaryactivity is ITorTelecoms as defined by Standard Occupational Classification (SOC) codes, working in companies in any industry).
The total IT & Telecoms workforce in Wales comprises over 44,000 individuals - 4% of Wales’s current workforce. This is made up of 19,000 people in the IT & Telecoms industry and a further 26,000 working as IT or Telecoms professionals in other industries. The detailed breakdown within these numbers is shown below. It can be seen that, within the IT & Telecoms workforce:
• Thereare36,000IT&Telecomsprofessionals,ofwhich30%areintheIT&Telecomsindustry and 70% are in other industries.
• 19,000peopleworkintheIT&TelecomsindustryinWales.59%oftheseareinIT&Telecoms professional roles.
Table 4: The IT & Telecoms workforce - split by industry and occupation24
Occupational Group
Wales
IT & Telecoms Industry
% Other Industries Total
IT & Telecoms professionals
10,900 59% 25,500 36,400
All Other Occupations
7,700 41%
All Occupations 18,600 100%
Source: Office for National Statistics Labour Force Survey (ONS LFS) April-June 2009
Note: Figures may not add up due to rounding
24 Before 2005, quarterly LFS estimates under 10,000 were not published as they are likely to be unreliable. Although this publication policy changed in 2005 (as a result of the Freedom of Information Act), the unreliability of these LFS estimates did not. It is suggested that the 10,000 threshold is used as a guide to identify which cells will be subject to high sampling variability. Users are advised that estimates below 10,000 are subject to a high degree of sampling variability and should therefore be treated with caution. The 10,000 threshold equates to a sample size of about 25 and a relative standard error of about 20%

© Copyright e-skills UK Sector Skills Council Ltd 2000-2009 25
4.2.2 IT & Telecoms workforce - distribution by geography
Geographic variation exists in the distribution of Wales’s and the rest of the UK’s IT & Telecoms businesses when compared to businesses in all sectors. Data for the workforce in the IT & Telecoms industry shows a similar variation, as shown in the table below.
Table 5: The IT & Telecoms workforce - distribution by geography
Geography % of UK total Delta
IT & Telecoms Industry
All Other Industries
Wales 2% 5% -3%
Scotland 6% 9% -3%
Northern Ireland 2% 3% -1%
England (total) 90% 84% 6%
North East 4% 4% 0%
North West 9% 11% -2%
Yorkshire & Humber 6% 8% -3%
East Midlands 5% 7% -2%
West Midlands 8% 8% 0%
East of England 9% 10% -1%
London 17% 13% 4%
South East 24% 14% 10%
South West 8% 9% -1%
Source: Office for National Statistics Labour Force Survey (ONS LFS) April-June 2009

© Copyright e-skills UK Sector Skills Council Ltd 2000-2009
66% of IT & Telecoms professionals are now employed as ICT Managers, IT Strategy & Planning Professionals or Software Professionals
26
4.2.3 IT & Telecoms occupations - distribution by industry25
The largest proportion of IT & Telecoms professionals are employed in the Transport and Communication industry. This sector, combined Public Administration, Education and Health accounts for 58% of all IT & Telecoms professionals employed in the Wales.
Figure 5: Percentage of IT & Telecoms professionals employed by broad industrial group
Source: Office for National Statistics Labour Force Survey (ONS LFS) April-June 2009
4.2.4 IT & Telecoms occupations - segmentation
An in-depth analysis of the IT & Telecoms professional workforce (those within the relevant Standard Occupational Classification (SOC)) shows that 34% are employed as ICT Managers or IT Strategy & Planning Professionals, and a further 32% are employed as Software Professionals. 12% are IT Operations Technicians, while the remaining 23% are split between IT User Support Staff, Database Assistants, Computer Engineers, Telecoms Engineers and Telecoms Line Repairers, as shown below.
Table 6: IT & Telecoms professionals by proportion
SOC Code Description %
1136 ICT Managers 22%
2131 IT Strategy & Planning Professionals 12%
2132 Software Professionals 32%
3131 IT Operations Technicians 12%
3132 IT User Support Technicians 5%
4136 Database Assistants & Clerks 7%
5242 Telecoms Engineers 8%
5243 Line Repairers & Cable Jointers 1%
5245 Computer Engineers 2%
Total 100%
Source: Office for National Statistics Labour Force Survey (ONS LFS) April-June 2009
Population (A)2,959,000
Workforce (B)1,248,000
Total IT & T industry
(C+D)18,600
IT & T professionals in IT & T industry
(C) 10,900 IT & T professionals in other sectors
(E) 25,500All other occupations in
the IT & T industry (D) 7,700
0.0
5.4South East England
London 5.4
3.6North West England
East of England 3.4
2.9West Midlands
Scotland 2.8
2.7Yorkshire & Humber
South West England 2.7
East Midlands 2.4
Wales 1.4
North East England 1.2
Northern Ireland 0.8
1.0 2.0 3.0 4.0 5.0 6.0
GVA (£bn)
Total IT & T workforce (C+D+E) 44,100
Total IT & T professionals (C+E) 36,400
0
25%
50%
75%
100%
1-10 11-49 50-199 200+
Workplaces Employees
0%
1%
2%
8%
8%
10%
13%
25%
33%
0 5% 10% 15% 20% 25% 35%30% 40%
Agriculture Forestry & Fishing
Energy & Water
Distribution, Hotels & Restaurants
Other services
Construction
Manufacturing
Public Administration, Education & Health
Banking & Finance
Transport & Communication
0
5,000
10,000
15,000
20,000
25,000
30,000
35,000
1992 1993 1994 1995 1996 1997 1998 1999 2000 2001 2002 2003 2004 2005 2006 2007 2008 2009
£600
£400
£200
£0
36%29%
24%30%
37%28% 27%
20%14%
35%39%
38% 23%16%
23%35%
35% 41%
24%
21%21%
29%34% 34%
31%
26%30%
12% 17% 18% 13% 14%6%
20%15%
0%
25%
50%
75%
100%
2001 2002 2003 2004 2005 2006 2007 2008 2009
16-29 30-39 40-49 50+
80%
70%
60%
50%
40%
30%
20%
10%
0%
ACLWBLFE
39%
61%
39%
61%56%
44%
57%
43%
28%
72%
28%
72%
FoundationTrends
1995 2000
Skill changes New skills
2005 2007 2010 2015 2020
Industrialisation of technology
Security and Data Protection
Communications convergence and integration
Innovation
Transformation through IT
The pool of talent and gender balance
Information and analytics
Consumerisation and convergence of IT
Green IT: environmental computing
Social Computing and Web 2.0
Digital Natives
Unemployment500
Retire160
Non IT&T Job Switcher
1,930
IT&T JobSwitcher
620
Look afterfamily
90
Become a student
220
Otherinactive
300
Job switcher fromIT & Telecomsoccupations
610
Entrants to IT & Telecoms occupations
3,520
Job switchers fromNon IT & Telecoms
occupations1,840
Unemployment580
Education660
Other Inactive440
NET change inemploymentOccupation
320
Gross JobOpportunities
4,130
ReplacementJobs3,810
Internet 2%
Database 4%
Networking 4%
Management 5%
SoftwareEngineering
7%
Technical/PC support
22%
Systems design/development
55%
47%
38%
44%
48%
82%
75%
71%
27%
22%
22%
9%
21%
26%
2%52%
35%
34%
29%
9%
4%
3%
Client/customer interaction skills
Other interpersonal skills
Business skills
Skills in general
Sector knowledge/experience
Other non-technical skills
Higher level technical IT skills
Below the level required Equal to the level required Above the level required
56%
57%
77%
69%
68%
68%
71%
15%
2%
15%
21%
23%
25%
15%29%
28%
21%
17%
12%
9%
4%
General software skills/knowledge
Email/Internet skills
Database skills
Overall IT user skills
General hardware skills/knowledge
Word-processing skills
Spreadsheet skills
Below the level required Equal to the level required Above the level required
0
30%
20%
10%
40%
50%
60%
Q2.01 Q2.02 Q2.03 Q2.04 Q2.05 Q2.06 Q2.07 Q2.08 Q2.09
All ICT staff All workers
29%Staff are new to the job/company
5%Staff cannot reach required skill levels even with training
77%Staff unable to train due to work commitments
41%New projects/products/ services being launched
5%Budgets/ lack of funds
60%Company doesn’t train/train enough
8%Other
69%New systems/processes/equipment introduced
48%Technical IT/Telecoms (professional level)
23%Management (other)
21%Management (IT/Telecoms related)
21%Other (IT/Telecoms related)
17%Personal development training
16%General company
15%IT User skills
15%Generic employment training
11%Function specific training
6%Other (general)
4%Finance
0
4,000
6,000
5,000
1,000
3,000
2,000
2002 2003 2004 2005 2006 2007 2008Year
0
5000
10,000
15,000
20,000
25,000
30,000
35,000
2002 2003 2004 2005 2006 2007 2008
G Group Accepts: Mathematical & Computing Science Computing Accepts
0
200
400
600
800
1,000
1,200
1,400
2002 2003 2004 2005 2006 2007 2008
39%Staff are new to the job/company
14%Staff cannot reach required skill levels even with training
64%Staff unable to train due to work commitments
53%New projects/products/ services being launched
1%Budgets/ lack of funds
56%Company doesn’t train/train enough
15%Other
48%New systems/processes/equipment introduced
0% 10% 20% 30% 40% 50% 60% 70% 80% 90% 100%
UK
South West
South East
London
East of England
West Midlands
East Midlands
Yorkshire & Humber
North West
North East
England
Scotland
Northern Ireland
Wales
Agriculture forestry and fishing Distribution Hotels & Restaurants Other services
Energy & Water Transport & Communication NA / DNA
Manufacturing Banking & Finance
Construction Public administration, Education & Health
ICT Managers/IT Strategy & Planning Professionals
Software Professionals
201820092001
45,000
30,000
15,000
05,900
6,700
12,700
11,700
11,400
12,900
13,600
13,900
12,800
IT Operations Technicians/IT User Support Technicians/Database Assistants & Clerks/Telecoms Engineers/Line Repairers & Cable Jointers/Computer Engineers
Computing & Telecoms Graduatesin employment (490)
IT & Telecoms industry: new graduate recruits (300)
IT & Telecoms professionals: new graduate recruits (445)
Graduates of subjects other than Computing & Telecoms (300) are shown in RedEntrants to the IT & Telecoms Workforce (560) are shown in italics
230
140100
15 120
60
125
10% 12
%
12%
12%
13% 14%
14%
14% 15
%
15%
16%
16%
17%
17%
17%
0
5%
10%
15%
20%
25%
30%
Aus
tria
Por
tuga
l
Italy
Nor
way
Pol
and
Slo
veni
a
Cze
ch R
epub
lic
Spa
in
Net
herla
nds
Slo
vaki
a
Ger
man
y
Den
mar
k
Irela
nd UK
Sw
eden
18%
Finl
and
21%
Hun
gary
23%
Rom
ania
23%
Bul
garia
18%
Wal
es
95%
4% 1% 1%
29%
13%
21%
36%
All IT & Telecoms Professionals
£500
£410
Average across Wales
£450
Average across the UK
1,080
Q2.08
1,200
Q3.08
990
Q4.08
770
Q1.09
640
Q2.09
Number of applicants to G Mathematical & Comp Sci (Group) in Wales
0
10,000
5,000
15,000
20,000
25,000
30,000
35,000
2002 2003 2004 2005 2006 2007 2008 2009
Year
IT P
rofe
ssio
nal w
orkf
orce
0
1,000
2,000
3,000
4,000
5,000
6,000
App
lican
ts
Applicants to Mathematical and Computer Science courses
IT Professional workforce
Some other way 2%
Training course - not organised/paid forby an employer 18%
Self-study using books, CD-ROMs, etc 21%
Training course - organised/paid for byan employer 30%
Formalised educational institution(school/college/university) 34%
Informal assistance from colleagues,relatives, friends etc 54%
Self-study (learning by doing) 59%
2006/07 2007/08 2006/07 2007/08 2006/07 2007/08
Male Female
100%
75%
50%
25%
0%
ACL TOTALWBLFE
55%
45%
57%
43%
87%
13%
77%
23%
39%
61%
35%
65%
55%
45%
56%
44%
2006/07 2007/08 2006/07 2007/08 2006/07 2007/08 2006/07 2007/08
Male Female
0
600
400
200
800
1,000
1,200
1,400
1,600
2005 2006 2007 2008 2009
ICT Computing
EmergingTrends
25 Based on SIC 2007. Technology Counts: IT & Telecoms Insights 2008 was based on SIC 2003
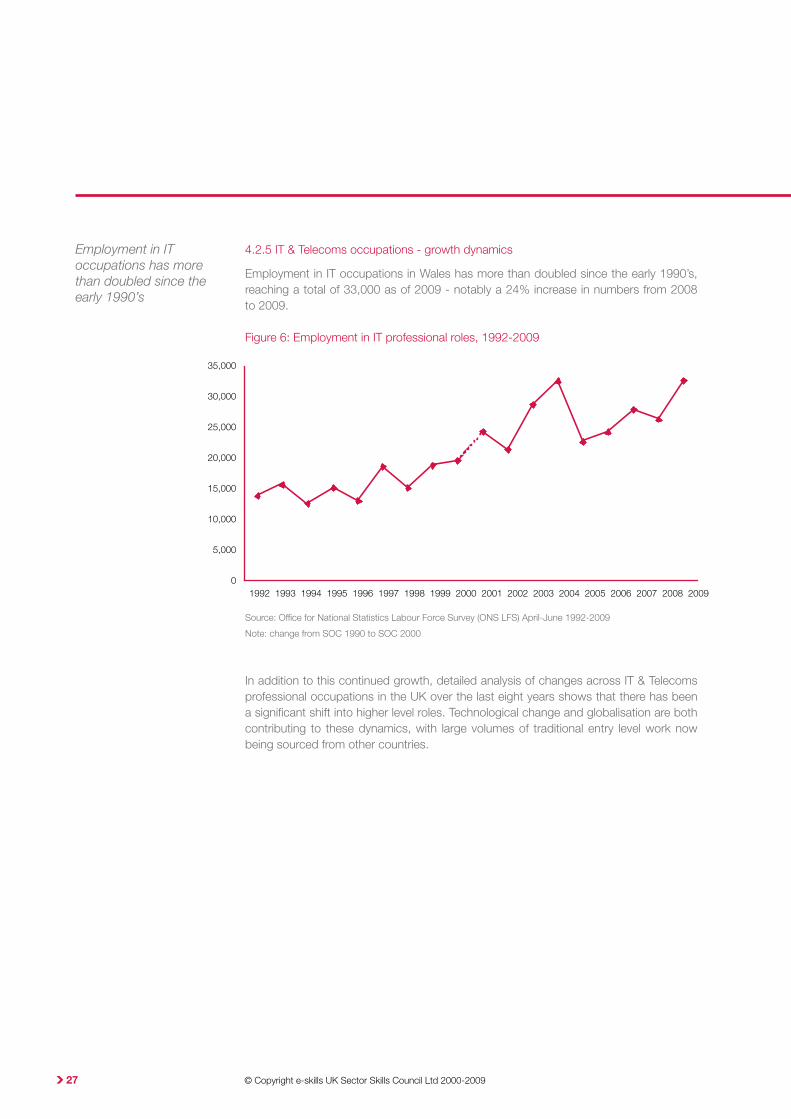
Employment in IT occupations has more than doubled since the early 1990’s
© Copyright e-skills UK Sector Skills Council Ltd 2000-2009 27
4.2.5 IT & Telecoms occupations - growth dynamics
Employment in IT occupations in Wales has more than doubled since the early 1990’s, reaching a total of 33,000 as of 2009 - notably a 24% increase in numbers from 2008 to 2009.
Figure 6: Employment in IT professional roles, 1992-2009
Source: Office for National Statistics Labour Force Survey (ONS LFS) April-June 1992-2009
Note: change from SOC 1990 to SOC 2000
In addition to this continued growth, detailed analysis of changes across IT & Telecoms professional occupations in the UK over the last eight years shows that there has been a significant shift into higher level roles. Technological change and globalisation are both contributing to these dynamics, with large volumes of traditional entry level work now being sourced from other countries.
Population (A)2,959,000
Workforce (B)1,248,000
Total IT & T industry
(C+D)18,600
IT & T professionals in IT & T industry
(C) 10,900 IT & T professionals in other sectors
(E) 25,500All other occupations in
the IT & T industry (D) 7,700
0.0
5.4South East England
London 5.4
3.6North West England
East of England 3.4
2.9West Midlands
Scotland 2.8
2.7Yorkshire & Humber
South West England 2.7
East Midlands 2.4
Wales 1.4
North East England 1.2
Northern Ireland 0.8
1.0 2.0 3.0 4.0 5.0 6.0
GVA (£bn)
Total IT & T workforce (C+D+E) 44,100
Total IT & T professionals (C+E) 36,400
0
25%
50%
75%
100%
1-10 11-49 50-199 200+
Workplaces Employees
0%
1%
2%
8%
8%
10%
13%
25%
33%
0 5% 10% 15% 20% 25% 35%30% 40%
Agriculture Forestry & Fishing
Energy & Water
Distribution, Hotels & Restaurants
Other services
Construction
Manufacturing
Public Administration, Education & Health
Banking & Finance
Transport & Communication
0
5,000
10,000
15,000
20,000
25,000
30,000
35,000
1992 1993 1994 1995 1996 1997 1998 1999 2000 2001 2002 2003 2004 2005 2006 2007 2008 2009
£600
£400
£200
£0
36%29%
24%30%
37%28% 27%
20%14%
35%39%
38% 23%16%
23%35%
35% 41%
24%
21%21%
29%34% 34%
31%
26%30%
12% 17% 18% 13% 14%6%
20%15%
0%
25%
50%
75%
100%
2001 2002 2003 2004 2005 2006 2007 2008 2009
16-29 30-39 40-49 50+
80%
70%
60%
50%
40%
30%
20%
10%
0%
ACLWBLFE
39%
61%
39%
61%56%
44%
57%
43%
28%
72%
28%
72%
FoundationTrends
1995 2000
Skill changes New skills
2005 2007 2010 2015 2020
Industrialisation of technology
Security and Data Protection
Communications convergence and integration
Innovation
Transformation through IT
The pool of talent and gender balance
Information and analytics
Consumerisation and convergence of IT
Green IT: environmental computing
Social Computing and Web 2.0
Digital Natives
Unemployment500
Retire160
Non IT&T Job Switcher
1,930
IT&T JobSwitcher
620
Look afterfamily
90
Become a student
220
Otherinactive
300
Job switcher fromIT & Telecomsoccupations
610
Entrants to IT & Telecoms occupations
3,520
Job switchers fromNon IT & Telecoms
occupations1,840
Unemployment580
Education660
Other Inactive440
NET change inemploymentOccupation
320
Gross JobOpportunities
4,130
ReplacementJobs3,810
Internet 2%
Database 4%
Networking 4%
Management 5%
SoftwareEngineering
7%
Technical/PC support
22%
Systems design/development
55%
47%
38%
44%
48%
82%
75%
71%
27%
22%
22%
9%
21%
26%
2%52%
35%
34%
29%
9%
4%
3%
Client/customer interaction skills
Other interpersonal skills
Business skills
Skills in general
Sector knowledge/experience
Other non-technical skills
Higher level technical IT skills
Below the level required Equal to the level required Above the level required
56%
57%
77%
69%
68%
68%
71%
15%
2%
15%
21%
23%
25%
15%29%
28%
21%
17%
12%
9%
4%
General software skills/knowledge
Email/Internet skills
Database skills
Overall IT user skills
General hardware skills/knowledge
Word-processing skills
Spreadsheet skills
Below the level required Equal to the level required Above the level required
0
30%
20%
10%
40%
50%
60%
Q2.01 Q2.02 Q2.03 Q2.04 Q2.05 Q2.06 Q2.07 Q2.08 Q2.09
All ICT staff All workers
29%Staff are new to the job/company
5%Staff cannot reach required skill levels even with training
77%Staff unable to train due to work commitments
41%New projects/products/ services being launched
5%Budgets/ lack of funds
60%Company doesn’t train/train enough
8%Other
69%New systems/processes/equipment introduced
48%Technical IT/Telecoms (professional level)
23%Management (other)
21%Management (IT/Telecoms related)
21%Other (IT/Telecoms related)
17%Personal development training
16%General company
15%IT User skills
15%Generic employment training
11%Function specific training
6%Other (general)
4%Finance
0
4,000
6,000
5,000
1,000
3,000
2,000
2002 2003 2004 2005 2006 2007 2008Year
0
5000
10,000
15,000
20,000
25,000
30,000
35,000
2002 2003 2004 2005 2006 2007 2008
G Group Accepts: Mathematical & Computing Science Computing Accepts
0
200
400
600
800
1,000
1,200
1,400
2002 2003 2004 2005 2006 2007 2008
39%Staff are new to the job/company
14%Staff cannot reach required skill levels even with training
64%Staff unable to train due to work commitments
53%New projects/products/ services being launched
1%Budgets/ lack of funds
56%Company doesn’t train/train enough
15%Other
48%New systems/processes/equipment introduced
0% 10% 20% 30% 40% 50% 60% 70% 80% 90% 100%
UK
South West
South East
London
East of England
West Midlands
East Midlands
Yorkshire & Humber
North West
North East
England
Scotland
Northern Ireland
Wales
Agriculture forestry and fishing Distribution Hotels & Restaurants Other services
Energy & Water Transport & Communication NA / DNA
Manufacturing Banking & Finance
Construction Public administration, Education & Health
ICT Managers/IT Strategy & Planning Professionals
Software Professionals
201820092001
45,000
30,000
15,000
05,900
6,700
12,700
11,700
11,400
12,900
13,600
13,900
12,800
IT Operations Technicians/IT User Support Technicians/Database Assistants & Clerks/Telecoms Engineers/Line Repairers & Cable Jointers/Computer Engineers
Computing & Telecoms Graduatesin employment (490)
IT & Telecoms industry: new graduate recruits (300)
IT & Telecoms professionals: new graduate recruits (445)
Graduates of subjects other than Computing & Telecoms (300) are shown in RedEntrants to the IT & Telecoms Workforce (560) are shown in italics
230
140100
15 120
60
125
10% 12
%
12%
12%
13% 14%
14%
14% 15
%
15%
16%
16%
17%
17%
17%
0
5%
10%
15%
20%
25%
30%
Aus
tria
Por
tuga
l
Italy
Nor
way
Pol
and
Slo
veni
a
Cze
ch R
epub
lic
Spa
in
Net
herla
nds
Slo
vaki
a
Ger
man
y
Den
mar
k
Irela
nd UK
Sw
eden
18%
Finl
and
21%
Hun
gary
23%
Rom
ania
23%
Bul
garia
18%
Wal
es
95%
4% 1% 1%
29%
13%
21%
36%
All IT & Telecoms Professionals
£500
£410
Average across Wales
£450
Average across the UK
1,080
Q2.08
1,200
Q3.08
990
Q4.08
770
Q1.09
640
Q2.09
Number of applicants to G Mathematical & Comp Sci (Group) in Wales
0
10,000
5,000
15,000
20,000
25,000
30,000
35,000
2002 2003 2004 2005 2006 2007 2008 2009
Year
IT P
rofe
ssio
nal w
orkf
orce
0
1,000
2,000
3,000
4,000
5,000
6,000
App
lican
ts
Applicants to Mathematical and Computer Science courses
IT Professional workforce
Some other way 2%
Training course - not organised/paid forby an employer 18%
Self-study using books, CD-ROMs, etc 21%
Training course - organised/paid for byan employer 30%
Formalised educational institution(school/college/university) 34%
Informal assistance from colleagues,relatives, friends etc 54%
Self-study (learning by doing) 59%
2006/07 2007/08 2006/07 2007/08 2006/07 2007/08
Male Female
100%
75%
50%
25%
0%
ACL TOTALWBLFE
55%
45%
57%
43%
87%
13%
77%
23%
39%
61%
35%
65%
55%
45%
56%
44%
2006/07 2007/08 2006/07 2007/08 2006/07 2007/08 2006/07 2007/08
Male Female
0
600
400
200
800
1,000
1,200
1,400
1,600
2005 2006 2007 2008 2009
ICT Computing
EmergingTrends

© Copyright e-skills UK Sector Skills Council Ltd 2000-2009
26 Qualification equivalence of levels: 5 = postgraduate, 4 = graduate (first degree), 3 = GCE A-Level / Scottish Higher, 3 = GCSE / Scottish Standard Grade
The IT & Telecoms professional workforce hold particularly high levels of qualifications
28
4.2.6 IT & Telecoms - qualification levels
Wales’s IT & Telecoms workforce is highly qualified compared to its population overall. The table below shows the level of formal qualifications achieved by employees in the IT & Telecoms industry, and by IT & Telecoms professionals in all sectors.
Table 7: IT & Telecoms - level of formal qualifications achieved
Level26 Wales
IT & Telecoms Industry
All Other Industries
IT & Telecoms
Professionals
All Other Occupations
Wales's Employed Workforce
5 22% 8% 18% 8% 9%
4 44% 26% 40% 25% 26%
3 16% 23% 17% 23% 23%
2 14% 23% 21% 23% 23%
1 0% 4% 0% 4% 4%
None 0% 9% 1% 9% 9%
Other 4% 5% 3% 6% 5%
Unknown 0% 1% 0% 1% 1%
Total 100% 100% 100% 100% 100%
Source: Office for National Statistics Labour Force Survey (ONS LFS) April-June 2009
As can be seen from this, 58% of Wales’s IT & Telecoms professionals hold a qualification at undergraduate level (Level 4) or higher, compared to 35% for its working population. At the other end of the scale, only 1% of IT & Telecoms professionals are not qualified to Level 2, compared to 14% of its workforce overall.

© Copyright e-skills UK Sector Skills Council Ltd 2000-2009 29
4.2.7 IT & Telecoms occupations - earnings
Gross weekly earnings for IT & Telecoms professionals in Wales are, on average, £500 per week, which is 18% more than the average of £410 for all occupations in all sectors across Wales.
Figure 7: Average weekly earnings in IT & Telecoms professional occupations
Source: Office for National Statistics Labour Force Survey (ONS LFS) April-June 2009
Population (A)2,959,000
Workforce (B)1,248,000
Total IT & T industry
(C+D)18,600
IT & T professionals in IT & T industry
(C) 10,900 IT & T professionals in other sectors
(E) 25,500All other occupations in
the IT & T industry (D) 7,700
0.0
5.4South East England
London 5.4
3.6North West England
East of England 3.4
2.9West Midlands
Scotland 2.8
2.7Yorkshire & Humber
South West England 2.7
East Midlands 2.4
Wales 1.4
North East England 1.2
Northern Ireland 0.8
1.0 2.0 3.0 4.0 5.0 6.0
GVA (£bn)
Total IT & T workforce (C+D+E) 44,100
Total IT & T professionals (C+E) 36,400
0
25%
50%
75%
100%
1-10 11-49 50-199 200+
Workplaces Employees
0%
1%
2%
8%
8%
10%
13%
25%
33%
0 5% 10% 15% 20% 25% 35%30% 40%
Agriculture Forestry & Fishing
Energy & Water
Distribution, Hotels & Restaurants
Other services
Construction
Manufacturing
Public Administration, Education & Health
Banking & Finance
Transport & Communication
0
5,000
10,000
15,000
20,000
25,000
30,000
35,000
1992 1993 1994 1995 1996 1997 1998 1999 2000 2001 2002 2003 2004 2005 2006 2007 2008 2009
£600
£400
£200
£0
36%29%
24%30%
37%28% 27%
20%14%
35%39%
38% 23%16%
23%35%
35% 41%
24%
21%21%
29%34% 34%
31%
26%30%
12% 17% 18% 13% 14%6%
20%15%
0%
25%
50%
75%
100%
2001 2002 2003 2004 2005 2006 2007 2008 2009
16-29 30-39 40-49 50+
80%
70%
60%
50%
40%
30%
20%
10%
0%
ACLWBLFE
39%
61%
39%
61%56%
44%
57%
43%
28%
72%
28%
72%
FoundationTrends
1995 2000
Skill changes New skills
2005 2007 2010 2015 2020
Industrialisation of technology
Security and Data Protection
Communications convergence and integration
Innovation
Transformation through IT
The pool of talent and gender balance
Information and analytics
Consumerisation and convergence of IT
Green IT: environmental computing
Social Computing and Web 2.0
Digital Natives
Unemployment500
Retire160
Non IT&T Job Switcher
1,930
IT&T JobSwitcher
620
Look afterfamily
90
Become a student
220
Otherinactive
300
Job switcher fromIT & Telecomsoccupations
610
Entrants to IT & Telecoms occupations
3,520
Job switchers fromNon IT & Telecoms
occupations1,840
Unemployment580
Education660
Other Inactive440
NET change inemploymentOccupation
320
Gross JobOpportunities
4,130
ReplacementJobs3,810
Internet 2%
Database 4%
Networking 4%
Management 5%
SoftwareEngineering
7%
Technical/PC support
22%
Systems design/development
55%
47%
38%
44%
48%
82%
75%
71%
27%
22%
22%
9%
21%
26%
2%52%
35%
34%
29%
9%
4%
3%
Client/customer interaction skills
Other interpersonal skills
Business skills
Skills in general
Sector knowledge/experience
Other non-technical skills
Higher level technical IT skills
Below the level required Equal to the level required Above the level required
56%
57%
77%
69%
68%
68%
71%
15%
2%
15%
21%
23%
25%
15%29%
28%
21%
17%
12%
9%
4%
General software skills/knowledge
Email/Internet skills
Database skills
Overall IT user skills
General hardware skills/knowledge
Word-processing skills
Spreadsheet skills
Below the level required Equal to the level required Above the level required
0
30%
20%
10%
40%
50%
60%
Q2.01 Q2.02 Q2.03 Q2.04 Q2.05 Q2.06 Q2.07 Q2.08 Q2.09
All ICT staff All workers
29%Staff are new to the job/company
5%Staff cannot reach required skill levels even with training
77%Staff unable to train due to work commitments
41%New projects/products/ services being launched
5%Budgets/ lack of funds
60%Company doesn’t train/train enough
8%Other
69%New systems/processes/equipment introduced
48%Technical IT/Telecoms (professional level)
23%Management (other)
21%Management (IT/Telecoms related)
21%Other (IT/Telecoms related)
17%Personal development training
16%General company
15%IT User skills
15%Generic employment training
11%Function specific training
6%Other (general)
4%Finance
0
4,000
6,000
5,000
1,000
3,000
2,000
2002 2003 2004 2005 2006 2007 2008Year
0
5000
10,000
15,000
20,000
25,000
30,000
35,000
2002 2003 2004 2005 2006 2007 2008
G Group Accepts: Mathematical & Computing Science Computing Accepts
0
200
400
600
800
1,000
1,200
1,400
2002 2003 2004 2005 2006 2007 2008
39%Staff are new to the job/company
14%Staff cannot reach required skill levels even with training
64%Staff unable to train due to work commitments
53%New projects/products/ services being launched
1%Budgets/ lack of funds
56%Company doesn’t train/train enough
15%Other
48%New systems/processes/equipment introduced
0% 10% 20% 30% 40% 50% 60% 70% 80% 90% 100%
UK
South West
South East
London
East of England
West Midlands
East Midlands
Yorkshire & Humber
North West
North East
England
Scotland
Northern Ireland
Wales
Agriculture forestry and fishing Distribution Hotels & Restaurants Other services
Energy & Water Transport & Communication NA / DNA
Manufacturing Banking & Finance
Construction Public administration, Education & Health
ICT Managers/IT Strategy & Planning Professionals
Software Professionals
201820092001
45,000
30,000
15,000
05,900
6,700
12,700
11,700
11,400
12,900
13,600
13,900
12,800
IT Operations Technicians/IT User Support Technicians/Database Assistants & Clerks/Telecoms Engineers/Line Repairers & Cable Jointers/Computer Engineers
Computing & Telecoms Graduatesin employment (490)
IT & Telecoms industry: new graduate recruits (300)
IT & Telecoms professionals: new graduate recruits (445)
Graduates of subjects other than Computing & Telecoms (300) are shown in RedEntrants to the IT & Telecoms Workforce (560) are shown in italics
230
140100
15 120
60
125
10% 12
%
12%
12%
13% 14%
14%
14% 15
%
15%
16%
16%
17%
17%
17%
0
5%
10%
15%
20%
25%
30%
Aus
tria
Por
tuga
l
Italy
Nor
way
Pol
and
Slo
veni
a
Cze
ch R
epub
lic
Spa
in
Net
herla
nds
Slo
vaki
a
Ger
man
y
Den
mar
k
Irela
nd UK
Sw
eden
18%
Finl
and
21%
Hun
gary
23%
Rom
ania
23%
Bul
garia
18%
Wal
es
95%
4% 1% 1%
29%
13%
21%
36%
All IT & Telecoms Professionals
£500
£410
Average across Wales
£450
Average across the UK
1,080
Q2.08
1,200
Q3.08
990
Q4.08
770
Q1.09
640
Q2.09
Number of applicants to G Mathematical & Comp Sci (Group) in Wales
0
10,000
5,000
15,000
20,000
25,000
30,000
35,000
2002 2003 2004 2005 2006 2007 2008 2009
Year
IT P
rofe
ssio
nal w
orkf
orce
0
1,000
2,000
3,000
4,000
5,000
6,000
App
lican
ts
Applicants to Mathematical and Computer Science courses
IT Professional workforce
Some other way 2%
Training course - not organised/paid forby an employer 18%
Self-study using books, CD-ROMs, etc 21%
Training course - organised/paid for byan employer 30%
Formalised educational institution(school/college/university) 34%
Informal assistance from colleagues,relatives, friends etc 54%
Self-study (learning by doing) 59%
2006/07 2007/08 2006/07 2007/08 2006/07 2007/08
Male Female
100%
75%
50%
25%
0%
ACL TOTALWBLFE
55%
45%
57%
43%
87%
13%
77%
23%
39%
61%
35%
65%
55%
45%
56%
44%
2006/07 2007/08 2006/07 2007/08 2006/07 2007/08 2006/07 2007/08
Male Female
0
600
400
200
800
1,000
1,200
1,400
1,600
2005 2006 2007 2008 2009
ICT Computing
EmergingTrends
IT & Telecoms professionals earn 18% more than the average across Wales

© Copyright e-skills UK Sector Skills Council Ltd 2000-2009
Females account for just 17% of the IT & Telecoms professional workforce
30
4.2.8 IT & Telecoms occupations - demographics
Gender
Gender imbalance remains a significant issue for the IT & Telecoms sector in Wales. Considering IT & Telecoms professional job roles across all sectors, females made up just 17% in 2009. This compares to the overall workforce being 46% female.
There is a similar imbalance when considering the make up of the IT & Telecoms industry in Wales. Female representation levels have more than halved from 42% in 2001 to just 17% in 2009.
This imbalance within the sector is common across the globe. International comparisons of female labour market representation in IT professions are shown in the figure below. The countries with the highest proportions of females are Romania (23%) and Bulgaria (23%).
Figure 8: Female labour market representation in IT professions within selected countries
Source: Eurostat Q1.09 data
Population (A)2,959,000
Workforce (B)1,248,000
Total IT & T industry
(C+D)18,600
IT & T professionals in IT & T industry
(C) 10,900 IT & T professionals in other sectors
(E) 25,500All other occupations in
the IT & T industry (D) 7,700
0.0
5.4South East England
London 5.4
3.6North West England
East of England 3.4
2.9West Midlands
Scotland 2.8
2.7Yorkshire & Humber
South West England 2.7
East Midlands 2.4
Wales 1.4
North East England 1.2
Northern Ireland 0.8
1.0 2.0 3.0 4.0 5.0 6.0
GVA (£bn)
Total IT & T workforce (C+D+E) 44,100
Total IT & T professionals (C+E) 36,400
0
25%
50%
75%
100%
1-10 11-49 50-199 200+
Workplaces Employees
0%
1%
2%
8%
8%
10%
13%
25%
33%
0 5% 10% 15% 20% 25% 35%30% 40%
Agriculture Forestry & Fishing
Energy & Water
Distribution, Hotels & Restaurants
Other services
Construction
Manufacturing
Public Administration, Education & Health
Banking & Finance
Transport & Communication
0
5,000
10,000
15,000
20,000
25,000
30,000
35,000
1992 1993 1994 1995 1996 1997 1998 1999 2000 2001 2002 2003 2004 2005 2006 2007 2008 2009
£600
£400
£200
£0
36%29%
24%30%
37%28% 27%
20%14%
35%39%
38% 23%16%
23%35%
35% 41%
24%
21%21%
29%34% 34%
31%
26%30%
12% 17% 18% 13% 14%6%
20%15%
0%
25%
50%
75%
100%
2001 2002 2003 2004 2005 2006 2007 2008 2009
16-29 30-39 40-49 50+
80%
70%
60%
50%
40%
30%
20%
10%
0%
ACLWBLFE
39%
61%
39%
61%56%
44%
57%
43%
28%
72%
28%
72%
FoundationTrends
1995 2000
Skill changes New skills
2005 2007 2010 2015 2020
Industrialisation of technology
Security and Data Protection
Communications convergence and integration
Innovation
Transformation through IT
The pool of talent and gender balance
Information and analytics
Consumerisation and convergence of IT
Green IT: environmental computing
Social Computing and Web 2.0
Digital Natives
Unemployment500
Retire160
Non IT&T Job Switcher
1,930
IT&T JobSwitcher
620
Look afterfamily
90
Become a student
220
Otherinactive
300
Job switcher fromIT & Telecomsoccupations
610
Entrants to IT & Telecoms occupations
3,520
Job switchers fromNon IT & Telecoms
occupations1,840
Unemployment580
Education660
Other Inactive440
NET change inemploymentOccupation
320
Gross JobOpportunities
4,130
ReplacementJobs3,810
Internet 2%
Database 4%
Networking 4%
Management 5%
SoftwareEngineering
7%
Technical/PC support
22%
Systems design/development
55%
47%
38%
44%
48%
82%
75%
71%
27%
22%
22%
9%
21%
26%
2%52%
35%
34%
29%
9%
4%
3%
Client/customer interaction skills
Other interpersonal skills
Business skills
Skills in general
Sector knowledge/experience
Other non-technical skills
Higher level technical IT skills
Below the level required Equal to the level required Above the level required
56%
57%
77%
69%
68%
68%
71%
15%
2%
15%
21%
23%
25%
15%29%
28%
21%
17%
12%
9%
4%
General software skills/knowledge
Email/Internet skills
Database skills
Overall IT user skills
General hardware skills/knowledge
Word-processing skills
Spreadsheet skills
Below the level required Equal to the level required Above the level required
0
30%
20%
10%
40%
50%
60%
Q2.01 Q2.02 Q2.03 Q2.04 Q2.05 Q2.06 Q2.07 Q2.08 Q2.09
All ICT staff All workers
29%Staff are new to the job/company
5%Staff cannot reach required skill levels even with training
77%Staff unable to train due to work commitments
41%New projects/products/ services being launched
5%Budgets/ lack of funds
60%Company doesn’t train/train enough
8%Other
69%New systems/processes/equipment introduced
48%Technical IT/Telecoms (professional level)
23%Management (other)
21%Management (IT/Telecoms related)
21%Other (IT/Telecoms related)
17%Personal development training
16%General company
15%IT User skills
15%Generic employment training
11%Function specific training
6%Other (general)
4%Finance
0
4,000
6,000
5,000
1,000
3,000
2,000
2002 2003 2004 2005 2006 2007 2008Year
0
5000
10,000
15,000
20,000
25,000
30,000
35,000
2002 2003 2004 2005 2006 2007 2008
G Group Accepts: Mathematical & Computing Science Computing Accepts
0
200
400
600
800
1,000
1,200
1,400
2002 2003 2004 2005 2006 2007 2008
39%Staff are new to the job/company
14%Staff cannot reach required skill levels even with training
64%Staff unable to train due to work commitments
53%New projects/products/ services being launched
1%Budgets/ lack of funds
56%Company doesn’t train/train enough
15%Other
48%New systems/processes/equipment introduced
0% 10% 20% 30% 40% 50% 60% 70% 80% 90% 100%
UK
South West
South East
London
East of England
West Midlands
East Midlands
Yorkshire & Humber
North West
North East
England
Scotland
Northern Ireland
Wales
Agriculture forestry and fishing Distribution Hotels & Restaurants Other services
Energy & Water Transport & Communication NA / DNA
Manufacturing Banking & Finance
Construction Public administration, Education & Health
ICT Managers/IT Strategy & Planning Professionals
Software Professionals
201820092001
45,000
30,000
15,000
05,900
6,700
12,700
11,700
11,400
12,900
13,600
13,900
12,800
IT Operations Technicians/IT User Support Technicians/Database Assistants & Clerks/Telecoms Engineers/Line Repairers & Cable Jointers/Computer Engineers
Computing & Telecoms Graduatesin employment (490)
IT & Telecoms industry: new graduate recruits (300)
IT & Telecoms professionals: new graduate recruits (445)
Graduates of subjects other than Computing & Telecoms (300) are shown in RedEntrants to the IT & Telecoms Workforce (560) are shown in italics
230
140100
15 120
60
125
10% 12
%
12%
12%
13% 14%
14%
14% 15
%
15%
16%
16%
17%
17%
17%
0
5%
10%
15%
20%
25%
30%
Aus
tria
Por
tuga
l
Italy
Nor
way
Pol
and
Slo
veni
a
Cze
ch R
epub
lic
Spa
in
Net
herla
nds
Slo
vaki
a
Ger
man
y
Den
mar
k
Irela
nd UK
Sw
eden
18%
Finl
and
21%
Hun
gary
23%
Rom
ania
23%
Bul
garia
18%
Wal
es
95%
4% 1% 1%
29%
13%
21%
36%
All IT & Telecoms Professionals
£500
£410
Average across Wales
£450
Average across the UK
1,080
Q2.08
1,200
Q3.08
990
Q4.08
770
Q1.09
640
Q2.09
Number of applicants to G Mathematical & Comp Sci (Group) in Wales
0
10,000
5,000
15,000
20,000
25,000
30,000
35,000
2002 2003 2004 2005 2006 2007 2008 2009
Year
IT P
rofe
ssio
nal w
orkf
orce
0
1,000
2,000
3,000
4,000
5,000
6,000
App
lican
ts
Applicants to Mathematical and Computer Science courses
IT Professional workforce
Some other way 2%
Training course - not organised/paid forby an employer 18%
Self-study using books, CD-ROMs, etc 21%
Training course - organised/paid for byan employer 30%
Formalised educational institution(school/college/university) 34%
Informal assistance from colleagues,relatives, friends etc 54%
Self-study (learning by doing) 59%
2006/07 2007/08 2006/07 2007/08 2006/07 2007/08
Male Female
100%
75%
50%
25%
0%
ACL TOTALWBLFE
55%
45%
57%
43%
87%
13%
77%
23%
39%
61%
35%
65%
55%
45%
56%
44%
2006/07 2007/08 2006/07 2007/08 2006/07 2007/08 2006/07 2007/08
Male Female
0
600
400
200
800
1,000
1,200
1,400
1,600
2005 2006 2007 2008 2009
ICT Computing
EmergingTrends

The IT & Telecoms professional workforce in Wales is an ageing population
© Copyright e-skills UK Sector Skills Council Ltd 2000-2009 31
Age
Analysis of the period 2001-2009 shows a changing trend in the age profile of IT & Telecoms professionals in Wales. The chart below demonstrates that the proportion of people aged 16-29 has dropped from 36% in 2001 to 14% in 2009. 45% of IT & Telecoms professionals are now 40+, compared to 29% eight years ago. During this period, the proportions in each age category across Wales’s economy have remained stable.
Figure 9: Age profile of IT & Telecoms professionals 2001-2009
Source: Office for National Statistics Labour Force Survey (ONS LFS) April-June 2001-2009
Ethnicity and Disability
The ethnic mix of IT & Telecoms professionals in general mirrors that of Wales as a whole with 96% of IT & Telecoms professionals in Wales identifying themselves as being ‘White’ compared to 97% for all occupations in all sectors.
14% of IT & Telecoms professionals in Wales have some form of work limiting disability. This compares to 13% across all occupations.
Population (A)2,959,000
Workforce (B)1,248,000
Total IT & T industry
(C+D)18,600
IT & T professionals in IT & T industry
(C) 10,900 IT & T professionals in other sectors
(E) 25,500All other occupations in
the IT & T industry (D) 7,700
0.0
5.4South East England
London 5.4
3.6North West England
East of England 3.4
2.9West Midlands
Scotland 2.8
2.7Yorkshire & Humber
South West England 2.7
East Midlands 2.4
Wales 1.4
North East England 1.2
Northern Ireland 0.8
1.0 2.0 3.0 4.0 5.0 6.0
GVA (£bn)
Total IT & T workforce (C+D+E) 44,100
Total IT & T professionals (C+E) 36,400
0
25%
50%
75%
100%
1-10 11-49 50-199 200+
Workplaces Employees
0%
1%
2%
8%
8%
10%
13%
25%
33%
0 5% 10% 15% 20% 25% 35%30% 40%
Agriculture Forestry & Fishing
Energy & Water
Distribution, Hotels & Restaurants
Other services
Construction
Manufacturing
Public Administration, Education & Health
Banking & Finance
Transport & Communication
0
5,000
10,000
15,000
20,000
25,000
30,000
35,000
1992 1993 1994 1995 1996 1997 1998 1999 2000 2001 2002 2003 2004 2005 2006 2007 2008 2009
£600
£400
£200
£0
36%29%
24%30%
37%28% 27%
20%14%
35%39%
38% 23%16%
23%35%
35% 41%
24%
21%21%
29%34% 34%
31%
26%30%
12% 17% 18% 13% 14%6%
20%15%
0%
25%
50%
75%
100%
2001 2002 2003 2004 2005 2006 2007 2008 2009
16-29 30-39 40-49 50+
80%
70%
60%
50%
40%
30%
20%
10%
0%
ACLWBLFE
39%
61%
39%
61%56%
44%
57%
43%
28%
72%
28%
72%
FoundationTrends
1995 2000
Skill changes New skills
2005 2007 2010 2015 2020
Industrialisation of technology
Security and Data Protection
Communications convergence and integration
Innovation
Transformation through IT
The pool of talent and gender balance
Information and analytics
Consumerisation and convergence of IT
Green IT: environmental computing
Social Computing and Web 2.0
Digital Natives
Unemployment500
Retire160
Non IT&T Job Switcher
1,930
IT&T JobSwitcher
620
Look afterfamily
90
Become a student
220
Otherinactive
300
Job switcher fromIT & Telecomsoccupations
610
Entrants to IT & Telecoms occupations
3,520
Job switchers fromNon IT & Telecoms
occupations1,840
Unemployment580
Education660
Other Inactive440
NET change inemploymentOccupation
320
Gross JobOpportunities
4,130
ReplacementJobs3,810
Internet 2%
Database 4%
Networking 4%
Management 5%
SoftwareEngineering
7%
Technical/PC support
22%
Systems design/development
55%
47%
38%
44%
48%
82%
75%
71%
27%
22%
22%
9%
21%
26%
2%52%
35%
34%
29%
9%
4%
3%
Client/customer interaction skills
Other interpersonal skills
Business skills
Skills in general
Sector knowledge/experience
Other non-technical skills
Higher level technical IT skills
Below the level required Equal to the level required Above the level required
56%
57%
77%
69%
68%
68%
71%
15%
2%
15%
21%
23%
25%
15%29%
28%
21%
17%
12%
9%
4%
General software skills/knowledge
Email/Internet skills
Database skills
Overall IT user skills
General hardware skills/knowledge
Word-processing skills
Spreadsheet skills
Below the level required Equal to the level required Above the level required
0
30%
20%
10%
40%
50%
60%
Q2.01 Q2.02 Q2.03 Q2.04 Q2.05 Q2.06 Q2.07 Q2.08 Q2.09
All ICT staff All workers
29%Staff are new to the job/company
5%Staff cannot reach required skill levels even with training
77%Staff unable to train due to work commitments
41%New projects/products/ services being launched
5%Budgets/ lack of funds
60%Company doesn’t train/train enough
8%Other
69%New systems/processes/equipment introduced
48%Technical IT/Telecoms (professional level)
23%Management (other)
21%Management (IT/Telecoms related)
21%Other (IT/Telecoms related)
17%Personal development training
16%General company
15%IT User skills
15%Generic employment training
11%Function specific training
6%Other (general)
4%Finance
0
4,000
6,000
5,000
1,000
3,000
2,000
2002 2003 2004 2005 2006 2007 2008Year
0
5000
10,000
15,000
20,000
25,000
30,000
35,000
2002 2003 2004 2005 2006 2007 2008
G Group Accepts: Mathematical & Computing Science Computing Accepts
0
200
400
600
800
1,000
1,200
1,400
2002 2003 2004 2005 2006 2007 2008
39%Staff are new to the job/company
14%Staff cannot reach required skill levels even with training
64%Staff unable to train due to work commitments
53%New projects/products/ services being launched
1%Budgets/ lack of funds
56%Company doesn’t train/train enough
15%Other
48%New systems/processes/equipment introduced
0% 10% 20% 30% 40% 50% 60% 70% 80% 90% 100%
UK
South West
South East
London
East of England
West Midlands
East Midlands
Yorkshire & Humber
North West
North East
England
Scotland
Northern Ireland
Wales
Agriculture forestry and fishing Distribution Hotels & Restaurants Other services
Energy & Water Transport & Communication NA / DNA
Manufacturing Banking & Finance
Construction Public administration, Education & Health
ICT Managers/IT Strategy & Planning Professionals
Software Professionals
201820092001
45,000
30,000
15,000
05,900
6,700
12,700
11,700
11,400
12,900
13,600
13,900
12,800
IT Operations Technicians/IT User Support Technicians/Database Assistants & Clerks/Telecoms Engineers/Line Repairers & Cable Jointers/Computer Engineers
Computing & Telecoms Graduatesin employment (490)
IT & Telecoms industry: new graduate recruits (300)
IT & Telecoms professionals: new graduate recruits (445)
Graduates of subjects other than Computing & Telecoms (300) are shown in RedEntrants to the IT & Telecoms Workforce (560) are shown in italics
230
140100
15 120
60
125
10% 12
%
12%
12%
13% 14%
14%
14% 15
%
15%
16%
16%
17%
17%
17%
0
5%
10%
15%
20%
25%
30%
Aus
tria
Por
tuga
l
Italy
Nor
way
Pol
and
Slo
veni
a
Cze
ch R
epub
lic
Spa
in
Net
herla
nds
Slo
vaki
a
Ger
man
y
Den
mar
k
Irela
nd UK
Sw
eden
18%
Finl
and
21%
Hun
gary
23%
Rom
ania
23%
Bul
garia
18%
Wal
es
95%
4% 1% 1%
29%
13%
21%
36%
All IT & Telecoms Professionals
£500
£410
Average across Wales
£450
Average across the UK
1,080
Q2.08
1,200
Q3.08
990
Q4.08
770
Q1.09
640
Q2.09
Number of applicants to G Mathematical & Comp Sci (Group) in Wales
0
10,000
5,000
15,000
20,000
25,000
30,000
35,000
2002 2003 2004 2005 2006 2007 2008 2009
Year
IT P
rofe
ssio
nal w
orkf
orce
0
1,000
2,000
3,000
4,000
5,000
6,000
App
lican
ts
Applicants to Mathematical and Computer Science courses
IT Professional workforce
Some other way 2%
Training course - not organised/paid forby an employer 18%
Self-study using books, CD-ROMs, etc 21%
Training course - organised/paid for byan employer 30%
Formalised educational institution(school/college/university) 34%
Informal assistance from colleagues,relatives, friends etc 54%
Self-study (learning by doing) 59%
2006/07 2007/08 2006/07 2007/08 2006/07 2007/08
Male Female
100%
75%
50%
25%
0%
ACL TOTALWBLFE
55%
45%
57%
43%
87%
13%
77%
23%
39%
61%
35%
65%
55%
45%
56%
44%
2006/07 2007/08 2006/07 2007/08 2006/07 2007/08 2006/07 2007/08
Male Female
0
600
400
200
800
1,000
1,200
1,400
1,600
2005 2006 2007 2008 2009
ICT Computing
EmergingTrends

© Copyright e-skills UK Sector Skills Council Ltd 2000-2009 32
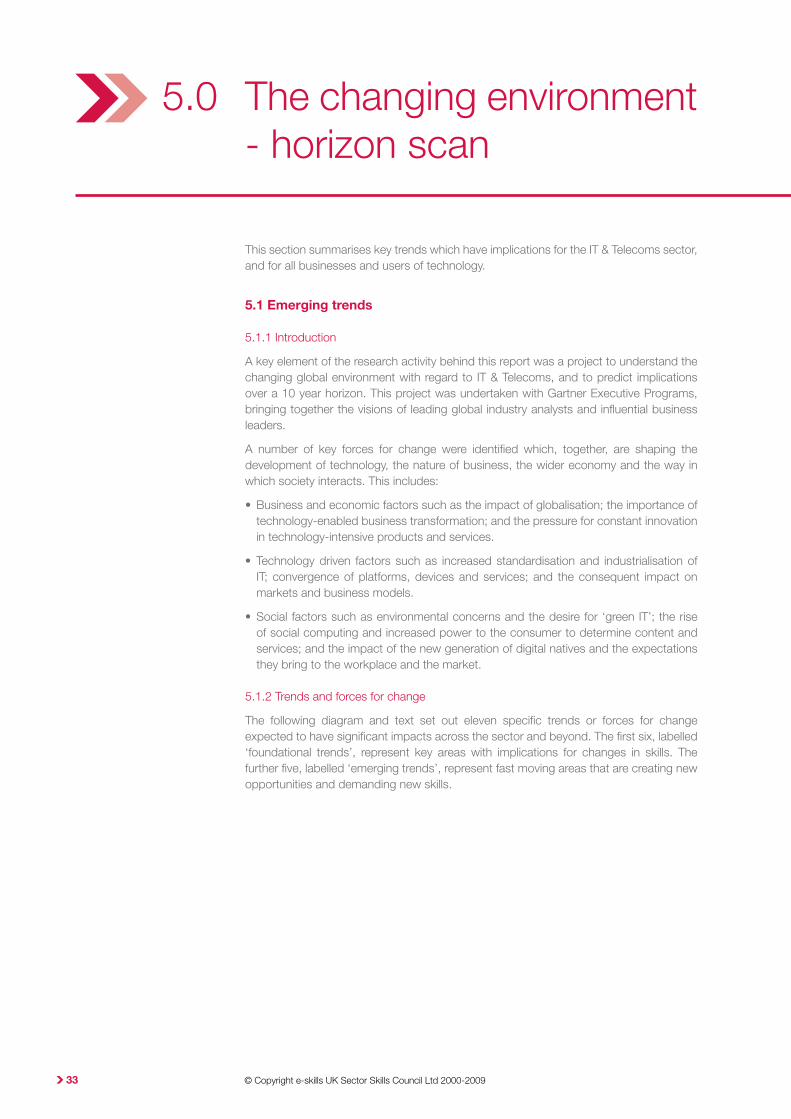
© Copyright e-skills UK Sector Skills Council Ltd 2000-2009
5.0 The changing environment - horizon scan
33
This section summarises key trends which have implications for the IT & Telecoms sector, and for all businesses and users of technology.
5.1 Emerging trends
5.1.1 Introduction
A key element of the research activity behind this report was a project to understand the changing global environment with regard to IT & Telecoms, and to predict implications over a 10 year horizon. This project was undertaken with Gartner Executive Programs, bringing together the visions of leading global industry analysts and influential business leaders.
A number of key forces for change were identified which, together, are shaping the development of technology, the nature of business, the wider economy and the way in which society interacts. This includes:
• Businessandeconomicfactorssuchastheimpactofglobalisation;theimportanceoftechnology-enabledbusinesstransformation;andthepressureforconstantinnovationin technology-intensive products and services.
• Technologydriven factors suchas increasedstandardisationand industrialisationofIT; convergenceofplatforms,devicesandservices; and theconsequent impactonmarkets and business models.
• Socialfactorssuchasenvironmentalconcernsandthedesirefor‘greenIT’;theriseof social computing and increased power to the consumer to determine content and services;andtheimpactofthenewgenerationofdigitalnativesandtheexpectationsthey bring to the workplace and the market.
5.1.2 Trends and forces for change
The following diagram and text set out eleven specific trends or forces for change expected to have significant impacts across the sector and beyond. The first six, labelled ‘foundational trends’, represent key areas with implications for changes in skills. The further five, labelled ‘emerging trends’, represent fast moving areas that are creating new opportunities and demanding new skills.

© Copyright e-skills UK Sector Skills Council Ltd 2000-2009 34
Figure 10: The trends shaping IT & Telecoms skills changes
Source: Gartner Executive Programs
Industrialisation of technology delivery
Increasingly standardised technology delivery processes are fundamentally changing the nature of the IT & Telecoms sector globally. Standardisation of IT practices is enabling the outsourcing and off shoring of many IT and business process activities, and is supporting new choices such as ‘software as a service’. Technology professionals in the UK need new business-orientated skills to play a key role in the analysis, design and development phases of technology-enabled projects, as well as the skills to manage increasingly global supplier relationships.
Security and data protection
Increasing use of electronic channels and information-intensive products creates greater convenience and efficiency - but also a new market for illegal activities. Cyber crime has no boundaries and is growing rapidly in sophistication and scale. Consumers, companies and governments need to be able to rely on technology based solutions being secure. This is important for reasons ranging from commercial advantage to brand integrity, from personal identity to national security. Maintaining the security and integrity of information and information systems is increasingly critical and increasingly complex.
Population (A)2,959,000
Workforce (B)1,248,000
Total IT & T industry
(C+D)18,600
IT & T professionals in IT & T industry
(C) 10,900 IT & T professionals in other sectors
(E) 25,500All other occupations in
the IT & T industry (D) 7,700
0.0
5.4South East England
London 5.4
3.6North West England
East of England 3.4
2.9West Midlands
Scotland 2.8
2.7Yorkshire & Humber
South West England 2.7
East Midlands 2.4
Wales 1.4
North East England 1.2
Northern Ireland 0.8
1.0 2.0 3.0 4.0 5.0 6.0
GVA (£bn)
Total IT & T workforce (C+D+E) 44,100
Total IT & T professionals (C+E) 36,400
0
25%
50%
75%
100%
1-10 11-49 50-199 200+
Workplaces Employees
0%
1%
2%
8%
8%
10%
13%
25%
33%
0 5% 10% 15% 20% 25% 35%30% 40%
Agriculture Forestry & Fishing
Energy & Water
Distribution, Hotels & Restaurants
Other services
Construction
Manufacturing
Public Administration, Education & Health
Banking & Finance
Transport & Communication
0
5,000
10,000
15,000
20,000
25,000
30,000
35,000
1992 1993 1994 1995 1996 1997 1998 1999 2000 2001 2002 2003 2004 2005 2006 2007 2008 2009
£600
£400
£200
£0
36%29%
24%30%
37%28% 27%
20%14%
35%39%
38% 23%16%
23%35%
35% 41%
24%
21%21%
29%34% 34%
31%
26%30%
12% 17% 18% 13% 14%6%
20%15%
0%
25%
50%
75%
100%
2001 2002 2003 2004 2005 2006 2007 2008 2009
16-29 30-39 40-49 50+
80%
70%
60%
50%
40%
30%
20%
10%
0%
ACLWBLFE
39%
61%
39%
61%56%
44%
57%
43%
28%
72%
28%
72%
FoundationTrends
1995 2000
Skill changes New skills
2005 2007 2010 2015 2020
Industrialisation of technology
Security and Data Protection
Communications convergence and integration
Innovation
Transformation through IT
The pool of talent and gender balance
Information and analytics
Consumerisation and convergence of IT
Green IT: environmental computing
Social Computing and Web 2.0
Digital Natives
Unemployment500
Retire160
Non IT&T Job Switcher
1,930
IT&T JobSwitcher
620
Look afterfamily
90
Become a student
220
Otherinactive
300
Job switcher fromIT & Telecomsoccupations
610
Entrants to IT & Telecoms occupations
3,520
Job switchers fromNon IT & Telecoms
occupations1,840
Unemployment580
Education660
Other Inactive440
NET change inemploymentOccupation
320
Gross JobOpportunities
4,130
ReplacementJobs3,810
Internet 2%
Database 4%
Networking 4%
Management 5%
SoftwareEngineering
7%
Technical/PC support
22%
Systems design/development
55%
47%
38%
44%
48%
82%
75%
71%
27%
22%
22%
9%
21%
26%
2%52%
35%
34%
29%
9%
4%
3%
Client/customer interaction skills
Other interpersonal skills
Business skills
Skills in general
Sector knowledge/experience
Other non-technical skills
Higher level technical IT skills
Below the level required Equal to the level required Above the level required
56%
57%
77%
69%
68%
68%
71%
15%
2%
15%
21%
23%
25%
15%29%
28%
21%
17%
12%
9%
4%
General software skills/knowledge
Email/Internet skills
Database skills
Overall IT user skills
General hardware skills/knowledge
Word-processing skills
Spreadsheet skills
Below the level required Equal to the level required Above the level required
0
30%
20%
10%
40%
50%
60%
Q2.01 Q2.02 Q2.03 Q2.04 Q2.05 Q2.06 Q2.07 Q2.08 Q2.09
All ICT staff All workers
29%Staff are new to the job/company
5%Staff cannot reach required skill levels even with training
77%Staff unable to train due to work commitments
41%New projects/products/ services being launched
5%Budgets/ lack of funds
60%Company doesn’t train/train enough
8%Other
69%New systems/processes/equipment introduced
48%Technical IT/Telecoms (professional level)
23%Management (other)
21%Management (IT/Telecoms related)
21%Other (IT/Telecoms related)
17%Personal development training
16%General company
15%IT User skills
15%Generic employment training
11%Function specific training
6%Other (general)
4%Finance
0
4,000
6,000
5,000
1,000
3,000
2,000
2002 2003 2004 2005 2006 2007 2008Year
0
5000
10,000
15,000
20,000
25,000
30,000
35,000
2002 2003 2004 2005 2006 2007 2008
G Group Accepts: Mathematical & Computing Science Computing Accepts
0
200
400
600
800
1,000
1,200
1,400
2002 2003 2004 2005 2006 2007 2008
39%Staff are new to the job/company
14%Staff cannot reach required skill levels even with training
64%Staff unable to train due to work commitments
53%New projects/products/ services being launched
1%Budgets/ lack of funds
56%Company doesn’t train/train enough
15%Other
48%New systems/processes/equipment introduced
0% 10% 20% 30% 40% 50% 60% 70% 80% 90% 100%
UK
South West
South East
London
East of England
West Midlands
East Midlands
Yorkshire & Humber
North West
North East
England
Scotland
Northern Ireland
Wales
Agriculture forestry and fishing Distribution Hotels & Restaurants Other services
Energy & Water Transport & Communication NA / DNA
Manufacturing Banking & Finance
Construction Public administration, Education & Health
ICT Managers/IT Strategy & Planning Professionals
Software Professionals
201820092001
45,000
30,000
15,000
05,900
6,700
12,700
11,700
11,400
12,900
13,600
13,900
12,800
IT Operations Technicians/IT User Support Technicians/Database Assistants & Clerks/Telecoms Engineers/Line Repairers & Cable Jointers/Computer Engineers
Computing & Telecoms Graduatesin employment (490)
IT & Telecoms industry: new graduate recruits (300)
IT & Telecoms professionals: new graduate recruits (445)
Graduates of subjects other than Computing & Telecoms (300) are shown in RedEntrants to the IT & Telecoms Workforce (560) are shown in italics
230
140100
15 120
60
125
10% 12
%
12%
12%
13% 14%
14%
14% 15
%
15%
16%
16%
17%
17%
17%
0
5%
10%
15%
20%
25%
30%
Aus
tria
Por
tuga
l
Italy
Nor
way
Pol
and
Slo
veni
a
Cze
ch R
epub
lic
Spa
in
Net
herla
nds
Slo
vaki
a
Ger
man
y
Den
mar
k
Irela
nd UK
Sw
eden
18%
Finl
and
21%
Hun
gary
23%
Rom
ania
23%
Bul
garia
18%
Wal
es
95%
4% 1% 1%
29%
13%
21%
36%
All IT & Telecoms Professionals
£500
£410
Average across Wales
£450
Average across the UK
1,080
Q2.08
1,200
Q3.08
990
Q4.08
770
Q1.09
640
Q2.09
Number of applicants to G Mathematical & Comp Sci (Group) in Wales
0
10,000
5,000
15,000
20,000
25,000
30,000
35,000
2002 2003 2004 2005 2006 2007 2008 2009
Year
IT P
rofe
ssio
nal w
orkf
orce
0
1,000
2,000
3,000
4,000
5,000
6,000
App
lican
ts
Applicants to Mathematical and Computer Science courses
IT Professional workforce
Some other way 2%
Training course - not organised/paid forby an employer 18%
Self-study using books, CD-ROMs, etc 21%
Training course - organised/paid for byan employer 30%
Formalised educational institution(school/college/university) 34%
Informal assistance from colleagues,relatives, friends etc 54%
Self-study (learning by doing) 59%
2006/07 2007/08 2006/07 2007/08 2006/07 2007/08
Male Female
100%
75%
50%
25%
0%
ACL TOTALWBLFE
55%
45%
57%
43%
87%
13%
77%
23%
39%
61%
35%
65%
55%
45%
56%
44%
2006/07 2007/08 2006/07 2007/08 2006/07 2007/08 2006/07 2007/08
Male Female
0
600
400
200
800
1,000
1,200
1,400
1,600
2005 2006 2007 2008 2009
ICT Computing
EmergingTrends
To deliver business value requires business people and technologists to work together
IT departments are increasingly focused on business enablement and intelligence
© Copyright e-skills UK Sector Skills Council Ltd 2000-2009 35
Communications convergence and integration
Telecommunications, computing and networking are converging, and moving from hardware intensive to software intensive platforms. Embedded voice communications capability is already part of emerging offerings of the internet. Increasingly, the management of voice, data, video and location information will converge in information-based services.
Enabling technologies such as Voice over Internet Protocol (VoIP), wide area wireless networks (WiMAX), and third generation mobile networks (3G) enable a range of new applications and demand new skills of the IT & Telecoms workforce.
Business transformation through IT
IT & Telecoms has moved from a back office function into a major source of competitive advantage for businesses. The transformational power of IT arises from its ability to improve performance across all business processes. But to deliver business value from technology requires business people and technologists to work together, focused on business issues. There is an increasing need for more IT professionals with broader and deeper business skills, and for more business leaders with an effective understanding of the power of technology.
Innovation
Successful innovation requires the skills to leverage technological innovation into business innovation. Enterprises will need new design skills that blend information, technology and innovation to create new sources of value - particularly in the area of user interface design and presentation. Executives see themselves as having an active role in fostering innovation, and the vast majority view IT as central to successful innovation.
The pool of talent and the gender balance
The IT & Telecoms sector has increasing demands in terms of both the number of people and their skills levels - in particular the blend of business, marketing, design and technical skills required to deliver technology-intensive solutions. Yet participation in IT-related education is declining rapidly, and the gender balance in IT & Telecoms is worsening. Different approaches to attracting people into IT & Telecoms are needed in order to sustain and grow the UK’s talent pool.
Information and analytics
The relative value of IT is shifting from the technology based processing of information to the exploitation of technology to increase business competitiveness. With outsourcing, geo-sourcing, automation and commoditisation being well established trends, IT functions are increasingly focused on business enablement and intelligence. Analytics involves applying intelligence to information to gain new insights, and to enable companies to realise competitive advantage.

© Copyright e-skills UK Sector Skills Council Ltd 2000-2009 36
Green IT
Environmental considerations are now at the core of many customer, brand and operations decisions. IT & Telecoms is both part of an environmental problem and central to environmental solutions. Addressing environmental concerns in a commercially sustainable way is demanding new skills, from technical design of power management through to the development of new services to assess environmental metrics.
Consumerisation and convergence of IT
The convergence of communications, computing and content platforms have blurred the lines between technology for business and technology for the home. Consumers require their information, services and products to be available on their platform of choice - from PCs to mobile devices to games consoles. This places increased demands on information and network architectures, and innovation in areas such as information display, transaction processing and service assurance. Further, consumerisation is creating a new IT market, as more than 21 million homes in the UK increasingly require access to IT skills to integrate and operate information-intensive technologies.
The rise of social computing
Social computing is powered by a set of internet based technologies initially referred to as Web 2.0, which shift customer-company relationships on the web to peer-to-peer socialnetworks.Unlikeweb-storefronts,thesechannelsarenotcontrolledbycompanies;instead communities of interest form opinions and value products, services and brands. Understanding and harnessing the power of collaborative computing will be increasingly essential for all businesses.
Digital natives
Digital natives - those born after 1985 who have grown up in an IT-intensive environment - are not only the customers of IT & Telecoms, but also the source of the next generation IT & Telecoms workforce. Their expectations - from products and services to working style and speed of change - are very different from past generations, and companies will need to work out how to adapt to best meet their needs and utilise their talents.

© Copyright e-skills UK Sector Skills Council Ltd 2000-2009 37
5.1.3 Focus on Telecoms
As indicated earlier in this report, the Telecoms industry is undergoing substantial change. In addition to the trends set out in section 5.1.2, a number of specific changes are expected to have an increasing impact on the Telecoms workforce and its skills needs:
• Theestablishmentofapacket-basedInternetProtocolnetworkintheUK(BT’s21stCentury Network 21CN).
• Telecoms providers offering IT services and IT providers offering telecoms servicesusing the IP network.
• The potential for new technologies such as WiMAX (Worldwide Interoperability forMicrowave Access) to offer new means of delivery of voice / data services.
• The effect of convergence in termsof commoncontent onmultiple devices and interms of multiple media on individual devices - which has implications for product configuration management, maintenance and billing systems.
• The potential of wide scale introduction of Radio Frequency Identification Devices(RFID), with a consequent increased focus on information management processes.
5.2 Implications of emerging trends
Understanding the effects of these trends or forces for change is key to anticipating the technology-related skills needed for competitiveness. They impact on all of the e-skills UK communities: the IT & Telecoms workforce, business leaders and managers, and IT users, all of whom will require increasingly complex skills at ever higher levels:
The IT & Telecoms industry
Companies will have to continue to expand their capabilities and the breadth of their service offering as the traditional model of IT & Telecoms software sales, service and support give way to new business models and markets, driven by consumerisation and convergence.
The industry needs to develop more of the higher value skills of leadership and relationship management, business process analysis and design, project and programme management skills, business intelligence, information analytics and architecture skills to handle increasingly complex technology systems. Basic technology skills and jobs are increasingly located off shore.
IT & Telecoms professionals
IT & Telecoms professionals will require greater skills in the application of technology to improve business performance, and in conceptualising and implementing technology-enabled business change programmes. As well as continuing to have very strong technical skills in areas such as systems architecture and security, they will also need to develop greater expertise in networking and some will need skills in areas such as multi device management and design to take advantage of converged technologies.

© Copyright e-skills UK Sector Skills Council Ltd 2000-2009
IT users will need increasingly higher skills levels for the future
38
As IT moves deeper into the board room, IT professionals will need more skills in business processes, enterprise change and management at the portfolio, programme and project levels, and also business architecture skills, risk management and security skills. Web and internet specialist skills will be increasingly in demand, as will the project management and supplier management skills to manage outsourced work.
For Telecoms professionals specifically, there is likely to be a reduction in the staffing needed to maintain the existing core networks, as they become more robust and basic maintenance activities are performed intelligently by the network itself. There will, in contrast, be an increase in higher level network design and development skills for the new 21st Century Network, along with increased demand for software skills in general and in the following in particular: distributed and internet applications, network management and security, and information management. In addition to the increase in skills associated with the changes in the core network, there will also be a requirement for staff to create the new services facilitated by the move to a common IP environment, and new skills requirements due to WiMAX expansion.
More detail on changing skills requirements for IT & Telecoms is provided in section 7 ‘The skills of the workforce’.
Business leaders and managers
Business leaders and managers will need to be able to release the transformational power of IT through a co-ordinated and integrated business and IT strategy. They will increasingly need the skills to integrate IT across all business processes and organisational structures. They will also require the skills to innovate through technology and to develop technology intensive products and services.
IT users
Key knowledge workers will need increasingly high level skills in information and analytics and business analysis, collaborating with IT professionals to design and implement new solutions and business processes. IT users more generally will need not only increased levels of skills in basic desk top technology, they will also need to be skilled in security management and IT support processes and tools. They will increasingly use IT in decision making, and in some cases to create new sources of customer value.
More detail on changing skills requirements for IT users is provided in section 9 ‘The wider population and the use of IT’.

Employment in IT & Telecoms professional occupations in Wales will grow at 1 % per annum - ten times faster than the average across the economy of Wales
© Copyright e-skills UK Sector Skills Council Ltd 2000-2009
6.0 Recruitment into IT & Telecoms
39
This section sets out IT & Telecoms workforce growth dynamics, recruitment needs by occupation, provides information about recruitment sources and highlights implications in terms of priorities for action.
6.1 IT & Telecoms workforce growth dynamics 2009-2018
A substantive work effort has been undertaken with Experian to provide employment forecasts for the IT & Telecoms workforce. This is particularly critical intelligence for a workforce which requires the type of high skills levels that may require several years of development.
Predicted growth rates forecast for IT & Telecoms over the period 2009-2018 have been assessed in line with Experian’s overall forecasting methodology. This involves a top-down approach beginning with the UK economy as a whole, and with key macroeconomic variables. Estimates of national and regional employment by industry are determined, and these then inform the forecasts for IT & Telecoms activity.
Table 8: Employment growth rates in Wales 2009-2018
Employment growth rates - average per annum, 2009-2018
IT industry 0.6%
Telecoms industry -0.1%
Total IT & Telecoms industry combined 0.3%
IT & Telecoms professionals 1.0%
Wales workforce: all sectors 0.1%
Source: ‘IT & Telecoms Insights 2009: Employment Forecasts’, e-skills UK / Experian
Table 8 shows the projection that employment in IT & Telecoms professional occupations will grow at 1% per annum, which is ten times faster than the average employment growth of Wales. In contrast, the Telecoms industry which has grown steadily in Wales since 2001 shows a decline in employment over the ten year period to 2018.
Underneath this overall forecast growth of 1% per annum across the IT & Telecoms professional workforce lies a more complex picture of restructuring and skills shift. As discussed in section 2.2, the movement of certain IT activities to lower cost countries (geosourcing) is creating challenges in terms of career paths and skills development. The impact of these global dynamics plays through into the following forecasts for the various occupational segments within the IT & Telecoms professional workforce.
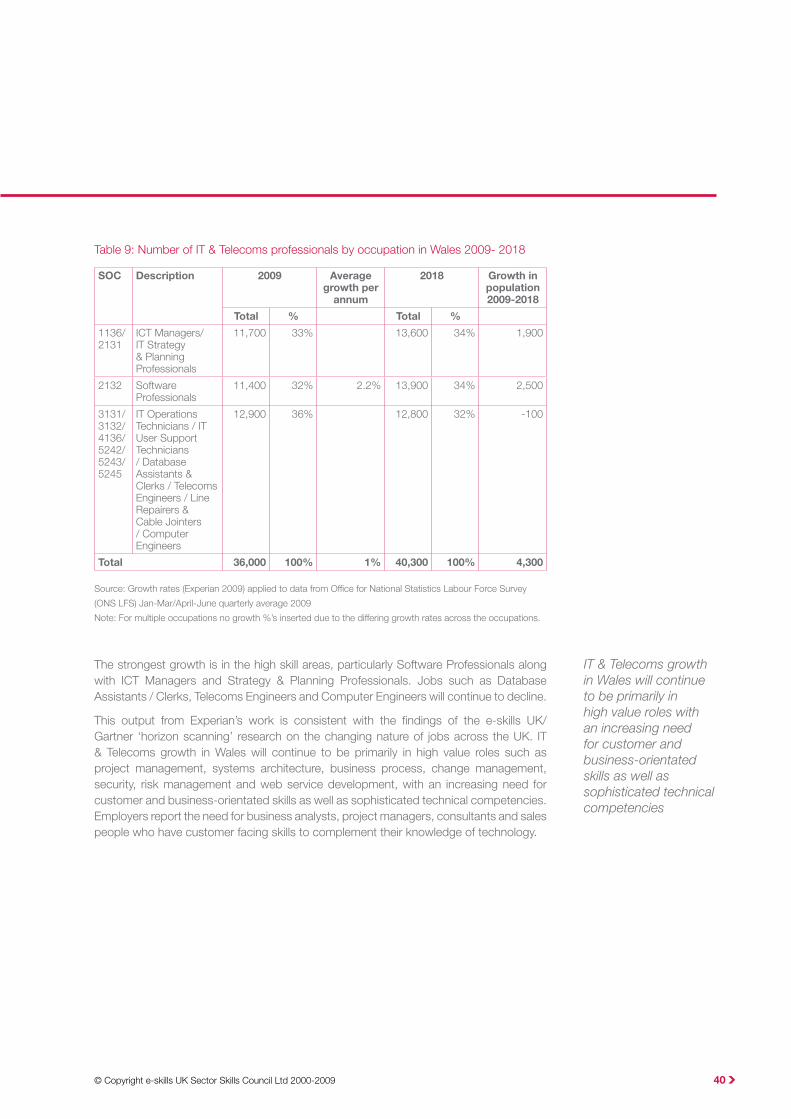
© Copyright e-skills UK Sector Skills Council Ltd 2000-2009
IT & Telecoms growth in Wales will continue to be primarily in high value roles with an increasing need for customer and business-orientated skills as well as sophisticated technical competencies
40
Table 9: Number of IT & Telecoms professionals by occupation in Wales 2009- 2018
SOC Description 2009 Average growth per
annum
2018 Growth in population 2009-2018
Total % Total %
1136/ 2131
ICT Managers/IT Strategy & Planning Professionals
11,700 33% 13,600 34% 1,900
2132 Software Professionals
11,400 32% 2.2% 13,900 34% 2,500
3131/ 3132/ 4136/ 5242/ 5243/ 5245
IT Operations Technicians / IT User Support Technicians / Database Assistants & Clerks / Telecoms Engineers / Line Repairers & Cable Jointers / Computer Engineers
12,900 36% 12,800 32% -100
Total 36,000 100% 1% 40,300 100% 4,300
Source: Growth rates (Experian 2009) applied to data from Office for National Statistics Labour Force Survey
(ONS LFS) Jan-Mar/April-June quarterly average 2009
Note: For multiple occupations no growth %’s inserted due to the differing growth rates across the occupations.
The strongest growth is in the high skill areas, particularly Software Professionals along with ICT Managers and Strategy & Planning Professionals. Jobs such as Database Assistants / Clerks, Telecoms Engineers and Computer Engineers will continue to decline.
This output from Experian’s work is consistent with the findings of the e-skills UK/Gartner ‘horizon scanning’ research on the changing nature of jobs across the UK. IT & Telecoms growth in Wales will continue to be primarily in high value roles such as project management, systems architecture, business process, change management, security, risk management and web service development, with an increasing need for customer and business-orientated skills as well as sophisticated technical competencies. Employers report the need for business analysts, project managers, consultants and sales people who have customer facing skills to complement their knowledge of technology.

© Copyright e-skills UK Sector Skills Council Ltd 2000-2009 41
Figure 11: Number of IT & Telecoms professionals in Wales by occupation 2001, 2009 and forecast to 2018
Source: ONS LFS 2001, 2009. 2018 from growth rates (Experian 2009) applied to data from Office for National
Statistics Labour Force Survey (ONS LFS) Jan-Mar/April-June quarterly average 2009
6.2 Recruitment needs by occupation, growth and replacement demand
6.2.1 Background
The employment change estimates and forecasts presented in the previous section are net changes in employment, i.e. the stock of jobs forecast in a particular occupation in 2018 compared with 2009. This can be termed the change due to expansion or contraction. This section looks at the relationship between net and gross employment changes in the demand for labour by occupation, which is particularly useful in terms of projecting job-specific qualifications, skills requirements and potential training issues.
Gross employment changes also take into account job opportunities created by replacement demand. Additional information on replacement rates have been used to adjust the forecasts to take replacement demand into account. A job opportunity is generated whenever a net new job is created (growth) or whenever someone leaves an occupation (replacement) - either for another occupation or to leave employment altogether. These two effects together (i.e. growth + replacement) have been termed ‘gross job opportunities’. Note that gross job opportunities created by replacement tend to be much larger than those created by expansion.
Population (A)2,959,000
Workforce (B)1,248,000
Total IT & T industry
(C+D)18,600
IT & T professionals in IT & T industry
(C) 10,900 IT & T professionals in other sectors
(E) 25,500All other occupations in
the IT & T industry (D) 7,700
0.0
5.4South East England
London 5.4
3.6North West England
East of England 3.4
2.9West Midlands
Scotland 2.8
2.7Yorkshire & Humber
South West England 2.7
East Midlands 2.4
Wales 1.4
North East England 1.2
Northern Ireland 0.8
1.0 2.0 3.0 4.0 5.0 6.0
GVA (£bn)
Total IT & T workforce (C+D+E) 44,100
Total IT & T professionals (C+E) 36,400
0
25%
50%
75%
100%
1-10 11-49 50-199 200+
Workplaces Employees
0%
1%
2%
8%
8%
10%
13%
25%
33%
0 5% 10% 15% 20% 25% 35%30% 40%
Agriculture Forestry & Fishing
Energy & Water
Distribution, Hotels & Restaurants
Other services
Construction
Manufacturing
Public Administration, Education & Health
Banking & Finance
Transport & Communication
0
5,000
10,000
15,000
20,000
25,000
30,000
35,000
1992 1993 1994 1995 1996 1997 1998 1999 2000 2001 2002 2003 2004 2005 2006 2007 2008 2009
£600
£400
£200
£0
36%29%
24%30%
37%28% 27%
20%14%
35%39%
38% 23%16%
23%35%
35% 41%
24%
21%21%
29%34% 34%
31%
26%30%
12% 17% 18% 13% 14%6%
20%15%
0%
25%
50%
75%
100%
2001 2002 2003 2004 2005 2006 2007 2008 2009
16-29 30-39 40-49 50+
80%
70%
60%
50%
40%
30%
20%
10%
0%
ACLWBLFE
39%
61%
39%
61%56%
44%
57%
43%
28%
72%
28%
72%
FoundationTrends
1995 2000
Skill changes New skills
2005 2007 2010 2015 2020
Industrialisation of technology
Security and Data Protection
Communications convergence and integration
Innovation
Transformation through IT
The pool of talent and gender balance
Information and analytics
Consumerisation and convergence of IT
Green IT: environmental computing
Social Computing and Web 2.0
Digital Natives
Unemployment500
Retire160
Non IT&T Job Switcher
1,930
IT&T JobSwitcher
620
Look afterfamily
90
Become a student
220
Otherinactive
300
Job switcher fromIT & Telecomsoccupations
610
Entrants to IT & Telecoms occupations
3,520
Job switchers fromNon IT & Telecoms
occupations1,840
Unemployment580
Education660
Other Inactive440
NET change inemploymentOccupation
320
Gross JobOpportunities
4,130
ReplacementJobs3,810
Internet 2%
Database 4%
Networking 4%
Management 5%
SoftwareEngineering
7%
Technical/PC support
22%
Systems design/development
55%
47%
38%
44%
48%
82%
75%
71%
27%
22%
22%
9%
21%
26%
2%52%
35%
34%
29%
9%
4%
3%
Client/customer interaction skills
Other interpersonal skills
Business skills
Skills in general
Sector knowledge/experience
Other non-technical skills
Higher level technical IT skills
Below the level required Equal to the level required Above the level required
56%
57%
77%
69%
68%
68%
71%
15%
2%
15%
21%
23%
25%
15%29%
28%
21%
17%
12%
9%
4%
General software skills/knowledge
Email/Internet skills
Database skills
Overall IT user skills
General hardware skills/knowledge
Word-processing skills
Spreadsheet skills
Below the level required Equal to the level required Above the level required
0
30%
20%
10%
40%
50%
60%
Q2.01 Q2.02 Q2.03 Q2.04 Q2.05 Q2.06 Q2.07 Q2.08 Q2.09
All ICT staff All workers
29%Staff are new to the job/company
5%Staff cannot reach required skill levels even with training
77%Staff unable to train due to work commitments
41%New projects/products/ services being launched
5%Budgets/ lack of funds
60%Company doesn’t train/train enough
8%Other
69%New systems/processes/equipment introduced
48%Technical IT/Telecoms (professional level)
23%Management (other)
21%Management (IT/Telecoms related)
21%Other (IT/Telecoms related)
17%Personal development training
16%General company
15%IT User skills
15%Generic employment training
11%Function specific training
6%Other (general)
4%Finance
0
4,000
6,000
5,000
1,000
3,000
2,000
2002 2003 2004 2005 2006 2007 2008Year
0
5000
10,000
15,000
20,000
25,000
30,000
35,000
2002 2003 2004 2005 2006 2007 2008
G Group Accepts: Mathematical & Computing Science Computing Accepts
0
200
400
600
800
1,000
1,200
1,400
2002 2003 2004 2005 2006 2007 2008
39%Staff are new to the job/company
14%Staff cannot reach required skill levels even with training
64%Staff unable to train due to work commitments
53%New projects/products/ services being launched
1%Budgets/ lack of funds
56%Company doesn’t train/train enough
15%Other
48%New systems/processes/equipment introduced
0% 10% 20% 30% 40% 50% 60% 70% 80% 90% 100%
UK
South West
South East
London
East of England
West Midlands
East Midlands
Yorkshire & Humber
North West
North East
England
Scotland
Northern Ireland
Wales
Agriculture forestry and fishing Distribution Hotels & Restaurants Other services
Energy & Water Transport & Communication NA / DNA
Manufacturing Banking & Finance
Construction Public administration, Education & Health
ICT Managers/IT Strategy & Planning Professionals
Software Professionals
201820092001
45,000
30,000
15,000
05,900
6,700
12,700
11,700
11,400
12,900
13,600
13,900
12,800
IT Operations Technicians/IT User Support Technicians/Database Assistants & Clerks/Telecoms Engineers/Line Repairers & Cable Jointers/Computer Engineers
Computing & Telecoms Graduatesin employment (490)
IT & Telecoms industry: new graduate recruits (300)
IT & Telecoms professionals: new graduate recruits (445)
Graduates of subjects other than Computing & Telecoms (300) are shown in RedEntrants to the IT & Telecoms Workforce (560) are shown in italics
230
140100
15 120
60
125
10% 12
%
12%
12%
13% 14%
14%
14% 15
%
15%
16%
16%
17%
17%
17%
0
5%
10%
15%
20%
25%
30%
Aus
tria
Por
tuga
l
Italy
Nor
way
Pol
and
Slo
veni
a
Cze
ch R
epub
lic
Spa
in
Net
herla
nds
Slo
vaki
a
Ger
man
y
Den
mar
k
Irela
nd UK
Sw
eden
18%
Finl
and
21%
Hun
gary
23%
Rom
ania
23%
Bul
garia
18%
Wal
es
95%
4% 1% 1%
29%
13%
21%
36%
All IT & Telecoms Professionals
£500
£410
Average across Wales
£450
Average across the UK
1,080
Q2.08
1,200
Q3.08
990
Q4.08
770
Q1.09
640
Q2.09
Number of applicants to G Mathematical & Comp Sci (Group) in Wales
0
10,000
5,000
15,000
20,000
25,000
30,000
35,000
2002 2003 2004 2005 2006 2007 2008 2009
Year
IT P
rofe
ssio
nal w
orkf
orce
0
1,000
2,000
3,000
4,000
5,000
6,000
App
lican
ts
Applicants to Mathematical and Computer Science courses
IT Professional workforce
Some other way 2%
Training course - not organised/paid forby an employer 18%
Self-study using books, CD-ROMs, etc 21%
Training course - organised/paid for byan employer 30%
Formalised educational institution(school/college/university) 34%
Informal assistance from colleagues,relatives, friends etc 54%
Self-study (learning by doing) 59%
2006/07 2007/08 2006/07 2007/08 2006/07 2007/08
Male Female
100%
75%
50%
25%
0%
ACL TOTALWBLFE
55%
45%
57%
43%
87%
13%
77%
23%
39%
61%
35%
65%
55%
45%
56%
44%
2006/07 2007/08 2006/07 2007/08 2006/07 2007/08 2006/07 2007/08
Male Female
0
600
400
200
800
1,000
1,200
1,400
1,600
2005 2006 2007 2008 2009
ICT Computing
EmergingTrends

© Copyright e-skills UK Sector Skills Council Ltd 2000-2009
3,520 jobs in Wales each year need to be filled by new entrants moving into IT & Telecoms professional roles
42
6.2.2 IT & Telecoms Professionals - Gross job opportunities in Wales per annum to 2013
Figure 12 below shows there are 4,130 gross job opportunities expected each year between 2008 and 2013 across all IT & Telecoms occupations. Replacement accounts for a significant proportion of these opportunities with 3,810 jobs (or 77%), expected to become available due to one of the replacement factors.
Figure 12: Gross job opportunities in Wales per annum - IT & Telecoms professionals
Source: e-skills UK
Population (A)2,959,000
Workforce (B)1,248,000
Total IT & T industry
(C+D)18,600
IT & T professionals in IT & T industry
(C) 10,900 IT & T professionals in other sectors
(E) 25,500All other occupations in
the IT & T industry (D) 7,700
0.0
5.4South East England
London 5.4
3.6North West England
East of England 3.4
2.9West Midlands
Scotland 2.8
2.7Yorkshire & Humber
South West England 2.7
East Midlands 2.4
Wales 1.4
North East England 1.2
Northern Ireland 0.8
1.0 2.0 3.0 4.0 5.0 6.0
GVA (£bn)
Total IT & T workforce (C+D+E) 44,100
Total IT & T professionals (C+E) 36,400
0
25%
50%
75%
100%
1-10 11-49 50-199 200+
Workplaces Employees
0%
1%
2%
8%
8%
10%
13%
25%
33%
0 5% 10% 15% 20% 25% 35%30% 40%
Agriculture Forestry & Fishing
Energy & Water
Distribution, Hotels & Restaurants
Other services
Construction
Manufacturing
Public Administration, Education & Health
Banking & Finance
Transport & Communication
0
5,000
10,000
15,000
20,000
25,000
30,000
35,000
1992 1993 1994 1995 1996 1997 1998 1999 2000 2001 2002 2003 2004 2005 2006 2007 2008 2009
£600
£400
£200
£0
36%29%
24%30%
37%28% 27%
20%14%
35%39%
38% 23%16%
23%35%
35% 41%
24%
21%21%
29%34% 34%
31%
26%30%
12% 17% 18% 13% 14%6%
20%15%
0%
25%
50%
75%
100%
2001 2002 2003 2004 2005 2006 2007 2008 2009
16-29 30-39 40-49 50+
80%
70%
60%
50%
40%
30%
20%
10%
0%
ACLWBLFE
39%
61%
39%
61%56%
44%
57%
43%
28%
72%
28%
72%
FoundationTrends
1995 2000
Skill changes New skills
2005 2007 2010 2015 2020
Industrialisation of technology
Security and Data Protection
Communications convergence and integration
Innovation
Transformation through IT
The pool of talent and gender balance
Information and analytics
Consumerisation and convergence of IT
Green IT: environmental computing
Social Computing and Web 2.0
Digital Natives
Unemployment500
Retire160
Non IT&T Job Switcher
1,930
IT&T JobSwitcher
620
Look afterfamily
90
Become a student
220
Otherinactive
300
Job switcher fromIT & Telecomsoccupations
610
Entrants to IT & Telecoms occupations
3,520
Job switchers fromNon IT & Telecoms
occupations1,840
Unemployment580
Education660
Other Inactive440
NET change inemploymentOccupation
320
Gross JobOpportunities
4,130
ReplacementJobs3,810
Internet 2%
Database 4%
Networking 4%
Management 5%
SoftwareEngineering
7%
Technical/PC support
22%
Systems design/development
55%
47%
38%
44%
48%
82%
75%
71%
27%
22%
22%
9%
21%
26%
2%52%
35%
34%
29%
9%
4%
3%
Client/customer interaction skills
Other interpersonal skills
Business skills
Skills in general
Sector knowledge/experience
Other non-technical skills
Higher level technical IT skills
Below the level required Equal to the level required Above the level required
56%
57%
77%
69%
68%
68%
71%
15%
2%
15%
21%
23%
25%
15%29%
28%
21%
17%
12%
9%
4%
General software skills/knowledge
Email/Internet skills
Database skills
Overall IT user skills
General hardware skills/knowledge
Word-processing skills
Spreadsheet skills
Below the level required Equal to the level required Above the level required
0
30%
20%
10%
40%
50%
60%
Q2.01 Q2.02 Q2.03 Q2.04 Q2.05 Q2.06 Q2.07 Q2.08 Q2.09
All ICT staff All workers
29%Staff are new to the job/company
5%Staff cannot reach required skill levels even with training
77%Staff unable to train due to work commitments
41%New projects/products/ services being launched
5%Budgets/ lack of funds
60%Company doesn’t train/train enough
8%Other
69%New systems/processes/equipment introduced
48%Technical IT/Telecoms (professional level)
23%Management (other)
21%Management (IT/Telecoms related)
21%Other (IT/Telecoms related)
17%Personal development training
16%General company
15%IT User skills
15%Generic employment training
11%Function specific training
6%Other (general)
4%Finance
0
4,000
6,000
5,000
1,000
3,000
2,000
2002 2003 2004 2005 2006 2007 2008Year
0
5000
10,000
15,000
20,000
25,000
30,000
35,000
2002 2003 2004 2005 2006 2007 2008
G Group Accepts: Mathematical & Computing Science Computing Accepts
0
200
400
600
800
1,000
1,200
1,400
2002 2003 2004 2005 2006 2007 2008
39%Staff are new to the job/company
14%Staff cannot reach required skill levels even with training
64%Staff unable to train due to work commitments
53%New projects/products/ services being launched
1%Budgets/ lack of funds
56%Company doesn’t train/train enough
15%Other
48%New systems/processes/equipment introduced
0% 10% 20% 30% 40% 50% 60% 70% 80% 90% 100%
UK
South West
South East
London
East of England
West Midlands
East Midlands
Yorkshire & Humber
North West
North East
England
Scotland
Northern Ireland
Wales
Agriculture forestry and fishing Distribution Hotels & Restaurants Other services
Energy & Water Transport & Communication NA / DNA
Manufacturing Banking & Finance
Construction Public administration, Education & Health
ICT Managers/IT Strategy & Planning Professionals
Software Professionals
201820092001
45,000
30,000
15,000
05,900
6,700
12,700
11,700
11,400
12,900
13,600
13,900
12,800
IT Operations Technicians/IT User Support Technicians/Database Assistants & Clerks/Telecoms Engineers/Line Repairers & Cable Jointers/Computer Engineers
Computing & Telecoms Graduatesin employment (490)
IT & Telecoms industry: new graduate recruits (300)
IT & Telecoms professionals: new graduate recruits (445)
Graduates of subjects other than Computing & Telecoms (300) are shown in RedEntrants to the IT & Telecoms Workforce (560) are shown in italics
230
140100
15 120
60
125
10% 12
%
12%
12%
13% 14%
14%
14% 15
%
15%
16%
16%
17%
17%
17%
0
5%
10%
15%
20%
25%
30%
Aus
tria
Por
tuga
l
Italy
Nor
way
Pol
and
Slo
veni
a
Cze
ch R
epub
lic
Spa
in
Net
herla
nds
Slo
vaki
a
Ger
man
y
Den
mar
k
Irela
nd UK
Sw
eden
18%
Finl
and
21%
Hun
gary
23%
Rom
ania
23%
Bul
garia
18%
Wal
es
95%
4% 1% 1%
29%
13%
21%
36%
All IT & Telecoms Professionals
£500
£410
Average across Wales
£450
Average across the UK
1,080
Q2.08
1,200
Q3.08
990
Q4.08
770
Q1.09
640
Q2.09
Number of applicants to G Mathematical & Comp Sci (Group) in Wales
0
10,000
5,000
15,000
20,000
25,000
30,000
35,000
2002 2003 2004 2005 2006 2007 2008 2009
Year
IT P
rofe
ssio
nal w
orkf
orce
0
1,000
2,000
3,000
4,000
5,000
6,000
App
lican
ts
Applicants to Mathematical and Computer Science courses
IT Professional workforce
Some other way 2%
Training course - not organised/paid forby an employer 18%
Self-study using books, CD-ROMs, etc 21%
Training course - organised/paid for byan employer 30%
Formalised educational institution(school/college/university) 34%
Informal assistance from colleagues,relatives, friends etc 54%
Self-study (learning by doing) 59%
2006/07 2007/08 2006/07 2007/08 2006/07 2007/08
Male Female
100%
75%
50%
25%
0%
ACL TOTALWBLFE
55%
45%
57%
43%
87%
13%
77%
23%
39%
61%
35%
65%
55%
45%
56%
44%
2006/07 2007/08 2006/07 2007/08 2006/07 2007/08 2006/07 2007/08
Male Female
0
600
400
200
800
1,000
1,200
1,400
1,600
2005 2006 2007 2008 2009
ICT Computing
EmergingTrends

The largest recruitment source (52%) is ‘employed individuals in occupations other than IT or Telecoms’ with new entrants from education contributing 19%
© Copyright e-skills UK Sector Skills Council Ltd 2000-2009 43
6.2.3 Recruitment needs by occupation
Table 10 shows the breakdown of the total gross job opportunities for IT & Telecoms professionals in Wales by growth and replacement.
Table 10: IT & Telecoms occupations - gross job opportunities in Wales per annum to 2013
Due to growth / expansion
Due to replacement
Gross job opportunities
Jobs filled by:
Movement within IT & Telecoms
professional workforce
New entrants to the IT & Telecoms
professional workforce
320 3,810 4,130 610 3,520
Source: ‘IT & Telecoms Insights 2009: Employment Forecasts’, e-skills UK / Experian
Of the total of 4,130 appointments a year, only 610 will be filled by people who will move from one IT & Telecoms professional occupational segment to another (i.e. ‘churn’ - movement within the IT & Telecoms professional workforce). 3,520 jobs each year need to be filled by people moving into an IT & Telecoms professional job from elsewhere - for example from another profession, from education or from unemployment.
6.2.4 Recruitment sources for IT & Telecoms occupations
As set out in table 10 above, there is a need for 3,520 new entrants a year into IT & Telecoms professional occupations. Based on current data, the make up of this intake is expected to be as follows:
Table 11: IT & Telecoms professionals - recruitment sources for new entrants
Recruitment source Number (average per annum to 2013)
Share
Employed individuals in occupations other than IT or Telecoms
1,840 52%
Individuals joining from education 660 19%
Other sources 1,020 29%
Total 3,520 100%
Source: ‘IT & Telecoms Insights 2009: Employment Forecasts’, e-skills UK / Experian

© Copyright e-skills UK Sector Skills Council Ltd 2000-2009
27 Salary Services Ltd - http://www.salaryservices.co.uk/
44
6.3 Current demand for IT & Telecoms professionals
As with many other sectors, demand for IT & Telecoms professionals has declined significantly over the past year as a result of the economic slowdown, both within the UK as a whole and within Wales more specifically. During the second quarter of 2009, there are estimated to have been approximately 640 positions advertised for IT & Telecoms professionals in Wales - a decline of around 40% compared with the equivalent quarter of 200827.
Figure 13: Change in demand for IT & Telecoms professionals in Wales, 2008-2009
Source: e-skills UK analysis of data provided by Salary Services Ltd
Population (A)2,959,000
Workforce (B)1,248,000
Total IT & T industry
(C+D)18,600
IT & T professionals in IT & T industry
(C) 10,900 IT & T professionals in other sectors
(E) 25,500All other occupations in
the IT & T industry (D) 7,700
0.0
5.4South East England
London 5.4
3.6North West England
East of England 3.4
2.9West Midlands
Scotland 2.8
2.7Yorkshire & Humber
South West England 2.7
East Midlands 2.4
Wales 1.4
North East England 1.2
Northern Ireland 0.8
1.0 2.0 3.0 4.0 5.0 6.0
GVA (£bn)
Total IT & T workforce (C+D+E) 44,100
Total IT & T professionals (C+E) 36,400
0
25%
50%
75%
100%
1-10 11-49 50-199 200+
Workplaces Employees
0%
1%
2%
8%
8%
10%
13%
25%
33%
0 5% 10% 15% 20% 25% 35%30% 40%
Agriculture Forestry & Fishing
Energy & Water
Distribution, Hotels & Restaurants
Other services
Construction
Manufacturing
Public Administration, Education & Health
Banking & Finance
Transport & Communication
0
5,000
10,000
15,000
20,000
25,000
30,000
35,000
1992 1993 1994 1995 1996 1997 1998 1999 2000 2001 2002 2003 2004 2005 2006 2007 2008 2009
£600
£400
£200
£0
36%29%
24%30%
37%28% 27%
20%14%
35%39%
38% 23%16%
23%35%
35% 41%
24%
21%21%
29%34% 34%
31%
26%30%
12% 17% 18% 13% 14%6%
20%15%
0%
25%
50%
75%
100%
2001 2002 2003 2004 2005 2006 2007 2008 2009
16-29 30-39 40-49 50+
80%
70%
60%
50%
40%
30%
20%
10%
0%
ACLWBLFE
39%
61%
39%
61%56%
44%
57%
43%
28%
72%
28%
72%
FoundationTrends
1995 2000
Skill changes New skills
2005 2007 2010 2015 2020
Industrialisation of technology
Security and Data Protection
Communications convergence and integration
Innovation
Transformation through IT
The pool of talent and gender balance
Information and analytics
Consumerisation and convergence of IT
Green IT: environmental computing
Social Computing and Web 2.0
Digital Natives
Unemployment500
Retire160
Non IT&T Job Switcher
1,930
IT&T JobSwitcher
620
Look afterfamily
90
Become a student
220
Otherinactive
300
Job switcher fromIT & Telecomsoccupations
610
Entrants to IT & Telecoms occupations
3,520
Job switchers fromNon IT & Telecoms
occupations1,840
Unemployment580
Education660
Other Inactive440
NET change inemploymentOccupation
320
Gross JobOpportunities
4,130
ReplacementJobs3,810
Internet 2%
Database 4%
Networking 4%
Management 5%
SoftwareEngineering
7%
Technical/PC support
22%
Systems design/development
55%
47%
38%
44%
48%
82%
75%
71%
27%
22%
22%
9%
21%
26%
2%52%
35%
34%
29%
9%
4%
3%
Client/customer interaction skills
Other interpersonal skills
Business skills
Skills in general
Sector knowledge/experience
Other non-technical skills
Higher level technical IT skills
Below the level required Equal to the level required Above the level required
56%
57%
77%
69%
68%
68%
71%
15%
2%
15%
21%
23%
25%
15%29%
28%
21%
17%
12%
9%
4%
General software skills/knowledge
Email/Internet skills
Database skills
Overall IT user skills
General hardware skills/knowledge
Word-processing skills
Spreadsheet skills
Below the level required Equal to the level required Above the level required
0
30%
20%
10%
40%
50%
60%
Q2.01 Q2.02 Q2.03 Q2.04 Q2.05 Q2.06 Q2.07 Q2.08 Q2.09
All ICT staff All workers
29%Staff are new to the job/company
5%Staff cannot reach required skill levels even with training
77%Staff unable to train due to work commitments
41%New projects/products/ services being launched
5%Budgets/ lack of funds
60%Company doesn’t train/train enough
8%Other
69%New systems/processes/equipment introduced
48%Technical IT/Telecoms (professional level)
23%Management (other)
21%Management (IT/Telecoms related)
21%Other (IT/Telecoms related)
17%Personal development training
16%General company
15%IT User skills
15%Generic employment training
11%Function specific training
6%Other (general)
4%Finance
0
4,000
6,000
5,000
1,000
3,000
2,000
2002 2003 2004 2005 2006 2007 2008Year
0
5000
10,000
15,000
20,000
25,000
30,000
35,000
2002 2003 2004 2005 2006 2007 2008
G Group Accepts: Mathematical & Computing Science Computing Accepts
0
200
400
600
800
1,000
1,200
1,400
2002 2003 2004 2005 2006 2007 2008
39%Staff are new to the job/company
14%Staff cannot reach required skill levels even with training
64%Staff unable to train due to work commitments
53%New projects/products/ services being launched
1%Budgets/ lack of funds
56%Company doesn’t train/train enough
15%Other
48%New systems/processes/equipment introduced
0% 10% 20% 30% 40% 50% 60% 70% 80% 90% 100%
UK
South West
South East
London
East of England
West Midlands
East Midlands
Yorkshire & Humber
North West
North East
England
Scotland
Northern Ireland
Wales
Agriculture forestry and fishing Distribution Hotels & Restaurants Other services
Energy & Water Transport & Communication NA / DNA
Manufacturing Banking & Finance
Construction Public administration, Education & Health
ICT Managers/IT Strategy & Planning Professionals
Software Professionals
201820092001
45,000
30,000
15,000
05,900
6,700
12,700
11,700
11,400
12,900
13,600
13,900
12,800
IT Operations Technicians/IT User Support Technicians/Database Assistants & Clerks/Telecoms Engineers/Line Repairers & Cable Jointers/Computer Engineers
Computing & Telecoms Graduatesin employment (490)
IT & Telecoms industry: new graduate recruits (300)
IT & Telecoms professionals: new graduate recruits (445)
Graduates of subjects other than Computing & Telecoms (300) are shown in RedEntrants to the IT & Telecoms Workforce (560) are shown in italics
230
140100
15 120
60
125
10% 12
%
12%
12%
13% 14%
14%
14% 15
%
15%
16%
16%
17%
17%
17%
0
5%
10%
15%
20%
25%
30%
Aus
tria
Por
tuga
l
Italy
Nor
way
Pol
and
Slo
veni
a
Cze
ch R
epub
lic
Spa
in
Net
herla
nds
Slo
vaki
a
Ger
man
y
Den
mar
k
Irela
nd UK
Sw
eden
18%
Finl
and
21%
Hun
gary
23%
Rom
ania
23%
Bul
garia
18%
Wal
es
95%
4% 1% 1%
29%
13%
21%
36%
All IT & Telecoms Professionals
£500
£410
Average across Wales
£450
Average across the UK
1,080
Q2.08
1,200
Q3.08
990
Q4.08
770
Q1.09
640
Q2.09
Number of applicants to G Mathematical & Comp Sci (Group) in Wales
0
10,000
5,000
15,000
20,000
25,000
30,000
35,000
2002 2003 2004 2005 2006 2007 2008 2009
Year
IT P
rofe
ssio
nal w
orkf
orce
0
1,000
2,000
3,000
4,000
5,000
6,000
App
lican
ts
Applicants to Mathematical and Computer Science courses
IT Professional workforce
Some other way 2%
Training course - not organised/paid forby an employer 18%
Self-study using books, CD-ROMs, etc 21%
Training course - organised/paid for byan employer 30%
Formalised educational institution(school/college/university) 34%
Informal assistance from colleagues,relatives, friends etc 54%
Self-study (learning by doing) 59%
2006/07 2007/08 2006/07 2007/08 2006/07 2007/08
Male Female
100%
75%
50%
25%
0%
ACL TOTALWBLFE
55%
45%
57%
43%
87%
13%
77%
23%
39%
61%
35%
65%
55%
45%
56%
44%
2006/07 2007/08 2006/07 2007/08 2006/07 2007/08 2006/07 2007/08
Male Female
0
600
400
200
800
1,000
1,200
1,400
1,600
2005 2006 2007 2008 2009
ICT Computing
EmergingTrends

The most sought after technical skills include SQL, C#, .NET, SQL, SVR, ASP, Java, Oracle, HTML and C++
© Copyright e-skills UK Sector Skills Council Ltd 2000-2009 45
Assuming that the distribution of vacancies is broadly similar to that in the UK, the majority of these vacancies for IT & Telecoms professionals are likely to originate from firms that are operating in the IT and Finance sectors and focussed in the areas of Systems Design/Development and Technical/PC support as illustrated below.
Figure 14: Distribution of IT & Telecoms vacancies in the UK, by occupational group, Q2.2009
Source: e-skills UK analysis of data provided by Salary Services Ltd
An analysis of the specific competencies cited within advertisements for IT & Telecoms professionals (UK) highlights the extensive range of skills required of applicants by their prospective employers, with regularly published figures from Salary Services Ltd for example covering around 150 technical skills each quarter. The majority of advertisements for IT & Telecoms positions do however, call for one or more of the ‘core’ or ‘top ten’ technical skills monitored, these being: SQL, C#, .NET, SQL, SVR, ASP, Java, Oracle, HTML and C++.
Population (A)2,959,000
Workforce (B)1,248,000
Total IT & T industry
(C+D)18,600
IT & T professionals in IT & T industry
(C) 10,900 IT & T professionals in other sectors
(E) 25,500All other occupations in
the IT & T industry (D) 7,700
0.0
5.4South East England
London 5.4
3.6North West England
East of England 3.4
2.9West Midlands
Scotland 2.8
2.7Yorkshire & Humber
South West England 2.7
East Midlands 2.4
Wales 1.4
North East England 1.2
Northern Ireland 0.8
1.0 2.0 3.0 4.0 5.0 6.0
GVA (£bn)
Total IT & T workforce (C+D+E) 44,100
Total IT & T professionals (C+E) 36,400
0
25%
50%
75%
100%
1-10 11-49 50-199 200+
Workplaces Employees
0%
1%
2%
8%
8%
10%
13%
25%
33%
0 5% 10% 15% 20% 25% 35%30% 40%
Agriculture Forestry & Fishing
Energy & Water
Distribution, Hotels & Restaurants
Other services
Construction
Manufacturing
Public Administration, Education & Health
Banking & Finance
Transport & Communication
0
5,000
10,000
15,000
20,000
25,000
30,000
35,000
1992 1993 1994 1995 1996 1997 1998 1999 2000 2001 2002 2003 2004 2005 2006 2007 2008 2009
£600
£400
£200
£0
36%29%
24%30%
37%28% 27%
20%14%
35%39%
38% 23%16%
23%35%
35% 41%
24%
21%21%
29%34% 34%
31%
26%30%
12% 17% 18% 13% 14%6%
20%15%
0%
25%
50%
75%
100%
2001 2002 2003 2004 2005 2006 2007 2008 2009
16-29 30-39 40-49 50+
80%
70%
60%
50%
40%
30%
20%
10%
0%
ACLWBLFE
39%
61%
39%
61%56%
44%
57%
43%
28%
72%
28%
72%
FoundationTrends
1995 2000
Skill changes New skills
2005 2007 2010 2015 2020
Industrialisation of technology
Security and Data Protection
Communications convergence and integration
Innovation
Transformation through IT
The pool of talent and gender balance
Information and analytics
Consumerisation and convergence of IT
Green IT: environmental computing
Social Computing and Web 2.0
Digital Natives
Unemployment500
Retire160
Non IT&T Job Switcher
1,930
IT&T JobSwitcher
620
Look afterfamily
90
Become a student
220
Otherinactive
300
Job switcher fromIT & Telecomsoccupations
610
Entrants to IT & Telecoms occupations
3,520
Job switchers fromNon IT & Telecoms
occupations1,840
Unemployment580
Education660
Other Inactive440
NET change inemploymentOccupation
320
Gross JobOpportunities
4,130
ReplacementJobs3,810
Internet 2%
Database 4%
Networking 4%
Management 5%
SoftwareEngineering
7%
Technical/PC support
22%
Systems design/development
55%
47%
38%
44%
48%
82%
75%
71%
27%
22%
22%
9%
21%
26%
2%52%
35%
34%
29%
9%
4%
3%
Client/customer interaction skills
Other interpersonal skills
Business skills
Skills in general
Sector knowledge/experience
Other non-technical skills
Higher level technical IT skills
Below the level required Equal to the level required Above the level required
56%
57%
77%
69%
68%
68%
71%
15%
2%
15%
21%
23%
25%
15%29%
28%
21%
17%
12%
9%
4%
General software skills/knowledge
Email/Internet skills
Database skills
Overall IT user skills
General hardware skills/knowledge
Word-processing skills
Spreadsheet skills
Below the level required Equal to the level required Above the level required
0
30%
20%
10%
40%
50%
60%
Q2.01 Q2.02 Q2.03 Q2.04 Q2.05 Q2.06 Q2.07 Q2.08 Q2.09
All ICT staff All workers
29%Staff are new to the job/company
5%Staff cannot reach required skill levels even with training
77%Staff unable to train due to work commitments
41%New projects/products/ services being launched
5%Budgets/ lack of funds
60%Company doesn’t train/train enough
8%Other
69%New systems/processes/equipment introduced
48%Technical IT/Telecoms (professional level)
23%Management (other)
21%Management (IT/Telecoms related)
21%Other (IT/Telecoms related)
17%Personal development training
16%General company
15%IT User skills
15%Generic employment training
11%Function specific training
6%Other (general)
4%Finance
0
4,000
6,000
5,000
1,000
3,000
2,000
2002 2003 2004 2005 2006 2007 2008Year
0
5000
10,000
15,000
20,000
25,000
30,000
35,000
2002 2003 2004 2005 2006 2007 2008
G Group Accepts: Mathematical & Computing Science Computing Accepts
0
200
400
600
800
1,000
1,200
1,400
2002 2003 2004 2005 2006 2007 2008
39%Staff are new to the job/company
14%Staff cannot reach required skill levels even with training
64%Staff unable to train due to work commitments
53%New projects/products/ services being launched
1%Budgets/ lack of funds
56%Company doesn’t train/train enough
15%Other
48%New systems/processes/equipment introduced
0% 10% 20% 30% 40% 50% 60% 70% 80% 90% 100%
UK
South West
South East
London
East of England
West Midlands
East Midlands
Yorkshire & Humber
North West
North East
England
Scotland
Northern Ireland
Wales
Agriculture forestry and fishing Distribution Hotels & Restaurants Other services
Energy & Water Transport & Communication NA / DNA
Manufacturing Banking & Finance
Construction Public administration, Education & Health
ICT Managers/IT Strategy & Planning Professionals
Software Professionals
201820092001
45,000
30,000
15,000
05,900
6,700
12,700
11,700
11,400
12,900
13,600
13,900
12,800
IT Operations Technicians/IT User Support Technicians/Database Assistants & Clerks/Telecoms Engineers/Line Repairers & Cable Jointers/Computer Engineers
Computing & Telecoms Graduatesin employment (490)
IT & Telecoms industry: new graduate recruits (300)
IT & Telecoms professionals: new graduate recruits (445)
Graduates of subjects other than Computing & Telecoms (300) are shown in RedEntrants to the IT & Telecoms Workforce (560) are shown in italics
230
140100
15 120
60
125
10% 12
%
12%
12%
13% 14%
14%
14% 15
%
15%
16%
16%
17%
17%
17%
0
5%
10%
15%
20%
25%
30%
Aus
tria
Por
tuga
l
Italy
Nor
way
Pol
and
Slo
veni
a
Cze
ch R
epub
lic
Spa
in
Net
herla
nds
Slo
vaki
a
Ger
man
y
Den
mar
k
Irela
nd UK
Sw
eden
18%
Finl
and
21%
Hun
gary
23%
Rom
ania
23%
Bul
garia
18%
Wal
es
95%
4% 1% 1%
29%
13%
21%
36%
All IT & Telecoms Professionals
£500
£410
Average across Wales
£450
Average across the UK
1,080
Q2.08
1,200
Q3.08
990
Q4.08
770
Q1.09
640
Q2.09
Number of applicants to G Mathematical & Comp Sci (Group) in Wales
0
10,000
5,000
15,000
20,000
25,000
30,000
35,000
2002 2003 2004 2005 2006 2007 2008 2009
Year
IT P
rofe
ssio
nal w
orkf
orce
0
1,000
2,000
3,000
4,000
5,000
6,000
App
lican
ts
Applicants to Mathematical and Computer Science courses
IT Professional workforce
Some other way 2%
Training course - not organised/paid forby an employer 18%
Self-study using books, CD-ROMs, etc 21%
Training course - organised/paid for byan employer 30%
Formalised educational institution(school/college/university) 34%
Informal assistance from colleagues,relatives, friends etc 54%
Self-study (learning by doing) 59%
2006/07 2007/08 2006/07 2007/08 2006/07 2007/08
Male Female
100%
75%
50%
25%
0%
ACL TOTALWBLFE
55%
45%
57%
43%
87%
13%
77%
23%
39%
61%
35%
65%
55%
45%
56%
44%
2006/07 2007/08 2006/07 2007/08 2006/07 2007/08 2006/07 2007/08
Male Female
0
600
400
200
800
1,000
1,200
1,400
1,600
2005 2006 2007 2008 2009
ICT Computing
EmergingTrends
Less than one in twenty Welsh firms recruiting IT & Telecoms staff report difficulty finding candidates with the required skills, qualifications or experience

© Copyright e-skills UK Sector Skills Council Ltd 2000-2009
28 Very low number of interviews - treat with caution
UK recruiters most often report difficulties sourcing good candidates for programming, tech support and IT & Telecoms management posts
46
6.3.1 Skills shortages
Less than one in twenty Welsh firms seeking to recruit IT & Telecoms professionals during the final quarter of 2008 stated that they were experiencing difficulties finding applicants with the rights skills, qualification or experience28 - a much lower proportion than that recorded across the UK as a whole (where around one in ten or 11% stated this to be the case).
Across the UK, the main roles for which applicants tended to be lacking skills/experience /qualifications were: programming, technical support and IT & Telecoms management, whilst recruiters appeared to have general issues with the levels of applicant’s business skills, higher level technical skills, sector knowledge/experience and skills in general.
Figure 15: Employer general views on the skills of applicants for IT & Telecoms positions, UK
Source: e-skills UK 2009 employer survey
Population (A)2,959,000
Workforce (B)1,248,000
Total IT & T industry
(C+D)18,600
IT & T professionals in IT & T industry
(C) 10,900 IT & T professionals in other sectors
(E) 25,500All other occupations in
the IT & T industry (D) 7,700
0.0
5.4South East England
London 5.4
3.6North West England
East of England 3.4
2.9West Midlands
Scotland 2.8
2.7Yorkshire & Humber
South West England 2.7
East Midlands 2.4
Wales 1.4
North East England 1.2
Northern Ireland 0.8
1.0 2.0 3.0 4.0 5.0 6.0
GVA (£bn)
Total IT & T workforce (C+D+E) 44,100
Total IT & T professionals (C+E) 36,400
0
25%
50%
75%
100%
1-10 11-49 50-199 200+
Workplaces Employees
0%
1%
2%
8%
8%
10%
13%
25%
33%
0 5% 10% 15% 20% 25% 35%30% 40%
Agriculture Forestry & Fishing
Energy & Water
Distribution, Hotels & Restaurants
Other services
Construction
Manufacturing
Public Administration, Education & Health
Banking & Finance
Transport & Communication
0
5,000
10,000
15,000
20,000
25,000
30,000
35,000
1992 1993 1994 1995 1996 1997 1998 1999 2000 2001 2002 2003 2004 2005 2006 2007 2008 2009
£600
£400
£200
£0
36%29%
24%30%
37%28% 27%
20%14%
35%39%
38% 23%16%
23%35%
35% 41%
24%
21%21%
29%34% 34%
31%
26%30%
12% 17% 18% 13% 14%6%
20%15%
0%
25%
50%
75%
100%
2001 2002 2003 2004 2005 2006 2007 2008 2009
16-29 30-39 40-49 50+
80%
70%
60%
50%
40%
30%
20%
10%
0%
ACLWBLFE
39%
61%
39%
61%56%
44%
57%
43%
28%
72%
28%
72%
FoundationTrends
1995 2000
Skill changes New skills
2005 2007 2010 2015 2020
Industrialisation of technology
Security and Data Protection
Communications convergence and integration
Innovation
Transformation through IT
The pool of talent and gender balance
Information and analytics
Consumerisation and convergence of IT
Green IT: environmental computing
Social Computing and Web 2.0
Digital Natives
Unemployment500
Retire160
Non IT&T Job Switcher
1,930
IT&T JobSwitcher
620
Look afterfamily
90
Become a student
220
Otherinactive
300
Job switcher fromIT & Telecomsoccupations
610
Entrants to IT & Telecoms occupations
3,520
Job switchers fromNon IT & Telecoms
occupations1,840
Unemployment580
Education660
Other Inactive440
NET change inemploymentOccupation
320
Gross JobOpportunities
4,130
ReplacementJobs3,810
Internet 2%
Database 4%
Networking 4%
Management 5%
SoftwareEngineering
7%
Technical/PC support
22%
Systems design/development
55%
47%
38%
44%
48%
82%
75%
71%
27%
22%
22%
9%
21%
26%
2%52%
35%
34%
29%
9%
4%
3%
Client/customer interaction skills
Other interpersonal skills
Business skills
Skills in general
Sector knowledge/experience
Other non-technical skills
Higher level technical IT skills
Below the level required Equal to the level required Above the level required
56%
57%
77%
69%
68%
68%
71%
15%
2%
15%
21%
23%
25%
15%29%
28%
21%
17%
12%
9%
4%
General software skills/knowledge
Email/Internet skills
Database skills
Overall IT user skills
General hardware skills/knowledge
Word-processing skills
Spreadsheet skills
Below the level required Equal to the level required Above the level required
0
30%
20%
10%
40%
50%
60%
Q2.01 Q2.02 Q2.03 Q2.04 Q2.05 Q2.06 Q2.07 Q2.08 Q2.09
All ICT staff All workers
29%Staff are new to the job/company
5%Staff cannot reach required skill levels even with training
77%Staff unable to train due to work commitments
41%New projects/products/ services being launched
5%Budgets/ lack of funds
60%Company doesn’t train/train enough
8%Other
69%New systems/processes/equipment introduced
48%Technical IT/Telecoms (professional level)
23%Management (other)
21%Management (IT/Telecoms related)
21%Other (IT/Telecoms related)
17%Personal development training
16%General company
15%IT User skills
15%Generic employment training
11%Function specific training
6%Other (general)
4%Finance
0
4,000
6,000
5,000
1,000
3,000
2,000
2002 2003 2004 2005 2006 2007 2008Year
0
5000
10,000
15,000
20,000
25,000
30,000
35,000
2002 2003 2004 2005 2006 2007 2008
G Group Accepts: Mathematical & Computing Science Computing Accepts
0
200
400
600
800
1,000
1,200
1,400
2002 2003 2004 2005 2006 2007 2008
39%Staff are new to the job/company
14%Staff cannot reach required skill levels even with training
64%Staff unable to train due to work commitments
53%New projects/products/ services being launched
1%Budgets/ lack of funds
56%Company doesn’t train/train enough
15%Other
48%New systems/processes/equipment introduced
0% 10% 20% 30% 40% 50% 60% 70% 80% 90% 100%
UK
South West
South East
London
East of England
West Midlands
East Midlands
Yorkshire & Humber
North West
North East
England
Scotland
Northern Ireland
Wales
Agriculture forestry and fishing Distribution Hotels & Restaurants Other services
Energy & Water Transport & Communication NA / DNA
Manufacturing Banking & Finance
Construction Public administration, Education & Health
ICT Managers/IT Strategy & Planning Professionals
Software Professionals
201820092001
45,000
30,000
15,000
05,900
6,700
12,700
11,700
11,400
12,900
13,600
13,900
12,800
IT Operations Technicians/IT User Support Technicians/Database Assistants & Clerks/Telecoms Engineers/Line Repairers & Cable Jointers/Computer Engineers
Computing & Telecoms Graduatesin employment (490)
IT & Telecoms industry: new graduate recruits (300)
IT & Telecoms professionals: new graduate recruits (445)
Graduates of subjects other than Computing & Telecoms (300) are shown in RedEntrants to the IT & Telecoms Workforce (560) are shown in italics
230
140100
15 120
60
125
10% 12
%
12%
12%
13% 14%
14%
14% 15
%
15%
16%
16%
17%
17%
17%
0
5%
10%
15%
20%
25%
30%
Aus
tria
Por
tuga
l
Italy
Nor
way
Pol
and
Slo
veni
a
Cze
ch R
epub
lic
Spa
in
Net
herla
nds
Slo
vaki
a
Ger
man
y
Den
mar
k
Irela
nd UK
Sw
eden
18%
Finl
and
21%
Hun
gary
23%
Rom
ania
23%
Bul
garia
18%
Wal
es
95%
4% 1% 1%
29%
13%
21%
36%
All IT & Telecoms Professionals
£500
£410
Average across Wales
£450
Average across the UK
1,080
Q2.08
1,200
Q3.08
990
Q4.08
770
Q1.09
640
Q2.09
Number of applicants to G Mathematical & Comp Sci (Group) in Wales
0
10,000
5,000
15,000
20,000
25,000
30,000
35,000
2002 2003 2004 2005 2006 2007 2008 2009
Year
IT P
rofe
ssio
nal w
orkf
orce
0
1,000
2,000
3,000
4,000
5,000
6,000
App
lican
ts
Applicants to Mathematical and Computer Science courses
IT Professional workforce
Some other way 2%
Training course - not organised/paid forby an employer 18%
Self-study using books, CD-ROMs, etc 21%
Training course - organised/paid for byan employer 30%
Formalised educational institution(school/college/university) 34%
Informal assistance from colleagues,relatives, friends etc 54%
Self-study (learning by doing) 59%
2006/07 2007/08 2006/07 2007/08 2006/07 2007/08
Male Female
100%
75%
50%
25%
0%
ACL TOTALWBLFE
55%
45%
57%
43%
87%
13%
77%
23%
39%
61%
35%
65%
55%
45%
56%
44%
2006/07 2007/08 2006/07 2007/08 2006/07 2007/08 2006/07 2007/08
Male Female
0
600
400
200
800
1,000
1,200
1,400
1,600
2005 2006 2007 2008 2009
ICT Computing
EmergingTrends
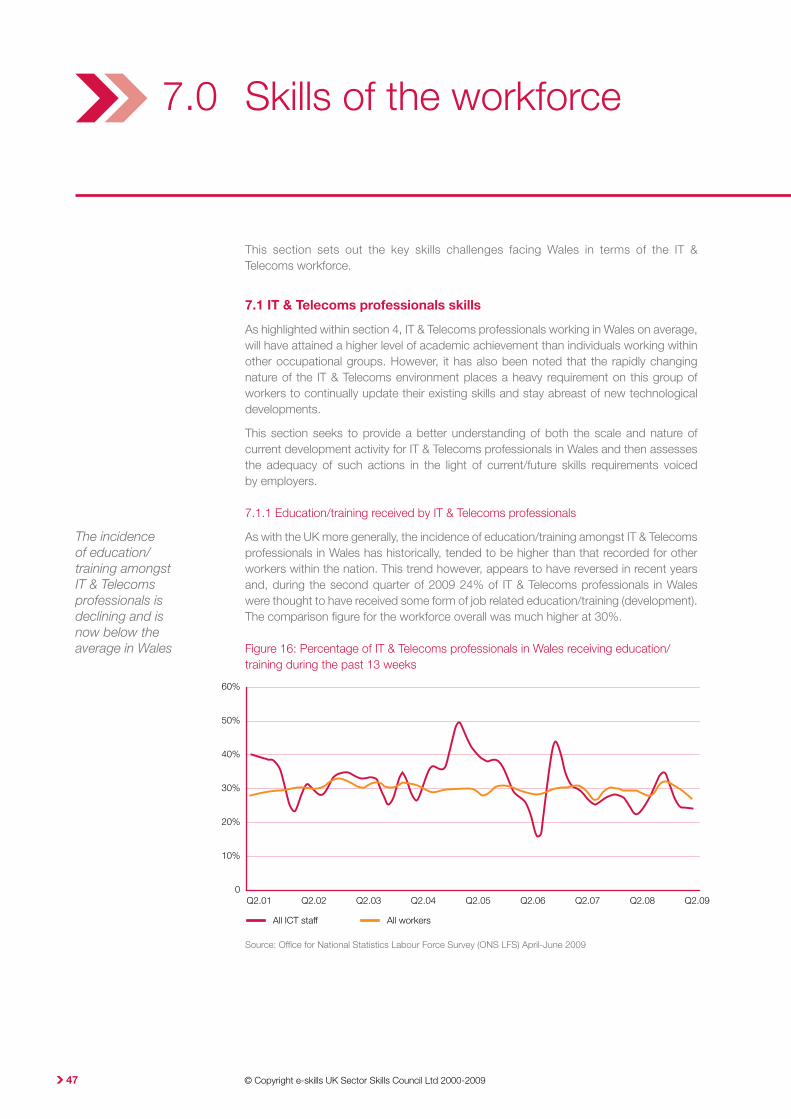
The incidence of education/ training amongst IT & Telecoms professionals is declining and is now below the average in Wales
© Copyright e-skills UK Sector Skills Council Ltd 2000-2009
7.0 Skills of the workforce
47
This section sets out the key skills challenges facing Wales in terms of the IT & Telecoms workforce.
7.1 IT & Telecoms professionals skills
As highlighted within section 4, IT & Telecoms professionals working in Wales on average, will have attained a higher level of academic achievement than individuals working within other occupational groups. However, it has also been noted that the rapidly changing nature of the IT & Telecoms environment places a heavy requirement on this group of workers to continually update their existing skills and stay abreast of new technological developments.
This section seeks to provide a better understanding of both the scale and nature of current development activity for IT & Telecoms professionals in Wales and then assesses the adequacy of such actions in the light of current/future skills requirements voiced by employers.
7.1.1 Education/training received by IT & Telecoms professionals
As with the UK more generally, the incidence of education/training amongst IT & Telecoms professionals in Wales has historically, tended to be higher than that recorded for other workers within the nation. This trend however, appears to have reversed in recent years and, during the second quarter of 2009 24% of IT & Telecoms professionals in Wales were thought to have received some form of job related education/training (development). The comparison figure for the workforce overall was much higher at 30%.
Figure 16: Percentage of IT & Telecoms professionals in Wales receiving education/training during the past 13 weeks
Source: Office for National Statistics Labour Force Survey (ONS LFS) April-June 2009
Population (A)2,959,000
Workforce (B)1,248,000
Total IT & T industry
(C+D)18,600
IT & T professionals in IT & T industry
(C) 10,900 IT & T professionals in other sectors
(E) 25,500All other occupations in
the IT & T industry (D) 7,700
0.0
5.4South East England
London 5.4
3.6North West England
East of England 3.4
2.9West Midlands
Scotland 2.8
2.7Yorkshire & Humber
South West England 2.7
East Midlands 2.4
Wales 1.4
North East England 1.2
Northern Ireland 0.8
1.0 2.0 3.0 4.0 5.0 6.0
GVA (£bn)
Total IT & T workforce (C+D+E) 44,100
Total IT & T professionals (C+E) 36,400
0
25%
50%
75%
100%
1-10 11-49 50-199 200+
Workplaces Employees
0%
1%
2%
8%
8%
10%
13%
25%
33%
0 5% 10% 15% 20% 25% 35%30% 40%
Agriculture Forestry & Fishing
Energy & Water
Distribution, Hotels & Restaurants
Other services
Construction
Manufacturing
Public Administration, Education & Health
Banking & Finance
Transport & Communication
0
5,000
10,000
15,000
20,000
25,000
30,000
35,000
1992 1993 1994 1995 1996 1997 1998 1999 2000 2001 2002 2003 2004 2005 2006 2007 2008 2009
£600
£400
£200
£0
36%29%
24%30%
37%28% 27%
20%14%
35%39%
38% 23%16%
23%35%
35% 41%
24%
21%21%
29%34% 34%
31%
26%30%
12% 17% 18% 13% 14%6%
20%15%
0%
25%
50%
75%
100%
2001 2002 2003 2004 2005 2006 2007 2008 2009
16-29 30-39 40-49 50+
80%
70%
60%
50%
40%
30%
20%
10%
0%
ACLWBLFE
39%
61%
39%
61%56%
44%
57%
43%
28%
72%
28%
72%
FoundationTrends
1995 2000
Skill changes New skills
2005 2007 2010 2015 2020
Industrialisation of technology
Security and Data Protection
Communications convergence and integration
Innovation
Transformation through IT
The pool of talent and gender balance
Information and analytics
Consumerisation and convergence of IT
Green IT: environmental computing
Social Computing and Web 2.0
Digital Natives
Unemployment500
Retire160
Non IT&T Job Switcher
1,930
IT&T JobSwitcher
620
Look afterfamily
90
Become a student
220
Otherinactive
300
Job switcher fromIT & Telecomsoccupations
610
Entrants to IT & Telecoms occupations
3,520
Job switchers fromNon IT & Telecoms
occupations1,840
Unemployment580
Education660
Other Inactive440
NET change inemploymentOccupation
320
Gross JobOpportunities
4,130
ReplacementJobs3,810
Internet 2%
Database 4%
Networking 4%
Management 5%
SoftwareEngineering
7%
Technical/PC support
22%
Systems design/development
55%
47%
38%
44%
48%
82%
75%
71%
27%
22%
22%
9%
21%
26%
2%52%
35%
34%
29%
9%
4%
3%
Client/customer interaction skills
Other interpersonal skills
Business skills
Skills in general
Sector knowledge/experience
Other non-technical skills
Higher level technical IT skills
Below the level required Equal to the level required Above the level required
56%
57%
77%
69%
68%
68%
71%
15%
2%
15%
21%
23%
25%
15%29%
28%
21%
17%
12%
9%
4%
General software skills/knowledge
Email/Internet skills
Database skills
Overall IT user skills
General hardware skills/knowledge
Word-processing skills
Spreadsheet skills
Below the level required Equal to the level required Above the level required
0
30%
20%
10%
40%
50%
60%
Q2.01 Q2.02 Q2.03 Q2.04 Q2.05 Q2.06 Q2.07 Q2.08 Q2.09
All ICT staff All workers
29%Staff are new to the job/company
5%Staff cannot reach required skill levels even with training
77%Staff unable to train due to work commitments
41%New projects/products/ services being launched
5%Budgets/ lack of funds
60%Company doesn’t train/train enough
8%Other
69%New systems/processes/equipment introduced
48%Technical IT/Telecoms (professional level)
23%Management (other)
21%Management (IT/Telecoms related)
21%Other (IT/Telecoms related)
17%Personal development training
16%General company
15%IT User skills
15%Generic employment training
11%Function specific training
6%Other (general)
4%Finance
0
4,000
6,000
5,000
1,000
3,000
2,000
2002 2003 2004 2005 2006 2007 2008Year
0
5000
10,000
15,000
20,000
25,000
30,000
35,000
2002 2003 2004 2005 2006 2007 2008
G Group Accepts: Mathematical & Computing Science Computing Accepts
0
200
400
600
800
1,000
1,200
1,400
2002 2003 2004 2005 2006 2007 2008
39%Staff are new to the job/company
14%Staff cannot reach required skill levels even with training
64%Staff unable to train due to work commitments
53%New projects/products/ services being launched
1%Budgets/ lack of funds
56%Company doesn’t train/train enough
15%Other
48%New systems/processes/equipment introduced
0% 10% 20% 30% 40% 50% 60% 70% 80% 90% 100%
UK
South West
South East
London
East of England
West Midlands
East Midlands
Yorkshire & Humber
North West
North East
England
Scotland
Northern Ireland
Wales
Agriculture forestry and fishing Distribution Hotels & Restaurants Other services
Energy & Water Transport & Communication NA / DNA
Manufacturing Banking & Finance
Construction Public administration, Education & Health
ICT Managers/IT Strategy & Planning Professionals
Software Professionals
201820092001
45,000
30,000
15,000
05,900
6,700
12,700
11,700
11,400
12,900
13,600
13,900
12,800
IT Operations Technicians/IT User Support Technicians/Database Assistants & Clerks/Telecoms Engineers/Line Repairers & Cable Jointers/Computer Engineers
Computing & Telecoms Graduatesin employment (490)
IT & Telecoms industry: new graduate recruits (300)
IT & Telecoms professionals: new graduate recruits (445)
Graduates of subjects other than Computing & Telecoms (300) are shown in RedEntrants to the IT & Telecoms Workforce (560) are shown in italics
230
140100
15 120
60
125
10% 12
%
12%
12%
13% 14%
14%
14% 15
%
15%
16%
16%
17%
17%
17%
0
5%
10%
15%
20%
25%
30%
Aus
tria
Por
tuga
l
Italy
Nor
way
Pol
and
Slo
veni
a
Cze
ch R
epub
lic
Spa
in
Net
herla
nds
Slo
vaki
a
Ger
man
y
Den
mar
k
Irela
nd UK
Sw
eden
18%
Finl
and
21%
Hun
gary
23%
Rom
ania
23%
Bul
garia
18%
Wal
es
95%
4% 1% 1%
29%
13%
21%
36%
All IT & Telecoms Professionals
£500
£410
Average across Wales
£450
Average across the UK
1,080
Q2.08
1,200
Q3.08
990
Q4.08
770
Q1.09
640
Q2.09
Number of applicants to G Mathematical & Comp Sci (Group) in Wales
0
10,000
5,000
15,000
20,000
25,000
30,000
35,000
2002 2003 2004 2005 2006 2007 2008 2009
Year
IT P
rofe
ssio
nal w
orkf
orce
0
1,000
2,000
3,000
4,000
5,000
6,000
App
lican
ts
Applicants to Mathematical and Computer Science courses
IT Professional workforce
Some other way 2%
Training course - not organised/paid forby an employer 18%
Self-study using books, CD-ROMs, etc 21%
Training course - organised/paid for byan employer 30%
Formalised educational institution(school/college/university) 34%
Informal assistance from colleagues,relatives, friends etc 54%
Self-study (learning by doing) 59%
2006/07 2007/08 2006/07 2007/08 2006/07 2007/08
Male Female
100%
75%
50%
25%
0%
ACL TOTALWBLFE
55%
45%
57%
43%
87%
13%
77%
23%
39%
61%
35%
65%
55%
45%
56%
44%
2006/07 2007/08 2006/07 2007/08 2006/07 2007/08 2006/07 2007/08
Male Female
0
600
400
200
800
1,000
1,200
1,400
1,600
2005 2006 2007 2008 2009
ICT Computing
EmergingTrends

© Copyright e-skills UK Sector Skills Council Ltd 2000-2009
29 Four quarter moving average
IT & Telecoms professionals in Wales are more likely to have been offered education / training by their employers than those working elsewhere in the UK
48
The likelihood of IT & Telecoms professionals in Wales receiving education/training appears to be slightly higher than for the UK/England (where 23% are thought to receive education/training each quarter) and slightly lower than in Scotland (25%) and Northern Ireland (28%)29.
Further details of education/training activity undertaken by IT & Telecoms professionals in Wales are unavailable though as an indicator for the UK as a whole, education/training activity for IT & Telecoms professionals appears broadly consistent by size of firm though those working in the IT & Telecoms sector are notably less likely to have received education/training than those working in other industries.
Generally by role there was, little difference in the incidence of IT & Telecoms professionals receiving education/training (in the UK) though IT User Support Professionals were notably more likely than others to have received education/training whilst the reverse was found to be the case for those working as Database Assistants.
7.1.2 Education/training offered
As with the UK, whilst the incidence of IT & Telecoms professionals receiving education/training in Wales is below the average for all occupational groups, the percentage that have been offered development opportunities (i.e. irrespective of whether they had been taken up or not) is actually much higher than for Welsh workers as a whole (with comparison figures of 83% and 69% respectively) and also above that for IT & Telecoms staff working anywhere else in the UK.
Table 12: Education/training activity for IT & Telecoms professionals within the UK nations
Education/training received Education/training offered
UK 23% 75%
England 23% 74%
Scotland 25% 77%
Wales 24% 83%
Northern Ireland 28% 72%
Source: Office for National Statistics Labour Force Survey (ONS LFS) April-June 2009

Almost one half of Welsh employers had a formal and regular process for identifying and addressing the development needs of their IT & Telecoms professionals
© Copyright e-skills UK Sector Skills Council Ltd 2000-2009 49
7.1.3 Nature of education/training received
More detailed information regarding the education/training received by IT & Telecoms professionals working in Wales is unavailable. However, some indication of likely characteristics of delivery can again be obtained by examining data available for the UK as a whole i.e.
• Whereeducation/trainingisreceivedbyIT&Telecomsprofessionalsitismorelikelytohave been delivered ‘on the job’, whilst off-the-job education/training is, in any case, most often delivered on the employer’s premises.
• Aside from the workplace, the other most common locations for education/trainingdelivery are educational establishments, home/distance learning and private training centres.
• IT & Telecoms professionals are much more likely to receive education/training intechnical IT as opposed to other disciplines, though management development appears to be another common area for development activity.
Figure 17: Nature of education/training activity undertaken by IT & Telecoms professionals (UK)
Source: Office for National Statistics Labour Force Survey (ONS LFS) April-June 2009
7.1.4 Identification of development needs
Compared with employers from other UK nations, those based in Wales generally appear to have a more structured approach to identifying and addressing the (technical and non-technical) training/development needs of IT & Telecoms professionals - whilst, on average less than one third of UK employers stated that they had a formal and regular process for identifying and addressing the development needs of their IT & Telecoms professionals. Around one half of Welsh employers stated this to be the case (i.e. 44% when considering technical skills development and 68% when considering their generic development needs).
Population (A)2,959,000
Workforce (B)1,248,000
Total IT & T industry
(C+D)18,600
IT & T professionals in IT & T industry
(C) 10,900 IT & T professionals in other sectors
(E) 25,500All other occupations in
the IT & T industry (D) 7,700
0.0
5.4South East England
London 5.4
3.6North West England
East of England 3.4
2.9West Midlands
Scotland 2.8
2.7Yorkshire & Humber
South West England 2.7
East Midlands 2.4
Wales 1.4
North East England 1.2
Northern Ireland 0.8
1.0 2.0 3.0 4.0 5.0 6.0
GVA (£bn)
Total IT & T workforce (C+D+E) 44,100
Total IT & T professionals (C+E) 36,400
0
25%
50%
75%
100%
1-10 11-49 50-199 200+
Workplaces Employees
0%
1%
2%
8%
8%
10%
13%
25%
33%
0 5% 10% 15% 20% 25% 35%30% 40%
Agriculture Forestry & Fishing
Energy & Water
Distribution, Hotels & Restaurants
Other services
Construction
Manufacturing
Public Administration, Education & Health
Banking & Finance
Transport & Communication
0
5,000
10,000
15,000
20,000
25,000
30,000
35,000
1992 1993 1994 1995 1996 1997 1998 1999 2000 2001 2002 2003 2004 2005 2006 2007 2008 2009
£600
£400
£200
£0
36%29%
24%30%
37%28% 27%
20%14%
35%39%
38% 23%16%
23%35%
35% 41%
24%
21%21%
29%34% 34%
31%
26%30%
12% 17% 18% 13% 14%6%
20%15%
0%
25%
50%
75%
100%
2001 2002 2003 2004 2005 2006 2007 2008 2009
16-29 30-39 40-49 50+
80%
70%
60%
50%
40%
30%
20%
10%
0%
ACLWBLFE
39%
61%
39%
61%56%
44%
57%
43%
28%
72%
28%
72%
FoundationTrends
1995 2000
Skill changes New skills
2005 2007 2010 2015 2020
Industrialisation of technology
Security and Data Protection
Communications convergence and integration
Innovation
Transformation through IT
The pool of talent and gender balance
Information and analytics
Consumerisation and convergence of IT
Green IT: environmental computing
Social Computing and Web 2.0
Digital Natives
Unemployment500
Retire160
Non IT&T Job Switcher
1,930
IT&T JobSwitcher
620
Look afterfamily
90
Become a student
220
Otherinactive
300
Job switcher fromIT & Telecomsoccupations
610
Entrants to IT & Telecoms occupations
3,520
Job switchers fromNon IT & Telecoms
occupations1,840
Unemployment580
Education660
Other Inactive440
NET change inemploymentOccupation
320
Gross JobOpportunities
4,130
ReplacementJobs3,810
Internet 2%
Database 4%
Networking 4%
Management 5%
SoftwareEngineering
7%
Technical/PC support
22%
Systems design/development
55%
47%
38%
44%
48%
82%
75%
71%
27%
22%
22%
9%
21%
26%
2%52%
35%
34%
29%
9%
4%
3%
Client/customer interaction skills
Other interpersonal skills
Business skills
Skills in general
Sector knowledge/experience
Other non-technical skills
Higher level technical IT skills
Below the level required Equal to the level required Above the level required
56%
57%
77%
69%
68%
68%
71%
15%
2%
15%
21%
23%
25%
15%29%
28%
21%
17%
12%
9%
4%
General software skills/knowledge
Email/Internet skills
Database skills
Overall IT user skills
General hardware skills/knowledge
Word-processing skills
Spreadsheet skills
Below the level required Equal to the level required Above the level required
0
30%
20%
10%
40%
50%
60%
Q2.01 Q2.02 Q2.03 Q2.04 Q2.05 Q2.06 Q2.07 Q2.08 Q2.09
All ICT staff All workers
29%Staff are new to the job/company
5%Staff cannot reach required skill levels even with training
77%Staff unable to train due to work commitments
41%New projects/products/ services being launched
5%Budgets/ lack of funds
60%Company doesn’t train/train enough
8%Other
69%New systems/processes/equipment introduced
48%Technical IT/Telecoms (professional level)
23%Management (other)
21%Management (IT/Telecoms related)
21%Other (IT/Telecoms related)
17%Personal development training
16%General company
15%IT User skills
15%Generic employment training
11%Function specific training
6%Other (general)
4%Finance
0
4,000
6,000
5,000
1,000
3,000
2,000
2002 2003 2004 2005 2006 2007 2008Year
0
5000
10,000
15,000
20,000
25,000
30,000
35,000
2002 2003 2004 2005 2006 2007 2008
G Group Accepts: Mathematical & Computing Science Computing Accepts
0
200
400
600
800
1,000
1,200
1,400
2002 2003 2004 2005 2006 2007 2008
39%Staff are new to the job/company
14%Staff cannot reach required skill levels even with training
64%Staff unable to train due to work commitments
53%New projects/products/ services being launched
1%Budgets/ lack of funds
56%Company doesn’t train/train enough
15%Other
48%New systems/processes/equipment introduced
0% 10% 20% 30% 40% 50% 60% 70% 80% 90% 100%
UK
South West
South East
London
East of England
West Midlands
East Midlands
Yorkshire & Humber
North West
North East
England
Scotland
Northern Ireland
Wales
Agriculture forestry and fishing Distribution Hotels & Restaurants Other services
Energy & Water Transport & Communication NA / DNA
Manufacturing Banking & Finance
Construction Public administration, Education & Health
ICT Managers/IT Strategy & Planning Professionals
Software Professionals
201820092001
45,000
30,000
15,000
05,900
6,700
12,700
11,700
11,400
12,900
13,600
13,900
12,800
IT Operations Technicians/IT User Support Technicians/Database Assistants & Clerks/Telecoms Engineers/Line Repairers & Cable Jointers/Computer Engineers
Computing & Telecoms Graduatesin employment (490)
IT & Telecoms industry: new graduate recruits (300)
IT & Telecoms professionals: new graduate recruits (445)
Graduates of subjects other than Computing & Telecoms (300) are shown in RedEntrants to the IT & Telecoms Workforce (560) are shown in italics
230
140100
15 120
60
125
10% 12
%
12%
12%
13% 14%
14%
14% 15
%
15%
16%
16%
17%
17%
17%
0
5%
10%
15%
20%
25%
30%
Aus
tria
Por
tuga
l
Italy
Nor
way
Pol
and
Slo
veni
a
Cze
ch R
epub
lic
Spa
in
Net
herla
nds
Slo
vaki
a
Ger
man
y
Den
mar
k
Irela
nd UK
Sw
eden
18%
Finl
and
21%
Hun
gary
23%
Rom
ania
23%
Bul
garia
18%
Wal
es
95%
4% 1% 1%
29%
13%
21%
36%
All IT & Telecoms Professionals
£500
£410
Average across Wales
£450
Average across the UK
1,080
Q2.08
1,200
Q3.08
990
Q4.08
770
Q1.09
640
Q2.09
Number of applicants to G Mathematical & Comp Sci (Group) in Wales
0
10,000
5,000
15,000
20,000
25,000
30,000
35,000
2002 2003 2004 2005 2006 2007 2008 2009
Year
IT P
rofe
ssio
nal w
orkf
orce
0
1,000
2,000
3,000
4,000
5,000
6,000
App
lican
ts
Applicants to Mathematical and Computer Science courses
IT Professional workforce
Some other way 2%
Training course - not organised/paid forby an employer 18%
Self-study using books, CD-ROMs, etc 21%
Training course - organised/paid for byan employer 30%
Formalised educational institution(school/college/university) 34%
Informal assistance from colleagues,relatives, friends etc 54%
Self-study (learning by doing) 59%
2006/07 2007/08 2006/07 2007/08 2006/07 2007/08
Male Female
100%
75%
50%
25%
0%
ACL TOTALWBLFE
55%
45%
57%
43%
87%
13%
77%
23%
39%
61%
35%
65%
55%
45%
56%
44%
2006/07 2007/08 2006/07 2007/08 2006/07 2007/08 2006/07 2007/08
Male Female
0
600
400
200
800
1,000
1,200
1,400
1,600
2005 2006 2007 2008 2009
ICT Computing
EmergingTrends

One in ten firms with IT & Telecoms professionals report gaps in the skills of these staff
Skills gaps amongst IT & Telecoms professionals working in the UK are most likely due to an inability to fit training in around other work commitments
© Copyright e-skills UK Sector Skills Council Ltd 2000-2009
30 e-skills UK 2009 employer survey
50
7.1.5 Skills gaps amongst IT & Telecoms professionals30
The incidence of firms reporting skills gaps amongst their IT & Telecoms professionals at the beginning of the year was slightly lower in Wales than it was for other UK nations and amongst those firms contacted during the e-skills UK 2009 employer survey, one in ten of those based in Wales stated that they were experiencing gaps of this nature compared with 11% for the UK overall.
Detailed data for Wales is not available due to the size of the sample however, across the UK skills gaps were more often thought to exist in the areas of business and technical skills, whilst gaps in sector knowledge/experience, client/customer interaction skills or other non-technical/interpersonal skills were also commonly mentioned.
Figure 18: Company views on the reasons for the existence of IT & Telecoms professional skills gaps (UK)
Population (A)2,959,000
Workforce (B)1,248,000
Total IT & T industry
(C+D)18,600
IT & T professionals in IT & T industry
(C) 10,900 IT & T professionals in other sectors
(E) 25,500All other occupations in
the IT & T industry (D) 7,700
0.0
5.4South East England
London 5.4
3.6North West England
East of England 3.4
2.9West Midlands
Scotland 2.8
2.7Yorkshire & Humber
South West England 2.7
East Midlands 2.4
Wales 1.4
North East England 1.2
Northern Ireland 0.8
1.0 2.0 3.0 4.0 5.0 6.0
GVA (£bn)
Total IT & T workforce (C+D+E) 44,100
Total IT & T professionals (C+E) 36,400
0
25%
50%
75%
100%
1-10 11-49 50-199 200+
Workplaces Employees
0%
1%
2%
8%
8%
10%
13%
25%
33%
0 5% 10% 15% 20% 25% 35%30% 40%
Agriculture Forestry & Fishing
Energy & Water
Distribution, Hotels & Restaurants
Other services
Construction
Manufacturing
Public Administration, Education & Health
Banking & Finance
Transport & Communication
0
5,000
10,000
15,000
20,000
25,000
30,000
35,000
1992 1993 1994 1995 1996 1997 1998 1999 2000 2001 2002 2003 2004 2005 2006 2007 2008 2009
£600
£400
£200
£0
36%29%
24%30%
37%28% 27%
20%14%
35%39%
38% 23%16%
23%35%
35% 41%
24%
21%21%
29%34% 34%
31%
26%30%
12% 17% 18% 13% 14%6%
20%15%
0%
25%
50%
75%
100%
2001 2002 2003 2004 2005 2006 2007 2008 2009
16-29 30-39 40-49 50+
80%
70%
60%
50%
40%
30%
20%
10%
0%
ACLWBLFE
39%
61%
39%
61%56%
44%
57%
43%
28%
72%
28%
72%
FoundationTrends
1995 2000
Skill changes New skills
2005 2007 2010 2015 2020
Industrialisation of technology
Security and Data Protection
Communications convergence and integration
Innovation
Transformation through IT
The pool of talent and gender balance
Information and analytics
Consumerisation and convergence of IT
Green IT: environmental computing
Social Computing and Web 2.0
Digital Natives
Unemployment500
Retire160
Non IT&T Job Switcher
1,930
IT&T JobSwitcher
620
Look afterfamily
90
Become a student
220
Otherinactive
300
Job switcher fromIT & Telecomsoccupations
610
Entrants to IT & Telecoms occupations
3,520
Job switchers fromNon IT & Telecoms
occupations1,840
Unemployment580
Education660
Other Inactive440
NET change inemploymentOccupation
320
Gross JobOpportunities
4,130
ReplacementJobs3,810
Internet 2%
Database 4%
Networking 4%
Management 5%
SoftwareEngineering
7%
Technical/PC support
22%
Systems design/development
55%
47%
38%
44%
48%
82%
75%
71%
27%
22%
22%
9%
21%
26%
2%52%
35%
34%
29%
9%
4%
3%
Client/customer interaction skills
Other interpersonal skills
Business skills
Skills in general
Sector knowledge/experience
Other non-technical skills
Higher level technical IT skills
Below the level required Equal to the level required Above the level required
56%
57%
77%
69%
68%
68%
71%
15%
2%
15%
21%
23%
25%
15%29%
28%
21%
17%
12%
9%
4%
General software skills/knowledge
Email/Internet skills
Database skills
Overall IT user skills
General hardware skills/knowledge
Word-processing skills
Spreadsheet skills
Below the level required Equal to the level required Above the level required
0
30%
20%
10%
40%
50%
60%
Q2.01 Q2.02 Q2.03 Q2.04 Q2.05 Q2.06 Q2.07 Q2.08 Q2.09
All ICT staff All workers
29%Staff are new to the job/company
5%Staff cannot reach required skill levels even with training
77%Staff unable to train due to work commitments
41%New projects/products/ services being launched
5%Budgets/ lack of funds
60%Company doesn’t train/train enough
8%Other
69%New systems/processes/equipment introduced
48%Technical IT/Telecoms (professional level)
23%Management (other)
21%Management (IT/Telecoms related)
21%Other (IT/Telecoms related)
17%Personal development training
16%General company
15%IT User skills
15%Generic employment training
11%Function specific training
6%Other (general)
4%Finance
0
4,000
6,000
5,000
1,000
3,000
2,000
2002 2003 2004 2005 2006 2007 2008Year
0
5000
10,000
15,000
20,000
25,000
30,000
35,000
2002 2003 2004 2005 2006 2007 2008
G Group Accepts: Mathematical & Computing Science Computing Accepts
0
200
400
600
800
1,000
1,200
1,400
2002 2003 2004 2005 2006 2007 2008
39%Staff are new to the job/company
14%Staff cannot reach required skill levels even with training
64%Staff unable to train due to work commitments
53%New projects/products/ services being launched
1%Budgets/ lack of funds
56%Company doesn’t train/train enough
15%Other
48%New systems/processes/equipment introduced
0% 10% 20% 30% 40% 50% 60% 70% 80% 90% 100%
UK
South West
South East
London
East of England
West Midlands
East Midlands
Yorkshire & Humber
North West
North East
England
Scotland
Northern Ireland
Wales
Agriculture forestry and fishing Distribution Hotels & Restaurants Other services
Energy & Water Transport & Communication NA / DNA
Manufacturing Banking & Finance
Construction Public administration, Education & Health
ICT Managers/IT Strategy & Planning Professionals
Software Professionals
201820092001
45,000
30,000
15,000
05,900
6,700
12,700
11,700
11,400
12,900
13,600
13,900
12,800
IT Operations Technicians/IT User Support Technicians/Database Assistants & Clerks/Telecoms Engineers/Line Repairers & Cable Jointers/Computer Engineers
Computing & Telecoms Graduatesin employment (490)
IT & Telecoms industry: new graduate recruits (300)
IT & Telecoms professionals: new graduate recruits (445)
Graduates of subjects other than Computing & Telecoms (300) are shown in RedEntrants to the IT & Telecoms Workforce (560) are shown in italics
230
140100
15 120
60
125
10% 12
%
12%
12%
13% 14%
14%
14% 15
%
15%
16%
16%
17%
17%
17%
0
5%
10%
15%
20%
25%
30%
Aus
tria
Por
tuga
l
Italy
Nor
way
Pol
and
Slo
veni
a
Cze
ch R
epub
lic
Spa
in
Net
herla
nds
Slo
vaki
a
Ger
man
y
Den
mar
k
Irela
nd UK
Sw
eden
18%
Finl
and
21%
Hun
gary
23%
Rom
ania
23%
Bul
garia
18%
Wal
es
95%
4% 1% 1%
29%
13%
21%
36%
All IT & Telecoms Professionals
£500
£410
Average across Wales
£450
Average across the UK
1,080
Q2.08
1,200
Q3.08
990
Q4.08
770
Q1.09
640
Q2.09
Number of applicants to G Mathematical & Comp Sci (Group) in Wales
0
10,000
5,000
15,000
20,000
25,000
30,000
35,000
2002 2003 2004 2005 2006 2007 2008 2009
Year
IT P
rofe
ssio
nal w
orkf
orce
0
1,000
2,000
3,000
4,000
5,000
6,000
App
lican
ts
Applicants to Mathematical and Computer Science courses
IT Professional workforce
Some other way 2%
Training course - not organised/paid forby an employer 18%
Self-study using books, CD-ROMs, etc 21%
Training course - organised/paid for byan employer 30%
Formalised educational institution(school/college/university) 34%
Informal assistance from colleagues,relatives, friends etc 54%
Self-study (learning by doing) 59%
2006/07 2007/08 2006/07 2007/08 2006/07 2007/08
Male Female
100%
75%
50%
25%
0%
ACL TOTALWBLFE
55%
45%
57%
43%
87%
13%
77%
23%
39%
61%
35%
65%
55%
45%
56%
44%
2006/07 2007/08 2006/07 2007/08 2006/07 2007/08 2006/07 2007/08
Male Female
0
600
400
200
800
1,000
1,200
1,400
1,600
2005 2006 2007 2008 2009
ICT Computing
EmergingTrends
Source: e-skills UK 2009 employer survey
The most common reason for the existence of skills gaps amongst IT & Telecoms professionals cited by UK employers at the start of the year was that staff are unable to train due to work commitments though interestingly, many stated that the company didn’t train or didn’t train enough.

Approximately 286,000 development units need to be delivered if the skills of IT & Telecoms professionals in Wales are to match those needed by their employers
© Copyright e-skills UK Sector Skills Council Ltd 2000-2009 51
7.1.6 The current upskilling requirement for IT & Telecoms professionals
To provide a more detailed understanding of the nature and extent of skills gaps (amongst IT & Telecoms professionals) and to highlight additional areas where upskilling may give additional benefits to the firm, respondents to the e-skills UK 2009 employer survey were asked to rate the level of skills currently held by these staff together with the level thought needed by them to undertake the work that they do (this assessment based around the e-skills procom31 model). The difference in the two ratings was then multiplied by the number of IT & Telecoms professionals employed in Wales to provide an estimate of the overall number of development units32 required to bring the skills of IT & Telecoms professionals in line with that required by their employers.
Table 13: Current upskilling requirements of the IT & Telecoms workforce in Wales, by broad competency level33
Source: e-skills UK 2009 employer survey
Note: For details of e-skills procom see Annex D
As illustrated in the table above, the results of this analysis show an estimated 286,000 units of training would be required to fully upskill the IT & Telecoms professional workforce in Wales bringing the level of skills held into line with that required by employers. For most of the broad competency areas shown, the required ‘upskilling’ activity would be needed at Lead professional/Principal level whilst Leadership skills development in particular would be needed mainly at the higher of these two.
31 See Annex D32 One training development unit equates to a movement of one level in one sub-skills group of the e-skills
procom framework33 Data presented is based on UK findings pro-ratered amongst the four nations according to the respective IT &
Telecoms workforce
Associate Professional Senior Professional
Lead Professional
Principal Total development
units
Architecture, Analysis and Design
1% 1% 43% 48% 6% 22,000
Business Process and Change Management
1% 24% 59% 15% 17,000
Information Management/Security
1% 4% 73% 21% 17,000
Personal 14% 2% 58% 26% 42,000
Business 3% 10% 35% 9% 43% 11,000
Leadership 1% 2% 1% 36% 60% 46,000
Programme, Project and Supplier Management
2% 10% 66% 21% 57,000
Service Management and Delivery
9% 40% 30% 21% 53,000
Solution Development and Implementation
15% 21% 25% 22% 17% 21,000
All competence areas 2% 7% 18% 46% 27% 286,000
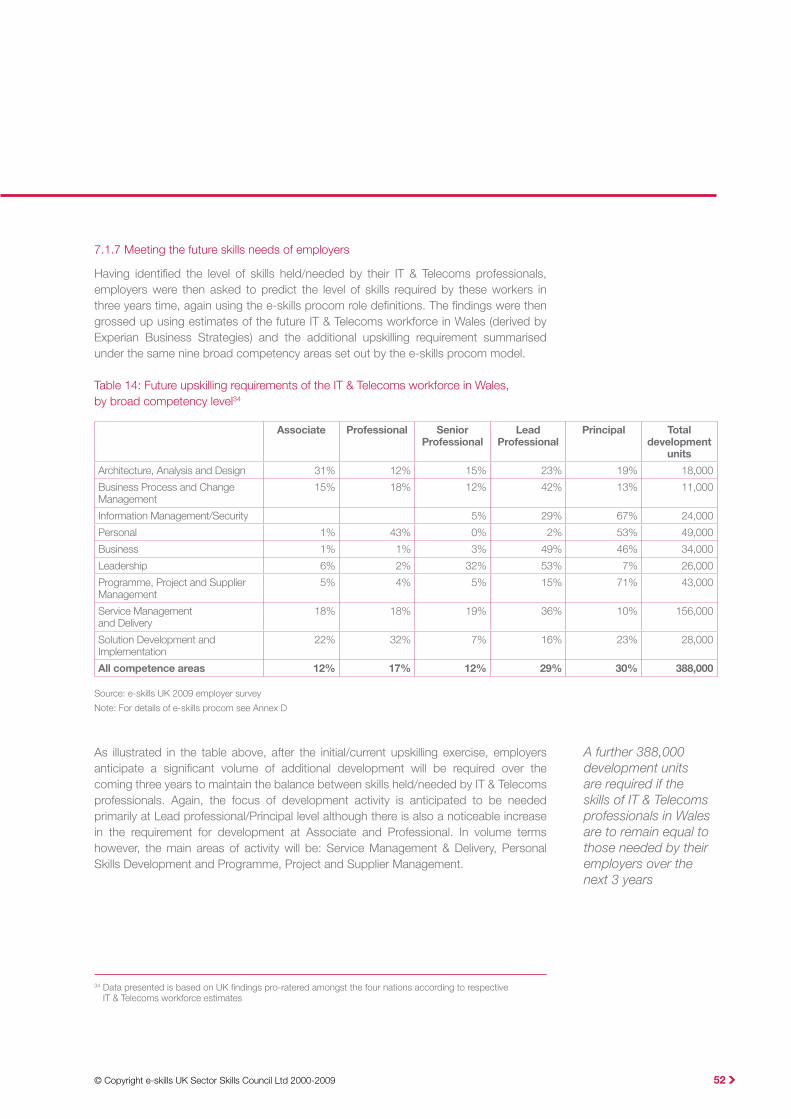
© Copyright e-skills UK Sector Skills Council Ltd 2000-2009
34 Data presented is based on UK findings pro-ratered amongst the four nations according to respective IT & Telecoms workforce estimates
A further 388,000 development units are required if the skills of IT & Telecoms professionals in Wales are to remain equal to those needed by their employers over the next 3 years
52
7.1.7 Meeting the future skills needs of employers
Having identified the level of skills held/needed by their IT & Telecoms professionals, employers were then asked to predict the level of skills required by these workers in three years time, again using the e-skills procom role definitions. The findings were then grossed up using estimates of the future IT & Telecoms workforce in Wales (derived by Experian Business Strategies) and the additional upskilling requirement summarised under the same nine broad competency areas set out by the e-skills procom model.
Table 14: Future upskilling requirements of the IT & Telecoms workforce in Wales, by broad competency level34
Associate Professional Senior Professional
Lead Professional
Principal Total development
units
Architecture, Analysis and Design 31% 12% 15% 23% 19% 18,000
Business Process and Change Management
15% 18% 12% 42% 13% 11,000
Information Management/Security 5% 29% 67% 24,000
Personal 1% 43% 0% 2% 53% 49,000
Business 1% 1% 3% 49% 46% 34,000
Leadership 6% 2% 32% 53% 7% 26,000
Programme, Project and Supplier Management
5% 4% 5% 15% 71% 43,000
Service Management and Delivery
18% 18% 19% 36% 10% 156,000
Solution Development and Implementation
22% 32% 7% 16% 23% 28,000
All competence areas 12% 17% 12% 29% 30% 388,000
Source: e-skills UK 2009 employer survey
Note: For details of e-skills procom see Annex D
As illustrated in the table above, after the initial/current upskilling exercise, employers anticipate a significant volume of additional development will be required over the coming three years to maintain the balance between skills held/needed by IT & Telecoms professionals. Again, the focus of development activity is anticipated to be needed primarily at Lead professional/Principal level although there is also a noticeable increase in the requirement for development at Associate and Professional. In volume terms however, the main areas of activity will be: Service Management & Delivery, Personal Skills Development and Programme, Project and Supplier Management.
© Copyright e-skills UK Sector Skills Council Ltd 2000-2009
8.0 Students and education
53
This section considers key challenges in terms of the talent pipeline into IT & Telecoms. It focuses on volumes of students in the education system undertaking technology-related education and the extent to which they are able to develop competencies relevant to future employment in the IT & Telecoms sector in Wales.
8.1 Higher Education
8.1.1 Context
Higher Education statistics used in this document are based on sources including the Higher Education Statistics Agency (HESA) and the Universities and Colleges Admissions Service (UCAS). The term ‘Computing degrees’ is used to refer to computing disciplines classified under the codes: G4 (Computing); G5 (Information Systems); G6 (SoftwareEngineering);G7(Artificial Intelligence)and, insomecases,G92(Others inComputingScience). The term ‘Telecoms degrees’ is used to refer to Telecoms disciplines classified under the codes: H640 (Communications Engineering); H641 (TelecommunicationsEngineering) and H643 (Satellite Engineering).
It should also be noted that employers actively encourage graduate intake to the sector from degrees other than Computing or Telecoms, as this is seen to provide a healthy mix in the workforce. Additionally, there is no assumption that all students on Computing orTelecomsdegreeswouldnecessarilywishtoenterthesector;aswithotherdegrees,many students may study these because of their interest in the subject not because they have necessarily decided on IT & Telecoms as a career.
However, IT-related Higher Education is an important source of talent for the sector’s workforce, and the vitality of this community is essential to Wales and the UK as a whole.

© Copyright e-skills UK Sector Skills Council Ltd 2000-2009
35 Data about application and qualification levels uses the Joint Academic Classification System for ‘Computing degrees’asfollows:G4ComputerScience;G5InformationSystems;G6SoftwareEngineering;G7ArtificialIntelligence(fromGroupG)andfor‘Telecomsdegrees’:H640CommunicationsEngineering;H641TelecommunicationsEngineering;H643SatelliteEngineering(fromGroupH6).
54
8.1.2 Applicants35 to Computing degree courses
Figures for applicants to Computing degree courses are not available for universities in Wales so Group G, Mathematical and Computer Sciences courses (Computing degrees sit within this group) has been analysed. The following chart details the profile of applicants in Wales to Mathematical and Computer Sciences courses (2002-2008) contrasted with the growth in IT professional workforce in Wales (2002-2009).
Figure 19: The IT professional workforce in Wales / applicants to Mathematical and Computer Sciences courses
Population (A)2,959,000
Workforce (B)1,248,000
Total IT & T industry
(C+D)18,600
IT & T professionals in IT & T industry
(C) 10,900 IT & T professionals in other sectors
(E) 25,500All other occupations in
the IT & T industry (D) 7,700
0.0
5.4South East England
London 5.4
3.6North West England
East of England 3.4
2.9West Midlands
Scotland 2.8
2.7Yorkshire & Humber
South West England 2.7
East Midlands 2.4
Wales 1.4
North East England 1.2
Northern Ireland 0.8
1.0 2.0 3.0 4.0 5.0 6.0
GVA (£bn)
Total IT & T workforce (C+D+E) 44,100
Total IT & T professionals (C+E) 36,400
0
25%
50%
75%
100%
1-10 11-49 50-199 200+
Workplaces Employees
0%
1%
2%
8%
8%
10%
13%
25%
33%
0 5% 10% 15% 20% 25% 35%30% 40%
Agriculture Forestry & Fishing
Energy & Water
Distribution, Hotels & Restaurants
Other services
Construction
Manufacturing
Public Administration, Education & Health
Banking & Finance
Transport & Communication
0
5,000
10,000
15,000
20,000
25,000
30,000
35,000
1992 1993 1994 1995 1996 1997 1998 1999 2000 2001 2002 2003 2004 2005 2006 2007 2008 2009
£600
£400
£200
£0
36%29%
24%30%
37%28% 27%
20%14%
35%39%
38% 23%16%
23%35%
35% 41%
24%
21%21%
29%34% 34%
31%
26%30%
12% 17% 18% 13% 14%6%
20%15%
0%
25%
50%
75%
100%
2001 2002 2003 2004 2005 2006 2007 2008 2009
16-29 30-39 40-49 50+
80%
70%
60%
50%
40%
30%
20%
10%
0%
ACLWBLFE
39%
61%
39%
61%56%
44%
57%
43%
28%
72%
28%
72%
FoundationTrends
1995 2000
Skill changes New skills
2005 2007 2010 2015 2020
Industrialisation of technology
Security and Data Protection
Communications convergence and integration
Innovation
Transformation through IT
The pool of talent and gender balance
Information and analytics
Consumerisation and convergence of IT
Green IT: environmental computing
Social Computing and Web 2.0
Digital Natives
Unemployment500
Retire160
Non IT&T Job Switcher
1,930
IT&T JobSwitcher
620
Look afterfamily
90
Become a student
220
Otherinactive
300
Job switcher fromIT & Telecomsoccupations
610
Entrants to IT & Telecoms occupations
3,520
Job switchers fromNon IT & Telecoms
occupations1,840
Unemployment580
Education660
Other Inactive440
NET change inemploymentOccupation
320
Gross JobOpportunities
4,130
ReplacementJobs3,810
Internet 2%
Database 4%
Networking 4%
Management 5%
SoftwareEngineering
7%
Technical/PC support
22%
Systems design/development
55%
47%
38%
44%
48%
82%
75%
71%
27%
22%
22%
9%
21%
26%
2%52%
35%
34%
29%
9%
4%
3%
Client/customer interaction skills
Other interpersonal skills
Business skills
Skills in general
Sector knowledge/experience
Other non-technical skills
Higher level technical IT skills
Below the level required Equal to the level required Above the level required
56%
57%
77%
69%
68%
68%
71%
15%
2%
15%
21%
23%
25%
15%29%
28%
21%
17%
12%
9%
4%
General software skills/knowledge
Email/Internet skills
Database skills
Overall IT user skills
General hardware skills/knowledge
Word-processing skills
Spreadsheet skills
Below the level required Equal to the level required Above the level required
0
30%
20%
10%
40%
50%
60%
Q2.01 Q2.02 Q2.03 Q2.04 Q2.05 Q2.06 Q2.07 Q2.08 Q2.09
All ICT staff All workers
29%Staff are new to the job/company
5%Staff cannot reach required skill levels even with training
77%Staff unable to train due to work commitments
41%New projects/products/ services being launched
5%Budgets/ lack of funds
60%Company doesn’t train/train enough
8%Other
69%New systems/processes/equipment introduced
48%Technical IT/Telecoms (professional level)
23%Management (other)
21%Management (IT/Telecoms related)
21%Other (IT/Telecoms related)
17%Personal development training
16%General company
15%IT User skills
15%Generic employment training
11%Function specific training
6%Other (general)
4%Finance
0
4,000
6,000
5,000
1,000
3,000
2,000
2002 2003 2004 2005 2006 2007 2008Year
0
5000
10,000
15,000
20,000
25,000
30,000
35,000
2002 2003 2004 2005 2006 2007 2008
G Group Accepts: Mathematical & Computing Science Computing Accepts
0
200
400
600
800
1,000
1,200
1,400
2002 2003 2004 2005 2006 2007 2008
39%Staff are new to the job/company
14%Staff cannot reach required skill levels even with training
64%Staff unable to train due to work commitments
53%New projects/products/ services being launched
1%Budgets/ lack of funds
56%Company doesn’t train/train enough
15%Other
48%New systems/processes/equipment introduced
0% 10% 20% 30% 40% 50% 60% 70% 80% 90% 100%
UK
South West
South East
London
East of England
West Midlands
East Midlands
Yorkshire & Humber
North West
North East
England
Scotland
Northern Ireland
Wales
Agriculture forestry and fishing Distribution Hotels & Restaurants Other services
Energy & Water Transport & Communication NA / DNA
Manufacturing Banking & Finance
Construction Public administration, Education & Health
ICT Managers/IT Strategy & Planning Professionals
Software Professionals
201820092001
45,000
30,000
15,000
05,900
6,700
12,700
11,700
11,400
12,900
13,600
13,900
12,800
IT Operations Technicians/IT User Support Technicians/Database Assistants & Clerks/Telecoms Engineers/Line Repairers & Cable Jointers/Computer Engineers
Computing & Telecoms Graduatesin employment (490)
IT & Telecoms industry: new graduate recruits (300)
IT & Telecoms professionals: new graduate recruits (445)
Graduates of subjects other than Computing & Telecoms (300) are shown in RedEntrants to the IT & Telecoms Workforce (560) are shown in italics
230
140100
15 120
60
125
10% 12
%
12%
12%
13% 14%
14%
14% 15
%
15%
16%
16%
17%
17%
17%
0
5%
10%
15%
20%
25%
30%
Aus
tria
Por
tuga
l
Italy
Nor
way
Pol
and
Slo
veni
a
Cze
ch R
epub
lic
Spa
in
Net
herla
nds
Slo
vaki
a
Ger
man
y
Den
mar
k
Irela
nd UK
Sw
eden
18%
Finl
and
21%
Hun
gary
23%
Rom
ania
23%
Bul
garia
18%
Wal
es
95%
4% 1% 1%
29%
13%
21%
36%
All IT & Telecoms Professionals
£500
£410
Average across Wales
£450
Average across the UK
1,080
Q2.08
1,200
Q3.08
990
Q4.08
770
Q1.09
640
Q2.09
Number of applicants to G Mathematical & Comp Sci (Group) in Wales
0
10,000
5,000
15,000
20,000
25,000
30,000
35,000
2002 2003 2004 2005 2006 2007 2008 2009
Year
IT P
rofe
ssio
nal w
orkf
orce
0
1,000
2,000
3,000
4,000
5,000
6,000
App
lican
ts
Applicants to Mathematical and Computer Science courses
IT Professional workforce
Some other way 2%
Training course - not organised/paid forby an employer 18%
Self-study using books, CD-ROMs, etc 21%
Training course - organised/paid for byan employer 30%
Formalised educational institution(school/college/university) 34%
Informal assistance from colleagues,relatives, friends etc 54%
Self-study (learning by doing) 59%
2006/07 2007/08 2006/07 2007/08 2006/07 2007/08
Male Female
100%
75%
50%
25%
0%
ACL TOTALWBLFE
55%
45%
57%
43%
87%
13%
77%
23%
39%
61%
35%
65%
55%
45%
56%
44%
2006/07 2007/08 2006/07 2007/08 2006/07 2007/08 2006/07 2007/08
Male Female
0
600
400
200
800
1,000
1,200
1,400
1,600
2005 2006 2007 2008 2009
ICT Computing
EmergingTrends
Source: e-skills UK analysis UCAS data.
Although the number of applicants to Mathematical and Computer Sciences courses has grown by 18% since 2004, since 2002 there has been an overall decline of 14%. By contrast the number of people in IT occupations in Wales has grown by 22% over the same time period.

© Copyright e-skills UK Sector Skills Council Ltd 2000-2009 55
8.1.3 Acceptances onto Higher Education Computing Courses
As is the case with applicants, figures for acceptances to Computing degree courses are not available for universities in Wales so group G, Mathematical and Computer Sciences courses (Computing degrees sit within this group) has been analysed.
The graph below details that following a 24% decline between 2002 and 2004, the number of acceptances onto Mathematical and Computing Sciences courses grew by 31% culminating in an overall growth of 0.3% for the period 2002 to 2008.
Figure 20: Acceptances onto Mathematical and Computer36 Science courses in Wales 2002-2008
Population (A)2,959,000
Workforce (B)1,248,000
Total IT & T industry
(C+D)18,600
IT & T professionals in IT & T industry
(C) 10,900 IT & T professionals in other sectors
(E) 25,500All other occupations in
the IT & T industry (D) 7,700
0.0
5.4South East England
London 5.4
3.6North West England
East of England 3.4
2.9West Midlands
Scotland 2.8
2.7Yorkshire & Humber
South West England 2.7
East Midlands 2.4
Wales 1.4
North East England 1.2
Northern Ireland 0.8
1.0 2.0 3.0 4.0 5.0 6.0
GVA (£bn)
Total IT & T workforce (C+D+E) 44,100
Total IT & T professionals (C+E) 36,400
0
25%
50%
75%
100%
1-10 11-49 50-199 200+
Workplaces Employees
0%
1%
2%
8%
8%
10%
13%
25%
33%
0 5% 10% 15% 20% 25% 35%30% 40%
Agriculture Forestry & Fishing
Energy & Water
Distribution, Hotels & Restaurants
Other services
Construction
Manufacturing
Public Administration, Education & Health
Banking & Finance
Transport & Communication
0
5,000
10,000
15,000
20,000
25,000
30,000
35,000
1992 1993 1994 1995 1996 1997 1998 1999 2000 2001 2002 2003 2004 2005 2006 2007 2008 2009
£600
£400
£200
£0
36%29%
24%30%
37%28% 27%
20%14%
35%39%
38% 23%16%
23%35%
35% 41%
24%
21%21%
29%34% 34%
31%
26%30%
12% 17% 18% 13% 14%6%
20%15%
0%
25%
50%
75%
100%
2001 2002 2003 2004 2005 2006 2007 2008 2009
16-29 30-39 40-49 50+
80%
70%
60%
50%
40%
30%
20%
10%
0%
ACLWBLFE
39%
61%
39%
61%56%
44%
57%
43%
28%
72%
28%
72%
FoundationTrends
1995 2000
Skill changes New skills
2005 2007 2010 2015 2020
Industrialisation of technology
Security and Data Protection
Communications convergence and integration
Innovation
Transformation through IT
The pool of talent and gender balance
Information and analytics
Consumerisation and convergence of IT
Green IT: environmental computing
Social Computing and Web 2.0
Digital Natives
Unemployment500
Retire160
Non IT&T Job Switcher
1,930
IT&T JobSwitcher
620
Look afterfamily
90
Become a student
220
Otherinactive
300
Job switcher fromIT & Telecomsoccupations
610
Entrants to IT & Telecoms occupations
3,520
Job switchers fromNon IT & Telecoms
occupations1,840
Unemployment580
Education660
Other Inactive440
NET change inemploymentOccupation
320
Gross JobOpportunities
4,130
ReplacementJobs3,810
Internet 2%
Database 4%
Networking 4%
Management 5%
SoftwareEngineering
7%
Technical/PC support
22%
Systems design/development
55%
47%
38%
44%
48%
82%
75%
71%
27%
22%
22%
9%
21%
26%
2%52%
35%
34%
29%
9%
4%
3%
Client/customer interaction skills
Other interpersonal skills
Business skills
Skills in general
Sector knowledge/experience
Other non-technical skills
Higher level technical IT skills
Below the level required Equal to the level required Above the level required
56%
57%
77%
69%
68%
68%
71%
15%
2%
15%
21%
23%
25%
15%29%
28%
21%
17%
12%
9%
4%
General software skills/knowledge
Email/Internet skills
Database skills
Overall IT user skills
General hardware skills/knowledge
Word-processing skills
Spreadsheet skills
Below the level required Equal to the level required Above the level required
0
30%
20%
10%
40%
50%
60%
Q2.01 Q2.02 Q2.03 Q2.04 Q2.05 Q2.06 Q2.07 Q2.08 Q2.09
All ICT staff All workers
29%Staff are new to the job/company
5%Staff cannot reach required skill levels even with training
77%Staff unable to train due to work commitments
41%New projects/products/ services being launched
5%Budgets/ lack of funds
60%Company doesn’t train/train enough
8%Other
69%New systems/processes/equipment introduced
48%Technical IT/Telecoms (professional level)
23%Management (other)
21%Management (IT/Telecoms related)
21%Other (IT/Telecoms related)
17%Personal development training
16%General company
15%IT User skills
15%Generic employment training
11%Function specific training
6%Other (general)
4%Finance
0
4,000
6,000
5,000
1,000
3,000
2,000
2002 2003 2004 2005 2006 2007 2008Year
0
5000
10,000
15,000
20,000
25,000
30,000
35,000
2002 2003 2004 2005 2006 2007 2008
G Group Accepts: Mathematical & Computing Science Computing Accepts
0
200
400
600
800
1,000
1,200
1,400
2002 2003 2004 2005 2006 2007 2008
39%Staff are new to the job/company
14%Staff cannot reach required skill levels even with training
64%Staff unable to train due to work commitments
53%New projects/products/ services being launched
1%Budgets/ lack of funds
56%Company doesn’t train/train enough
15%Other
48%New systems/processes/equipment introduced
0% 10% 20% 30% 40% 50% 60% 70% 80% 90% 100%
UK
South West
South East
London
East of England
West Midlands
East Midlands
Yorkshire & Humber
North West
North East
England
Scotland
Northern Ireland
Wales
Agriculture forestry and fishing Distribution Hotels & Restaurants Other services
Energy & Water Transport & Communication NA / DNA
Manufacturing Banking & Finance
Construction Public administration, Education & Health
ICT Managers/IT Strategy & Planning Professionals
Software Professionals
201820092001
45,000
30,000
15,000
05,900
6,700
12,700
11,700
11,400
12,900
13,600
13,900
12,800
IT Operations Technicians/IT User Support Technicians/Database Assistants & Clerks/Telecoms Engineers/Line Repairers & Cable Jointers/Computer Engineers
Computing & Telecoms Graduatesin employment (490)
IT & Telecoms industry: new graduate recruits (300)
IT & Telecoms professionals: new graduate recruits (445)
Graduates of subjects other than Computing & Telecoms (300) are shown in RedEntrants to the IT & Telecoms Workforce (560) are shown in italics
230
140100
15 120
60
125
10% 12
%
12%
12%
13% 14%
14%
14% 15
%
15%
16%
16%
17%
17%
17%
0
5%
10%
15%
20%
25%
30%
Aus
tria
Por
tuga
l
Italy
Nor
way
Pol
and
Slo
veni
a
Cze
ch R
epub
lic
Spa
in
Net
herla
nds
Slo
vaki
a
Ger
man
y
Den
mar
k
Irela
nd UK
Sw
eden
18%
Finl
and
21%
Hun
gary
23%
Rom
ania
23%
Bul
garia
18%
Wal
es
95%
4% 1% 1%
29%
13%
21%
36%
All IT & Telecoms Professionals
£500
£410
Average across Wales
£450
Average across the UK
1,080
Q2.08
1,200
Q3.08
990
Q4.08
770
Q1.09
640
Q2.09
Number of applicants to G Mathematical & Comp Sci (Group) in Wales
0
10,000
5,000
15,000
20,000
25,000
30,000
35,000
2002 2003 2004 2005 2006 2007 2008 2009
Year
IT P
rofe
ssio
nal w
orkf
orce
0
1,000
2,000
3,000
4,000
5,000
6,000
App
lican
ts
Applicants to Mathematical and Computer Science courses
IT Professional workforce
Some other way 2%
Training course - not organised/paid forby an employer 18%
Self-study using books, CD-ROMs, etc 21%
Training course - organised/paid for byan employer 30%
Formalised educational institution(school/college/university) 34%
Informal assistance from colleagues,relatives, friends etc 54%
Self-study (learning by doing) 59%
2006/07 2007/08 2006/07 2007/08 2006/07 2007/08
Male Female
100%
75%
50%
25%
0%
ACL TOTALWBLFE
55%
45%
57%
43%
87%
13%
77%
23%
39%
61%
35%
65%
55%
45%
56%
44%
2006/07 2007/08 2006/07 2007/08 2006/07 2007/08 2006/07 2007/08
Male Female
0
600
400
200
800
1,000
1,200
1,400
1,600
2005 2006 2007 2008 2009
ICT Computing
EmergingTrends
Source: e-skills UK analysis of UCAS data based on subject line G4, 5, 6, 7 Home (UK) accepts.
36 Figures for Computing courses alone in Welsh HEIs is not available.
There has been an increase of acceptances onto IT related HE courses in Wales over the past four years

© Copyright e-skills UK Sector Skills Council Ltd 2000-2009 56
8.1.4 Qualifications from Computing and Telecoms degree courses
Whilst there has been continued growth in the number of IT professionals in Wales (growing in number by 110% since 1992), the number of IT & Telecoms qualifiers from Welsh Higher Education Institutions (HEIs) remained static from 2006/07 to 2007/08.
Qualifications data covers both undergraduate and post-graduate degrees. In 2007/08 there were 1,265 Computing and Telecoms degree qualifiers from HEIs in Wales, 4% of the total number of UK Computing and Telecoms degree qualifiers. Of this figure, 94% (1,195) were from Computing degrees and 6% (70) from Telecoms. Qualifiers from the University of Glamorgan made up 34% of the total number of Computing and Telecoms qualifiers in Wales.
Table 15: Qualifiers in Wales in Computing and Telecoms degrees
Higher Education Institution 2006/07 2007/08
Number % of total in Wales
Number % of total in Wales
University of Glamorgan 405 32% 430 34%
Swansea Metropolitan University
145 11% 140 11%
Cardiff University 105 8% 135 11%
Glyndwr University 120 9% 115 9%
Swansea University 140 11% 110 9%
Aberystwyth University 95 7% 95 8%
The University of Wales, Newport
135 11% 90 7%
University of Wales Institute, Cardiff
85 7% 80 6%
Bangor University 15 1% 50 4%
Trinity College, Carmarthen 15 1% 15 1%
The University of Wales, Lampeter
10 1% 5 0%
Total 1,270 100% 1,265 100%
Source: e-skills UK analysis of HESA qualifiers data
Note: Figures may not add up, due to rounding

© Copyright e-skills UK Sector Skills Council Ltd 2000-2009 57
The following table shows the number of qualifiers at undergraduate and post-graduate level for Computing and Telecoms in Wales in 200837, indicating that 55% of the Telecoms qualifiers in Wales are at post-graduate level, compared to 25% of the Computing qualifiers38. When compared to UK figures, Wales HEIs have a larger proportion of qualifiers in Computing and Telecoms at first degree level.
Table 16: Level of degree qualification
Wales UK
Computing Telecoms Computing Telecoms
Post-graduate 25% 54% 29% 60%
First degree 55% 44% 51% 35%
Undergraduate - other (e.g. Foundation degree)
20% 2% 20% 5%
Source: e-skills UK analysis of HESA qualifiers data
Note: Figures may not add up due to rounding
37 Using Joint Academic Coding System (JACS) codes G4, G5, G6, G7, G92 and H640, H641, H64338 Noting that a significant proportion of the post-graduate students are from overseas and may return to their
home country on completion

© Copyright e-skills UK Sector Skills Council Ltd 2000-2009 58
8.1.5 Graduate destinations by industry segment and occupation
The following data is based on Destinations of Leavers from Higher Education (DLHE), a survey carried out by HESA six months after students leave a Higher Education Institution. The value of this information is as an indicator of relative proportions rather than of absolute numbers entering the sector (the actual numbers will be higher).
560 graduates reported having entered IT & Telecoms professional occupations from Welsh universities within six months of graduation, of which 46% were from Computing or Telecoms degrees and 54% from other disciplines. The following figure shows this in more detail.
Figure 21: Destinations of respondents who graduated from Welsh Universities, 2007-2008
Population (A)2,959,000
Workforce (B)1,248,000
Total IT & T industry
(C+D)18,600
IT & T professionals in IT & T industry
(C) 10,900 IT & T professionals in other sectors
(E) 25,500All other occupations in
the IT & T industry (D) 7,700
0.0
5.4South East England
London 5.4
3.6North West England
East of England 3.4
2.9West Midlands
Scotland 2.8
2.7Yorkshire & Humber
South West England 2.7
East Midlands 2.4
Wales 1.4
North East England 1.2
Northern Ireland 0.8
1.0 2.0 3.0 4.0 5.0 6.0
GVA (£bn)
Total IT & T workforce (C+D+E) 44,100
Total IT & T professionals (C+E) 36,400
0
25%
50%
75%
100%
1-10 11-49 50-199 200+
Workplaces Employees
0%
1%
2%
8%
8%
10%
13%
25%
33%
0 5% 10% 15% 20% 25% 35%30% 40%
Agriculture Forestry & Fishing
Energy & Water
Distribution, Hotels & Restaurants
Other services
Construction
Manufacturing
Public Administration, Education & Health
Banking & Finance
Transport & Communication
0
5,000
10,000
15,000
20,000
25,000
30,000
35,000
1992 1993 1994 1995 1996 1997 1998 1999 2000 2001 2002 2003 2004 2005 2006 2007 2008 2009
£600
£400
£200
£0
36%29%
24%30%
37%28% 27%
20%14%
35%39%
38% 23%16%
23%35%
35% 41%
24%
21%21%
29%34% 34%
31%
26%30%
12% 17% 18% 13% 14%6%
20%15%
0%
25%
50%
75%
100%
2001 2002 2003 2004 2005 2006 2007 2008 2009
16-29 30-39 40-49 50+
80%
70%
60%
50%
40%
30%
20%
10%
0%
ACLWBLFE
39%
61%
39%
61%56%
44%
57%
43%
28%
72%
28%
72%
FoundationTrends
1995 2000
Skill changes New skills
2005 2007 2010 2015 2020
Industrialisation of technology
Security and Data Protection
Communications convergence and integration
Innovation
Transformation through IT
The pool of talent and gender balance
Information and analytics
Consumerisation and convergence of IT
Green IT: environmental computing
Social Computing and Web 2.0
Digital Natives
Unemployment500
Retire160
Non IT&T Job Switcher
1,930
IT&T JobSwitcher
620
Look afterfamily
90
Become a student
220
Otherinactive
300
Job switcher fromIT & Telecomsoccupations
610
Entrants to IT & Telecoms occupations
3,520
Job switchers fromNon IT & Telecoms
occupations1,840
Unemployment580
Education660
Other Inactive440
NET change inemploymentOccupation
320
Gross JobOpportunities
4,130
ReplacementJobs3,810
Internet 2%
Database 4%
Networking 4%
Management 5%
SoftwareEngineering
7%
Technical/PC support
22%
Systems design/development
55%
47%
38%
44%
48%
82%
75%
71%
27%
22%
22%
9%
21%
26%
2%52%
35%
34%
29%
9%
4%
3%
Client/customer interaction skills
Other interpersonal skills
Business skills
Skills in general
Sector knowledge/experience
Other non-technical skills
Higher level technical IT skills
Below the level required Equal to the level required Above the level required
56%
57%
77%
69%
68%
68%
71%
15%
2%
15%
21%
23%
25%
15%29%
28%
21%
17%
12%
9%
4%
General software skills/knowledge
Email/Internet skills
Database skills
Overall IT user skills
General hardware skills/knowledge
Word-processing skills
Spreadsheet skills
Below the level required Equal to the level required Above the level required
0
30%
20%
10%
40%
50%
60%
Q2.01 Q2.02 Q2.03 Q2.04 Q2.05 Q2.06 Q2.07 Q2.08 Q2.09
All ICT staff All workers
29%Staff are new to the job/company
5%Staff cannot reach required skill levels even with training
77%Staff unable to train due to work commitments
41%New projects/products/ services being launched
5%Budgets/ lack of funds
60%Company doesn’t train/train enough
8%Other
69%New systems/processes/equipment introduced
48%Technical IT/Telecoms (professional level)
23%Management (other)
21%Management (IT/Telecoms related)
21%Other (IT/Telecoms related)
17%Personal development training
16%General company
15%IT User skills
15%Generic employment training
11%Function specific training
6%Other (general)
4%Finance
0
4,000
6,000
5,000
1,000
3,000
2,000
2002 2003 2004 2005 2006 2007 2008Year
0
5000
10,000
15,000
20,000
25,000
30,000
35,000
2002 2003 2004 2005 2006 2007 2008
G Group Accepts: Mathematical & Computing Science Computing Accepts
0
200
400
600
800
1,000
1,200
1,400
2002 2003 2004 2005 2006 2007 2008
39%Staff are new to the job/company
14%Staff cannot reach required skill levels even with training
64%Staff unable to train due to work commitments
53%New projects/products/ services being launched
1%Budgets/ lack of funds
56%Company doesn’t train/train enough
15%Other
48%New systems/processes/equipment introduced
0% 10% 20% 30% 40% 50% 60% 70% 80% 90% 100%
UK
South West
South East
London
East of England
West Midlands
East Midlands
Yorkshire & Humber
North West
North East
England
Scotland
Northern Ireland
Wales
Agriculture forestry and fishing Distribution Hotels & Restaurants Other services
Energy & Water Transport & Communication NA / DNA
Manufacturing Banking & Finance
Construction Public administration, Education & Health
ICT Managers/IT Strategy & Planning Professionals
Software Professionals
201820092001
45,000
30,000
15,000
05,900
6,700
12,700
11,700
11,400
12,900
13,600
13,900
12,800
IT Operations Technicians/IT User Support Technicians/Database Assistants & Clerks/Telecoms Engineers/Line Repairers & Cable Jointers/Computer Engineers
Computing & Telecoms Graduatesin employment (490)
IT & Telecoms industry: new graduate recruits (300)
IT & Telecoms professionals: new graduate recruits (445)
Graduates of subjects other than Computing & Telecoms (300) are shown in RedEntrants to the IT & Telecoms Workforce (560) are shown in italics
230
140100
15 120
60
125
10% 12
%
12%
12%
13% 14%
14%
14% 15
%
15%
16%
16%
17%
17%
17%
0
5%
10%
15%
20%
25%
30%
Aus
tria
Por
tuga
l
Italy
Nor
way
Pol
and
Slo
veni
a
Cze
ch R
epub
lic
Spa
in
Net
herla
nds
Slo
vaki
a
Ger
man
y
Den
mar
k
Irela
nd UK
Sw
eden
18%
Finl
and
21%
Hun
gary
23%
Rom
ania
23%
Bul
garia
18%
Wal
es
95%
4% 1% 1%
29%
13%
21%
36%
All IT & Telecoms Professionals
£500
£410
Average across Wales
£450
Average across the UK
1,080
Q2.08
1,200
Q3.08
990
Q4.08
770
Q1.09
640
Q2.09
Number of applicants to G Mathematical & Comp Sci (Group) in Wales
0
10,000
5,000
15,000
20,000
25,000
30,000
35,000
2002 2003 2004 2005 2006 2007 2008 2009
Year
IT P
rofe
ssio
nal w
orkf
orce
0
1,000
2,000
3,000
4,000
5,000
6,000
App
lican
ts
Applicants to Mathematical and Computer Science courses
IT Professional workforce
Some other way 2%
Training course - not organised/paid forby an employer 18%
Self-study using books, CD-ROMs, etc 21%
Training course - organised/paid for byan employer 30%
Formalised educational institution(school/college/university) 34%
Informal assistance from colleagues,relatives, friends etc 54%
Self-study (learning by doing) 59%
2006/07 2007/08 2006/07 2007/08 2006/07 2007/08
Male Female
100%
75%
50%
25%
0%
ACL TOTALWBLFE
55%
45%
57%
43%
87%
13%
77%
23%
39%
61%
35%
65%
55%
45%
56%
44%
2006/07 2007/08 2006/07 2007/08 2006/07 2007/08 2006/07 2007/08
Male Female
0
600
400
200
800
1,000
1,200
1,400
1,600
2005 2006 2007 2008 2009
ICT Computing
EmergingTrends
Source: HESA Destinations of Graduate Leavers, 2007-08
Note: Figures may not add up due to rounding

© Copyright e-skills UK Sector Skills Council Ltd 2000-2009 59
The following table shows the destinations (location of employment by region of institution) of all graduate respondents entering IT & Telecoms occupations. It details that almost half (49%) of graduates from Welsh HEI’s found work within Wales, 12% the South West and 9% in the West Midlands.
Table 17: Destinations of all graduate respondents entering IT & Telecoms occupations, by region of employment and institution, 2007-08
Region of Institution
East of
England
East Midlands
London North East
North West
South East
South West
West Midlands
Yorkshire &
Humber
Northern Ireland
Scotland Wales
Reg
ion
of
Em
plo
ymen
t
East of England
45% 10% 5% 3% 2% 7% 3% 3% 4% 1% 1% 1%
East Midlands
2% 33% 1% 2% 3% 1% 1% 6% 8% 0% 1% 2%
London 25% 15% 67% 8% 9% 21% 16% 12% 9% 2% 8% 7%
North East
0% 1% 0% 53% 0% 1% 0% 0% 2% 0% 0% 0%
North West
1% 3% 1% 6% 63% 3% 1% 3% 11% 0% 3% 3%
South East
11% 14% 14% 7% 5% 39% 19% 7% 6% 2% 3% 8%
South West
3% 3% 2% 2% 2% 6% 51% 3% 2% 0% 2% 12%
West Midlands
2% 9% 1% 2% 3% 3% 2% 50% 4% 1% 1% 9%
Yorkshire & Humber
0% 4% 0% 7% 6% 2% 0% 1% 47% 0% 1% 1%
Northern Ireland
0% 0% 0% 1% 0% 1% 0% 0% 0% 80% 1% 0%
Scotland 0% 1% 0% 1% 0% 2% 0% 0% 1% 0% 72% 0%
Wales 0% 0% 0% 1% 2% 1% 1% 0% 0% 0% 0% 49%
Overseas 9% 3% 7% 4% 5% 5% 3% 5% 5% 15% 7% 8%
Not known
1% 2% 2% 4% 1% 6% 1% 10% 1% 0% 1% 1%
Largest proportion
2nd largest proportion
3rd largest proportion
Source: e-skills UK analysis of HESA Destinations Leavers, 2007/08
Note: Figures may not add up due to rounding
Of graduates who enter IT and Telecoms occupations in Wales, almost half are from Welsh HEIs
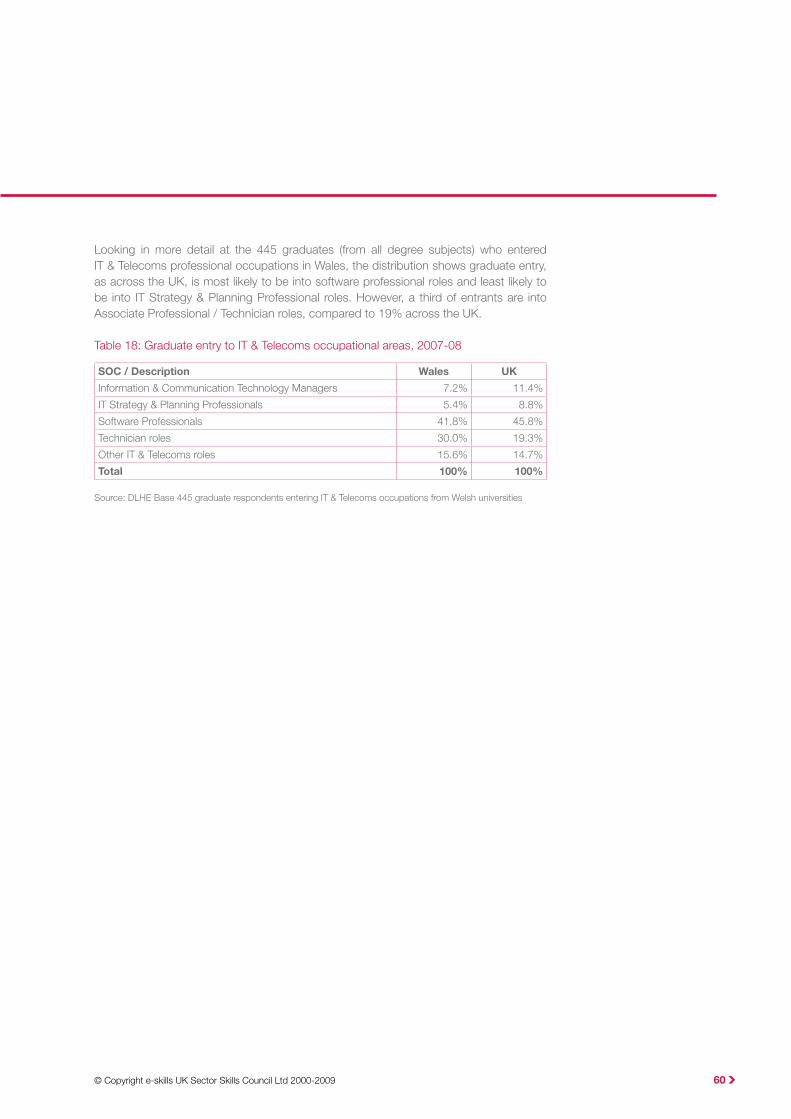
© Copyright e-skills UK Sector Skills Council Ltd 2000-2009 60
Looking in more detail at the 445 graduates (from all degree subjects) who entered IT & Telecoms professional occupations in Wales, the distribution shows graduate entry, as across the UK, is most likely to be into software professional roles and least likely to be into IT Strategy & Planning Professional roles. However, a third of entrants are into Associate Professional / Technician roles, compared to 19% across the UK.
Table 18: Graduate entry to IT & Telecoms occupational areas, 2007-08
SOC / Description Wales UK
Information & Communication Technology Managers 7.2% 11.4%
IT Strategy & Planning Professionals 5.4% 8.8%
Software Professionals 41.8% 45.8%
Technician roles 30.0% 19.3%
Other IT & Telecoms roles 15.6% 14.7%
Total 100% 100%
Source: DLHE Base 445 graduate respondents entering IT & Telecoms occupations from Welsh universities

© Copyright e-skills UK Sector Skills Council Ltd 2000-2009 61
8.2 Further Education
The analysis in this section is based on data provided by the Welsh Assembly Government for 2006/07 and 2007/08. Data on learners across Wales is gathered via the Lifelong Learning Wales Record (LLWR), and provides an overview of IT & Telecoms professional and IT user related training and education delivery by learning providers in Wales39.
8.2.1 IT & Telecoms professional training provision
Uptake of IT & Telecoms courses
Of the 9,000 people on IT & Telecoms professional courses in Wales during the academic year 2007/08, 90% were undertaking courses delivered through Further Education Institutions, 7% through Adult and Community Learning and 3% via Work Based Learning (WBL). Levels 1-3 made up 77% of the IT & Telecoms professional qualifications being taken in Wales in 2007/08. A further 18% is at entry level or level unknown.
Table 19: Uptake of IT & Telecoms courses
Source: Lifelong Learning Wales Record 2006/07, 2007/08
Note: Figures may not sum due to rounding
Level FE WBL ACL Total
2006/07 2007/08 2006/07 2007/08 2006/07 2007/08 2006/07 2007/08
No. % No. % No. % No. % No. % No. % No. % No. %
0 30 0% 20 0% 0 0% 0 0% 60 21% 90 13% 100 1% 110 1%
1 3,150 31% 2,650 31% 10 4% 90 31% 80 29% 30 4% 3,240 30% 2,780 29%
2 2,830 28% 2,350 28% 100 37% 80 28% 0 0% 0 0% 2,940 27% 2,440 26%
3 1,850 18% 1,900 22% 150 56% 120 41% 10 4% 10 1% 2,010 19% 2,030 22%
4 70 1% 20 0% 0 0% 0 0% 0 0% 0 0% 70 1% 30 0%
5 0 0% 30 0% 0 0% 0 0% 0 0% 0 0% 0 0% 30 0%
9 510 5% 270 3% 0 0% 0 0% 0 0% 20 3% 510 5% 290 3%
Entry 1,230 12% 1,000 12% 0 0% 0 0% 20 7% 20 3% 1,250 12% 1,010 11%
Higher 0 0% 0 0% 0 0% 0 0% 0 0% 0 0% 0 0% 0 0%
Unknown 480 5% 240 3% 0 0% 0 0% 100 36% 500 75% 580 5% 740 8%
Grand Total
10,150 100% 8,480 100% 270 100% 290 100% 280 100% 670 100% 10,700 100% 9,440 100%
39 Within the LLWR data provided by WAG, the term learning providers constitutes the Further Education (FE) Colleges in Wales and training providers engaging in Work Based Learning (WBL) and Adult and Community Learning (ACL)

© Copyright e-skills UK Sector Skills Council Ltd 2000-2009 62
Gender
56% of people taking IT & Telecoms professional qualifications in Wales during the academic year 2007/08 were male. Work Based Learning courses (77%) and Further Education (57%) were dominated by males whilst those taking the Adult and Community Learning route were largely female.
Figure 22: Proportion ‘in learning’ on IT & Telecoms professional courses in Wales by gender
Population (A)2,959,000
Workforce (B)1,248,000
Total IT & T industry
(C+D)18,600
IT & T professionals in IT & T industry
(C) 10,900 IT & T professionals in other sectors
(E) 25,500All other occupations in
the IT & T industry (D) 7,700
0.0
5.4South East England
London 5.4
3.6North West England
East of England 3.4
2.9West Midlands
Scotland 2.8
2.7Yorkshire & Humber
South West England 2.7
East Midlands 2.4
Wales 1.4
North East England 1.2
Northern Ireland 0.8
1.0 2.0 3.0 4.0 5.0 6.0
GVA (£bn)
Total IT & T workforce (C+D+E) 44,100
Total IT & T professionals (C+E) 36,400
0
25%
50%
75%
100%
1-10 11-49 50-199 200+
Workplaces Employees
0%
1%
2%
8%
8%
10%
13%
25%
33%
0 5% 10% 15% 20% 25% 35%30% 40%
Agriculture Forestry & Fishing
Energy & Water
Distribution, Hotels & Restaurants
Other services
Construction
Manufacturing
Public Administration, Education & Health
Banking & Finance
Transport & Communication
0
5,000
10,000
15,000
20,000
25,000
30,000
35,000
1992 1993 1994 1995 1996 1997 1998 1999 2000 2001 2002 2003 2004 2005 2006 2007 2008 2009
£600
£400
£200
£0
36%29%
24%30%
37%28% 27%
20%14%
35%39%
38% 23%16%
23%35%
35% 41%
24%
21%21%
29%34% 34%
31%
26%30%
12% 17% 18% 13% 14%6%
20%15%
0%
25%
50%
75%
100%
2001 2002 2003 2004 2005 2006 2007 2008 2009
16-29 30-39 40-49 50+
80%
70%
60%
50%
40%
30%
20%
10%
0%
ACLWBLFE
39%
61%
39%
61%56%
44%
57%
43%
28%
72%
28%
72%
FoundationTrends
1995 2000
Skill changes New skills
2005 2007 2010 2015 2020
Industrialisation of technology
Security and Data Protection
Communications convergence and integration
Innovation
Transformation through IT
The pool of talent and gender balance
Information and analytics
Consumerisation and convergence of IT
Green IT: environmental computing
Social Computing and Web 2.0
Digital Natives
Unemployment500
Retire160
Non IT&T Job Switcher
1,930
IT&T JobSwitcher
620
Look afterfamily
90
Become a student
220
Otherinactive
300
Job switcher fromIT & Telecomsoccupations
610
Entrants to IT & Telecoms occupations
3,520
Job switchers fromNon IT & Telecoms
occupations1,840
Unemployment580
Education660
Other Inactive440
NET change inemploymentOccupation
320
Gross JobOpportunities
4,130
ReplacementJobs3,810
Internet 2%
Database 4%
Networking 4%
Management 5%
SoftwareEngineering
7%
Technical/PC support
22%
Systems design/development
55%
47%
38%
44%
48%
82%
75%
71%
27%
22%
22%
9%
21%
26%
2%52%
35%
34%
29%
9%
4%
3%
Client/customer interaction skills
Other interpersonal skills
Business skills
Skills in general
Sector knowledge/experience
Other non-technical skills
Higher level technical IT skills
Below the level required Equal to the level required Above the level required
56%
57%
77%
69%
68%
68%
71%
15%
2%
15%
21%
23%
25%
15%29%
28%
21%
17%
12%
9%
4%
General software skills/knowledge
Email/Internet skills
Database skills
Overall IT user skills
General hardware skills/knowledge
Word-processing skills
Spreadsheet skills
Below the level required Equal to the level required Above the level required
0
30%
20%
10%
40%
50%
60%
Q2.01 Q2.02 Q2.03 Q2.04 Q2.05 Q2.06 Q2.07 Q2.08 Q2.09
All ICT staff All workers
29%Staff are new to the job/company
5%Staff cannot reach required skill levels even with training
77%Staff unable to train due to work commitments
41%New projects/products/ services being launched
5%Budgets/ lack of funds
60%Company doesn’t train/train enough
8%Other
69%New systems/processes/equipment introduced
48%Technical IT/Telecoms (professional level)
23%Management (other)
21%Management (IT/Telecoms related)
21%Other (IT/Telecoms related)
17%Personal development training
16%General company
15%IT User skills
15%Generic employment training
11%Function specific training
6%Other (general)
4%Finance
0
4,000
6,000
5,000
1,000
3,000
2,000
2002 2003 2004 2005 2006 2007 2008Year
0
5000
10,000
15,000
20,000
25,000
30,000
35,000
2002 2003 2004 2005 2006 2007 2008
G Group Accepts: Mathematical & Computing Science Computing Accepts
0
200
400
600
800
1,000
1,200
1,400
2002 2003 2004 2005 2006 2007 2008
39%Staff are new to the job/company
14%Staff cannot reach required skill levels even with training
64%Staff unable to train due to work commitments
53%New projects/products/ services being launched
1%Budgets/ lack of funds
56%Company doesn’t train/train enough
15%Other
48%New systems/processes/equipment introduced
0% 10% 20% 30% 40% 50% 60% 70% 80% 90% 100%
UK
South West
South East
London
East of England
West Midlands
East Midlands
Yorkshire & Humber
North West
North East
England
Scotland
Northern Ireland
Wales
Agriculture forestry and fishing Distribution Hotels & Restaurants Other services
Energy & Water Transport & Communication NA / DNA
Manufacturing Banking & Finance
Construction Public administration, Education & Health
ICT Managers/IT Strategy & Planning Professionals
Software Professionals
201820092001
45,000
30,000
15,000
05,900
6,700
12,700
11,700
11,400
12,900
13,600
13,900
12,800
IT Operations Technicians/IT User Support Technicians/Database Assistants & Clerks/Telecoms Engineers/Line Repairers & Cable Jointers/Computer Engineers
Computing & Telecoms Graduatesin employment (490)
IT & Telecoms industry: new graduate recruits (300)
IT & Telecoms professionals: new graduate recruits (445)
Graduates of subjects other than Computing & Telecoms (300) are shown in RedEntrants to the IT & Telecoms Workforce (560) are shown in italics
230
140100
15 120
60
125
10% 12
%
12%
12%
13% 14%
14%
14% 15
%
15%
16%
16%
17%
17%
17%
0
5%
10%
15%
20%
25%
30%
Aus
tria
Por
tuga
l
Italy
Nor
way
Pol
and
Slo
veni
a
Cze
ch R
epub
lic
Spa
in
Net
herla
nds
Slo
vaki
a
Ger
man
y
Den
mar
k
Irela
nd UK
Sw
eden
18%
Finl
and
21%
Hun
gary
23%
Rom
ania
23%
Bul
garia
18%
Wal
es
95%
4% 1% 1%
29%
13%
21%
36%
All IT & Telecoms Professionals
£500
£410
Average across Wales
£450
Average across the UK
1,080
Q2.08
1,200
Q3.08
990
Q4.08
770
Q1.09
640
Q2.09
Number of applicants to G Mathematical & Comp Sci (Group) in Wales
0
10,000
5,000
15,000
20,000
25,000
30,000
35,000
2002 2003 2004 2005 2006 2007 2008 2009
Year
IT P
rofe
ssio
nal w
orkf
orce
0
1,000
2,000
3,000
4,000
5,000
6,000
App
lican
ts
Applicants to Mathematical and Computer Science courses
IT Professional workforce
Some other way 2%
Training course - not organised/paid forby an employer 18%
Self-study using books, CD-ROMs, etc 21%
Training course - organised/paid for byan employer 30%
Formalised educational institution(school/college/university) 34%
Informal assistance from colleagues,relatives, friends etc 54%
Self-study (learning by doing) 59%
2006/07 2007/08 2006/07 2007/08 2006/07 2007/08
Male Female
100%
75%
50%
25%
0%
ACL TOTALWBLFE
55%
45%
57%
43%
87%
13%
77%
23%
39%
61%
35%
65%
55%
45%
56%
44%
2006/07 2007/08 2006/07 2007/08 2006/07 2007/08 2006/07 2007/08
Male Female
0
600
400
200
800
1,000
1,200
1,400
1,600
2005 2006 2007 2008 2009
ICT Computing
EmergingTrends
Source: Lifelong Learning Wales Record 2006/07, 2007/08
Completion status
People on IT & Telecoms professional courses in Wales through Further Education are the most (15%) and those who choose the Adult and Community Learning method the least likely to ‘withdraw’ (2%) from their course of learning. Whilst the Adult and Community Learning route has the highest completion rate, Further Education has the highest number of completions (6,030).
Table 20: People on IT & Telecoms professional courses in Wales by completion status
Completion Status
FE WBL ACL Total
2006/07 2007/08 2006/07 2007/08 2006/07 2007/08 2006/07 2007/08
No. % No. % No. % No. % No. % No. % No. % No. %
Continuing 990 10% 990 12% 100 36% 80 28% 80 28% 90 14% 1,160 11% 1,170 12%
Completed 7,290 72% 6,030 71% 120 43% 180 63% 190 70% 570 84% 7,600 71% 6,780 72%
Withdrawn 1,540 15% 1,290 15% 50 18% 20 8% 10 3% 10 2% 1,590 15% 1,320 14%
Transferred 330 3% 200 2% 0 1% 0 0% 0 0% 0 0% 330 3% 200 2%
Suspended 0 0% 0 0% 0 1% 0 1% 0 0% 0 0% 10 0% 0 0%
Total 10,150 100% 8,510 100% 270 100% 290 100% 280 100% 670 100% 10,700 100% 9,470 100%
Source: Lifelong Learning Wales Record 2006/07, 2007/08
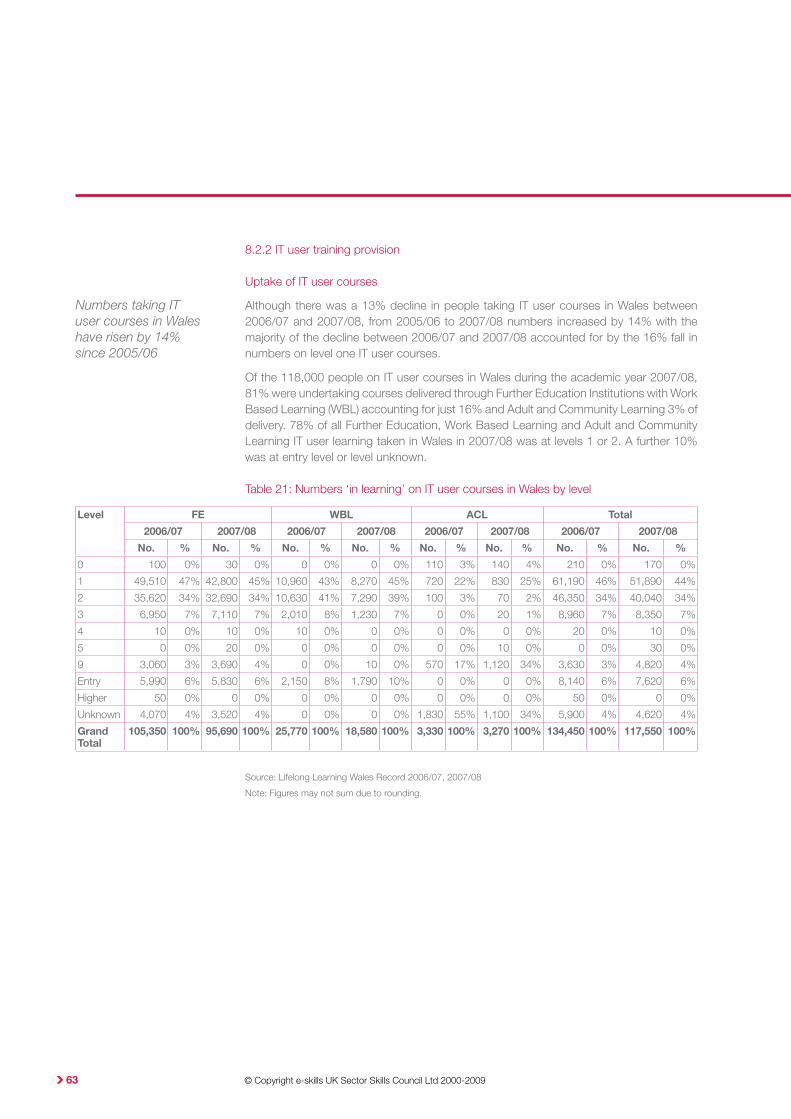
© Copyright e-skills UK Sector Skills Council Ltd 2000-2009 63
8.2.2 IT user training provision
Uptake of IT user courses
Although there was a 13% decline in people taking IT user courses in Wales between 2006/07 and 2007/08, from 2005/06 to 2007/08 numbers increased by 14% with the majority of the decline between 2006/07 and 2007/08 accounted for by the 16% fall in numbers on level one IT user courses.
Of the 118,000 people on IT user courses in Wales during the academic year 2007/08, 81% were undertaking courses delivered through Further Education Institutions with Work Based Learning (WBL) accounting for just 16% and Adult and Community Learning 3% of delivery. 78% of all Further Education, Work Based Learning and Adult and Community Learning IT user learning taken in Wales in 2007/08 was at levels 1 or 2. A further 10% was at entry level or level unknown.
Table 21: Numbers ‘in learning’ on IT user courses in Wales by level
Source: Lifelong Learning Wales Record 2006/07, 2007/08
Note: Figures may not sum due to rounding.
Level FE WBL ACL Total
2006/07 2007/08 2006/07 2007/08 2006/07 2007/08 2006/07 2007/08
No. % No. % No. % No. % No. % No. % No. % No. %
0 100 0% 30 0% 0 0% 0 0% 110 3% 140 4% 210 0% 170 0%
1 49,510 47% 42,800 45% 10,960 43% 8,270 45% 720 22% 830 25% 61,190 46% 51,890 44%
2 35,620 34% 32,690 34% 10,630 41% 7,290 39% 100 3% 70 2% 46,350 34% 40,040 34%
3 6,950 7% 7,110 7% 2,010 8% 1,230 7% 0 0% 20 1% 8,960 7% 8,350 7%
4 10 0% 10 0% 10 0% 0 0% 0 0% 0 0% 20 0% 10 0%
5 0 0% 20 0% 0 0% 0 0% 0 0% 10 0% 0 0% 30 0%
9 3,060 3% 3,690 4% 0 0% 10 0% 570 17% 1,120 34% 3,630 3% 4,820 4%
Entry 5,990 6% 5,830 6% 2,150 8% 1,790 10% 0 0% 0 0% 8,140 6% 7,620 6%
Higher 50 0% 0 0% 0 0% 0 0% 0 0% 0 0% 50 0% 0 0%
Unknown 4,070 4% 3,520 4% 0 0% 0 0% 1,830 55% 1,100 34% 5,900 4% 4,620 4%
Grand Total
105,350 100% 95,690 100% 25,770 100% 18,580 100% 3,330 100% 3,270 100% 134,450 100% 117,550 100%
Numbers taking IT user courses in Wales have risen by 14% since 2005/06

© Copyright e-skills UK Sector Skills Council Ltd 2000-2009 64
Gender
58% of people ‘in learning’ on IT user courses in Wales during the academic year 2007/08 were female. Although Adult and Community Learning (72%) and Further Education (61%) routes had a higher proportion of female learners the majority of those taking the Work Based Learning route were male (57%).
Figure 23: People on IT user courses in Wales by route and gender
Population (A)2,959,000
Workforce (B)1,248,000
Total IT & T industry
(C+D)18,600
IT & T professionals in IT & T industry
(C) 10,900 IT & T professionals in other sectors
(E) 25,500All other occupations in
the IT & T industry (D) 7,700
0.0
5.4South East England
London 5.4
3.6North West England
East of England 3.4
2.9West Midlands
Scotland 2.8
2.7Yorkshire & Humber
South West England 2.7
East Midlands 2.4
Wales 1.4
North East England 1.2
Northern Ireland 0.8
1.0 2.0 3.0 4.0 5.0 6.0
GVA (£bn)
Total IT & T workforce (C+D+E) 44,100
Total IT & T professionals (C+E) 36,400
0
25%
50%
75%
100%
1-10 11-49 50-199 200+
Workplaces Employees
0%
1%
2%
8%
8%
10%
13%
25%
33%
0 5% 10% 15% 20% 25% 35%30% 40%
Agriculture Forestry & Fishing
Energy & Water
Distribution, Hotels & Restaurants
Other services
Construction
Manufacturing
Public Administration, Education & Health
Banking & Finance
Transport & Communication
0
5,000
10,000
15,000
20,000
25,000
30,000
35,000
1992 1993 1994 1995 1996 1997 1998 1999 2000 2001 2002 2003 2004 2005 2006 2007 2008 2009
£600
£400
£200
£0
36%29%
24%30%
37%28% 27%
20%14%
35%39%
38% 23%16%
23%35%
35% 41%
24%
21%21%
29%34% 34%
31%
26%30%
12% 17% 18% 13% 14%6%
20%15%
0%
25%
50%
75%
100%
2001 2002 2003 2004 2005 2006 2007 2008 2009
16-29 30-39 40-49 50+
80%
70%
60%
50%
40%
30%
20%
10%
0%
ACLWBLFE
39%
61%
39%
61%56%
44%
57%
43%
28%
72%
28%
72%
FoundationTrends
1995 2000
Skill changes New skills
2005 2007 2010 2015 2020
Industrialisation of technology
Security and Data Protection
Communications convergence and integration
Innovation
Transformation through IT
The pool of talent and gender balance
Information and analytics
Consumerisation and convergence of IT
Green IT: environmental computing
Social Computing and Web 2.0
Digital Natives
Unemployment500
Retire160
Non IT&T Job Switcher
1,930
IT&T JobSwitcher
620
Look afterfamily
90
Become a student
220
Otherinactive
300
Job switcher fromIT & Telecomsoccupations
610
Entrants to IT & Telecoms occupations
3,520
Job switchers fromNon IT & Telecoms
occupations1,840
Unemployment580
Education660
Other Inactive440
NET change inemploymentOccupation
320
Gross JobOpportunities
4,130
ReplacementJobs3,810
Internet 2%
Database 4%
Networking 4%
Management 5%
SoftwareEngineering
7%
Technical/PC support
22%
Systems design/development
55%
47%
38%
44%
48%
82%
75%
71%
27%
22%
22%
9%
21%
26%
2%52%
35%
34%
29%
9%
4%
3%
Client/customer interaction skills
Other interpersonal skills
Business skills
Skills in general
Sector knowledge/experience
Other non-technical skills
Higher level technical IT skills
Below the level required Equal to the level required Above the level required
56%
57%
77%
69%
68%
68%
71%
15%
2%
15%
21%
23%
25%
15%29%
28%
21%
17%
12%
9%
4%
General software skills/knowledge
Email/Internet skills
Database skills
Overall IT user skills
General hardware skills/knowledge
Word-processing skills
Spreadsheet skills
Below the level required Equal to the level required Above the level required
0
30%
20%
10%
40%
50%
60%
Q2.01 Q2.02 Q2.03 Q2.04 Q2.05 Q2.06 Q2.07 Q2.08 Q2.09
All ICT staff All workers
29%Staff are new to the job/company
5%Staff cannot reach required skill levels even with training
77%Staff unable to train due to work commitments
41%New projects/products/ services being launched
5%Budgets/ lack of funds
60%Company doesn’t train/train enough
8%Other
69%New systems/processes/equipment introduced
48%Technical IT/Telecoms (professional level)
23%Management (other)
21%Management (IT/Telecoms related)
21%Other (IT/Telecoms related)
17%Personal development training
16%General company
15%IT User skills
15%Generic employment training
11%Function specific training
6%Other (general)
4%Finance
0
4,000
6,000
5,000
1,000
3,000
2,000
2002 2003 2004 2005 2006 2007 2008Year
0
5000
10,000
15,000
20,000
25,000
30,000
35,000
2002 2003 2004 2005 2006 2007 2008
G Group Accepts: Mathematical & Computing Science Computing Accepts
0
200
400
600
800
1,000
1,200
1,400
2002 2003 2004 2005 2006 2007 2008
39%Staff are new to the job/company
14%Staff cannot reach required skill levels even with training
64%Staff unable to train due to work commitments
53%New projects/products/ services being launched
1%Budgets/ lack of funds
56%Company doesn’t train/train enough
15%Other
48%New systems/processes/equipment introduced
0% 10% 20% 30% 40% 50% 60% 70% 80% 90% 100%
UK
South West
South East
London
East of England
West Midlands
East Midlands
Yorkshire & Humber
North West
North East
England
Scotland
Northern Ireland
Wales
Agriculture forestry and fishing Distribution Hotels & Restaurants Other services
Energy & Water Transport & Communication NA / DNA
Manufacturing Banking & Finance
Construction Public administration, Education & Health
ICT Managers/IT Strategy & Planning Professionals
Software Professionals
201820092001
45,000
30,000
15,000
05,900
6,700
12,700
11,700
11,400
12,900
13,600
13,900
12,800
IT Operations Technicians/IT User Support Technicians/Database Assistants & Clerks/Telecoms Engineers/Line Repairers & Cable Jointers/Computer Engineers
Computing & Telecoms Graduatesin employment (490)
IT & Telecoms industry: new graduate recruits (300)
IT & Telecoms professionals: new graduate recruits (445)
Graduates of subjects other than Computing & Telecoms (300) are shown in RedEntrants to the IT & Telecoms Workforce (560) are shown in italics
230
140100
15 120
60
125
10% 12
%
12%
12%
13% 14%
14%
14% 15
%
15%
16%
16%
17%
17%
17%
0
5%
10%
15%
20%
25%
30%
Aus
tria
Por
tuga
l
Italy
Nor
way
Pol
and
Slo
veni
a
Cze
ch R
epub
lic
Spa
in
Net
herla
nds
Slo
vaki
a
Ger
man
y
Den
mar
k
Irela
nd UK
Sw
eden
18%
Finl
and
21%
Hun
gary
23%
Rom
ania
23%
Bul
garia
18%
Wal
es
95%
4% 1% 1%
29%
13%
21%
36%
All IT & Telecoms Professionals
£500
£410
Average across Wales
£450
Average across the UK
1,080
Q2.08
1,200
Q3.08
990
Q4.08
770
Q1.09
640
Q2.09
Number of applicants to G Mathematical & Comp Sci (Group) in Wales
0
10,000
5,000
15,000
20,000
25,000
30,000
35,000
2002 2003 2004 2005 2006 2007 2008 2009
Year
IT P
rofe
ssio
nal w
orkf
orce
0
1,000
2,000
3,000
4,000
5,000
6,000
App
lican
ts
Applicants to Mathematical and Computer Science courses
IT Professional workforce
Some other way 2%
Training course - not organised/paid forby an employer 18%
Self-study using books, CD-ROMs, etc 21%
Training course - organised/paid for byan employer 30%
Formalised educational institution(school/college/university) 34%
Informal assistance from colleagues,relatives, friends etc 54%
Self-study (learning by doing) 59%
2006/07 2007/08 2006/07 2007/08 2006/07 2007/08
Male Female
100%
75%
50%
25%
0%
ACL TOTALWBLFE
55%
45%
57%
43%
87%
13%
77%
23%
39%
61%
35%
65%
55%
45%
56%
44%
2006/07 2007/08 2006/07 2007/08 2006/07 2007/08 2006/07 2007/08
Male Female
0
600
400
200
800
1,000
1,200
1,400
1,600
2005 2006 2007 2008 2009
ICT Computing
EmergingTrends
Source: Lifelong Learning Wales Record 2006/07, 2007/08
Completion status
People on IT user courses in Wales through Work Based Learning are the most (19%) and those who choose the Adult and Community Learning method the least likely to ‘withdraw’ (7%). Although both the Adult and Community Learning and Further Education routes have completion rates of 69%, Further Education has, in number, almost 30 times as many completions as those seen through Adult and Community Learning.
Table 22: People on IT user courses in Wales by route and completion status
Completion Status
FE WBL ACL Total
2006/07 2007/08 2006/07 2007/08 2006/07 2007/08 2006/07 2007/08
No. % No. % No. % No. % No. % No. % No. % No. %
Continuing 10,830 10% 12,770 13% 2,880 11% 2,450 13% 390 12% 650 20% 14,100 10% 15,870 14%
Completed 75,520 72% 66,450 69% 16,540 64% 11,940 64% 2,630 79% 2,260 69% 94,690 70% 80,660 69%
Withdrawn 15,130 14% 12,440 13% 4,950 19% 3,230 17% 240 7% 300 9% 20,310 15% 15,970 14%
Transferred 3,840 4% 3,990 4% 650 3% 340 2% 60 2% 60 2% 4,550 3% 4,380 4%
Suspended 40 0% 40 0% 750 3% 620 3% 0 0% 0 0% 790 1% 660 1%
Total 105,360 100% 95,690 100% 25,770 100% 18,585 100% 3,320 100% 3,270 100% 134,450 100% 117,550 100%
Source: Lifelong Learning Wales Record 2006/07, 2007/08
Note: Figures may not sum due to rounding
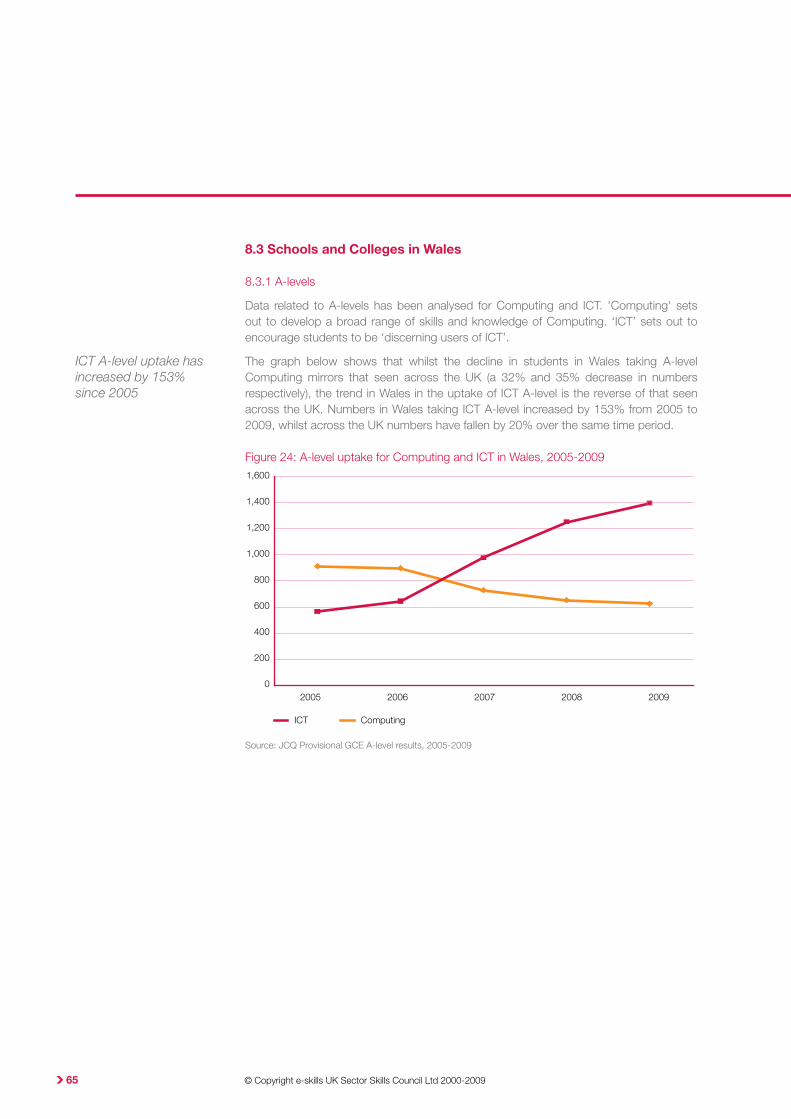
© Copyright e-skills UK Sector Skills Council Ltd 2000-2009 65
8.3 Schools and Colleges in Wales
8.3.1 A-levels
Data related to A-levels has been analysed for Computing and ICT. 'Computing' sets out to develop a broad range of skills and knowledge of Computing. ‘ICT’ sets out to encourage students to be ‘discerning users of ICT’.
The graph below shows that whilst the decline in students in Wales taking A-level Computing mirrors that seen across the UK (a 32% and 35% decrease in numbers respectively), the trend in Wales in the uptake of ICT A-level is the reverse of that seen across the UK. Numbers in Wales taking ICT A-level increased by 153% from 2005 to 2009, whilst across the UK numbers have fallen by 20% over the same time period.
Figure 24: A-level uptake for Computing and ICT in Wales, 2005-2009
Source: JCQ Provisional GCE A-level results, 2005-2009
Population (A)2,959,000
Workforce (B)1,248,000
Total IT & T industry
(C+D)18,600
IT & T professionals in IT & T industry
(C) 10,900 IT & T professionals in other sectors
(E) 25,500All other occupations in
the IT & T industry (D) 7,700
0.0
5.4South East England
London 5.4
3.6North West England
East of England 3.4
2.9West Midlands
Scotland 2.8
2.7Yorkshire & Humber
South West England 2.7
East Midlands 2.4
Wales 1.4
North East England 1.2
Northern Ireland 0.8
1.0 2.0 3.0 4.0 5.0 6.0
GVA (£bn)
Total IT & T workforce (C+D+E) 44,100
Total IT & T professionals (C+E) 36,400
0
25%
50%
75%
100%
1-10 11-49 50-199 200+
Workplaces Employees
0%
1%
2%
8%
8%
10%
13%
25%
33%
0 5% 10% 15% 20% 25% 35%30% 40%
Agriculture Forestry & Fishing
Energy & Water
Distribution, Hotels & Restaurants
Other services
Construction
Manufacturing
Public Administration, Education & Health
Banking & Finance
Transport & Communication
0
5,000
10,000
15,000
20,000
25,000
30,000
35,000
1992 1993 1994 1995 1996 1997 1998 1999 2000 2001 2002 2003 2004 2005 2006 2007 2008 2009
£600
£400
£200
£0
36%29%
24%30%
37%28% 27%
20%14%
35%39%
38% 23%16%
23%35%
35% 41%
24%
21%21%
29%34% 34%
31%
26%30%
12% 17% 18% 13% 14%6%
20%15%
0%
25%
50%
75%
100%
2001 2002 2003 2004 2005 2006 2007 2008 2009
16-29 30-39 40-49 50+
80%
70%
60%
50%
40%
30%
20%
10%
0%
ACLWBLFE
39%
61%
39%
61%56%
44%
57%
43%
28%
72%
28%
72%
FoundationTrends
1995 2000
Skill changes New skills
2005 2007 2010 2015 2020
Industrialisation of technology
Security and Data Protection
Communications convergence and integration
Innovation
Transformation through IT
The pool of talent and gender balance
Information and analytics
Consumerisation and convergence of IT
Green IT: environmental computing
Social Computing and Web 2.0
Digital Natives
Unemployment500
Retire160
Non IT&T Job Switcher
1,930
IT&T JobSwitcher
620
Look afterfamily
90
Become a student
220
Otherinactive
300
Job switcher fromIT & Telecomsoccupations
610
Entrants to IT & Telecoms occupations
3,520
Job switchers fromNon IT & Telecoms
occupations1,840
Unemployment580
Education660
Other Inactive440
NET change inemploymentOccupation
320
Gross JobOpportunities
4,130
ReplacementJobs3,810
Internet 2%
Database 4%
Networking 4%
Management 5%
SoftwareEngineering
7%
Technical/PC support
22%
Systems design/development
55%
47%
38%
44%
48%
82%
75%
71%
27%
22%
22%
9%
21%
26%
2%52%
35%
34%
29%
9%
4%
3%
Client/customer interaction skills
Other interpersonal skills
Business skills
Skills in general
Sector knowledge/experience
Other non-technical skills
Higher level technical IT skills
Below the level required Equal to the level required Above the level required
56%
57%
77%
69%
68%
68%
71%
15%
2%
15%
21%
23%
25%
15%29%
28%
21%
17%
12%
9%
4%
General software skills/knowledge
Email/Internet skills
Database skills
Overall IT user skills
General hardware skills/knowledge
Word-processing skills
Spreadsheet skills
Below the level required Equal to the level required Above the level required
0
30%
20%
10%
40%
50%
60%
Q2.01 Q2.02 Q2.03 Q2.04 Q2.05 Q2.06 Q2.07 Q2.08 Q2.09
All ICT staff All workers
29%Staff are new to the job/company
5%Staff cannot reach required skill levels even with training
77%Staff unable to train due to work commitments
41%New projects/products/ services being launched
5%Budgets/ lack of funds
60%Company doesn’t train/train enough
8%Other
69%New systems/processes/equipment introduced
48%Technical IT/Telecoms (professional level)
23%Management (other)
21%Management (IT/Telecoms related)
21%Other (IT/Telecoms related)
17%Personal development training
16%General company
15%IT User skills
15%Generic employment training
11%Function specific training
6%Other (general)
4%Finance
0
4,000
6,000
5,000
1,000
3,000
2,000
2002 2003 2004 2005 2006 2007 2008Year
0
5000
10,000
15,000
20,000
25,000
30,000
35,000
2002 2003 2004 2005 2006 2007 2008
G Group Accepts: Mathematical & Computing Science Computing Accepts
0
200
400
600
800
1,000
1,200
1,400
2002 2003 2004 2005 2006 2007 2008
39%Staff are new to the job/company
14%Staff cannot reach required skill levels even with training
64%Staff unable to train due to work commitments
53%New projects/products/ services being launched
1%Budgets/ lack of funds
56%Company doesn’t train/train enough
15%Other
48%New systems/processes/equipment introduced
0% 10% 20% 30% 40% 50% 60% 70% 80% 90% 100%
UK
South West
South East
London
East of England
West Midlands
East Midlands
Yorkshire & Humber
North West
North East
England
Scotland
Northern Ireland
Wales
Agriculture forestry and fishing Distribution Hotels & Restaurants Other services
Energy & Water Transport & Communication NA / DNA
Manufacturing Banking & Finance
Construction Public administration, Education & Health
ICT Managers/IT Strategy & Planning Professionals
Software Professionals
201820092001
45,000
30,000
15,000
05,900
6,700
12,700
11,700
11,400
12,900
13,600
13,900
12,800
IT Operations Technicians/IT User Support Technicians/Database Assistants & Clerks/Telecoms Engineers/Line Repairers & Cable Jointers/Computer Engineers
Computing & Telecoms Graduatesin employment (490)
IT & Telecoms industry: new graduate recruits (300)
IT & Telecoms professionals: new graduate recruits (445)
Graduates of subjects other than Computing & Telecoms (300) are shown in RedEntrants to the IT & Telecoms Workforce (560) are shown in italics
230
140100
15 120
60
125
10% 12
%
12%
12%
13% 14%
14%
14% 15
%
15%
16%
16%
17%
17%
17%
0
5%
10%
15%
20%
25%
30%
Aus
tria
Por
tuga
l
Italy
Nor
way
Pol
and
Slo
veni
a
Cze
ch R
epub
lic
Spa
in
Net
herla
nds
Slo
vaki
a
Ger
man
y
Den
mar
k
Irela
nd UK
Sw
eden
18%
Finl
and
21%
Hun
gary
23%
Rom
ania
23%
Bul
garia
18%
Wal
es
95%
4% 1% 1%
29%
13%
21%
36%
All IT & Telecoms Professionals
£500
£410
Average across Wales
£450
Average across the UK
1,080
Q2.08
1,200
Q3.08
990
Q4.08
770
Q1.09
640
Q2.09
Number of applicants to G Mathematical & Comp Sci (Group) in Wales
0
10,000
5,000
15,000
20,000
25,000
30,000
35,000
2002 2003 2004 2005 2006 2007 2008 2009
Year
IT P
rofe
ssio
nal w
orkf
orce
0
1,000
2,000
3,000
4,000
5,000
6,000
App
lican
ts
Applicants to Mathematical and Computer Science courses
IT Professional workforce
Some other way 2%
Training course - not organised/paid forby an employer 18%
Self-study using books, CD-ROMs, etc 21%
Training course - organised/paid for byan employer 30%
Formalised educational institution(school/college/university) 34%
Informal assistance from colleagues,relatives, friends etc 54%
Self-study (learning by doing) 59%
2006/07 2007/08 2006/07 2007/08 2006/07 2007/08
Male Female
100%
75%
50%
25%
0%
ACL TOTALWBLFE
55%
45%
57%
43%
87%
13%
77%
23%
39%
61%
35%
65%
55%
45%
56%
44%
2006/07 2007/08 2006/07 2007/08 2006/07 2007/08 2006/07 2007/08
Male Female
0
600
400
200
800
1,000
1,200
1,400
1,600
2005 2006 2007 2008 2009
ICT Computing
EmergingTrends
ICT A-level uptake has increased by 153% since 2005

© Copyright e-skills UK Sector Skills Council Ltd 2000-2009 66
8.3.2 GCSEs
Considering GCSE level education in Wales, there are a number of courses, including a GCSE in ICT, a GCSE double award in Applied ICT, and a short course GCSE in ICT.
Historically, numbers taking GCSE IT related courses in Wales has been in decline. However from 2008 to 2009 the number rose by 4%.
Table 23: Uptake of ICT GCSEs in Wales
Year ICT GCSE Applied ICT GCSE Short course ICT GCSE
2004 11,550 920 3,905
2005 11,120 1,060 4,320
2006 11,300 885 4,265
2007 10,880 455 4,170
2008 10,015 450 4,120
2009 10,290 455 4,425
Source: Joint Council for Qualifications
These GCSEs are focused on IT user skills, and thus not directly relevant to IT-related Higher Education or careers. However, there is an impact in terms of students’ understanding and attraction to IT in their future lives. A report from the Council for Professors and Heads of Computing (CPHC) concluded that ‘Many of the students who were taking neither Computing nor ICT at AS/A-level stated that their negative experience of GCSE ICT was a primary reason for this’.
A research study by e-skills UK came to a similar conclusion. 1,000 students were interviewed in a study to understand better the declining uptake of Computing degrees. Students reported that:
• Their image of IT-related degrees and careers was that they would be repetitive, boring and ‘more of the same’ - for example, the use of IT user office applications, such as word processing, spreadsheets and database software.
• The ICT GCSE had a major part to play in creating their (negative) perceptions. Respondents were often required by their school to take it, or they took it because they believed it to be an easier option than other GCSEs.
• However, IT at school prior to the GCSE curriculum was generally described as fun and interesting.

© Copyright e-skills UK Sector Skills Council Ltd 2000-2009 67
8.4 Gender
Whilst a gender imbalance is still prevalent on IT-related courses in Wales, it appears to be improving over time.
Table 24: Gender balance on IT-related courses in Wales
Country Qualification % of females
2003
% of females
2009
Variance
Wales ICT (Full Course) GCSE 44 45 1
UK ICT (Full Course) GCSE 40 45 5
Wales A-level Computing 18 22 4
UK A-level Computing 14 10 -4
Wales A-level ICT 31 46 15
UK A-level ICT 33 39 6
Wales IT & Telecoms professional occupations 22 17 -5
UK IT & Telecoms professional occupations 19 17 -2
Sources: DCSF, JCQ, UCAS, ONS LFS

© Copyright e-skills UK Sector Skills Council Ltd 2000-2009 68

© Copyright e-skills UK Sector Skills Council Ltd 2000-2009 69
This section sets out the key challenges Wales faces in terms of the IT user skills of the wider population.
9.1.1 Introduction
As the use of IT & Telecoms becomes ever more pervasive in the working environment, the need for (potential and existing) workers to continually develop and expand their IT user skills has become increasingly important. Without a rudimentary knowledge of IT even the most basic work activities are often unachievable whilst career progression is often not an option.
This section seeks to provide a better understanding of both the scale and nature of current development activity for IT users and assesses the adequacy of such actions in the light of current/future skills requirements voiced by employers.
9.1.2 Recruiters of IT users
Welsh employers responding to the e-skills UK 2009 employer survey indicated that (excluding vacancies for IT & Telecoms professionals) virtually all positions they were recruiting for (i.e. 96%) had a requirement that applicants hold at least some basic level of IT user skills. The extent to which applicant skills are matching up to those required by employers is variable however and for the UK at least a significant proportion of employers were found to have issues with not only the general hard/software skills of applicants but also specific application skills such as databases and spreadsheets for example.
Figure 25: Employer general views on the IT user skills of applicants for non-IT & Telecoms positions, UK
Source: e-skills UK 2009 employer survey
9.0 The wider population and use of IT
It is a near universal requirement that applicants for work in Wales should have some level of IT user skills
Population (A)2,959,000
Workforce (B)1,248,000
Total IT & T industry
(C+D)18,600
IT & T professionals in IT & T industry
(C) 10,900 IT & T professionals in other sectors
(E) 25,500All other occupations in
the IT & T industry (D) 7,700
0.0
5.4South East England
London 5.4
3.6North West England
East of England 3.4
2.9West Midlands
Scotland 2.8
2.7Yorkshire & Humber
South West England 2.7
East Midlands 2.4
Wales 1.4
North East England 1.2
Northern Ireland 0.8
1.0 2.0 3.0 4.0 5.0 6.0
GVA (£bn)
Total IT & T workforce (C+D+E) 44,100
Total IT & T professionals (C+E) 36,400
0
25%
50%
75%
100%
1-10 11-49 50-199 200+
Workplaces Employees
0%
1%
2%
8%
8%
10%
13%
25%
33%
0 5% 10% 15% 20% 25% 35%30% 40%
Agriculture Forestry & Fishing
Energy & Water
Distribution, Hotels & Restaurants
Other services
Construction
Manufacturing
Public Administration, Education & Health
Banking & Finance
Transport & Communication
0
5,000
10,000
15,000
20,000
25,000
30,000
35,000
1992 1993 1994 1995 1996 1997 1998 1999 2000 2001 2002 2003 2004 2005 2006 2007 2008 2009
£600
£400
£200
£0
36%29%
24%30%
37%28% 27%
20%14%
35%39%
38% 23%16%
23%35%
35% 41%
24%
21%21%
29%34% 34%
31%
26%30%
12% 17% 18% 13% 14%6%
20%15%
0%
25%
50%
75%
100%
2001 2002 2003 2004 2005 2006 2007 2008 2009
16-29 30-39 40-49 50+
80%
70%
60%
50%
40%
30%
20%
10%
0%
ACLWBLFE
39%
61%
39%
61%56%
44%
57%
43%
28%
72%
28%
72%
FoundationTrends
1995 2000
Skill changes New skills
2005 2007 2010 2015 2020
Industrialisation of technology
Security and Data Protection
Communications convergence and integration
Innovation
Transformation through IT
The pool of talent and gender balance
Information and analytics
Consumerisation and convergence of IT
Green IT: environmental computing
Social Computing and Web 2.0
Digital Natives
Unemployment500
Retire160
Non IT&T Job Switcher
1,930
IT&T JobSwitcher
620
Look afterfamily
90
Become a student
220
Otherinactive
300
Job switcher fromIT & Telecomsoccupations
610
Entrants to IT & Telecoms occupations
3,520
Job switchers fromNon IT & Telecoms
occupations1,840
Unemployment580
Education660
Other Inactive440
NET change inemploymentOccupation
320
Gross JobOpportunities
4,130
ReplacementJobs3,810
Internet 2%
Database 4%
Networking 4%
Management 5%
SoftwareEngineering
7%
Technical/PC support
22%
Systems design/development
55%
47%
38%
44%
48%
82%
75%
71%
27%
22%
22%
9%
21%
26%
2%52%
35%
34%
29%
9%
4%
3%
Client/customer interaction skills
Other interpersonal skills
Business skills
Skills in general
Sector knowledge/experience
Other non-technical skills
Higher level technical IT skills
Below the level required Equal to the level required Above the level required
56%
57%
77%
69%
68%
68%
71%
15%
2%
15%
21%
23%
25%
15%29%
28%
21%
17%
12%
9%
4%
General software skills/knowledge
Email/Internet skills
Database skills
Overall IT user skills
General hardware skills/knowledge
Word-processing skills
Spreadsheet skills
Below the level required Equal to the level required Above the level required
0
30%
20%
10%
40%
50%
60%
Q2.01 Q2.02 Q2.03 Q2.04 Q2.05 Q2.06 Q2.07 Q2.08 Q2.09
All ICT staff All workers
29%Staff are new to the job/company
5%Staff cannot reach required skill levels even with training
77%Staff unable to train due to work commitments
41%New projects/products/ services being launched
5%Budgets/ lack of funds
60%Company doesn’t train/train enough
8%Other
69%New systems/processes/equipment introduced
48%Technical IT/Telecoms (professional level)
23%Management (other)
21%Management (IT/Telecoms related)
21%Other (IT/Telecoms related)
17%Personal development training
16%General company
15%IT User skills
15%Generic employment training
11%Function specific training
6%Other (general)
4%Finance
0
4,000
6,000
5,000
1,000
3,000
2,000
2002 2003 2004 2005 2006 2007 2008Year
0
5000
10,000
15,000
20,000
25,000
30,000
35,000
2002 2003 2004 2005 2006 2007 2008
G Group Accepts: Mathematical & Computing Science Computing Accepts
0
200
400
600
800
1,000
1,200
1,400
2002 2003 2004 2005 2006 2007 2008
39%Staff are new to the job/company
14%Staff cannot reach required skill levels even with training
64%Staff unable to train due to work commitments
53%New projects/products/ services being launched
1%Budgets/ lack of funds
56%Company doesn’t train/train enough
15%Other
48%New systems/processes/equipment introduced
0% 10% 20% 30% 40% 50% 60% 70% 80% 90% 100%
UK
South West
South East
London
East of England
West Midlands
East Midlands
Yorkshire & Humber
North West
North East
England
Scotland
Northern Ireland
Wales
Agriculture forestry and fishing Distribution Hotels & Restaurants Other services
Energy & Water Transport & Communication NA / DNA
Manufacturing Banking & Finance
Construction Public administration, Education & Health
ICT Managers/IT Strategy & Planning Professionals
Software Professionals
201820092001
45,000
30,000
15,000
05,900
6,700
12,700
11,700
11,400
12,900
13,600
13,900
12,800
IT Operations Technicians/IT User Support Technicians/Database Assistants & Clerks/Telecoms Engineers/Line Repairers & Cable Jointers/Computer Engineers
Computing & Telecoms Graduatesin employment (490)
IT & Telecoms industry: new graduate recruits (300)
IT & Telecoms professionals: new graduate recruits (445)
Graduates of subjects other than Computing & Telecoms (300) are shown in RedEntrants to the IT & Telecoms Workforce (560) are shown in italics
230
140100
15 120
60
125
10% 12
%
12%
12%
13% 14%
14%
14% 15
%
15%
16%
16%
17%
17%
17%
0
5%
10%
15%
20%
25%
30%
Aus
tria
Por
tuga
l
Italy
Nor
way
Pol
and
Slo
veni
a
Cze
ch R
epub
lic
Spa
in
Net
herla
nds
Slo
vaki
a
Ger
man
y
Den
mar
k
Irela
nd UK
Sw
eden
18%
Finl
and
21%
Hun
gary
23%
Rom
ania
23%
Bul
garia
18%
Wal
es
95%
4% 1% 1%
29%
13%
21%
36%
All IT & Telecoms Professionals
£500
£410
Average across Wales
£450
Average across the UK
1,080
Q2.08
1,200
Q3.08
990
Q4.08
770
Q1.09
640
Q2.09
Number of applicants to G Mathematical & Comp Sci (Group) in Wales
0
10,000
5,000
15,000
20,000
25,000
30,000
35,000
2002 2003 2004 2005 2006 2007 2008 2009
Year
IT P
rofe
ssio
nal w
orkf
orce
0
1,000
2,000
3,000
4,000
5,000
6,000
App
lican
ts
Applicants to Mathematical and Computer Science courses
IT Professional workforce
Some other way 2%
Training course - not organised/paid forby an employer 18%
Self-study using books, CD-ROMs, etc 21%
Training course - organised/paid for byan employer 30%
Formalised educational institution(school/college/university) 34%
Informal assistance from colleagues,relatives, friends etc 54%
Self-study (learning by doing) 59%
2006/07 2007/08 2006/07 2007/08 2006/07 2007/08
Male Female
100%
75%
50%
25%
0%
ACL TOTALWBLFE
55%
45%
57%
43%
87%
13%
77%
23%
39%
61%
35%
65%
55%
45%
56%
44%
2006/07 2007/08 2006/07 2007/08 2006/07 2007/08 2006/07 2007/08
Male Female
0
600
400
200
800
1,000
1,200
1,400
1,600
2005 2006 2007 2008 2009
ICT Computing
EmergingTrends
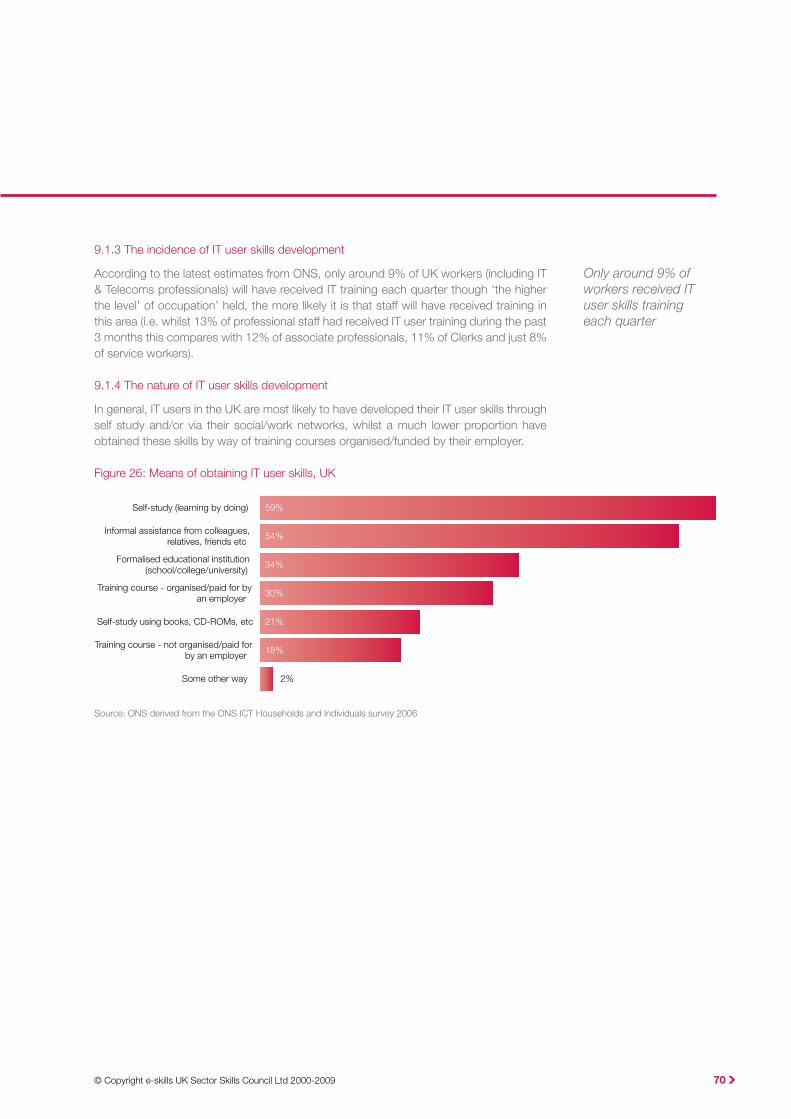
© Copyright e-skills UK Sector Skills Council Ltd 2000-2009 70
9.1.3 The incidence of IT user skills development
According to the latest estimates from ONS, only around 9% of UK workers (including IT & Telecoms professionals) will have received IT training each quarter though ‘the higher the level’ of occupation’ held, the more likely it is that staff will have received training in this area (i.e. whilst 13% of professional staff had received IT user training during the past 3 months this compares with 12% of associate professionals, 11% of Clerks and just 8% of service workers).
9.1.4 The nature of IT user skills development
In general, IT users in the UK are most likely to have developed their IT user skills through self study and/or via their social/work networks, whilst a much lower proportion have obtained these skills by way of training courses organised/funded by their employer.
Figure 26: Means of obtaining IT user skills, UK
Source: ONS derived from the ONS ICT Households and Individuals survey 2006
Only around 9% of workers received IT user skills training each quarter
Population (A)2,959,000
Workforce (B)1,248,000
Total IT & T industry
(C+D)18,600
IT & T professionals in IT & T industry
(C) 10,900 IT & T professionals in other sectors
(E) 25,500All other occupations in
the IT & T industry (D) 7,700
0.0
5.4South East England
London 5.4
3.6North West England
East of England 3.4
2.9West Midlands
Scotland 2.8
2.7Yorkshire & Humber
South West England 2.7
East Midlands 2.4
Wales 1.4
North East England 1.2
Northern Ireland 0.8
1.0 2.0 3.0 4.0 5.0 6.0
GVA (£bn)
Total IT & T workforce (C+D+E) 44,100
Total IT & T professionals (C+E) 36,400
0
25%
50%
75%
100%
1-10 11-49 50-199 200+
Workplaces Employees
0%
1%
2%
8%
8%
10%
13%
25%
33%
0 5% 10% 15% 20% 25% 35%30% 40%
Agriculture Forestry & Fishing
Energy & Water
Distribution, Hotels & Restaurants
Other services
Construction
Manufacturing
Public Administration, Education & Health
Banking & Finance
Transport & Communication
0
5,000
10,000
15,000
20,000
25,000
30,000
35,000
1992 1993 1994 1995 1996 1997 1998 1999 2000 2001 2002 2003 2004 2005 2006 2007 2008 2009
£600
£400
£200
£0
36%29%
24%30%
37%28% 27%
20%14%
35%39%
38% 23%16%
23%35%
35% 41%
24%
21%21%
29%34% 34%
31%
26%30%
12% 17% 18% 13% 14%6%
20%15%
0%
25%
50%
75%
100%
2001 2002 2003 2004 2005 2006 2007 2008 2009
16-29 30-39 40-49 50+
80%
70%
60%
50%
40%
30%
20%
10%
0%
ACLWBLFE
39%
61%
39%
61%56%
44%
57%
43%
28%
72%
28%
72%
FoundationTrends
1995 2000
Skill changes New skills
2005 2007 2010 2015 2020
Industrialisation of technology
Security and Data Protection
Communications convergence and integration
Innovation
Transformation through IT
The pool of talent and gender balance
Information and analytics
Consumerisation and convergence of IT
Green IT: environmental computing
Social Computing and Web 2.0
Digital Natives
Unemployment500
Retire160
Non IT&T Job Switcher
1,930
IT&T JobSwitcher
620
Look afterfamily
90
Become a student
220
Otherinactive
300
Job switcher fromIT & Telecomsoccupations
610
Entrants to IT & Telecoms occupations
3,520
Job switchers fromNon IT & Telecoms
occupations1,840
Unemployment580
Education660
Other Inactive440
NET change inemploymentOccupation
320
Gross JobOpportunities
4,130
ReplacementJobs3,810
Internet 2%
Database 4%
Networking 4%
Management 5%
SoftwareEngineering
7%
Technical/PC support
22%
Systems design/development
55%
47%
38%
44%
48%
82%
75%
71%
27%
22%
22%
9%
21%
26%
2%52%
35%
34%
29%
9%
4%
3%
Client/customer interaction skills
Other interpersonal skills
Business skills
Skills in general
Sector knowledge/experience
Other non-technical skills
Higher level technical IT skills
Below the level required Equal to the level required Above the level required
56%
57%
77%
69%
68%
68%
71%
15%
2%
15%
21%
23%
25%
15%29%
28%
21%
17%
12%
9%
4%
General software skills/knowledge
Email/Internet skills
Database skills
Overall IT user skills
General hardware skills/knowledge
Word-processing skills
Spreadsheet skills
Below the level required Equal to the level required Above the level required
0
30%
20%
10%
40%
50%
60%
Q2.01 Q2.02 Q2.03 Q2.04 Q2.05 Q2.06 Q2.07 Q2.08 Q2.09
All ICT staff All workers
29%Staff are new to the job/company
5%Staff cannot reach required skill levels even with training
77%Staff unable to train due to work commitments
41%New projects/products/ services being launched
5%Budgets/ lack of funds
60%Company doesn’t train/train enough
8%Other
69%New systems/processes/equipment introduced
48%Technical IT/Telecoms (professional level)
23%Management (other)
21%Management (IT/Telecoms related)
21%Other (IT/Telecoms related)
17%Personal development training
16%General company
15%IT User skills
15%Generic employment training
11%Function specific training
6%Other (general)
4%Finance
0
4,000
6,000
5,000
1,000
3,000
2,000
2002 2003 2004 2005 2006 2007 2008Year
0
5000
10,000
15,000
20,000
25,000
30,000
35,000
2002 2003 2004 2005 2006 2007 2008
G Group Accepts: Mathematical & Computing Science Computing Accepts
0
200
400
600
800
1,000
1,200
1,400
2002 2003 2004 2005 2006 2007 2008
39%Staff are new to the job/company
14%Staff cannot reach required skill levels even with training
64%Staff unable to train due to work commitments
53%New projects/products/ services being launched
1%Budgets/ lack of funds
56%Company doesn’t train/train enough
15%Other
48%New systems/processes/equipment introduced
0% 10% 20% 30% 40% 50% 60% 70% 80% 90% 100%
UK
South West
South East
London
East of England
West Midlands
East Midlands
Yorkshire & Humber
North West
North East
England
Scotland
Northern Ireland
Wales
Agriculture forestry and fishing Distribution Hotels & Restaurants Other services
Energy & Water Transport & Communication NA / DNA
Manufacturing Banking & Finance
Construction Public administration, Education & Health
ICT Managers/IT Strategy & Planning Professionals
Software Professionals
201820092001
45,000
30,000
15,000
05,900
6,700
12,700
11,700
11,400
12,900
13,600
13,900
12,800
IT Operations Technicians/IT User Support Technicians/Database Assistants & Clerks/Telecoms Engineers/Line Repairers & Cable Jointers/Computer Engineers
Computing & Telecoms Graduatesin employment (490)
IT & Telecoms industry: new graduate recruits (300)
IT & Telecoms professionals: new graduate recruits (445)
Graduates of subjects other than Computing & Telecoms (300) are shown in RedEntrants to the IT & Telecoms Workforce (560) are shown in italics
230
140100
15 120
60
125
10% 12
%
12%
12%
13% 14%
14%
14% 15
%
15%
16%
16%
17%
17%
17%
0
5%
10%
15%
20%
25%
30%
Aus
tria
Por
tuga
l
Italy
Nor
way
Pol
and
Slo
veni
a
Cze
ch R
epub
lic
Spa
in
Net
herla
nds
Slo
vaki
a
Ger
man
y
Den
mar
k
Irela
nd UK
Sw
eden
18%
Finl
and
21%
Hun
gary
23%
Rom
ania
23%
Bul
garia
18%
Wal
es
95%
4% 1% 1%
29%
13%
21%
36%
All IT & Telecoms Professionals
£500
£410
Average across Wales
£450
Average across the UK
1,080
Q2.08
1,200
Q3.08
990
Q4.08
770
Q1.09
640
Q2.09
Number of applicants to G Mathematical & Comp Sci (Group) in Wales
0
10,000
5,000
15,000
20,000
25,000
30,000
35,000
2002 2003 2004 2005 2006 2007 2008 2009
Year
IT P
rofe
ssio
nal w
orkf
orce
0
1,000
2,000
3,000
4,000
5,000
6,000
App
lican
ts
Applicants to Mathematical and Computer Science courses
IT Professional workforce
Some other way 2%
Training course - not organised/paid forby an employer 18%
Self-study using books, CD-ROMs, etc 21%
Training course - organised/paid for byan employer 30%
Formalised educational institution(school/college/university) 34%
Informal assistance from colleagues,relatives, friends etc 54%
Self-study (learning by doing) 59%
2006/07 2007/08 2006/07 2007/08 2006/07 2007/08
Male Female
100%
75%
50%
25%
0%
ACL TOTALWBLFE
55%
45%
57%
43%
87%
13%
77%
23%
39%
61%
35%
65%
55%
45%
56%
44%
2006/07 2007/08 2006/07 2007/08 2006/07 2007/08 2006/07 2007/08
Male Female
0
600
400
200
800
1,000
1,200
1,400
1,600
2005 2006 2007 2008 2009
ICT Computing
EmergingTrends
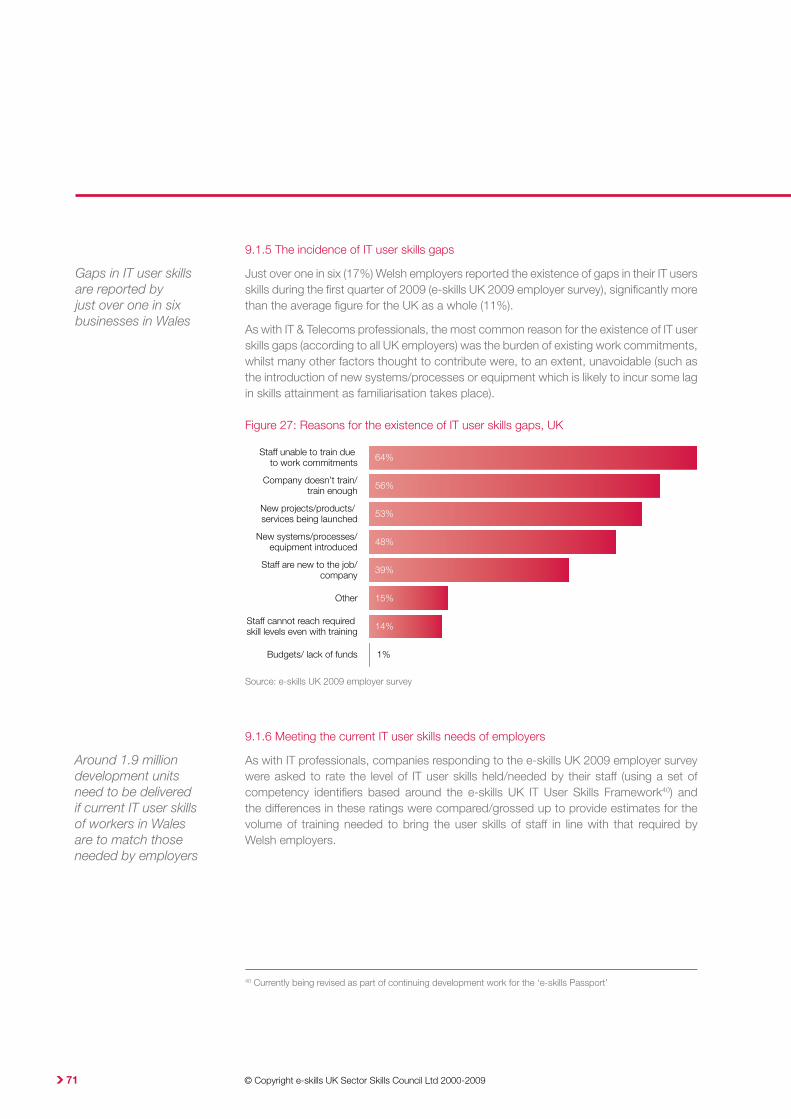
© Copyright e-skills UK Sector Skills Council Ltd 2000-2009 71
9.1.5 The incidence of IT user skills gaps
Just over one in six (17%) Welsh employers reported the existence of gaps in their IT users skills during the first quarter of 2009 (e-skills UK 2009 employer survey), significantly more than the average figure for the UK as a whole (11%).
As with IT & Telecoms professionals, the most common reason for the existence of IT user skills gaps (according to all UK employers) was the burden of existing work commitments, whilst many other factors thought to contribute were, to an extent, unavoidable (such as the introduction of new systems/processes or equipment which is likely to incur some lag in skills attainment as familiarisation takes place).
Figure 27: Reasons for the existence of IT user skills gaps, UK
Source: e-skills UK 2009 employer survey
9.1.6 Meeting the current IT user skills needs of employers
As with IT professionals, companies responding to the e-skills UK 2009 employer survey were asked to rate the level of IT user skills held/needed by their staff (using a set of competency identifiers based around the e-skills UK IT User Skills Framework40) and the differences in these ratings were compared/grossed up to provide estimates for the volume of training needed to bring the user skills of staff in line with that required by Welsh employers.
Gaps in IT user skills are reported by just over one in six businesses in Wales
40 Currently being revised as part of continuing development work for the ‘e-skills Passport’
Around 1.9 million development units need to be delivered if current IT user skills of workers in Wales are to match those needed by employers
Population (A)2,959,000
Workforce (B)1,248,000
Total IT & T industry
(C+D)18,600
IT & T professionals in IT & T industry
(C) 10,900 IT & T professionals in other sectors
(E) 25,500All other occupations in
the IT & T industry (D) 7,700
0.0
5.4South East England
London 5.4
3.6North West England
East of England 3.4
2.9West Midlands
Scotland 2.8
2.7Yorkshire & Humber
South West England 2.7
East Midlands 2.4
Wales 1.4
North East England 1.2
Northern Ireland 0.8
1.0 2.0 3.0 4.0 5.0 6.0
GVA (£bn)
Total IT & T workforce (C+D+E) 44,100
Total IT & T professionals (C+E) 36,400
0
25%
50%
75%
100%
1-10 11-49 50-199 200+
Workplaces Employees
0%
1%
2%
8%
8%
10%
13%
25%
33%
0 5% 10% 15% 20% 25% 35%30% 40%
Agriculture Forestry & Fishing
Energy & Water
Distribution, Hotels & Restaurants
Other services
Construction
Manufacturing
Public Administration, Education & Health
Banking & Finance
Transport & Communication
0
5,000
10,000
15,000
20,000
25,000
30,000
35,000
1992 1993 1994 1995 1996 1997 1998 1999 2000 2001 2002 2003 2004 2005 2006 2007 2008 2009
£600
£400
£200
£0
36%29%
24%30%
37%28% 27%
20%14%
35%39%
38% 23%16%
23%35%
35% 41%
24%
21%21%
29%34% 34%
31%
26%30%
12% 17% 18% 13% 14%6%
20%15%
0%
25%
50%
75%
100%
2001 2002 2003 2004 2005 2006 2007 2008 2009
16-29 30-39 40-49 50+
80%
70%
60%
50%
40%
30%
20%
10%
0%
ACLWBLFE
39%
61%
39%
61%56%
44%
57%
43%
28%
72%
28%
72%
FoundationTrends
1995 2000
Skill changes New skills
2005 2007 2010 2015 2020
Industrialisation of technology
Security and Data Protection
Communications convergence and integration
Innovation
Transformation through IT
The pool of talent and gender balance
Information and analytics
Consumerisation and convergence of IT
Green IT: environmental computing
Social Computing and Web 2.0
Digital Natives
Unemployment500
Retire160
Non IT&T Job Switcher
1,930
IT&T JobSwitcher
620
Look afterfamily
90
Become a student
220
Otherinactive
300
Job switcher fromIT & Telecomsoccupations
610
Entrants to IT & Telecoms occupations
3,520
Job switchers fromNon IT & Telecoms
occupations1,840
Unemployment580
Education660
Other Inactive440
NET change inemploymentOccupation
320
Gross JobOpportunities
4,130
ReplacementJobs3,810
Internet 2%
Database 4%
Networking 4%
Management 5%
SoftwareEngineering
7%
Technical/PC support
22%
Systems design/development
55%
47%
38%
44%
48%
82%
75%
71%
27%
22%
22%
9%
21%
26%
2%52%
35%
34%
29%
9%
4%
3%
Client/customer interaction skills
Other interpersonal skills
Business skills
Skills in general
Sector knowledge/experience
Other non-technical skills
Higher level technical IT skills
Below the level required Equal to the level required Above the level required
56%
57%
77%
69%
68%
68%
71%
15%
2%
15%
21%
23%
25%
15%29%
28%
21%
17%
12%
9%
4%
General software skills/knowledge
Email/Internet skills
Database skills
Overall IT user skills
General hardware skills/knowledge
Word-processing skills
Spreadsheet skills
Below the level required Equal to the level required Above the level required
0
30%
20%
10%
40%
50%
60%
Q2.01 Q2.02 Q2.03 Q2.04 Q2.05 Q2.06 Q2.07 Q2.08 Q2.09
All ICT staff All workers
29%Staff are new to the job/company
5%Staff cannot reach required skill levels even with training
77%Staff unable to train due to work commitments
41%New projects/products/ services being launched
5%Budgets/ lack of funds
60%Company doesn’t train/train enough
8%Other
69%New systems/processes/equipment introduced
48%Technical IT/Telecoms (professional level)
23%Management (other)
21%Management (IT/Telecoms related)
21%Other (IT/Telecoms related)
17%Personal development training
16%General company
15%IT User skills
15%Generic employment training
11%Function specific training
6%Other (general)
4%Finance
0
4,000
6,000
5,000
1,000
3,000
2,000
2002 2003 2004 2005 2006 2007 2008Year
0
5000
10,000
15,000
20,000
25,000
30,000
35,000
2002 2003 2004 2005 2006 2007 2008
G Group Accepts: Mathematical & Computing Science Computing Accepts
0
200
400
600
800
1,000
1,200
1,400
2002 2003 2004 2005 2006 2007 2008
39%Staff are new to the job/company
14%Staff cannot reach required skill levels even with training
64%Staff unable to train due to work commitments
53%New projects/products/ services being launched
1%Budgets/ lack of funds
56%Company doesn’t train/train enough
15%Other
48%New systems/processes/equipment introduced
0% 10% 20% 30% 40% 50% 60% 70% 80% 90% 100%
UK
South West
South East
London
East of England
West Midlands
East Midlands
Yorkshire & Humber
North West
North East
England
Scotland
Northern Ireland
Wales
Agriculture forestry and fishing Distribution Hotels & Restaurants Other services
Energy & Water Transport & Communication NA / DNA
Manufacturing Banking & Finance
Construction Public administration, Education & Health
ICT Managers/IT Strategy & Planning Professionals
Software Professionals
201820092001
45,000
30,000
15,000
05,900
6,700
12,700
11,700
11,400
12,900
13,600
13,900
12,800
IT Operations Technicians/IT User Support Technicians/Database Assistants & Clerks/Telecoms Engineers/Line Repairers & Cable Jointers/Computer Engineers
Computing & Telecoms Graduatesin employment (490)
IT & Telecoms industry: new graduate recruits (300)
IT & Telecoms professionals: new graduate recruits (445)
Graduates of subjects other than Computing & Telecoms (300) are shown in RedEntrants to the IT & Telecoms Workforce (560) are shown in italics
230
140100
15 120
60
125
10% 12
%
12%
12%
13% 14%
14%
14% 15
%
15%
16%
16%
17%
17%
17%
0
5%
10%
15%
20%
25%
30%
Aus
tria
Por
tuga
l
Italy
Nor
way
Pol
and
Slo
veni
a
Cze
ch R
epub
lic
Spa
in
Net
herla
nds
Slo
vaki
a
Ger
man
y
Den
mar
k
Irela
nd UK
Sw
eden
18%
Finl
and
21%
Hun
gary
23%
Rom
ania
23%
Bul
garia
18%
Wal
es
95%
4% 1% 1%
29%
13%
21%
36%
All IT & Telecoms Professionals
£500
£410
Average across Wales
£450
Average across the UK
1,080
Q2.08
1,200
Q3.08
990
Q4.08
770
Q1.09
640
Q2.09
Number of applicants to G Mathematical & Comp Sci (Group) in Wales
0
10,000
5,000
15,000
20,000
25,000
30,000
35,000
2002 2003 2004 2005 2006 2007 2008 2009
YearIT
Pro
fess
iona
l wor
kfor
ce
0
1,000
2,000
3,000
4,000
5,000
6,000
App
lican
ts
Applicants to Mathematical and Computer Science courses
IT Professional workforce
Some other way 2%
Training course - not organised/paid forby an employer 18%
Self-study using books, CD-ROMs, etc 21%
Training course - organised/paid for byan employer 30%
Formalised educational institution(school/college/university) 34%
Informal assistance from colleagues,relatives, friends etc 54%
Self-study (learning by doing) 59%
2006/07 2007/08 2006/07 2007/08 2006/07 2007/08
Male Female
100%
75%
50%
25%
0%
ACL TOTALWBLFE
55%
45%
57%
43%
87%
13%
77%
23%
39%
61%
35%
65%
55%
45%
56%
44%
2006/07 2007/08 2006/07 2007/08 2006/07 2007/08 2006/07 2007/08
Male Female
0
600
400
200
800
1,000
1,200
1,400
1,600
2005 2006 2007 2008 2009
ICT Computing
EmergingTrends
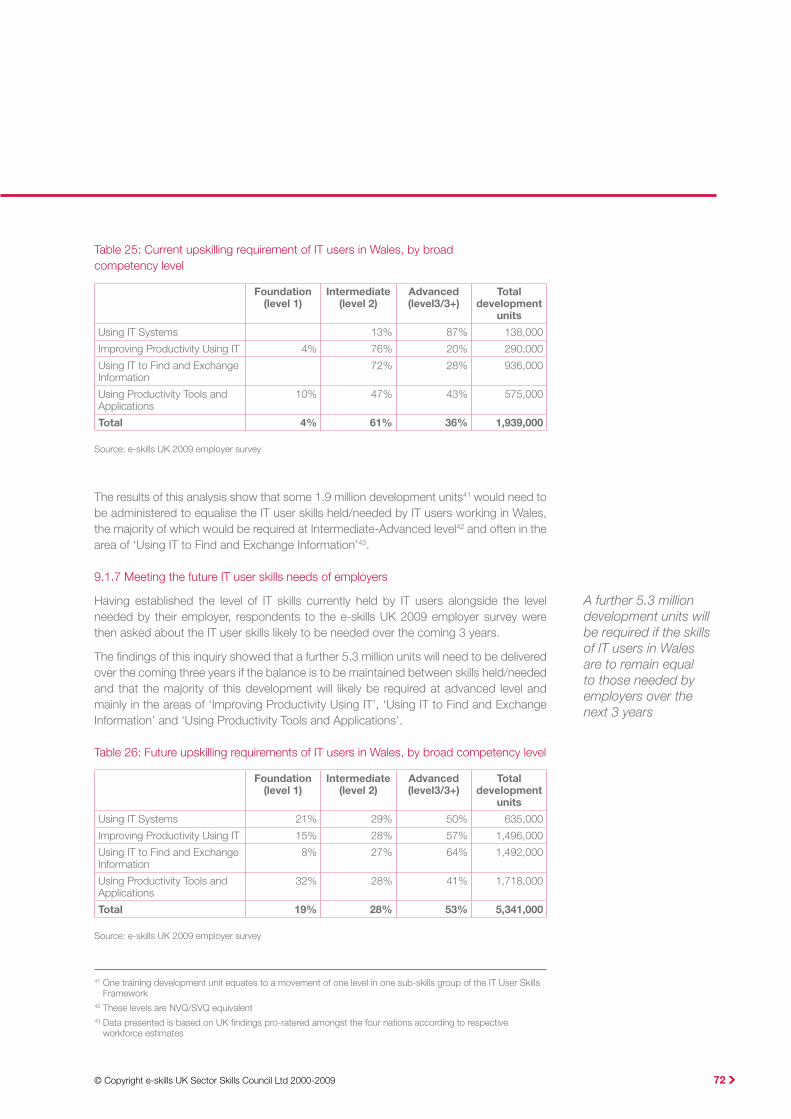
© Copyright e-skills UK Sector Skills Council Ltd 2000-2009 72
Table 25: Current upskilling requirement of IT users in Wales, by broad competency level
Foundation (level 1)
Intermediate (level 2)
Advanced (level3/3+)
Total development
units
Using IT Systems 13% 87% 138,000
Improving Productivity Using IT 4% 76% 20% 290,000
Using IT to Find and Exchange Information
72% 28% 936,000
Using Productivity Tools and Applications
10% 47% 43% 575,000
Total 4% 61% 36% 1,939,000
Source: e-skills UK 2009 employer survey
The results of this analysis show that some 1.9 million development units41 would need to be administered to equalise the IT user skills held/needed by IT users working in Wales, the majority of which would be required at Intermediate-Advanced level42 and often in the area of ‘Using IT to Find and Exchange Information’43.
9.1.7 Meeting the future IT user skills needs of employers
Having established the level of IT skills currently held by IT users alongside the level needed by their employer, respondents to the e-skills UK 2009 employer survey were then asked about the IT user skills likely to be needed over the coming 3 years.
The findings of this inquiry showed that a further 5.3 million units will need to be delivered over the coming three years if the balance is to be maintained between skills held/needed and that the majority of this development will likely be required at advanced level and mainly in the areas of ‘Improving Productivity Using IT’, ‘Using IT to Find and Exchange Information’ and ‘Using Productivity Tools and Applications’.
Table 26: Future upskilling requirements of IT users in Wales, by broad competency level
Foundation (level 1)
Intermediate (level 2)
Advanced (level3/3+)
Total development
units
Using IT Systems 21% 29% 50% 635,000
Improving Productivity Using IT 15% 28% 57% 1,496,000
Using IT to Find and Exchange Information
8% 27% 64% 1,492,000
Using Productivity Tools and Applications
32% 28% 41% 1,718,000
Total 19% 28% 53% 5,341,000
Source: e-skills UK 2009 employer survey
41 One training development unit equates to a movement of one level in one sub-skills group of the IT User Skills Framework
42 These levels are NVQ/SVQ equivalent43 Data presented is based on UK findings pro-ratered amongst the four nations according to respective
workforce estimates
A further 5.3 million development units will be required if the skills of IT users in Wales are to remain equal to those needed by employers over the next 3 years

© Copyright e-skills UK Sector Skills Council Ltd 2000-2009 73
e-skills UK has been licensed as directly responsible for IT & Telecoms professionals in all sectors and using the Office for National Statistics (ONS) Standard Occupational Classification (SOC) codes the following table sets out these occupations for which e-skills UK has exclusive responsibility:
SOC (2000) Summary Related Job Titles
1136 INFORMATION AND COMMUNICATION TECHNOLOGY MANAGERS
Job holders in this unit group plan, organise, direct and co-ordinate the work necessary to operate and provide information communication technology services, to maintain and develop associated network facilities and to provide software and hardware support
Computer manager, Computer operations manager
Data processing manager, IT manager
Systems manager
Telecoms manager
2131 IT STRATEGY AND PLANNING PROFESSIONALS
IT Strategy & Planning professionals provide advice on the effective utilisation of information technology in order to solve business problems or to enhance the effectiveness of business functions.
Computer consultant
Software consultant
2132 SOFTWARE PROFESSIONALS
Software Professionals are responsible for all aspects of the design, application, development and operation of software systems.
Analyst-programmer
Computer programmer
Software engineer
Systems analyst
Systems designer
Games developer
Web designer/developer
3131 IT OPERATIONS TECHNICIANS
IT Operations Technicians are responsible for the day-to-day running of computer systems and networks including the preparation of backup systems, and for performing regular checks to ensure the smooth functioning of such systems
Computer operator
Database manager
IT technician
Network technician
Systems administrator
Web master
3132 IT USER SUPPORT TECHNICIANS
IT User Support Technicians are responsible for providing technical support, advice and guidance for customers or IT users within an organisation, either directly or by telephone, e-mail or other network interaction
Help desk operator
Helpline operator (computing)
IT helpline support officer
Support technician (computing)
Systems support officer
Annex A: IT & Telecoms Professional Occupations

© Copyright e-skills UK Sector Skills Council Ltd 2000-2009 74
4136 DATABASE ASSISTANTS/CLERKS
Database Assistants and Clerks create, maintain, preserve and update information held in electronic databases, computer files, voice-mailboxes and email systems
Computer clerk
Data entry clerk
Data processor
VDU operator
5245 COMPUTER ENGINEERS, INSTALLATION AND MAINTENANCE
Computer Engineers install, maintain and repair personal computers, mainframe and other computer hardware
Computer engineer
Computer maintenance engineer
Computer service engineer
Computer service technician
5242 TELECOMMUNICATIONS ENGINEERS
Telecommunications Engineers install, maintain and repair public and private telephone systems.
Technical officer (telecommunications)
Telecommunications engineer
Telephone engineer
Telephone installation engineer
Telephone technician
5243 LINE REPAIRERS AND CABLE JOINTERS
Line Repairers and Cable Jointers install, maintain, test and repair overhead, underground, surface and submarine electricity and telecommunications cables.
Cable jointer
Cable repairer (electric)
Overhead linesman

© Copyright e-skills UK Sector Skills Council Ltd 2000-2009 75
Using the SIC definitions of 2003 and 2007 the following table sets out the SIC codes within e-skills UK’s core footprint i.e. the industry sector(s) for which e-skills UK has been exclusively licensed.
SIC 2003 SIC 2007
22.33 Reproduction of computer media 18.20/3 Reproduction of computer media
64.2 Telecommunications 58.2 Software Publishing
72 Computer and Related Activities 58.21 Publishing of computer games
72.1 Hardware consultancy 58.29 Other Software publishing
72.2 Software consultancy & supply 61 Telecommunications
72.21 Publishing of software 61.1 Wired telecommunications activities
72.22 Other software consultancy & supply 61.2 Wireless telecommunications activities
72.3 Data processing 61.3 Satellite telecommunications activities
72.4 Database activities 61.9 Other telecommunications activities
72.5 Maintenance and repair of office, accounting and computing machinery
62 Computer programming, consultancy and related activities
72.6 Other computer related activities 62.01 Computer programming activities
62.01/1 Ready-made interactive leisure and entertainment software development
62.01/2 Business and domestic software development
62.02 Computer consultancy activities
62.03 Computer facilities management activities
62.09 Other information technology activities
63.1 Data processing, hosting and related activities; web portals
63.11 Data processing, hosting and related activities
63.12 Web portals
95.1 Repair of computers and communications equipment
95.11 Repair of computers and peripheral equipment
95.12 Repair of communication equipment
Annex B: IT & Telecoms Industrial Classifications

© Copyright e-skills UK Sector Skills Council Ltd 2000-2009 76
Other relevant SIC Codes
e-skills UK has an interest in the elements of management consultancy concerned with technology and business change:
70.22/9 Management consultancy activities (other than financial management)
e-skills UK has a shared interest in technology manufacturing, which is owned by SEMTA:
26.2 Manufacture of computers and peripheral equipment
26.20 Manufacture of computers and peripheral equipment
26.3 Manufacture of communication equipment
26.30 Manufacture of communication equipment
26.30/1 Manufacture of telegraph and telephone apparatus and equipment
26.30/9 Manufacture of communication equipment (other than telegraph and telephone apparatus and equipment)
27.31 Manufacture of fibre optic cables
Other codes of relevance but less direct interest to e-skills UK include wholesale and retail sale of ICT equipment (owned by Skills for Logistics and Skillsmart respectively):
46.5 Wholesale of Information and Communication Equipment
46.51 Wholesale of computers, computer peripheral equipment and software
46.52 Wholesale of electronic and telecommunications equipment and parts
47.4 Retail sale of information and communication equipment in specialised stores
47.41 Retail sale of computers, peripheral units and software in specialised stores
47.42 Retail sale of telecommunications equipment in specialised stores
47.42/1 Retail sale of mobile telephones in specialised stores
47.42/9 Retail sale of telecommunications equipment (other than mobile telephones) not elsewhere classified in specialised stores
CPHC Conference of Professors and Heads of Computing

© Copyright e-skills UK Sector Skills Council Ltd 2000-2009 77
DCSF Department for Children, Schools and Families
DLHE Destination of Leavers from Higher Education
FE Further Education
GCSE General Certificate of Secondary Education
GVA Gross Value Added44
HE Higher Education
HEI Higher Education Institution
HESA Higher Education Statistics Agency
HND Higher National Diploma
ICT Information and Communications Technology
IDBR Inter Departmental Business Register
JACS Joint Academic Coding System
JCQ Joint Council for Qualifications
LFS Labour Force Survey
LSC Learning and Skills Council
NVQ National Vocational Qualifications
ONS Office for National Statistics
PROCOM The IT Professional Competency Model
SIC Standard Industrial Classification
SME Small and Medium Enterprise
SOC Standard Occupational Classification
SSC Sector Skills Council
SQA Scottish Qualifications Authority
UCAS Universities and Colleges Admissions Service
WAG Welsh Assembly Government
Annex C: Glossary
44 GVA measures the contribution to the economy of each individual producer, industry or sector in the United Kingdom. It is the difference between the value of goods and services produced and the cost of the raw materials and other inputs which are used up in production, in any given sector or industry. GVA + taxes on products - subsidies on products = Gross Domestic Product (GDP). GDP is a key indicator of the state of the whole economy
© Copyright e-skills UK Sector Skills Council Ltd 2000-2009 78
The IT professional Competency Model (e-skills procom) is being established as an industry-recognised, internationally relevant training framework for organising courses and qualifications by the disciplines of the IT profession. Built on IT professional National Occupational Standards, and linked to the Skills Framework for the Information Age (SFIA), e-skills procom defines knowledge, understanding and competencies for seven broad disciplines (and their sub-disciplines) at five levels of progression, incorporating technical, business and personal skills.
The disciplines are:
1. Sales and marketing
2. Business change
3. Programme and project management
4. Solutions architecture
5. Solution development and implementation
6. Information management and security
7. IT service management and delivery
e-skills procom is the basis for e-skills UK's work to reform and simplify the qualifications map for IT professionals. It will help IT professionals to achieve recognition for their skills, and employers to plan training and development. It will also help providers of education and training to develop new courses to meet the needs of different IT disciplines.
e-skills UK is now developing a comprehensive mapping of courses and qualifications against e-skills procom. This mapping will be accessible from SFIA, and the courses will be available through the National Skills Academy, which will be launched in 2010.
In addition, the new IT and Telecoms Professional National Occupational Standards (NOS) have been developed in parallel with and as part of e-skills procom. For more details on the NOS, Standards and Skills Frameworks and a overview brochure of e-skills procom go to www.e-skills.com/Skills-Frameworks/1906
Annex D: e-skills procom

© Copyright e-skills UK Sector Skills Council Ltd 2000-2009 79
Office for National Statistics Labour Force Survey
The Labour Force Survey (LFS) is a quarterly sample survey of households living at private addresses in Great Britain. Its purpose is to provide information on the UK labour market that can then be used to develop, manage, evaluate and report on labour market policies. The questionnaire design, sample selection, and interviewing are carried out by the Social and Vital Statistics Division of the Office for National Statistics (ONS) on behalf of the Statistical Outputs Group of the ONS.
ONS publishes full UK LFS results. However, the fieldwork iscarriedoutseparately;byONSforGB,andbytheCentralSurvey Unit of the Department of Finance and Personnel in Northern Ireland on behalf of the Department of Trade and Investment (DETINI).
The survey seeks information on respondents' personal circumstances and their labour market status during a specific reference period, normally a period of one week or four weeks (depending on the topic) immediately prior to the interview.
More information is available at:
http://www.statistics.gov.uk/statbase/Source.asp?vlnk=358&More=Y
Office for National Statistics Inter Departmental Business Register
The Inter-Departmental Business Register (IDBR) is a list of UK businesses maintained by the Office for National Statistics (ONS) and combines the former Central Statistical Office (CSO) VAT based business register and the former Employment Department (ED) employment statistics system. It complies with European Union Regulation (EC) No 177/2008 establishing a common framework for business registers for statistical purposes.
It provides a sampling frame for surveys of businesses carried out by the ONS and by other government departments. It is also a key data source for analysis of business activity.
The IDBR covers businesses in all parts of the economy, missing some very small businesses operating without VAT or PAYE schemes (self employed and those with low turnover and without employees) and some non-profit organisations, representing nearly 99 per cent of UK economic activity. The Department for Business Innovation & Skills makes an estimate of the total number of unregistered businesses in its Small And Medium Enterprise Statistics publication.
More information is available at:
http://www.statistics.gov.uk/idbr/idbr.asp
Office for National Statistics Annual Business Inquiry
The Annual Business Inquiry (ABI) is conducted in two parts: one dealing with employment, the other with financial information. The financial inquiry covers about two thirds of the UKeconomyincluding:production;construction;distributionandserviceindustries;agriculture(part),hunting,forestryandfishing. The coverage of the employment inquiry is wider.
More information is available at:
http://www.statistics.gov.uk/abi/
Annex E: Key Sources of Information
© Copyright e-skills UK Sector Skills Council Ltd 2000-2009 80
Universities and Colleges Admission Service (UCAS)
UCAS is responsible for managing applications to Higher Education courses in the UK, providing application services across a range of subject areas and modes of study for UK universities and colleges.
UCAS carries out research, consultancy and advisory work for schools, colleges, careers services, professional bodies and employers. They also offer continuing professional development tailored to meet the needs of individual institutions or subject areas.
More information is available at:
www.ucas.ac.uk
Higher Education Statistics Agency (HESA) Qualifiers Data
HESA is the official agency for the collection, analysis and dissemination of quantitative information about Higher Education
More information is available at:
www.hesa.ac.uk
Joint Council for Qualifications (JCQ)
The Joint Council for Qualifications (JCQ) consists of AQA, City & Guilds, CCEA, Edexcel, OCR, SQA and WJEC, the seven largest providers of qualifications in the UK, offering GCSE, GCE, AEA, Scottish Highers, Entry Level, Vocational and vocationally-related qualifications.
More information is available at:
www.jcq.org.uk
Digital Britain The Digital Britain White Paper, published on the 16th June 2009, sets out the importance of the Digital Economy to the nation’s economic future, and how it will drive future industrial capability and competitiveness.
It makes the case that the United Kingdom’s communications infrastructure and increased Digital Participation are key to building a 21st century knowledge economy, and must be considered essential objectives if we are to become world-leaders, and reap the benefits of this rapidly transforming sector
A copy of the report is available at:
http://www.culture.gov.uk/images/publications/digitalbritain-finalreport-jun09.pdf

e-skills UK: Business and Information Technology, including Software, Internet & Web, IT Services, Telecommunications and Business Change.
e-skills UK is the Sector Skills Council for Business and Information Technology, rated ‘outstanding’ in the relicensing of Sector Skills Councils in 2009. We work on behalf of employers to ensure the UK has the technology skills it needs to succeed in a global digital economy.
© 2009 Reserved, e-skills UK All rights reserved. No part of this material protected by this copyright may be reproduced or utilised in any form, or by any means, electronic or mechanical, including photocopying, recording, or by any information storage and retrieval system without prior authorisation and credit to e-skills UK. An e-skills UK publication For further information please contact: e-skills UK1 Castle LaneLondonSW1E 6DRUK