Embed Size (px)
Citation preview

E n e r g y Re s e a r c h a n d D ev e l o p m e n t D i v i s i o n F I N A L P R OJ E C T R E P O R T
RENEWABLE ENERGY RESOURCE, TECHNOLOGY, AND ECONOMIC ASSESSMENTS Appendix K - Task 11: Solar Heat ing and Cool ing Technology Analysis
JANUARY 2017 CE C-500-2017-007-APK
Prepared for: California Energy Commission Prepared by: California Solar Energy Collaborative,
Universities of California Davis and San Diego

Prepared by: Primary Author(s):
• Masoud Rahman, Ricardo Amon, Pieter Stroeve Department of Chemical Engineering and Materials Science, University of California Daivs
• Guang Wang, Jan Kleissl,
Department of Mechanical and Aerospace Engineering,University of California, San Diego.
• Skip Fralick
California Center for Sustainable Energy 9325 Sky Park Court, Suite 100, San Diego, CA 92123
Contract Number: 500-11-020 Prepared for: California Energy Commission Michael Sokol Contract Manager Aleecia Gutierrez Office Manager Energy Generation Research Office Laurie ten Hope Deputy Director Energy Research & Development Division Robert P. Oglesby Executive Director
DISCLAIMER
This report was prepared as the result of work sponsored by the California Energy Commission. It does not necessarily represent the views of the Energy Commission, its employees or the State of California. The Energy Commission, the State of California, its employees, contractors and subcontractors make no warrant, express or implied, and assume no legal liability for the information in this report; nor does any party represent that the uses of this information will not infringe upon privately owned rights. This report has not been approved or disapproved by the California Energy Commission nor has the California Energy Commission passed upon the accuracy or adequacy of the information in this report.

i
ACKNOWLEDGEMENTS
We would like to thank you Dr. Sharon Shoemaker, executive director of California Institute of Food and Agricultural Research for providing us with resource and information of California Food industry. We would like to appreciate the comments, brain storming and the useful data we received from California Renewable Energy Collaboratives, Prof. Roger Boulton (UC Davis), Sierra Nevada Brewery Company, Prof. Roland Winston (UC-Merced based UC Solar Institute), Dairy Farmers of America, Cogenra Company, ErgSol Company, and many other companies which provided us their comments during Instrasolar North America exhibition and Sunshot summit.

ii
PREFACE
The California Energy Commission Public Interest Energy Research (PIER) Program supports public interest energy research and development that will help improve the quality of life in California by bringing environmentally safe, affordable, and reliable energy services and products to the marketplace.
The PIER Program conducts public interest research, development, and demonstration (RD&D) projects to benefit California.
The PIER Program strives to conduct the most promising public interest energy research by partnering with RD&D entities, including individuals, businesses, utilities, and public or private research institutions.
PIER funding efforts are focused on the following RD&D program areas:
• Buildings End-Use Energy Efficiency
• Energy Innovations Small Grants
• Energy-Related Environmental Research
• Energy Systems Integration
• Environmentally Preferred Advanced Generation
• Industrial/Agricultural/Water End-Use Energy Efficiency
• Renewable Energy Technologies
• Transportation
Validation of the National Solar Radiation Database in California is the final report for the California Solar Energy Collaborative project (contract number 500-08-027) conducted by the University of California, San Diego. The information from this project contributes to PIER’s Renewable Energy Technologies Program.
For more information about the PIER Program, please visit the Energy Commission’s website at www.energy.ca.gov/research/ or contact the Energy Commission at 916-654-4878.

iii
ABSTRACT
The California Solar Energy Collaborative conducted the assessment of solar thermal technologies for California industries to establish a base line of information regarding the opportunities and challenges of solar thermal resources as a replacement of natural gas and electricity consumption in industries. The assessment generates an inventory of solar thermal technologies, commercial products, market analysis, and scenarios for each section of the market. It also compiles case study details about solar thermal installations within different market segments.
The assessment provides information about legislative policy guidance and public investments to advance industrial solar thermal technologies. Only recently have the Investor Owned Utilities (IOUs) been able to offer incentives to industrial customers, with the launch of the California Solar Initiative (CSI) Industrial Thermal incentive program, in the fall of 2013. Although the California industrial solar thermal technology market has been growing with a slow pace, there is optimism that the CSI-Thermal program can do for industrial solar thermal technologies what CSI-PV has done for solar electric technologies. A critical market barrier to solar thermal remains the contemporary low price for natural gas fuel.
The assessment interprets energy demand data from wineries, breweries and dairy creameries to identify these industries with the technical potential to become the early adopters of industrial solar thermal technologies. Researchers do not attempt to forecast the industrial solar thermal economic market potential. End use market participants will be the ultimate judges of solar thermal renewable energy technologies.
Please use the following citation for this report:
Rahman, Masoud; Amon, Ricardo; Stroeve, Pieter; Wang, Guang; Kleissl, Jan; Fralick, Skip. California Solar Energy Collaborative. 2014. Solar Heating and Cooling Technology Analysis, California Energy Commission. Publication number: CEC-500-2017-007-APK.
iv
TABLE OF CONTENTS
Acknowledgements ................................................................................................................................... i
ABSTRACT .............................................................................................................................................. iii
TABLE OF CONTENTS ......................................................................................................................... iv
EXECUTIVE SUMMARY ........................................................................................................................ 1
1 CHAPTER 1: INTRODUCTION .................................................................................................... 4
1.1 Purpose of the Industrial Solar Thermal Assessment Study ............................................... 6
1.2 Regulatory Environment and Institutional Incentives ......................................................... 6
1.2.1 The California Solar Initiative (CSI) ................................................................................ 6
1.2.2 California's Biotech and Manufacturing Equipment Tax Exemption......................... 7
1.2.3 Business Energy Investment U.S. Federal Tax Credit ................................................... 7
1.2.4 Modified Accelerated Cost-Recovery System ................................................................ 8
1.2.5 U.S. Department of Energy ............................................................................................... 8
1.2.6 Private Sector Financing .................................................................................................... 8
1.3 Research Methods ...................................................................................................................... 9
2 CHAPTER 2: OVERVIEW OF SOLAR THERMAL SYSTEMS ............................................. 10
2.1 Non-concentrating solar thermal technologies .................................................................... 11
2.1.1 Flat Plate Collectors (FPC) .............................................................................................. 11
2.1.2 Compound parabolic collectors ..................................................................................... 13
2.1.3 Evacuated tube collectors................................................................................................ 14
2.1.4 Batch Collectors ................................................................................................................ 15
2.2 Concentrating collectors .......................................................................................................... 16
2.2.1 Parabolic Trough Collectors (PTC) ................................................................................ 16
2.2.2 Parabolic Dish Collectors (PDC) .................................................................................... 17
2.2.3 Fresnel Reflectors ............................................................................................................. 17
2.2.4 Other Concentrating Thermal Technologies ................................................................ 18
2.3 Hybrid Solar Thermal Technologies ..................................................................................... 18
2.3.1 Photovoltaic- thermal (hybrid PV/T) solar collector panels...................................... 18
2.3.2 Concentrating hybrid PV/T (CPV/T) technologies .................................................... 18
2.3.3 Hybrid Solar Thermal and Geothermal ........................................................................ 18

v
2.3.4 Hybrid Solar Thermal and Biomass .............................................................................. 19
3 CHAPTER 3: THE INDUSTRIAL SOLAR THERMAL MARKET ........................................ 20
3.1 Solar Thermal Applications .................................................................................................... 20
3.1.1 Water Heating ................................................................................................................... 20
3.1.2 Flat plate systems with the highest efficiency .............................................................. 22
3.1.3 Pool Heating ..................................................................................................................... 23
3.1.4 Space Heating ................................................................................................................... 26
3.1.5 Process Heating ................................................................................................................ 30
3.1.6 Operational Issues ............................................................................................................ 34
3.2 Solar Thermal Companies ....................................................................................................... 34
Abengoa Solar ................................................................................................................................... 34
Absolicon ........................................................................................................................................... 34
Agriculture Solar .............................................................................................................................. 35
Aztec Solar ........................................................................................................................................ 35
Bresco ................................................................................................................................................. 35
Calpak Solar ...................................................................................................................................... 36
Chromasun ........................................................................................................................................ 36
Cogenra ............................................................................................................................................. 37
Helio Power ...................................................................................................................................... 38
Johnson Controls .............................................................................................................................. 39
Ritter Gruppe .................................................................................................................................... 39
Sopogy ............................................................................................................................................... 39
Sundrum Solar .................................................................................................................................. 40
WaterFX ............................................................................................................................................. 40
3.3 Market Potential ....................................................................................................................... 41
4 CHAPTER 4: INDUSTRIAL SOLAR THERMAL INSTALLATIONS ................................. 43
4.1 Wineries ........................................................................................................................................... 43
Energy Management in Wineries .................................................................................................. 45
Energy Demand in Wineries .......................................................................................................... 46
4.2 Breweries ......................................................................................................................................... 46

vi
Energy Demand in Breweries ......................................................................................................... 47
Resource Management in Breweries ............................................................................................. 47
Renewable Energy in Breweries .................................................................................................... 48
4.3 Dairy Creamery Industry .............................................................................................................. 49
Energy Requirements in Creameries ............................................................................................. 49
5 CHAPTER 5: CALIFORNIA ENERGY EFFICIENCY AND GREENHOUSE GAS EMISSION GOALS ................................................................................................................................ 52
6 CHAPTER 6: SOLAR WATER HEATING TECHNOLOGY OPTIONS AND PENETRATION SCENARIOS ............................................................................................................. 55
6.1 Solar Water Heating Scenarios in Other States .................................................................... 57
7 CHAPTER 7: OTHER NON-DHW SOLAR THERMAL POTENTIALS IN CALIFORNIA 60
8 CHAPTER 8: METRICS FOR SOLAR THERMAL INDUSTRIAL SYSTEMS ................... 65
8.1 Performance Measurement Metrics ....................................................................................... 65
8.1.1 Tracking billing history. .................................................................................................. 65
8.1.2 Measuring solar collector performance ........................................................................ 66
8.1.3 Measuring the solar energy delivered by the system. ................................................ 67
8.1.4 Measuring all performance factors for scientific purposes ........................................ 67
8.2 System Design Metrics ............................................................................................................ 68
8.2.1 Solar Collector Efficiency and Collector Types ............................................................ 68
8.2.2 Solar fraction ..................................................................................................................... 71
8.2.3 Therm savings per square foot of collector .................................................................. 71
8.2.4 Therms saved .................................................................................................................... 72
8.3 Economic Metrics ..................................................................................................................... 72
8.3.1 Collector Cost ................................................................................................................... 72
8.3.2 System Cost ....................................................................................................................... 72
8.3.3 Simple payback................................................................................................................. 73
8.3.4 Life cycle cost .................................................................................................................... 73
8.3.5 Return on investment (ROI) ........................................................................................... 73
8.3.6 Greenhouse gas emissions .............................................................................................. 74
8.4 Sizing.......................................................................................................................................... 74

vii
8.4.1 Thermal Load .................................................................................................................... 74
8.4.2 Other influences on sizing of a solar thermal system ................................................. 76
8.5 Recommendations .................................................................................................................... 77
8.5.1 Recommendations for BTU Meters (Heat Meters) ...................................................... 77
8.5.2 General Recommendations ............................................................................................. 78
8.6 Summary ................................................................................................................................... 79
9 CHAPTER 9: SOLAR THERMAL ASSESSMENTS FOR WHITE LABS BREWERY AND THE NAVY FLEET READINESS CENTER ....................................................................................... 80
9.1 General considerations of solar thermal systems ................................................................ 80
9.1.1 Unglazed collectors .......................................................................................................... 80
9.1.2 Glazed Flat Plate Collectors ............................................................................................ 81
9.1.3 Evacuated tube collectors................................................................................................ 81
9.1.4 Concentrating collectors .................................................................................................. 82
9.2 Collector performance ratings ................................................................................................ 82
9.2.1 Freeze Protection .............................................................................................................. 82
9.2.2 Overheat protection ......................................................................................................... 84
9.3 Brewing Industry Solar Thermal Assessment - White Labs .............................................. 85
9.3.1 Brewing Process ............................................................................................................... 85
9.3.2 Heating method ................................................................................................................ 86
9.4 Aircraft Refurbishment Facility Solar Thermal Assessment - Navy Fleet Readiness Center 90
9.4.1 Refurbishment Operation ............................................................................................... 90
9.4.2 Heat Loss estimate. .......................................................................................................... 91
9.4.3 CHP Plant .......................................................................................................................... 91
9.4.4 Investment Grade Energy Audit .................................................................................... 91
9.4.5 Integration of solar thermal into the cleaning and plating process .......................... 92
9.4.6 Aircraft Refurbishment Facility Solar Thermal Performance Modeling .................. 94
9.4.7 Results ................................................................................................................................ 94
9.5 Solar cost trends ....................................................................................................................... 95
10 CHAPTER 10: CONCLUSIONS AND FUTURE WORK .................................................... 97
10.1 Types and Costs of Technology ............................................................................................. 99

viii
10.2 Collector Cost ........................................................................................................................... 99
10.3 Installed Costs ....................................................................................................................... 100
11 Appendix A ................................................................................................................................ 102
12 Appendix B) Sample design for a creamery ......................................................................... 104
12.1 Introduction ............................................................................................................................ 104
12.2 Gas Consumption .................................................................................................................. 104
12.3 Electricity consumption......................................................................................................... 105
12.4 Design consideration ............................................................................................................. 105
12.5 PV Panels ................................................................................................................................. 106
12.6 Evacuated Tube Solar Thermal Panel ................................................................................. 107
12.7 PV/T panels ............................................................................................................................ 108

ix

1
EXECUTIVE SUMMARY
The California Solar Energy Collaborative conducted a market assessment to establish a base line of information regarding the economic activity in the industrial solar thermal technology market. The assessment generates an inventory of solar thermal equipment companies that are actively marketing their technologies to industrial and agricultural customers. It also compiles Case Study details about solar thermal installations within these market segments.
The market assessment defines solar thermal systems as the technology used to generate hot water, chilled water and hot air resources from the conversion of solar energy. The market assessment identifies the potential to utilize solar thermal systems as a viable renewable energy alternative that reduces fossil fuel-based thermal and electric energy loads.
Industrial solar thermal systems can deliver clean energy to produce hot water and generate low pressure steam, heat fluids, and deliver heat to be used by absorption refrigeration systems. Significantly important industrial unit operations require these energy-driven end-products; for sanitation purposes at creameries and wineries and to power refrigeration systems at breweries. Solar thermal energy displaces on-site burning of natural gas fuel, reducing greenhouse gas (GHG) emissions. Research data was collected from food company personnel, expert survey interviews and secondary archival sources.
The assessment provides information about legislative policy guidance and public investments to advance industrial solar thermal technologies. Only recently have the Investor Owned Utilities (IOUs) been able to offer incentives to industrial customers, with the launch of the California Solar Initiative (CSI) Industrial Thermal incentive program, in the fall of 2013.
The California industrial solar thermal technology market has been dormant, with only a few new PV/Thermal hybrid projects installed since the 2005, installation at the Frito Lay, Modesto plant. The assessment records the perspective of IOU representatives regarding the market potential with the new economic incentives. There is optimism that CSI-Thermal can do for industrial solar thermal technologies what CSI-PV has done for solar electric technologies. A critical market barrier to solar thermal remains the contemporary low price for natural gas fuel.
It is encouraging to know that established and emerging private sector companies are investing in new technologies to create competitive advantages. The industry is aware of the need to develop emerging technologies that can utilize solar thermal resources more cost-effectively. Particularly, to produce refrigeration loads to displace higher cost electricity. There are several companies investing in solar cooling technologies, with a few demonstration projects installed but not yet ready for market commercialization. The development and deployment of cost-effective solar cooling technologies will open a significantly more profitable market for industrial solar thermal systems.
The assessment interprets energy demand data from wineries, breweries and dairy creameries to identify these industries with the technical potential to become the early adopters of industrial solar thermal technologies. Researchers do not attempt to forecast the industrial solar thermal economic market potential. End use market participants will be the ultimate judge of solar thermal renewable energy technologies. Managers at dairy creameries and brewery companies will need a compelling reason to want to replace existing fuels and delivery systems to produce hot water resources. But a combination of generous CSI incentives based on thermal

2
fuel savings, the potential to earn greenhouse gas credit allocations, and the accomplishment of sustainability goals may drive early adopters to invest in industrial solar thermal systems.
Despite the availability of new institutional incentives to invest in solar thermal technologies, the industrial market is only recently opening with the installation of a few emerging technologies. For the most part industrial managers are very cautious to consider the need to invest in the generation of on-site renewable energy sources.

3

4
1 CHAPTER 1: INTRODUCTION In 2005, the California Energy Commission invested public funds with the Frito Lay Company to install a large-scale solar thermal demonstration project at their Modesto, California facility. The company invested funds and skilled labor to improve system design and operational capabilities. Very few new industrial solar thermal heating systems have been installed since then. Only recently, fall of 2013, have PGE, SoCalGas, Southern California Edison and San Diego Gas and Electric (IOUs) been able to offer solar thermal incentives to industrial customers.
This market assessment provides information about solar thermal equipment companies that are targeting the industrial sector market segment. The assessment learns from the IOUs about their efforts launching their CSI Solar Thermal Industrial programs. The assessment gathers results from solar thermal project installations in dairy farms, food processing facilities, dairy creameries, wineries and breweries, and other industrial facilities.
The sun provides an abundance of solar radiation that can easily be converted to heat. Such heat can be used to generate hot water or steam for residential, industrial, and utility power. Solar heating system captures energy from the sun to provide heat for homes and business, thereby displacing the use of natural gas, or in some cases electricity, with free and limitless solar energy. In term of application, solar heating system could be solar water heating (SWH), solar pool heating, solar space heating and solar process heating. In our report, we generally call those applications solar heating system. This report mainly focuses on industrial applications and therefore, residential and utility-power are out of the scope of this chapter.
Solar heating systems are not new to California0F
1. The world’s first commercial solar hot water system was patented in the United States in 1891. Solar hot water quickly became popular in California, and many other states, as an alternative to burning wood or expensive liquid fuels. Solar hot water’s popularity continued to grow in California until vast reserves of natural gas were discovered in Los Angeles basin in the 1920s. The environmental and health costs associate with burning oil and gas for heat and electricity were underappreciated, and their cheap prices severely dampened demand for solar hot water systems.
Rapid consumption of natural gas has contributed to the serious environmental problems such as increasing the carbon dioxide concentration and global warming. Unchecked global warming effects can influence California in many ways including rising sea level, extreme weather patterns, disrupted agriculture, and natural ecosystem disturbances. Like other states that are recognizing the problem and taking action, California has put in place ambitious emission reduction goals. In 2006, the Governor signed the “Global Warming Solutions Act of 2006” which obligates the state to reduce greenhouse gas emission to 1990 levels by 2020. Thus, California will promote an increase in solar energy applications to achieve its goal.
1 Bernadette Del Chiaro, Apr. 2007, Solar Water Heating: How California Can Reduce Its Dependence on Natural Gas, http://www.environmentcalifornia.org/reports/cae/solar-water-heating-how-california-can-reduce-its-dependence-natural-gas

5
Before implementation, solar heating technology options and penetration scenarios for California need to be analyzed to find potential energy savings of various solar heating applications. In this report, only the solar market of the commercial sector will be studied.
A lot of effort has been made to popularize solar heating systems1F
2, but there is still long way before solar heating systems become commonplace due to many technical and non-technical issues. CEUS2F
3 published a comprehensive study of commercial buildings end-use energy use, which provided a general framework to find potential for solar heating systems in California. However, the end-use detail is not sufficient. KEMA-XENERGY3F
44F
5 provides both a detailed and complete investigation of current natural gas use of some heating applications for existing commercial buildings and the possibilities for displacement using solar heating systems.
Taking full advantage of solar heating in California would reduce the state’s greenhouse gas emissions, and achieve the state’s energy efficiency and carbon emission reduction goals. Those achievements are quite significant for protecting California’s environment. For example, a reduction in carbon emissions brings about the following benefits. 1) Reduce California’s contribution to global warming. 2) Reduce the need for air conditioning (AC) energy use with an overall reduction in electricity consumption. 3) Reduce California’s dependence on natural gas. 4) Lower the price of natural gas for all residents.
The rest of this report is divided into seven chapters. Chapter 2 provides the overview of current solar thermal technology as well as solar thermal system in the market. Chapter 3 introduces California’s Energy Efficiency and Greenhouse Gas (GHG) Emissions Goals. Chapter 4 illustrates the current solar heating market in California and provides a chart showing various options and penetration scenarios. An estimate of energy saving and CO2 emission reduction potentials for each available option is also provided. In addition, SWH scenarios in other states in the US are compared to California’s. Chapter 5 identifies the classes of businesses that would benefit from solar thermal systems (process heating, space heating, pool heating and cooling), with an estimation of potential natural gas savings of each solar system provided. In Chapter 6 metrics and measurements for assessing the performance of SWH systems are presented and Chapter 7 discussses case studies of solar hot water for process heating at an aerospace and brewery facility. Chapter 8 provides the discussion and conclusion on future work.
2 Bernadette Del Chiaro, Apr. 2007, Solar Water Heating: How California Can Reduce Its Dependence on Natural Gas, http://www.environmentcalifornia.org/reports/cae/solar-water-heating-how-california-can-reduce-its-dependence-natural-gas
3 California Commercial End-use Survey, http://capabilities.itron.com/ceusweb/chart.aspx
4 Fred Coito, Mike Rufo, May 2003, California Statewide Commercial Sector Natural Gas Energy Efficiency Potential Study Volume 1, California Measurement Advisory Council, http://www.calmac.org/allpubs.asp
5 Fred Coito, Mike Rufo, May 2003, California Statewide Commercial Sector Natural Gas Energy Efficiency Potential Study Volume 2, California Measurement Advisory Council, http://www.calmac.org/allpubs.asp

6
1.1 Purpose of the Industrial Solar Thermal Assessment Study The purpose of this assessment is to provide a contemporary understanding of the "state-of-the-market", for the commercialization of industrial solar thermal systems. The assessment provides a comprehensive literature review of solar thermal technologies, accounts for most of the solar thermal companies still in business, identifies industrial sectors with the most potential to install solar thermal systems, accounts for most of the projects that are installed and operating at California industrial facilities and other locations, and evaluates the economic and environmental incentives available for the installation of this renewable energy source.
1.2 Regulatory Environment and Institutional Incentives SBX1-2, signed by Governor Brown on April 13, 2011, increases California's Renewable Portfolio Standard (RPS) target from 20 percent by 2010 to 33 percent by December 31, 2020. Governor Brown has also announced goals to install 20,000 megawatts (MW) of new renewable power by 2020, of which 12,000 MW will be local or distributed generation. These goals are leveraged by the California's Green House Gas (GHG) Cap and Trade Program. Emission reduction objectives are achieved to the extent that fossil-fuel-based energy consumption reductions are achieved; either through energy conservation or by fuel switching to renewable sources.
Assembly Bill No. 327 (Perea), signed by the Governor of California in October 7, 2013, can have some unintended consequences to the future of solar energy distributed generation projects. This bill extends the RPS goals and extends the Net Energy Metering program but also repeals certain limitations previously imposed by the CPUC allowing IOUs to raise electric rates to residential customers. Concerned stakeholders anticipate that the CPUC will "come under intense pressure" to "protect the interest of the utilities over those of consumers and potential self-generators".
1.2.1 The California Solar Initiative (CSI) The California Solar Initiative (CSI) offers cash-back rebates to homes, businesses, farms, schools, government and non-profit organizations located within the territories served by Investor Owned Utilities (IOUs). Customers are awarded payments for every watt of electricity produced using photovoltaic (PV) solar energy systems. The CSI program also funds solar thermal generating technologies, under the CSI-Thermal Program.
This program offers rebates to residential customers to install home solar water heating systems as well as for the installation of commercial-sized solar water heating systems in buildings and industrial facilities. These customers can receive rebates of up to $500,000.
To qualify, customers from PGE, SCE, SoCalGas and SDGE have to use solar water heating systems that are certified by a Solar Rating and Certification Corporation (SRCC) or by the International Association of Plumbing and Mechanical Officials (IAPMO), with an OG-300 rating for single-family systems, and an OG-100 rating for multi-family/commercial systems. To be eligible these installations would have to reduce the use of natural gas, electricity or propane as the original fuel source. Customers should be aware to meet the CSI - Thermal Program eligibility requirements by consulting the September 2013, CSI - Thermal Program Handbook.
The CSI program was authorized by the California Public Utilities Commission (CPUC) in 2006, providing rebates for the generation of PV electricity. Not until January of 2010, did the CPUC

7
established the CSI-Thermal Program, offering rebates for solar thermal systems that displace both natural gas and electric hot water driven systems. On March 6, 2013, the CPUC issued a new order (D.13-02-018) to expand the CSI-Thermal Program to include non-water heating solar thermal applications, like process heat, solar cooling and space heating systems.
The CSI-Thermal Program is tasked with the goal to increase the adoption rate of solar thermal technologies into the "California marketplace". The program is designed to reduce market barriers, including the high costs of installation, permitting costs, and a potential shortage of experienced installers. Considering that only recently has the CPUC created incentives to promote the adoption of solar thermal systems, this market should be considered to be in its infancy stage.
Potential industrial solar thermal customers should review the CSI-Thermal Program Metering Installation Guide to understand what constitutes a "correct metering configuration and installation." Potential customers may also want to utilize the CSI - Thermal Incentive Calculator Guide, which provides details on how to use the CSI - Thermal Commercial Incentive Calculator.
Customers in the IOU territories are encouraged to visit with their utility representatives to be well informed about their commercial solar thermal rebate programs:
• PGE:http://www.pge.com/en/myhome/saveenergymoney/solar/csithermal.page?WT.mc_id=Vanity_csithermal
• SCE: https://www.sce.com/wps/wcm/connect/7be6496f-acb9-4333-b5b8-8b5861fbf08d/CSIThermal_CommercialBrochure.pdf?MOD=AJPERES
• SoCalGas: http://socalgas.com/for-your-home/rebates/solar-water-heating/
• SDGE: http://energycenter.org/programs/california-solar-initiative-thermal
Another recommendation is to visit the CSI - Thermal Program Incentive Step Tracker to review current incentive rates and remaining funds available by IOU.
1.2.2 California's Biotech and Manufacturing Equipment Tax Exemption Starting in July 1, 2014 biotechnology and manufacturing companies purchasing manufacturing and research and development equipment will pay a reduced sales tax of 4.1875 percent as compared to the 7.5 percent. The sales exemption is granted for eight years.
1.2.3 Business Energy Investment U.S. Federal Tax Credit Solar water heat, solar space heat, solar thermal electric and solar thermal process heat systems are eligible to the 30 percent Investment Tax Credit (ITC) offered by the U.S. Federal government. This tax credit was established as a component of the American Recovery and Reinvestment Act of 2009, allowing taxpayers to choose between the federal renewable electricity production tax credits (PTC) or the ITC for new installations. For solar energy projects, the credit is 30% of the project expenditures, with no maximum credit. Eligible solar

8
energy property includes equipment that uses solar energy to generate electricity, to heat or cool (or provide hot water for use in) a structure, or to provide solar process heat. Hybrid solar lighting systems, which use solar energy to illuminate the inside of a structure using fiber-optic distributed sunlight, are eligible. Passive solar systems and solar pool-heating systems are not eligible.
1.2.4 Modified Accelerated Cost-Recovery System Solar thermal technologies are classified under the Modified Accelerated Cost-Recovery System (MACRS) as “five-year property” for depreciation deductions. Industrial facility managers can also review Section 179 deduction for additional depreciation schedules.
1.2.5 U.S. Department of Energy The U.S. Department of Energy (DOE) has lead a network of researchers and stakeholders in the development of innovative solar photovoltaic and concentrating solar systems. These efforts are expected to "make solar energy cost competitive with traditional sources of energy." DOE claims that research and development efforts have "doubled the U.S. supply of solar power from 2008 to 2012, and reduced the cost of installing solar energy systems by more than 30 percent."
Although the DOE report does not disaggregate the data to identify the contribution made by solar thermal energy sources, researchers assume that this source of solar energy represents an insignificant portion of the total U.S. solar market. Researchers assume that solar thermal systems have not receive the same legislative, regulatory and commercialization incentives from the Federal or California governments, as given to solar PV and concentrating electric solar systems.
In part to overcome this lack of previous support, DOE created the Utility Solar Water Heating Initiative providing technical support to utility companies promoting mostly solar thermal systems. There are no measurement and validation reports that evaluate the performance of these efforts.
1.2.6 Private Sector Financing California's solar energy market has matured over the past twelve years, since the State Legislature instituted the Renewable Portfolio Standard (RPS). Rebate incentives and policy challenges like the "one million solar homes" motivated public and private investment in research, development and commercialization of solar electricity (PV systems) for homes and commercial buildings.
Private sector financing greatly complemented the CSI incentives to motivate a critical mass of residential customers to install solar PV panels on their homes. Commercial buildings, government installations and some agricultural and industrial facilities have also investment in the PV solar market. The availability of power purchase agreements (PPAs) facilitated the financing of new installations, offering the option to lease equipment to residential and commercial distributed generation (DG) projects and other utility scale projects.
Researchers gather that stakeholders in the emerging solar thermal market, including public sector regulators, private sector investors and privately owned utility companies (PGE, SCE, and SEMPRA) are optimistic that the incentives for residential solar water heating will create new market opportunities.

9
1.3 Research Methods A comprehensive literature review was conducted to document the state-of-affairs in the industrial solar thermal energy market. The literature review is used to document the Technology Readiness Level, with descriptions from multiple solar thermal technologies. Researchers are also able to document solar thermal market trends, driven by public policy, ratepayer funded incentives and emerging technology companies.
Researchers collected data directly from a dairy processing facility located in the PGE service territory to model a solar thermal system for that facility. Researchers utilized the Polysun modeling software to model the technical characteristics of a solar thermal system for the facility. Models results were documented and delivered to the collaborating company.
Researchers collected data directly from the solar thermal market stakeholders: IOUs participating in the CSI-Thermal incentive program, their industrial customers and solar thermal equipment vendors. Researchers requested support from IOU company representatives to participate in the UC Davis, Solar Energy Collaborative market assessment. IOU staff communicated with several industrial customers and delivered to their customers a market survey (Appendix A). No responses were obtained.
Trade industry representatives were also consulted to gather experiential data from new or pilot systems, particularly equipment manufacturers and vendors. A few consulting companies also provided support with data collection efforts, expert opinion, and access to industry metrics. All observations were collected from December 2013 through March 2014.
Through these methods, researchers attempt to assess the "extent-to-which" industrial company managers are interested in calculating the technical and economic potential of using renewable solar thermal energy? Researchers recommend that further research be conducted to scientifically answer this question. The sample used for this assessment is not statistically significant.

10
2 CHAPTER 2: OVERVIEW OF SOLAR THERMAL SYSTEMS
Although solar thermal technology could be applied on SWH, solar pool heating, solar air heating and solar process heating, the most significant difference among solar heating systems is the type of collector used. A collector absorbs the incoming solar radiation, converts it into heat, and transfers this heat to a fluid (usually air, water, or oil) flowing through the collector. The solar energy collected is carried from the circulating fluid either directly to the hot water or space conditioning equipment or to a thermal energy storage tank from which can be drawn for use at night and/or cloudy days.
There are basically two types of solar collectors: stationary and concentrating. A stationary collector has the same area for intercepting and for absorbing solar radiation, whereas a sun-tracking concentrating solar collector usually has concave reflecting surfaces to intercept and focus the sun’s beam radiation to a smaller receiving area, thereby increasing the radiation flux.
Solar energy collectors are basically distinguished by their design and operating temperature. Since in the California solar market stationary solar collectors dominate, we will focus on stationary solar collectors, which are flat plate collectors (FPC), Stationary compound parabolic collectors (CPC), and evacuated tube collectors (ETC). Kalogirou5F
6 provides a review of the various types of collectors currently available in the market, including FPC, CPC, ETC, and other concentrating collectors. The review is summarized below.
The solar thermal technologies (ST) can be classified as concentrating, non-concentrating, and hybrid technologies. Different ST technologies in each category are listed below:
1) Non-concentrating technologies:
a) Flat plate collectors
b) Evacuated tube collectors
c) Batch Collectors
2) Solar concentrator-based technologies
a) Parabolic solar trough
b) Parabolic dish
c) Mixed parabola (Prof. Winston Model)
d) Fresnel Mirrors
e) Solar Tower
3) Hybrid technologies
6 Soteris Kalogirou, Solar thermal collectors and applications, Energy and Combustion Science, 2004

11
a) Hybrid PV-ST (Cogenra Model)
b) PVT
c) Hybrid ST-biofuel
d) Hybrid ST-steam turbine (for electricity production)
A detailed review of solar thermal technologies has been provided by various references.[1-3] Solar thermal technologies can be used for the following applications:
1) Hot water generation
2) Steam Generation
3) Air-conditioning
4) Cooling and Refrigeration
5) Power (electricity) generation
This chapter covers the application of solar thermal technologies for California industries and therefore the power generation application is out of the scope of this chapter. The power generation application of solar thermal has been reviewed in chapter 5.
2.1 Non-concentrating solar thermal technologies In this category, the technologies, which do not use any light concentration mechanism, will be considered. This category works with both direct and diffuse light.
2.1.1 Flat Plate Collectors (FPC)
A flat dark (black) plate absorbs the light and transfers the heat to the pipes, which are connected to the plate. Different schemes have been employed for the integration of the pipes to the plate. In order to increase the efficiency, insulation and glazing is employed to decrease the heat loss. This technology is full commercialized and has been mostly employed for pool heating, residential and commercial hot water.
FPCs can be applied for applications which require energy delivery at temperature range of 30-80 OC. FPCs can be employed in different applications such as solar water heating, building heating, air conditioning, and industrial process heat.(Mekhilef, et al. 2011) The application of FPCs in residential and commercial buildings has been analyzed by NREL.(Hudon, et al. 2012) In this chapter we will focus on industrial applications.
The hot water produced by FPCs can be stored in tanks for industrial processes such as:
-) Dairy (Concentrates, Boiler Feed Water)
-) Canned Food (Pasteurization, Cooking)
-) Textile (Bleaching, Dying)
-) Paper (Cooking, Drying, Boiler feed water)

12
-) Meat (Washing, Sterilization)
-) Beverages (Washing, Sterilization, Cooking)
For areas with freezing seasons, one option is to add anti-freezing agent to the circulating water and the other option is to use flexible polymeric FPCs. Therefore; the selection of the technology for each industry depends on its location and the freezing season.
A typical flat-plate solar collector is shown in Figure 2.1. When solar radiation passes through a transparent cover and impinges on the blackened absorber surface of high absorptivity, a large portion of this energy is absorbed by the plate and then transferred to the transport medium in the fluid tubes to be carried away for storage or use.
Figure 2.1. Pictorial view of a flat-plate collector.
A FPC generally consists of the following components: Glazing. One or more sheets of glass or other diathermanous (radiation-transmitting) material. Tubes, fins, or passages. To conduct or direct the heat transfer fluid from the inlet to the outlet. Absorber plates. Flat, corrugated, or grooved plates, to which the tubes, fins, or passages are attached. The plate may be integral with the tubes. Headers or manifolds. To admit and discharge the fluid. Insulation. To minimize the heat loss from the back and sides of the collector. Container or casing. To surround the aforementioned components and keep them free from dust, moisture, etc. Another category of flat plate collectors is unglazed collector. It is an usually low-cost unit which can offer cost effective solar thermal energy in applications such as water preheating for domestic or industrial use and heating of swimming pools. The unglazed collector will be discussed in detail in section 2.2. FPCs have been built in a wide variety of designs and from many different materials. They have been used to heat fluids such as water, water plus antifreeze additive, or air. Their major

13
purpose is to collect as much solar energy as possible at a low cost. The flat plate collectors can heat water as much as 125˚F above the surrounding air temperature, depending on the angle of the sun, the design of the collector, and other factors. Lately some modern manufacturing techniques have been introduced by the industry such as the use of ultrasonic welding machines, which improve both the speed and the quality of welds. This is used for the welding of fins on risers in order to improve heat conduction. The greatest advantage of this method is that the welding is performed at room temperature therefore deformation of the welded parts is avoided. These collectors with selective coating are called advance FPC and the characteristics of a typical type of FPC are also shown in Table 2.1. Table 2.1 Characteristics of a typical water FPC system. Parameter Simple flat plate
collector Advanced flat plate collector
Fixing of risers on the absorber plate
Embedded Ultrasonically welded
Absorber coating Black mat paint Chromium selective coating
Glazing Low-iron glass Low-iron glass
2.1.2 Compound parabolic collectors CPCs are non-imaging concentrators. These have the capability of reflecting to the absorber all of the incident radiation within wide limits. The necessity of moving the concentrator to accommodate the changing solar orientation can be reduced by using a trough with two sections of a parabola facing each other, as shown in Figure 2.2.
Figure 2.2 Schematic diagram of a compound parabolic collector.
Compound parabolic concentrators can accept incoming radiation over a relatively wide range of angles. By using multiple internal reflections, any radiation that is entering the aperture,

14
within the collector acceptance angle, finds its way to the absorber surface located at the bottom of the collector. 2.1.3 Evacuated tube collectors Conventional simple flat-plate solar collectors were developed for use in sunny and warm climates. Their benefits however are greatly reduced when conditions become unfavorable during cold, cloudy and windy days. Furthermore, weathering influences such as condensation and moisture will cause early deterioration of internal materials resulting in reduced performance and system failure. Evacuated heat pipe solar collectors (tubes) operate differently than the other collectors and could avoid this deterioration. In ETCs the heat can either be gathered by means of a solar collector fluid flowing through the absorber or it can be collected by means of the heat pipe principle, as shown in Figure 2.3. ETCs have demonstrated that the combination of a selective surface and an effective convection suppressor can result in good performance at high temperatures. The vacuum envelope reduces convection and conduction losses, enabling it to heat water to as much as 350˚F or more. An advantage of heat pipes over direct-flow evacuated-tubes is the "dry" connection between the absorber and the header, which makes installation easier and also means that individual tubes can be exchanged without emptying the entire system of its fluid. A drawback of heat pipe collectors is that they are more likely to degrade after long time exposure so the heat pipe show a significant decrease in thermal performance.6F
7 Like FPC, they collect both direct and diffuse radiation. However, their efficiency is higher at low incidence angles. This effect tends to give ETC an advantage over FPC in day-long performance.
Figure 2.3 Schematic diagram of a heat pipe evacuated tube collector. (Heat pipe (left) and direct flow ETC (right))
7 Stephan Fischer, Performance testing of evacuated tubular collectors, 2012 in http://www.estif.org/fileadmin/estif/content/projects/QAiST/QAiST_results/QAiST%20D2.1%20R2.1%20Performance%20testing%20of%20Evacuated%20tubular%20collectors.pdf
15
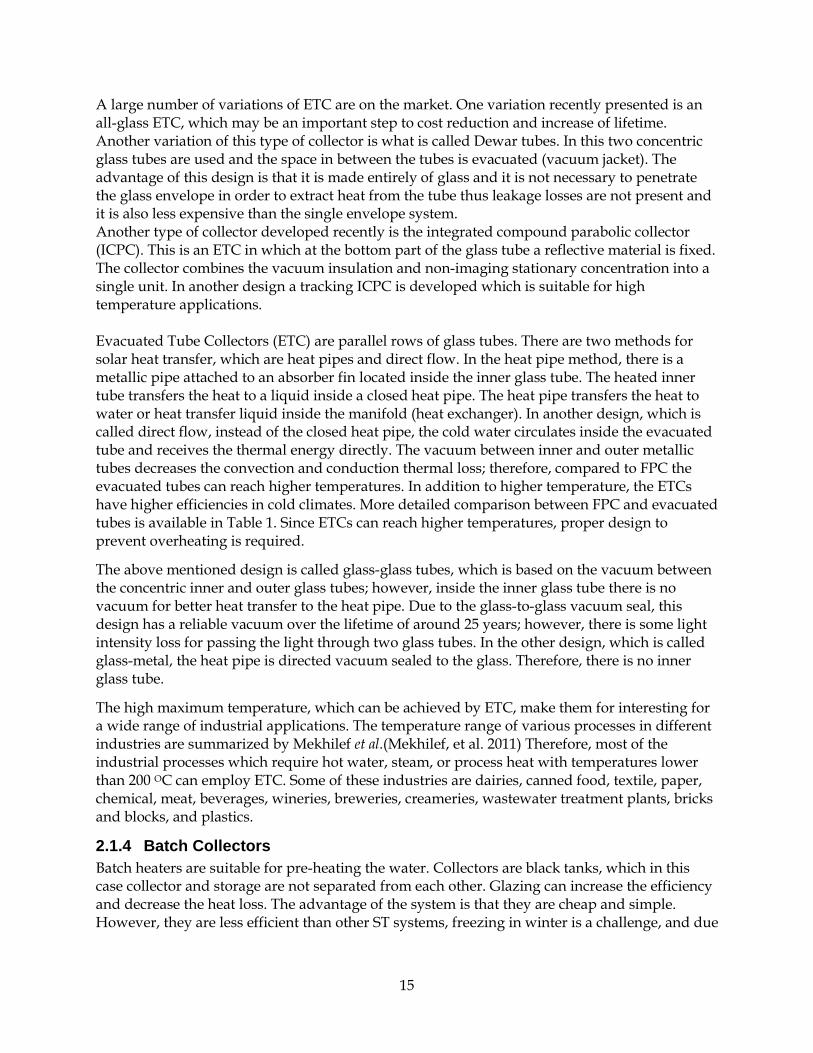
A large number of variations of ETC are on the market. One variation recently presented is an all-glass ETC, which may be an important step to cost reduction and increase of lifetime. Another variation of this type of collector is what is called Dewar tubes. In this two concentric glass tubes are used and the space in between the tubes is evacuated (vacuum jacket). The advantage of this design is that it is made entirely of glass and it is not necessary to penetrate the glass envelope in order to extract heat from the tube thus leakage losses are not present and it is also less expensive than the single envelope system. Another type of collector developed recently is the integrated compound parabolic collector (ICPC). This is an ETC in which at the bottom part of the glass tube a reflective material is fixed. The collector combines the vacuum insulation and non-imaging stationary concentration into a single unit. In another design a tracking ICPC is developed which is suitable for high temperature applications. Evacuated Tube Collectors (ETC) are parallel rows of glass tubes. There are two methods for solar heat transfer, which are heat pipes and direct flow. In the heat pipe method, there is a metallic pipe attached to an absorber fin located inside the inner glass tube. The heated inner tube transfers the heat to a liquid inside a closed heat pipe. The heat pipe transfers the heat to water or heat transfer liquid inside the manifold (heat exchanger). In another design, which is called direct flow, instead of the closed heat pipe, the cold water circulates inside the evacuated tube and receives the thermal energy directly. The vacuum between inner and outer metallic tubes decreases the convection and conduction thermal loss; therefore, compared to FPC the evacuated tubes can reach higher temperatures. In addition to higher temperature, the ETCs have higher efficiencies in cold climates. More detailed comparison between FPC and evacuated tubes is available in Table 1. Since ETCs can reach higher temperatures, proper design to prevent overheating is required.
The above mentioned design is called glass-glass tubes, which is based on the vacuum between the concentric inner and outer glass tubes; however, inside the inner glass tube there is no vacuum for better heat transfer to the heat pipe. Due to the glass-to-glass vacuum seal, this design has a reliable vacuum over the lifetime of around 25 years; however, there is some light intensity loss for passing the light through two glass tubes. In the other design, which is called glass-metal, the heat pipe is directed vacuum sealed to the glass. Therefore, there is no inner glass tube.
The high maximum temperature, which can be achieved by ETC, make them for interesting for a wide range of industrial applications. The temperature range of various processes in different industries are summarized by Mekhilef et al.(Mekhilef, et al. 2011) Therefore, most of the industrial processes which require hot water, steam, or process heat with temperatures lower than 200 OC can employ ETC. Some of these industries are dairies, canned food, textile, paper, chemical, meat, beverages, wineries, breweries, creameries, wastewater treatment plants, bricks and blocks, and plastics.
2.1.4 Batch Collectors Batch heaters are suitable for pre-heating the water. Collectors are black tanks, which in this case collector and storage are not separated from each other. Glazing can increase the efficiency and decrease the heat loss. The advantage of the system is that they are cheap and simple. However, they are less efficient than other ST systems, freezing in winter is a challenge, and due
16
to the bulky size they increase the load on the top of the building. They are usually suitable for residential applications; therefore, they are out of the scope of current report.
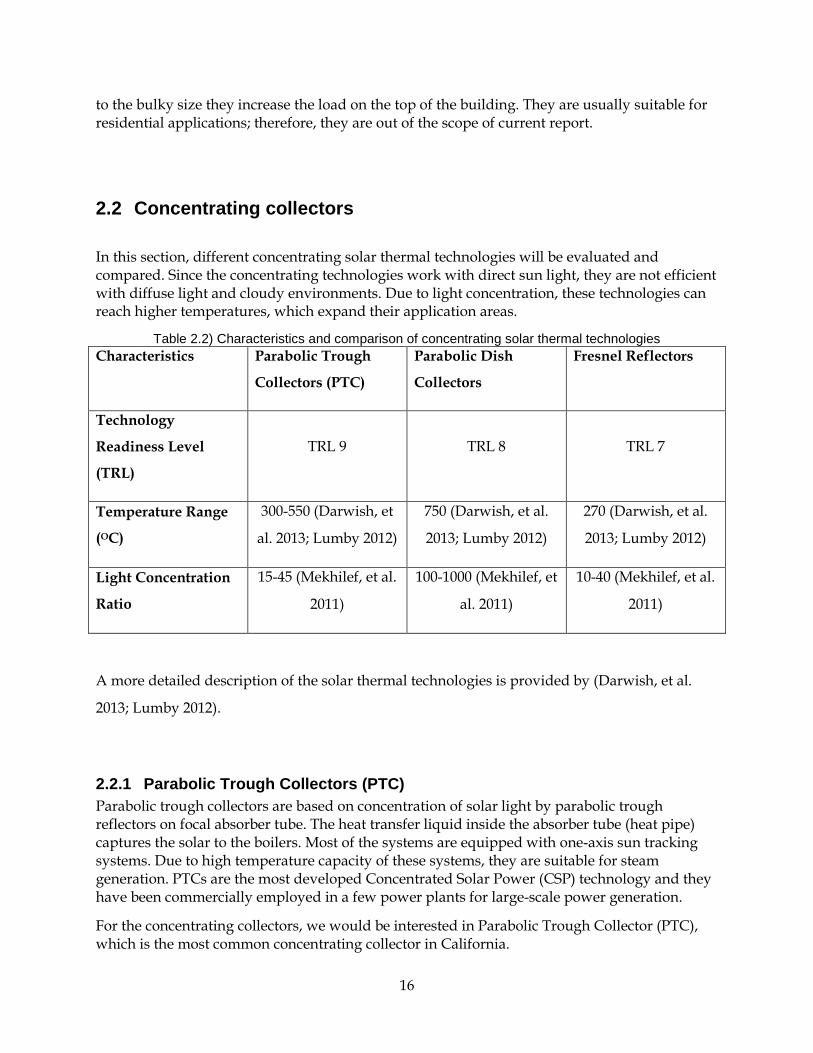
2.2 Concentrating collectors In this section, different concentrating solar thermal technologies will be evaluated and compared. Since the concentrating technologies work with direct sun light, they are not efficient with diffuse light and cloudy environments. Due to light concentration, these technologies can reach higher temperatures, which expand their application areas.
Table 2.2) Characteristics and comparison of concentrating solar thermal technologies Characteristics Parabolic Trough
Collectors (PTC)
Parabolic Dish
Collectors
Fresnel Reflectors
Technology
Readiness Level
(TRL)
TRL 9 TRL 8 TRL 7
Temperature Range
(OC)
300-550 (Darwish, et
al. 2013; Lumby 2012)
750 (Darwish, et al.
2013; Lumby 2012)
270 (Darwish, et al.
2013; Lumby 2012)
Light Concentration
Ratio
15-45 (Mekhilef, et al.
2011)
100-1000 (Mekhilef, et
al. 2011)
10-40 (Mekhilef, et al.
2011)
A more detailed description of the solar thermal technologies is provided by (Darwish, et al.
2013; Lumby 2012).
2.2.1 Parabolic Trough Collectors (PTC) Parabolic trough collectors are based on concentration of solar light by parabolic trough reflectors on focal absorber tube. The heat transfer liquid inside the absorber tube (heat pipe) captures the solar to the boilers. Most of the systems are equipped with one-axis sun tracking systems. Due to high temperature capacity of these systems, they are suitable for steam generation. PTCs are the most developed Concentrated Solar Power (CSP) technology and they have been commercially employed in a few power plants for large-scale power generation.
For the concentrating collectors, we would be interested in Parabolic Trough Collector (PTC), which is the most common concentrating collector in California.

17
Bending a sheet of reflective material into a parabolic shape makes PTCs. As shown in Figure 2.4, a metal black tube, covered with a glass tube to reduce heat losses, is placed along the focal line of the receiver. When the parabola is pointed towards the sun, parallel rays incident on the reflector are reflected onto the receiver tube.
Figure 2.4 Schematic of a parabolic trough collector
Parabolic trough technology is the most advanced and most mature solar thermal technology to generate heat at temperatures up to 400˚C (750˚F) for solar thermal electricity generation or process heat applications. The biggest application of this type of system is the Southern California power plants, known as solar electric generating systems (SEGS), which have a total installed capacity of 354 MW7F
8. New developments in the field of PTC aim at cost reduction and improvements of the technology. For instance, the collector can be washed automatically thus reducing drastically the maintenance cost. IEA8F
9 provides a summary for solar collectors and working temperatures for different applications. The summary is shown in Figure 5. 2.2.2 Parabolic Dish Collectors (PDC) A concentrating parabolic dish focuses the light to a single point. Due to high power density, this method can be used for production of high temperature steam. In order to track the sun, they need two-axis tracking systems.
2.2.3 Fresnel Reflectors There are various Fresnel reflector designs; however, linear Fresnel reflector (LFR) is the more common technology in solar thermal systems. LFR collectors work very much the same as parabolic trough systems. In this system the parabolic reflectors are replace by plates with varying angle to concentrate the light on to the focal absorber tube.
8 Kearney DW, Price HW. Solar thermal plants-LUZ concept (current status of the SEGS plants). Proceedings of the Second Renewable Energy Congress, Reading UK, vol. 2.;1992. p. 582–8.
9 International Energy Agency, Technology roadmap: solar heating and cooling, 2012, http://www.iea.org/publications/freepublications/publication/name,28277,en.html

18
2.2.4 Other Concentrating Thermal Technologies Power towers or central receiver tower are among the large-scale utility scale power generation technologies which is out of the scope of this chapter.
2.3 Hybrid Solar Thermal Technologies Combination of photovoltaic and solar thermal technologies for co-generation of heat and electricity is an approach to increase the potential of solar technologies for wider range of applications. In the following section, these technologies will be reviewed briefly. In addition to photovoltaic, the solar thermal technologies has been integrated with other energy resources such as geothermal and biomass.
2.3.1 Photovoltaic- thermal (hybrid PV/T) solar collector panels The hybrid PV/T technologies collect the solar radiation and convert part of that to electricity and the majority of the rest to the thermal energy. These systems are composed of photovoltaic (PV) cells to convert the solar radiation to the electricity and solar thermal collectors, which captures the remaining solar radiation or removes the waste heat from the PV panels or both of them. The capture of both electricity and heat increases the overall efficiency of the system. One of the advantages of this technology is the increased efficiency of the PV panels by removing the heat. PV panels’ efficiencies are sensitive to temperature and at higher temperature the efficiency drops very fast. However, the disadvantage of the system is that the solar thermal collector might underperform compared to a standalone solar thermal collector. Based on the heat transfer agent being air or a liquid various types of PV/T technologies are available.
In a typical liquid PV/T system, water or glycol is circulated inside the pipe attached to the back of the PV panels. The waste heat of the PV panels is transferred to the heat transfer liquid. In close-loop systems the heat will be captured in the heat exchanger but in open systems the heated water could be used directly.
2.3.2 Concentrating hybrid PV/T (CPV/T) technologies The hybrid CPV/T systems employ a light concentrating technology such as parabolic trough, parabolic dish, or Fresnel reflectors. The advantages of these systems are: a) smaller PV cells are required, b) due to higher temperature, the solar thermal part works more efficiently.
Companies have developed different CPV/T technologies. Some examples are Cogenra Company and REhnu Company, which have developed parabolic trough and parabolic dish hybrid CPV/T technologies, respectively.
2.3.3 Hybrid Solar Thermal and Geothermal The integration of solar technologies with geothermal energy has been studied from different angles and for different applications. Kondili and Kaldellis(Kondili and Kaldellis 2006) integration of geothermal technologies to a solar greenhouse. Lentz and Almanza(Lentz and Almanza 2006a; Lentz and Almanza 2006b) studied the employment of parabolic trough solar thermal panels to increase the geothermal wells flow enthalpy. In 2010 Ozgener(Ozgener 2010) studied the hybrid wind-geothermal system for solar greenhouses. The study of the utility-scale integration of solar and geothermal technologies started in 2011. Astofia et al(Astolfi, et al. 2011) evaluated the techno-economic analysis of solar-geothermal hybrid plant based on an Organic Rankine Cycle (ORC). In their scenario a parabolic trough solar field was combined with a geothermal ORC binary plant.

19
2.3.4 Hybrid Solar Thermal and Biomass Different groups have done theoretical and analysis of integration of solar thermal and biomass energy resources.(Kibaara, et al. 2012; Pokhrel, et al. ; Prabhakant, et al. 2012)

20
3 CHAPTER 3: THE INDUSTRIAL SOLAR THERMAL MARKET
A selective few companies are marketing solar thermal systems to the California industrial market. This chapter provides information about companies marketing and selling systems to agricultural, food processing industries and other industrial end-users around the world.
3.1 Solar Thermal Applications Industrial food and beverage processors use steam and hot water to process field crops and for sanitation purposes. Solar thermal energy can also power absorption chillers and heat pumps to heat and cool buildings. Low-pressure steam, hot water, process heat and cooling loads can be supplied to industrial facilities with solar thermal systems.
Figure 3.1 Solar collectors and working temperatures for different applications. From pg. 21 in IEA’s
report. Figure 3.1 presents an overview of different types of SHC technology and their temperature ranges, in combination with the working temperatures required for different applications of solar heating. In the following sections, these applications will be discussed in more detail: 3.1.1 Water Heating For the SWH system, the main system components include solar collectors, solar storage tanks, heat exchangers, controllers, and circulating pumps. While most other components are standard, there are a number of fundamentally different choices for solar collectors. In the US SWH’s collector market, the main types of collector are flat plate panel and evacuated tube.
21
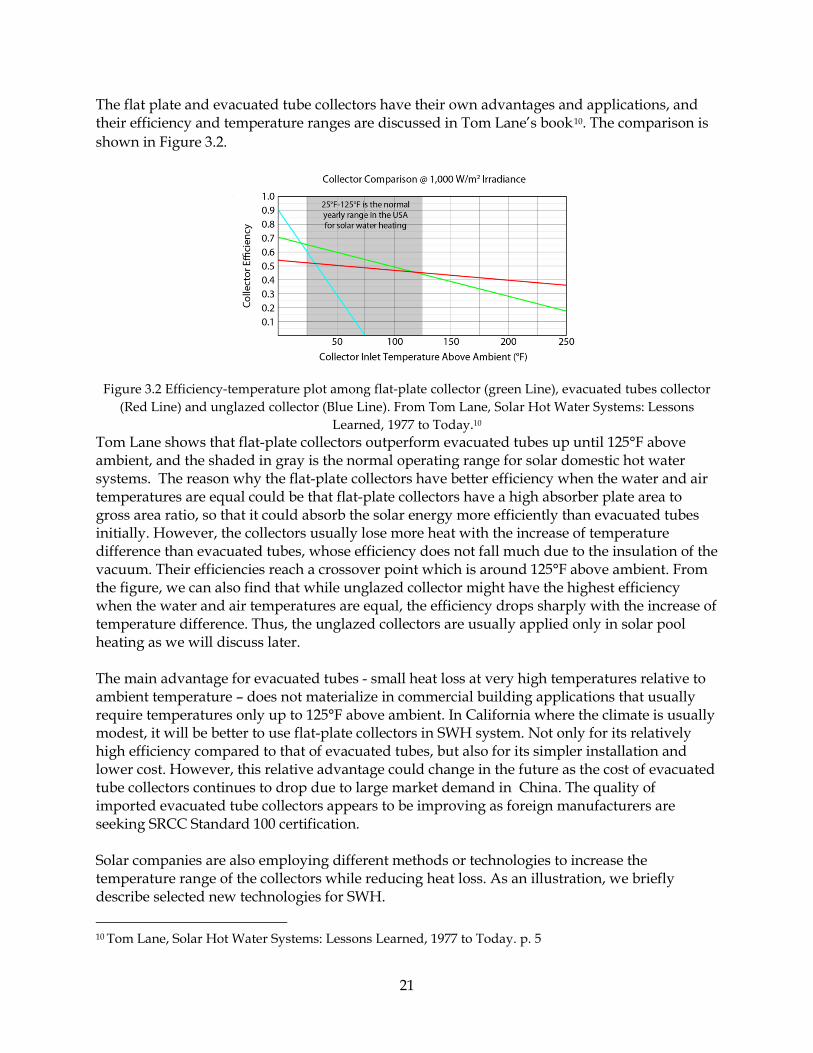
The flat plate and evacuated tube collectors have their own advantages and applications, and their efficiency and temperature ranges are discussed in Tom Lane’s book9F
10. The comparison is shown in Figure 3.2.
Figure 3.2 Efficiency-temperature plot among flat-plate collector (green Line), evacuated tubes collector (Red Line) and unglazed collector (Blue Line). From Tom Lane, Solar Hot Water Systems: Lessons
Learned, 1977 to Today.10 Tom Lane shows that flat-plate collectors outperform evacuated tubes up until 125°F above ambient, and the shaded in gray is the normal operating range for solar domestic hot water systems. The reason why the flat-plate collectors have better efficiency when the water and air temperatures are equal could be that flat-plate collectors have a high absorber plate area to gross area ratio, so that it could absorb the solar energy more efficiently than evacuated tubes initially. However, the collectors usually lose more heat with the increase of temperature difference than evacuated tubes, whose efficiency does not fall much due to the insulation of the vacuum. Their efficiencies reach a crossover point which is around 125°F above ambient. From the figure, we can also find that while unglazed collector might have the highest efficiency when the water and air temperatures are equal, the efficiency drops sharply with the increase of temperature difference. Thus, the unglazed collectors are usually applied only in solar pool heating as we will discuss later. The main advantage for evacuated tubes - small heat loss at very high temperatures relative to ambient temperature – does not materialize in commercial building applications that usually require temperatures only up to 125°F above ambient. In California where the climate is usually modest, it will be better to use flat-plate collectors in SWH system. Not only for its relatively high efficiency compared to that of evacuated tubes, but also for its simpler installation and lower cost. However, this relative advantage could change in the future as the cost of evacuated tube collectors continues to drop due to large market demand in China. The quality of imported evacuated tube collectors appears to be improving as foreign manufacturers are seeking SRCC Standard 100 certification. Solar companies are also employing different methods or technologies to increase the temperature range of the collectors while reducing heat loss. As an illustration, we briefly describe selected new technologies for SWH. 10 Tom Lane, Solar Hot Water Systems: Lessons Learned, 1977 to Today. p. 5

22
3.1.2 Flat plate systems with the highest efficiency From the rating summary in Solar Rating & Certification Corporation (SRCC)10F
11, specification and performance charts exist for almost all glazed flat plate collectors that currently exist in the market. In our case, we choose the performance charts measured in a clear and warm day in which the solar panel receives 2000 BTU per square feet over the full day and the inlet temperature is 36˚F higher than the ambient temperature. This condition might be the most generally applicable category for water heating for people living in southern US climates---especially in California. A ranking reveals that Heliodyne’s product has the largest BTU per sqft ratio at 1280 BTU per square foot of collector area. This ratio essentially presents the core performance of the collectors. The comparison chart is shown in Table 3.1.
While efficiency is a relevant metric that shows sophistication of a technology, it is also important to mention that this Clear Day rating table is limited in evaluating the best collector for any particular application, with varying temperatures and water demand rates. The final answer has to be accurate modeling through the 8760 hours of the year given heat availability and demand profiles. Also, efficiency is only one consideration – durability and resistance to extreme temperatures are also important considerations for lifecycle cost analysis.
How does Heliodyne reach such large efficiencies? Heliodyne Inc. provides a product line that utilizes glazed flat-plate collectors for domestic SWH in commercial applications. Compared to its competitors, Heliodyne employs thermal foam insulation11F
12 inside the flat plate to minimize heat losses. Besides, it uses highly selective surface absorber coatings with 95% solar absorptivity and only 5% thermal emissivity to further obtain optimal efficiency.
Table 3.1 Top five glazed flat plate collector products in term of their BTU-Sqft ratio from the SRCC ratings summary. Heliodyne smaller GOBI HT panel occupies the third rank and Agua Del Sol larger
Radco panels occupy the fourth and fifth rank, but are removed to provide greater product diversity. It is also important to note that this table will likely be outdated at the time of release as the number of
collector manufacturers entering the Standard 100 process is rapidly expanding and performance ratings are increasing.
Manufacturer Brand Name Gross Area (ft^2)
Clear C (kBtu/ft^2.Day)
Clear C (kBtu/Day per panel)
Heliodyne, Inc. GOBI HT 40.15 1.28 51.56 Agua Del Sol Radco 23.61 1.27 30.04
Wagner Solar Inc. Wagner 24.11 1.21 29.14 KIOTO Clear Energy AG GREENoneTEC 108.18 1.19 128.98
EnerWorks, Inc. Commercial
Collector 30.92 1.18 36.54
3.1.2.1 Case Study of the Best Performing glazed flat-plate collectors from SRCC rating Heliodyne provides two successful solutions for commercial water heating based on their products, which employ flat-plate collectors. In January 2008, Heliodyne incorporated alternative energy into Lucky Labrador Brewing Company’s beer-making process. After the
11 https://secure.solar-rating.org/Certification/Ratings/RatingsSummaryPage.aspx
12 http://www.heliodyne.com/industry_professionals/downloads/GOBI%20Spec%20Sheet.pdf

23
installation, the SWH system heat the water to the 160° to 200° Fahrenheit needed for brewing, while the air temperature outside was around 40° Fahrenheit. In another application, Heliodyne installed solar hot water at Centertown in the Northern California town of San Rafael, providing hot water to a sixty-unit apartment complex. The cost and estimated benefit for those cases are summarized in Table 3.2 below.
Table 3.2 Cost and estimated benefits for SWH by using glazed flat-plate collectors. From Heliodyne Case Studies12F
13 13F
14. Case Lucky Labrador Brewery
Centertown
System Cost US $ 63,903 US $ 51,000
Federal Tax Rebate
30% of system cost 30% of system cost
Size 642 sqare feet 562 square feet
Actual Annual Energy Output
2.7 therms/sf/yr 2.4 therms/sf/yr
Projected Annual CO2 Reduction
20,490 lbs. 47,255 lbs.
3.1.3 Pool Heating In the US market, there are two types for solar pool heating: unglazed solar collectors and glazed solar collectors.
Unglazed solar collectors economically provide low-temperature water heating (0° to 30°F above ambient). These collectors are inexpensive and unobtrusive when integrated into building design, and simple to install. Unglazed collectors do not include a glass covering (glazing). They are generally made of heavy-duty rubber or plastic treated with an ultraviolet (UV) light inhibitor to extend the life of the panels. Because of their inexpensive parts and simple design, unglazed collectors are usually less expensive than glazed collectors. The
13 http://www.heliodyne.com/about_us/press/Brewery_Case_Study.pdf
14 http://www.heliodyne.com/commercial/case_studies/Centertown_Case_Study.pdf

24
performance of unglazed degrades in low air temperatures and they are not expected to heat the pool to comfortable temperatures during the intervening months of November to March.
The performance of unglazed collectors is very sensitive to three factors: the temperature of the water being heated, the temperature of the air, and the wind velocity during solar collection. The reason that unglazed collectors are very appropriate for pool heating is that the daytime air temperature is usually very near the pool water temperature (80-82˚F) in southern California and the Sunbelt. In fact, if the air temperature exceeds the pool water temperature, additional heat will be gained from convective transfer to the collector.
The California Solar Incentive-Thermal program is debating with the unglazed collector industry the critical assumptions that affect unglazed collector performance, especially in windy areas. The debate won’t be settled until we monitor some commercial pools in the program
For industrial processes, however, the temperature requirements are higher (usually above 150˚F), meaning winds will become a serious negative factor. In these cases, it is usually best to use unglazed collectors to pre-heat well or cold supply water, then use advanced flat plate collectors, or evacuated tubes or concentrating collectors to boost that temperature to closer to the end-use temperature, where it is heated by conventional methods.
Glazed collector systems are generally made of copper tubing on an aluminum plate with an iron-tempered glass covering, which increases their cost. In colder and windier weather, glazed collector systems—with heat exchangers and transfer fluids—capture solar heat more efficiently than unglazed systems. A solar system for heating spa water for therapeutic use should employ glazed collectors since temperature requirements are higher.
Since the climate in California is relative warm even in the winter season, unglazed solar collectors typically have shorter payback times, but they also have shorter useful lives, typically 10-20 years.
Again, from the rating summary in Solar Rating & Certification Corporation (SRCC), specification and performance charts exist for almost all unglazed flat plate collectors that are currently in the market (Table 3.3). Fafco Inc. SunSaver ST product’s high performance could be attributed to the collector heat exchanger technology14F
15. Traditional solar panels channel water into straight, unmixed flow, transferring energy only to the top of the water. By contrast, FAFCO’s technology thoroughly mixes the water through a subtle combination of angle, depth and frequency of "dimples", in a fully wetted surface. Pool water is directed into a revolving spiral flow, creating turbulence, which enhances heat transfer effectiveness, while keeping the economic advantage of an unglazed collector.
Table 3.3 Top five unglazed flat plate collector products in term of their daily BTU/Sqft ratio. (From the SRCC summary www.solar-rating.org, accessed June 25, 2014).
Company Name Brand Name Gross Area (ft^2) ASHRAE 96 Clear A (Btu/ft².Day)
UMA Solar Heliocol 24.15 2050 TEVA Energy Max G 24.15 2050
15 Revolution Panels, FAFCO solar energy, http://www.fafcosolar.com/go-solar/solar-pool-heater/revolution-panels/

25
UMA Solar Sunstar 24.15 2050 Fafco, Inc. SunSaver ST 47.51 1880
Suntrek Industries, Inc. Suntrek 24 1730
3.1.3.1 Case Study of a high performance unglazed flat-plate collectors from SRCC rating FAFCO installed solar pool heating systems at the Fountaingrove Athletic Club and Coast Guard Training Center in California. Fountaingrove's 135,000-gallon solar pool heating system keeps their swimming pool temperature at a comfortable 80 degrees while saving an estimated $25,000 annually. This commercial pool solar heating system conserves over 2 million cubic feet of natural gas and reduces emissions of 124 tons of greenhouse gases annually. The large Coast Guard training swimming pool in Petaluma is now heated by FAFCO’s pool solar heating system. The project will save over 3 million cubic feet of natural gas per year and eliminate the emissions equivalent of 130 tons of greenhouse gases annually. The cost and estimated benefit for those cases are summarized in Table 3.4 below.
Table 3.4 Cost and estimated benefits for solar pool heating by using unglazed flat-plate collectors. From Commercial Pool Solar Heating Case Studies: SolarCraft Success Stories15F
16
Project
Fountaingrove Athletic Club, Santa Rosa, CA
Coast Guard Training Center, Petaluma, CA
Pool Size 135,000 gallons 200,000 gallons
System Size 3,600 square feet 3,456 square feet
Panels (75) FAFCO High-Efficiency Revolution Panels
(72) FAFCO High-Efficiency Revolution Panels
Average Temperature
80–82° (April – September) 80–82° (April – September)
Annual Savings
US $25,000 US $20,000
Estimated 2 Million cubic feet of natural gas 3 Million cubic feet of natural gas
16 Case studies in commercial pool system. http://www.solarcraft.com/pages/poolcomcase.html

26
Energy Savings
Estimated Annual CO2 Reduction
124 Tons 130 Tons
3.1.4 Space Heating There are two types of solar air heating available in the US market: glazed air collectors and unglazed air collectors. Glazed collectors work particularly well for heating buildings that can accept variable temperatures, such as warehouses and garages, while unglazed collectors work best in facilities that have relatively high ventilation requirements that require an equal volume of heated make-up air. In addition, combined PV-thermal solution is a possible and interesting strategy. Photovoltaic modules are cooled, increasing their efficiency, by a plenum under the modules. The heated air is used directly to heat a room space, or through an air-water heat exchanger. A company marketing this technology is Echo First (PV Thermal), in Los Angeles. Glazed collectors use a metal absorber plate inside an insulated box, four to six inches deep, with a glass cover. These collectors are usually mounted on a south-facing wall to collect the low winter sun. Air is drawn from within the building using a blower and circulated through the collector whenever solar energy is available. The air is heated as it passes across the absorber plate and is ducted back into the building.
Unglazed air collector refers to a solar air heating system that consists of a metal absorber without any glass or glazing over top. Although many derivations exist, the most common type of unglazed collector on the market is the transpired solar collector (TSC, Conserval Engineering Inc., 199X). 26 or 24 gauge prepainted galvanized steel is corrugated to increase structural rigidity. The working principle of this so-called SolarWall is shown in Figure 7. TSCs use solar energy to preheat ventilation air. It uses dark-colored, perforated metal panels installed a few inches away from a south-facing wall. Solar energy absorbed by this dark facade heats the air flowing through the perforations. The warm air is generally taken off the top of the wall ensuring that all of the solar heat produced is collected. The heated air is then ducted into the building via a connection to the HVAC intake. On a sunny day, the air entering the air handling unit will already be pre-heated – anywhere from 30-70°F (16-38°C) above ambient for a conventional SolarWall system. The TSC is an efficient alternative for pre-heating ventilation air and can improve indoor air quality while reduces energy costs in facilities with large ventilation needs. These solar wall systems are most appropriate for buildings that need heat for many months of the year, such as northern climates.

27
Figure 3.3 Transpired Solar Air Collector Operations Schematic Transpired solar walls are remarkably simple, yet effective, energy sources available for certain commercial building applications. Compared to glazed air collector, TSCs have the following advantages:
• The collectors are virtually maintenance free, with no liquids and no moving parts other than the ventilation system fans.
• At night the collectors cause heat lost through the main building wall behind the collector system facade to be recaptured.
• Transpired collectors respond to demands for improved indoor air quality, because ventilation using outside air (rather than recirculated indoor air) is an integral part of the system.
• Collectors can be added on or designed as part of a building’s facade
In theory16F
17, while the SolarWall systems could produce up to 1,752 KBtu/year/ft2 under ideal condition (full sun in a year), the performance depends significantly on the climate (primarily cloud cover, sun angle, and air temperature) and efficiencies vary case by case. In general, each square foot of transpired collector will raise the temperature of 4 CFM of air by as much as 40°F, delivering approximately 240 kBtu annually per square foot of installed collector, while the typical annual efficiency for these systems is between 60% and 65%. Three case studies are shown here:
3.1.4.1 NREL Waste Handling Facility The transpired solar collector (TSC) application at the National Renewable Energy Laboratory (NREL) Waste Handling Facility (WHF) 17 was one of the earliest applications of this technology and provides a general idea on the performance of SolarWall. Since its installation in 1990, the system has provided solar pre-heated ventilation air to contribute to meeting the high heat ventilation air requirements of this facility. The NREL WHF was an ideal candidate for the SolarWall technology because the WHF has a large, south-facing wall area where 300 ft2 transpired collector could be installed. The detailed specifications are shown in Table 3.5.
NREL has found the following advantages of TSCs:
17 http://solarwall.com/media/download_gallery/SolarWall_Sellsheet.pdf

28
• the system requires minimal maintenance, with no liquids and no moving parts other than the ventilation system fans. The collector system should still be inspected periodically for physical damage and for proper operation of controls.
• the collector system was easily added to the building as a retrofit.
• the system is an effective way to harvest renewable energy for this ventilation air preheat application.
Table 3.5 SolarWall performance and benefits for solar air heating by using transpired solar collector (from a NREL report17F
18) Project NREL’S 1,300 ft2 Waste Handling Facility
System Size 300 ft2 transpired solar collector
Energy Production About 125 Btu/hr/ ft2 of heat delivery under ideal conditions (full sun)
Motivation Provide solar-heated ventilation air to offset some of the heating with conventional electric resistance heaters
Annual Savings 14,310 kWh (49 million Btu/yr) or about 26% of the energy required to heat the facility’s ventilation air
Components Black, 300 ft2 corrugated aluminum transpired solar collector with a porosity of 2%; bypass damper; two-speed 3000 CFM vane axial supply fan; electric duct heater; thermostat controller
Total Building Load 16 million Btu/month (4,586 kWh/year) average during the winter
Expected Life 25+ years
System cost $6,000 (2005 US dollars)
The facility is a chemical waste storage building that requires a ventilation rate of 3,000 CFM to maintain safe indoor conditions. The HVAC system energy use of 237 million Btu/year was reduced to 188 million Btu/year to heat the 1,300-ft2 facility, resulting in an annual saving of 49 million Btu/year. For comparison, in California (a warmer climate) , a standard commercial HVAC system would require 262 million18F
19 Btu/year to heat the same size facility, considering an air change rate of 4 for factory building19F
20 , a required temperature rise of 40°F, and 3000 CFM ventilation rate. Thus, 18 “Transpired Solar Collector at NREL’S Waste Handling Facility Uses Solar Energy to Heat Ventilation Air”, U.S. National Renewable Energy Laboratory, Report DOE/GO-102010-3096 https://www1.eere.energy.gov/femp/technologies/renewable_casestudies.html
19 Sizing commercial HVAC: http://www.bessamaire.com/cfm_btu_calculator.html
20 Air Change Rates: http://web.fscj.edu/Mark.Bowman/handouts/Air%20Change%20Rates.pdf

29
compared to traditional space heaters, TSCs can results in significant energy saving in large space heating applications. California being a milder climate, energy savings are estimated to be 200 – 400 kWh / m2/ day in most of the state, and up to 600 kWh / m2/ day in the Sierra Nevada mountains and near the Oregon border.
The system cost (includes collector equipment and labor for design and field supervision) is $6,000 or $20/ft² in 2005 US Dollar. This investment results in a nine-year simple payback considering annual bill saving, while the life expectancy is more than 25 years.
3.1.4.2 Wal-Mart Supercenter In November of 2005, Wal-Mart opened their first cold climate experimental store, the Aurora Supercenter, in the metro-Denver area. This store is the latest in environmentally sustainable design, and is equipped with the transpired solar collector of SolarWall. 8,000 ft2 (745 m2) of grey SolarWall cladding forms the south exterior wall of the Supercenter. The metal panels heat up in the sun, and the ventilation fans draw the warmed air on the surface of the wall through the perforations in the panels and into the air cavity. This solar-heated air is then distributed throughout the building and auto service center by the ventilation system using a series of long fabric ducts to deliver fresh air to shoppers in the store. The SolarWall panels are expected to reduce annual energy consumption at the Wal-Mart Supercenter by 1,325 million BTUs (388,000 kWh), and save the store around $20,000 U.S. per year in displaced energy costs at 2005 natural gas prices.
Figure 3.4 SolarWall panels on the south wall of Wal-Mart’s new Denver-area Supercenter. From SolarWall cases studies20F
21 3.1.4.3 Aircraft Hangar at NASA Dryden Flight Research Center in Edwards, California In 2001, Dryden Flight Research Center in Edwards, California issued an energy saving project on the Building 1623, an aircraft hangar, which received a 4,000 ft2 bronze SolarWall system on its south facing wall. This solar air heating system is heating 18,000 CFM of fresh air, and was projected to save $15,000 a year (using 2002 natural gases prices). This SolarWall project has received a tremendous amount of positive feedback; Dryden was the recipient of the Presidential Award for Federal Energy Management, and in 2001 was designated as a Federal Energy Saver Showcase Facility by the U.S. Department of Energy.
21 http://solarwall.com/media/download_gallery/cases/Wal-Mart_Y05_SolarWallCaseStudy.pdf
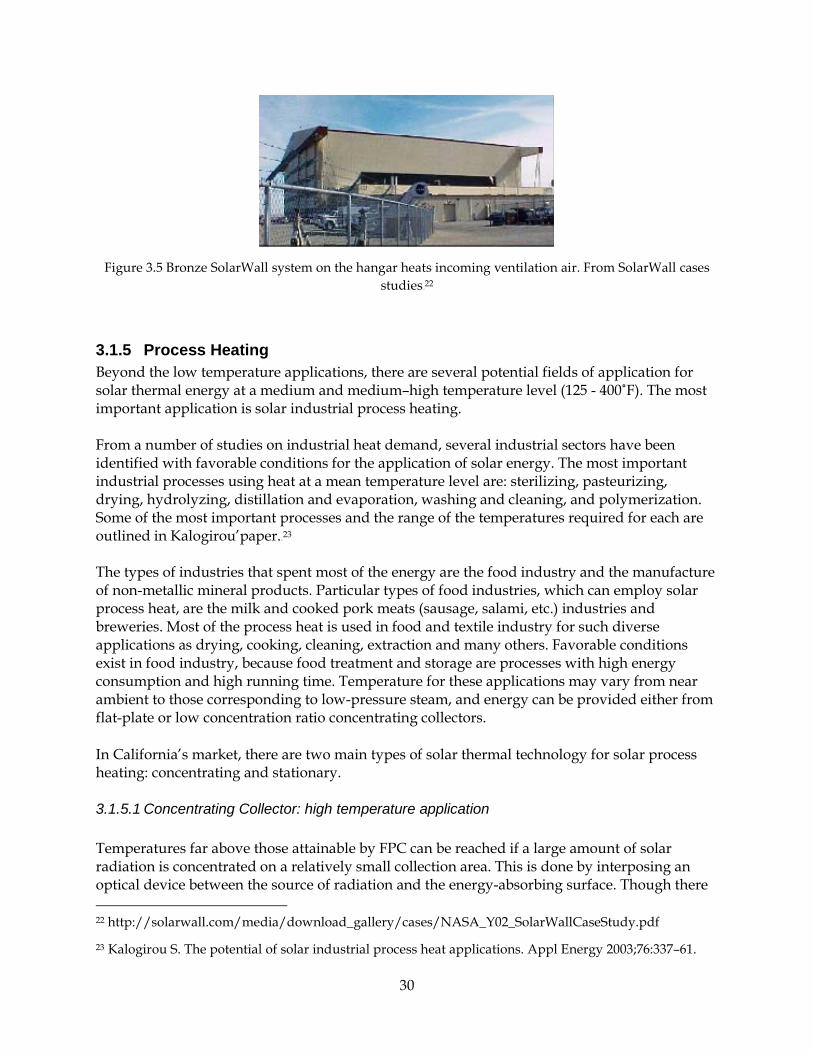
30
Figure 3.5 Bronze SolarWall system on the hangar heats incoming ventilation air. From SolarWall cases studies21F
22
3.1.5 Process Heating Beyond the low temperature applications, there are several potential fields of application for solar thermal energy at a medium and medium–high temperature level (125 - 400˚F). The most important application is solar industrial process heating. From a number of studies on industrial heat demand, several industrial sectors have been identified with favorable conditions for the application of solar energy. The most important industrial processes using heat at a mean temperature level are: sterilizing, pasteurizing, drying, hydrolyzing, distillation and evaporation, washing and cleaning, and polymerization. Some of the most important processes and the range of the temperatures required for each are outlined in Kalogirou’paper.22F
23 The types of industries that spent most of the energy are the food industry and the manufacture of non-metallic mineral products. Particular types of food industries, which can employ solar process heat, are the milk and cooked pork meats (sausage, salami, etc.) industries and breweries. Most of the process heat is used in food and textile industry for such diverse applications as drying, cooking, cleaning, extraction and many others. Favorable conditions exist in food industry, because food treatment and storage are processes with high energy consumption and high running time. Temperature for these applications may vary from near ambient to those corresponding to low-pressure steam, and energy can be provided either from flat-plate or low concentration ratio concentrating collectors.
In California’s market, there are two main types of solar thermal technology for solar process heating: concentrating and stationary.
3.1.5.1 Concentrating Collector: high temperature application Temperatures far above those attainable by FPC can be reached if a large amount of solar radiation is concentrated on a relatively small collection area. This is done by interposing an optical device between the source of radiation and the energy-absorbing surface. Though there 22 http://solarwall.com/media/download_gallery/cases/NASA_Y02_SolarWallCaseStudy.pdf
23 Kalogirou S. The potential of solar industrial process heat applications. Appl Energy 2003;76:337–61.

31
are many types of concentrating collector, as we have discussed before, we would be interested in parabolic trough collectors (PTC) in our report. PTCs can effectively produce heat at temperatures up to 400˚C (750˚F), which would be an ideal collector for high temperature process heating application. California Energy Commission provides an analysis report23F
24 on a high temperature solar thermal system at a Frito-Lay snack food plant, snack foods plant located in Modesto, California, offering a typical installation of a large scale solar thermal system for process heating application in California.
Figure 3.6 Installation of parabolic trough collectors in Frito-Lay. From Pg. 18 in the report18.
The total collector field is comprised of 384 individual parabolic trough collectors (PTC) with a net aperture area of 142 square feet each, as shown in Figure 10. The panels are installed permitting rotation about a north ‐south axis, tra to evening position each day. In this installation, high temperature water in excess of 232˚C (450˚F) is produced by a concentrating solar field, which in turn is used to produce approximately 300 pounds per square inch (20 bars) of process steam. Process steam in the plant is used for cooking, which includes heating edible oil for frying, and heating baking equipment. Steam is also converted into hot water for cleaning and sterilization processes. The expected natural gas offset is 12 billion BTU/year. 3.1.5.2 Stationary Collectors: mid-low temperature application
Stationary collectors do not move and can be further subdivided into flat-plate collectors and evacuated tube collectors (see Chapter 2). Flat plate collectors can achieve temperatures when heating up to 125˚F above ambient, but they are not yet economically efficient beyond 125˚F.
24 Industrial Process Stream Generation Using Parabolic Trough Solar Collection, Public Interest Energy Research (PIER) Program, 2010

32
Evacuated tube collectors have reached economically efficient temperatures beyond 125˚F above ambient, making them a useful complement to flat plate collectors for high temperature applications. By adding reflector plates to concentrate the sunlight and tracking the sun, these collectors can efficiently reach temperatures up to 200˚F above ambient. Stationary collectors would be ideal collectors for mid-low temperature process heating applications.
Although evacuated tube collector is able to reach higher temperature which better support process heating application especially in cold climate, it is not prevalent in California due to the state’s warmer climate and collector’s higher price. On the other hand, industry is attempting to increase the temperature threshold of flat-plate collector type at a relative lower cost compared to concentrating collectors. In the current market, a representative product is Micro-Concentrator (MCT) by Chromasun. Micro-Concentrator (MCT) uses the same technology as utility-scale flat-plate solar thermal collector, except in a much smaller package. It has been designed to provide useful heat up to 400°F (205°C) and is therefore perfect for supplementation of commercial process heat. Since it was founded only recently (in 2008), there is limited independent information for Chromasun MCT’s performance, but Chromasun has announced SRCC Certification of its MCT solar thermal panel, and the MCT is officially the world's highest temperature certified solar panel at 350˚F. Chromasun MCT offers a comparison24F
25 among its product and the most common collector types in the market.
Figure 3.7 Comparison between Chromasun collector and other common collectors. From Solar Heating
and Cooling, Chromasun Rooftop Applications Advanced Solar Thermal Seminar – ERC 1 December 2011. (Global = 1000 W/m2, DNI = 850 W/m2)
25 Solar Heating and Cooling: Chromasun Rooftop Applications, Advanced Solar Thermal Seminar – ERC 1 December 2011

33
In Figure 3.7, Chromasun MCT shows a relative stable and efficient curve within a large temperature range, while other common collectors’ efficiency drop obviously as the operating temperature increases. However, since it is only a little time period after the company announced its products; we still need time to see the comparison results from more independent institutions.
Chromasum also offers their current and future projects in Advanced Solar Thermal. The projects are summarized.
60 Micro-Concentrator collectors were installed at Santa Clara University’s (SCU) Benson Center. The Chromasun MCT panels will produce an estimated 6,727 therms of energy annually and heat water to 200 degrees Fahrenheit for Benson Memorial Center’s dining services. Heating water with solar energy rather than with natural gas will reduce the building’s water-heating bills by as much as 70 percent and offset 34 tons of CO2. Moreover, Chromasum plans to invest another project for solar process heating in San Diego, CA. The cost and estimated benefit for those projects are summarized in Table 3.6 below.
Table 3.6 Cost and estimated benefits for solar process heating by using special flat-plate collectors developed by Chromasum. From Solar Heating and Cooling, Chromasun Rooftop Applications25F
26, Advanced Solar Thermal Seminar – ERC 1 December 2011
Benson Center (Santa Clara University)
Boiler Feedwater Pre-Heat(Process Heat Proposal)
Location Santa Clara, CA San Diego, CA
Collectors 60 MCTs 200 MCTs
Total Collector Area 2,682 square feet Unknown
Collector Loop Capacity 300 gallons Unknown
Therms Offset (1 Year) 6,727 25,434 (estimated)
Other Benefits 10% reduction in gas price, 4.2 year payback
26 Advanced Solar Thermal Seminar – ERC 1 December 2011 http://chromasun.com/images/content/presentations/Chromasun%20ERC%20Seminar%201%20December%202011.pdf

34
3.1.6 Operational Issues Compared to PV, solar heating applications present more significant challenges for operating a system over their lifetime. Meteorological conditions present freezing risks for stagnating water in solar collectors at nighttime in all but the coastal California climate zones, which can have catastrophic consequences. Glycol is often used to avoid freezing, but during the day stagnating glycol can overheat reducing its lifetime. Water-based systems with drainback tanks allow water to be drained from the collectors at night and mitigate the freezing risk. In addition, scale accumulation, scald prevention, etc. need to be considered when operating water systems
3.2 Solar Thermal Companies There are many companies participating in the California solar thermal market. Most of them are competing in the residential solar water heating market, with some companies also selling into the commercial building and institutional market sectors. There are only a few companies marketing to the industrial sectors.
Researchers identified solar energy companies that have sold solar thermal equipment to agricultural and industrial facilities in California, other states and Europe. Researchers also identified companies that are active in the commercial and institutional sectors with the potential to migrate to the industrial market segment. The companies are listed in alphabetical order.
Abengoa Solar Abengoa Solar is now dedicated to building commercial-scale concentrating solar power (CSP) and installing utility-scale PV power plants. Abengoa’s solar thermal technology was installed at the Frito Lay facility in Modesto, California. Researchers are unaware of strategic decisions made by the company to not continue working in the commercial and industrial market segments, but Abengoa Solar has been very successful with the installation and operation of 1,223 MW of solar power generation.26F
27
Absolicon Absolicon markets their solar thermal systems as a “clean energy alternative” for European industrial facility managers, expected to reduce air pollution emissions. 27F
28 Absolicon's solar concentrator technology is designed to produce hot water and low-pressure steam. The Absolicon X10PVT solar concentrator is designed to produce "thermal heat up to 75°C and electricity at 230 V".28F
29 One of these systems has been installed as a small test site at a large-scale, Greek dairy processing company that "manages both cows and sheep to produces milk and cheese".29F
30
Researchers contacted Absolicon to learn more about the use of the solar concentrator technology they market to the food industry. The company has not responded to our enquiries and no literature is available about other industrial thermal projects. The company is located in Sweden.
27 http://www.abengoasolar.com/web/en/index.html 28 http://www.absolicon.com/product/absolicon-x10-pvt/ 29 http://www.absolicon.com/product/absolicon-x10-pvt/ 30 http://www.absolicon.com/case/koukfarm-grekland/

35
Agriculture Solar Agriculture Solar, located in Tucson, Arizona is dedicated to serving the solar energy needs of agricultural customers.30F
31 The company's solar thermal systems are sold to produce hot water for equipment or systems’ sanitization at dairies and food processing facilities and for pasteurization unit operations.31F
32 The thermal energy systems can be integrated with "other heat recovery systems" including "refrigeration heat recovery", such as agriculture solar sales hybrid systems to enhance the performance of an existing or new heat recovery system.32F
33
Researchers contacted Agriculture Solar to learn about installed solar thermal projects. The company did not responded to these enquiries.
Aztec Solar Aztec Solar, a long-term provider of residential and commercial solar thermal systems in the greater Sacramento, California region, is entering the industrial market with the installation of a FAFCO33F
34 solar water heating equipment, at the Stapleton-Spence Packing Company in Gridley, California. The solar thermal system is used to raise well water temperature by 30 degrees F to pre-heat boiler water, resulting in 37,500 therms saved, in addition to emission reductions of 1.4 million pounds of CO2.34F
35 A very generous $500,000 CSI-Thermal incentive and a 30 percent federal tax credit benefit of $240,000 are accrued, reducing private investment to only $60,000.35F
36 This highly subsidized project only generates $16,500 per year in natural gas cost savings, helping Stapleton earn a 25 percent rate of return on investment.36F
37
Aztec Solar is adopting FAFCO’s cost-effective panels to reduce production costs and be more competitive. The company is also investing in the development of solar cooling systems to displace industrial electric loads. Researchers have requested additional information and have been invited to visit the Rancho Cordoba facility.
Bresco The Blue Ridge Electric Service Company provides contracting services to residential, commercial and industrial customers in North Carolina.37F
38 The company designs and installs solar PV and solar thermal systems, as well as provides construction services for micro-hydro and wind generation projects. The Lake James Cellar Company in Glen Alpine, North Carolina has used their services to design and install flat plate collectors to generate hot water for process and cleaning purposes at the winery.38F
39
31 http://www.agriculturesolar.com/index.html#.UurRnhBdWiU 32 http://www.agriculturesolar.com/3b_thermal_solar_energy_power.html#.UurQmhBdWiU 33 http://www.agriculturesolar.com/3b_thermal_solar_energy_power.html#.UurQmhBdWiU 34 http://fafco.com/ 35 On average, an 80 Panel system will save 56 tons of CO2per year or 1,408 tons over the lifetime of the system. A properly sized solar thermal system can save up to 80% of your hot water bill. http://aztecsolar.com/solar-services/commercial-solar/commercial-water-heating.html 36 Stapleton Case Study.pdf http://www.stapleton-spence.com/about-stapleton.php 37 http://www.dsireusa.org/incentives/incentive.cfm?Incentive_Code=US06F 38 http://brescoltd.com/index.html 39http://apps1.eere.energy.gov/buildings/ush2o/projects/commercial_projects_detail.cfm/projectId=47

36
Calpak Solar Calpak Solar, in Bristol, Connecticut offers documentation of a few installations in agricultural and food processing facilities. The company has identified agricultural, dairy and other food processing facilities as good candidates to use solar thermal "to supplement their daily hot water needs for washing, sanitizing, sterilizing and cooking."39F
40
Calpak Solar promotes the results of a few agricultural and process heating installations, including a 140 cow dairy farm in Ireland, a pig breeding facility in Ciprus and hot water systems at a winery in Italy and a small brewery in Belgium.40F
41
Chromasun Chromasun markets their equipment as" proven solar cooling and heating systems that significantly reduce utility bills".41F
42 The company is targeting the commercial buildings and institutional markets with new installations at a medical center and a university campus in California. Chromasun is marketing the economic and environmental benefits of using solar thermal energy in buildings, particularly with the integration of thermal chillers and heat pumps.
Chromasun's competitive advantage is their ability to deliver high temperature water to drive refrigeration chillers. By displacing electricity, Chromasun is expanding the economic potential of solar thermal systems to participate in the air conditioning market segment.42F
43 By installing their Micro-Concentrator (MCT) panels, Chromasun can deliver 3500F temperatures to partially drive thermal chillers.43F
44
Natural gas is used to supplement the solar thermal driven chillers, designed to operate with solar and natural gas fuels. The installation of electricity displacing thermally driven chillers will reduce electricity cooling demand (kWh) and electric loads (kW), at this time the most expensive energy costs in the operation of commercial buildings. The thermally driven chillers also generate waste heat at 850F that can be captured and used for water heating purposes.44F
45
Chromasun is also participating in the commercial building hot water market segment, in particular at institutional buildings for the environmental benefits of reducing the use of fossil fuels. Delivering 2000F water to the dining services at a university campus is expected to reduce natural gas consumption by 6,727 therms per year, the equivalent of 34 metric tons of CO2.45F
46 This 25 year lifespan project is financed with a ten year lease, estimated pay-back period of six years.46F
47
Chromasun also competes in the heat pump market segment by offering the Heat Pump Energy Solution system, providing base-load domestic hot water and chilled water simultaneously.47F
48 The solar thermal heat pump/chiller system is driven by the MCT panels producing 2500 F
40 http://www.cpsolarthermal.com/applications/agricultural-and-process-heating/ 41 CP Solar Thermal LLC is the official US Partner of Calpak-Cicero Hellas | ISO 9001:2008 210 Century Drive, Bristol, CT 06010 | Phone 860.877.2238 | Email: [email protected] http://www.cpsolarthermal.com/applications/agricultural-and-process-heating/ 42 http://chromasun.com/ 43 http://chromasun.com/images/content/resources/Abu_Dhabi_V2.pdf 44 http://chromasun.com/CHW.html 45 http://chromasun.com/CHW.html 46 http://chromasun.com/images/content/resources/Benson%20Center%20Case%20Study.pdf 47 http://chromasun.com/images/content/resources/Benson%20Center%20Case%20Study.pdf 48http://chromasun.com/images/content/resources/Chromasun%20Heat%20Pump%20Energy%20Solution_20111013.pdf
37
temperatures to operate the heat pumps. The heat pump technology can be integrated to a back-up boiler adding robust reliability when solar energy is not available.48F
49
Chromasun was successful in securing almost a million dollar grant from the California Energy Commission, in 2013. The grant will allow the company to install a 25-ton absorption chiller to produce chiller water and hot water at a California hotel facility.49F
50
Researchers contacted Chromasun to learn more about the company's intent to market their technologies in the industrial sector. Chromasun was founded in 2008, and it is based in San Jose, California.
Cogenra Cogenra, located in Mountain View, California is one of the leading companies participating in the California industrial solar thermal market. The company developed and markets a hybrid system that produces solar photovoltaic (PV) electric energy and captures excess heat to generate hot water (solar cogeneration).
Company marketing materials describe the solar cogeneration system as “mirrors and single-axis trackers” that “focus light on a photovoltaic cell assembly.” 50F
51 This emerging technology captures the heat that “normally is lost in a typical PV-only product”, to “heat water that actively cools the solar cells.” 51F
52
Cogenra markets their solar cogeneration system as a solar PV system that can also deliver hot water resources, with technical and economic potential at dairy farms, wineries and food processing facilities. The system is required to be installed on land space. The company calculates that the hybrid cogeneration system can be paid back within five years, after all CSI-Thermal incentives and State and Federal tax credits are earned.
Cogenra has installed several systems since it was founded almost four years ago. A showcase installation at Sonoma Wine Company encouraged other wineries to invest in this source of renewable energy. The Cogenra’s solar cogeneration system at the Kendall - Jackson Winery52F
53 in Santa Rosa, California is generating 241 kW of PV electricity and heating 1.4 million gallons of water using solar thermal resources.53F
54 Another Cogenra installation is located at Sula Vineyards, a unique vineyard/winery located in the Nashik Valley, in India.54F
55
In 2014, Cogenra is scheduled to install a new solar cogeneration system at the UC Davis, Jess Jackson Sustainable Winery Building.55F
56 This system will supplement existing PV electricity generation and supply hot water to the winery and brewery facilities.
Cogenra’s sale of their solar cogeneration system to Clover Stornetta Farms, a dairy processor in Petaluma, California gives the company an entry point to the dairy processing sector. The system was designed to generate 50.6 kW of PV electricity and supply 1450 F water for the Clean in Place system.56F
57 Cogenra also reports that they are working with the Woodfour Brewing
49http://chromasun.com/images/content/resources/Chromasun%20Heat%20Pump%20Energy%20Solution_20111013.pdf 50 http://chromasun.com/index.html 51 Cogenra.com 52 Cogenra.com 53 Appendix B 54 Case Study: Kendall-Jackson. http://cogenra.com/images/caseStudies/KJ_Case_Study_20120703.pdf 55 http://sulawines.com/default.aspx 56 Jess Jackson Sustainable Winery Building http://www.news.ucdavis.edu/search/news_detail.lasso?id=10608 57 Case Study: Clover Stornetta, http://cogenra.com/images/Clover_Case_Study.pdf,

38
Company, a “craft brewery in the new Barlow area of Sebastopol, CA”.57F
58 Cogenra’s inroads into the horticultural sector include an installation at General Hydroponics, a producer of greenhouse nutrient products with factories in North America and Europe.58F
59
Other encouraging developments include the agreement with Johnson Controls to use Cogenra’s solar cogeneration technology to power their absorption chiller technology,59F
60 and a demonstration project to utilize waste heat to power absorption chillers,60F
61 at the Southern California Gas Company’s (SoCalGas), Energy Resource Center (ERC) building in Downey, California.61F
62 The 50.2 kW, SoCalGas installation will produce PV electricity to offset electricity costs and produce heat to drive a "single-effect absorption chiller".62F
63 This system creates heat storage capacity to deliver on-demand cooling resources, achieving cost reductions from electricity demand conservation (kWh) and cost savings from reduced peak electricity demand charges (kW).63F
64
Company management strives to compete with natural gas prices, estimated to be $0.02 to $0.03 per kilowatt-hour equivalent.64F
65 Cogenra and other integrated solar PV/Thermal systems have a high value product by generating distributed energy using PV systems. Cogenra is targeting locations where natural gas pipelines are not always available (India) and where higher costs of natural gas (Japan and Europe) may drive solar thermal's value higher than in the U.S.65F
66
Helio Power Helio Power, a California company "providing solutions for business and government"66F
67 is marketing their energy consulting and solar solutions expertise to the agricultural67F
68, commercial68F
69, and industrial and water districts69F
70. Helio Power has also identified the food processing industry as a high value candidate for their products and services. Company records show the installation of 540 kW of solar PV electricity at a nut drying facility in Hughson, California, another 516 kW PV electricity generation at a vineyard in Bakersfield, and 325 kW at a food manufacturing facility in Riverside, also in California.70F
71
58 Cogenra Solar Newsletter, January 2014. http://hosted.verticalresponse.com/823685/06ae10b436/1474681005/406a2e298a/ 59 General Hydroponics, http://generalhydroponics.com/site/index.php/about_us/our_story/
1 60 Johnson Controls launches chiller solutions with advanced solar technology Posted on February 22, 2013 by districtenergy http://www.districtenergy.org/blog/2013/02/22/johnson-controls-launches-chiller-solutions-with-advanced-solar-technology/ 61Posted on May 22, 2012 by districtenergy. http://www.districtenergy.org/blog/2012/05/22/socalgas-launches-cogenra-into-solar-cooling-market/ 62 Sopogy.com 63 Posted on May 22, 2012 by districtenergy. http://www.districtenergy.org/blog/2012/05/22/socalgas-launches-cogenra-into-solar-cooling-market/ 64 Posted on May 22, 2012 by districtenergy http://www.districtenergy.org/blog/2012/05/22/socalgas-launches-cogenra-into-solar-cooling-market/ 65 CEO Gilad Almogy,. http://www.greentechmedia.com/articles/read/Cogenras-PV-and-Hot-Water-Business-Heating-Up, Eric Wesoff, May 7, 2012 66 Eric Wesoff, May 7, 2012. http://www.greentechmedia.com/articles/read/Cogenras-PV-and-Hot-Water-Business-Heating-Up 67 http://heliopower.com/commercial-energy/ 68 http://heliopower.com/ag/ 69 http://heliopower.com/business-solar/ 70 http://heliopower.com/water/ 71 http://heliopower.com/ag/solar-examples/

39
Johnson Controls Johnson Controls, a global building's energy management systems company71F
72 has introduced a "solar cooling solution" for buildings. The company is integrating a YORK Absorption Chiller to be powered by a Cogenra hybrid solar PV/thermal system.72F
73 The Cogenra system will generate PV electricity and produce hot water for the absorption chiller. Customers will generate electricity and reduce air conditioning electricity demand.
The potential for Johnson Controls to migrate their solar cooling system to the industrial sector is promising. Johnson Controls already has an established market presence in the industrial refrigeration space, supplying refrigeration systems to supermarkets and installing the Frick®
industrial refrigeration systems at food processing and beverage manufacturing facilities.73F
74
Securing the partnership with Johnson Controls provides Cogenra the opportunity to break through the industrial refrigeration market. The Cogenra system provides Johnson Controls with the opportunity to offer a clean energy solution to global customers, many of who are interested in achieving GHG emission reduction goals.
Ritter Gruppe The German based company is a large manufacturer of evacuated tube collectors used at residential, commercial and large-scale installations.74F
75 Their panels are installed at the Testa Produce Company in Chicago, Illinois, a large distributor of refrigerated fruits and vegetables. This company has adopted renewable energy sources, including solar PV, wind and a solar water heating system.75F
76
Sopogy Sopogy from Honolulu, Hawaii has an established history of innovation through research and development of solar thermal systems. In 2009, the company introduced “the first commercially available Concentrating Solar Power technology designed specifically for rooftop installations”.76F
77 This breakthrough should have allowed the company to be more cost competitive. Sopogy is integrating technologies to participate in multiple industrial energy markets, including steam, solar cooling, drying, dehumidification, desalination, and hot water.77F
78 The company continues to deliver interesting breakthroughs.
In 2009, Sopogy installed a 10-ton solar cooling system at the SoCalGas, ERC building in Downey, California.78F
79 The Center is dedicated to education, training and demonstration of energy conservation and efficiency practices and technologies. In 2012, the Center installed a Cogenra solar PV/Thermal system to add another 10 tons of renewable-sourced refrigeration.
72 http://www.johnsoncontrols.com/ 73 Solar Cooling Solution, Combined technologies collect 75 percent solar energy, qualify for incentive
http://www.johnsoncontrols.com/content/us/en/about/our_company/featured_stories/solar-cooling-solution.html
74 Frick® Industrial Refrigeration For Food & Beverage Industries. http://www.johnsoncontrols.com/content/us/en/products/building_efficiency/products-and-systems/industrial_refrigeration/frick_equipment.html
75 http://www.ritter-gruppe.com/en/about-us.html 76 http://www.testaproduce.com/index.html 77 http://en.wikipedia.org/wiki/Sopogy#cite_note-11 78 Sopogy.com
79 Sopogy.com

40
The Sopogy and Cogenra systems combined deliver “about 5% of the Downey center's air conditioning”.79F
80
In 2014, Sopogy is entering the industrial market by winning the bid to install an industrial hot water system at the ABInBev brewery in Fairfield, California.80F
81 Researchers learned from PG&E’s staff that this project is one of the first industrial solar thermal projects participating in their SCI-Thermal program. It is not surprising that the Fairfield, ABInBev facility is investing in renewable solar hot water systems. The facility already has solar PV systems, a wind power turbine and a bio-energy digestion system producing biogas resources. PGE representatives also mentioned that the facility is considering the installation of an additional wind turbine.
Sopogy is also expanding their ability to generate high temperature (200 to 400°F) solar thermal heat for industrial boilers. 81F
82 Researchers contacted Sopogy to learn more about other industrial projects in California. 82F
83
Sundrum Solar Sundrum Solar, from Hudson, Massachusetts is marketing the PV/Thermal hybrid system to generate electricity and heat water resources for residential, commercial and food processing facilities.83F
84 The SunDrum technology is installed to the "underside of the PV panels to capture the waste heat generated by the "solar irradiance" generated by PV panels. The SunDrum system is marketed to capture up to "75% of the suns energy".84F
85
The company literature offers case studies of installations in residential and commercial buildings. Sundrum Solar is now advertising the completion of the "largest on-roof commercial PVT system in the United States," located at Schofield Barracks, in Oahu, Hawaii.85F
86 The company is marketing this hybrid system with a payback period of less than three years, when Federal and State incentives are utilized. The SunDrum hybrid system is designed for PV retrofit installations giving the technology a competitive advantage over turnkey hybrid systems. 86F
87
WaterFX The Panoche Water District, in the San Joaquin Valley of California is testing a pilot solar thermal desalinization plant designed to treat contaminated subsurface groundwater.87F
88 The company’s Aqua4TM system is designed as an “engineered aquifer”.88F
89 WaterFX uses the Concentrated Solar Still (CSS) technology to generate thermal energy used in the evaporation 80 http://articles.latimes.com/2012/may/28/business/la-fi-mo-solar-air-conditioner-20120525 81 Information learned from a competing company, at the CLFP Expo 2014. 82 http://sopogy.com/pdf/contentmgmt/App_Sheet_Heat_Print.pdf 83 (888) SUNEDISON, (888) 786-3347, (866-767-6491) 84 http://www.sundrumsolar.com/commercial.html 85 http://www.sundrumsolar.com/commercial.html 86 http://sundrumsolar.com/files/documents/schofield_pr_final_m.pdf 87 http://www.sundrumsolar.com/commercial.html 88 Water-Cleaning Technology Could Help Farmers, By TODD WOODY, FEB. 16, 2014, http://www.nytimes.com/2014/02/17/technology/water-cleaning-technology-could-help-farmers.html?_r=0 89 http://waterfx.co/

41
and distillation of spent-water. 89F
90 The system is designed to treat wastewater, drainage water, runoff water, saline groundwater and industrial process water. The system also concentrates brine residues into by-products.90F
91
The demonstration project produced 14,000 gallons of “purified water a day”. 91F
92 The project is scheduled to continue by building a commercial-scale facility, with the goal to produce 2,200 acre-feet of desalinated water per year. 92F
93 WaterFX estimates a cost of $450 to produce an acre-foot of water, compared to the $280 charged by the Central Valley Project. 93F
94 WaterFX’s has already lowered the system costs by only using “off-the-shelf equipment” and replacing electricity-driven compressors with a heat pump. 94F
95 The WaterFX system also uses molten salt storage technology allowing the desalination plant to operate 24 hours, seven days a week. 95F
96
3.3 Market Potential The solar industry estimates that there are 9 GWth of solar heating and cooling (SCH) capacity installed in the United States. 96F
97 The Solar Energy Industries Association (SEIA) forecast that 75 GWth of capacity will be expected to be installed in the United States by 2050.97F
98 The SEIA report does not disaggregate the forecast by end-use sectors, thus researchers are unable to assess the size of the U.S. industrial solar thermal market. The SEIA is recommending policies and incentives to increase installed capacity to 300 GWth.98F
99
Researchers are not aware of published forecasts to assess the heat and cooling solar thermal market in California. Researchers can assume that similar market incentives (public policy, public incentives, private financing) will do for solar thermal what the CSI incentive program and tax credits accomplished for solar PV installations. It is not however unreasonable to assume that the solar thermal market will not behave accordingly.
It is not the same to generate expensive electricity with solar PV, than to displace low cost natural gas with solar thermal systems. Solar PV generates electricity priced at $0.10 to $0.15 per kW hour for industrial customers. Solar thermal systems have to compete with low natural gas prices, equivalent to $0.02 to $0.03 per kilowatt-hour.99F
100
Researchers will assume that the continued low price of natural gas will represent a significant market barrier for the adoption of industrial solar thermal hot water systems. The innovations and competitive advantages from emerging technologies may help overcome the low-cost fuel disadvantage. Companies like Cogenra are offering thermal resources as a complement to the installation of solar PV systems. Sopogy is developing lower cost higher efficiency systems to deliver hot water for heat and refrigeration unit operations. Aztec Solar is adopting cost-effective materials to compete on price. These companies will benefit from the new CSI Thermal Industrial programs. The incentives are generous and favor large-scale projects.
90 http://waterfx.co/ 91 http://waterfx.co/ 92 http://waterfx.co/ 93 http://waterfx.co/ 94 http://waterfx.co/ 95 http://waterfx.co/ 96 http://waterfx.co/ 97 SEIA, SHC Roadmap. file:///C:/Users/Ricardo/Downloads/SEIA%20SHC%20Roadmap-Final-9.30.pdf 98 SEIA, SHC Roadmap. file:///C:/Users/Ricardo/Downloads/SEIA%20SHC%20Roadmap-Final-9.30.pdf 99 SEIA, SHC Roadmap. file:///C:/Users/Ricardo/Downloads/SEIA%20SHC%20Roadmap-Final-9.30.pdf 100 Cogenra, CEO Gilad Almogy, 100

42
Although researchers assume that industrial facility managers are not motivated to replace existing hot water systems with solar thermal systems, corporate managers may be interested in this clean energy alternative to reduce Green House Gas (GHG) emissions.
In 2013, the California Air Resources Board (CARB) sponsored three GHG Auctions under the Cap and Trade (C&T) program. The auction started with a price of $10 per metric ton of GHG emissions and fluctuated between $11 and $13.100F
101 Researchers recommend that a solar energy calculator tool be used to calculate the percentage contribution that emission reduction credits may contribute to a modeled solar thermal system.
Researchers recognize that not all potential solar thermal system installations will generate a GHG revenue stream. For the time being, CARB only requires facilities that emit 25,000 or more metric tons of carbon dioxide, to participate in the C&T program. These facilities are the most likely to purchase GHG Allocations at CARB's Auctions,101F
102 to offset the environmental cost of GHG emissions over and above 25,000 metric tons. These facilities include utility power plants, cement manufacturing, oil refining, heavy industries and large food and beverage facilities.
Researchers are not in a position to estimate the current rate of adoption of industrial solar thermal systems or predict the growth of this market segment.
101 CARB 102 In 2013, C ARB sponsored three GHG Auctions.

43
4 CHAPTER 4: INDUSTRIAL SOLAR THERMAL INSTALLATIONS
Researchers conducted interviews with vendor companies and industrial end-users, and acquired data from national data base sources.102F
103 There are only a few industrial solar thermal system installations in California. Table 1 provides details about location, application and vendor, for the solar thermal projects identified through this assessment.
The following sections in this Chapter provide details about the winery, brewery, and creamery industries, as they are early-adopters of industrial solar thermal systems. Appendices are offered with descriptions and pictures for most of the solar thermal systems identified in Table 4.1.
4.1 Wineries It is no coincidence that California's wine industry is an early adopter of solar thermal renewable energy, as they were the early adopters of PV electricity within the agricultural and food processing industries.
Before adopting renewable energy they had already embraced Integrated Pest Management (IPM) practices and developed sustainability metrics to reduce water use, fertilizer and chemical applications.
Often, technology developers visit first with wine industry managers to explore the technical and economic potential of appropriate emerging technologies.
It is no coincidence that the Kendall-Jackson winery is one of the early adopters of the Cogenra PV/Thermal hybrid system. The Jess S. Jackson family has also sponsored the construction of the University of California Davis, Sustainable Winery Building (JSWB).
103 Utility Solar Water Heating Initiative (USH2O) http://apps1.eere.energy.gov/buildings/ush2o/projects/commercial_solar_thermal_projects.cfm
UC Davis Winery Enhanced by JSWB Resources
1) Collecting rainwater and recovering
the process water (at least five times) The rainwater is filtered by reverse osmosis membranes
2) Converting the fermentation CO2 via a Carbon sequestration process to calcium carbonate achieves zero-carbon-emission-winery
3) The solar thermal technology provides hot water for heating and cooling applications
4) Solar panels provide the electricity to make this winery energy positive on a total kWh basis and at peak load on a kW basis
5) Part of the electricity is used for hydrogen production through water electrolysis. This hydrogen can be t d t b th f d t k f th f l

44
The building is designed to collect rainwater, adopt water recycling, achieve fermentation CO2 process sequestration and generate sustainable energy production to the adjacent winery and brewery. The building is available to house multiple emerging technologies, among them a Cogenra solar PV/Thermal hybrid. The system is expected to be installed during 2014; to produce storable hot water in two heavily insulated 120OF storage tanks. Part of the solar PV electricity will be used by an icemaker to deliver cool water to 40OF for the fermentation equipment and the building.
Table 4.1 Industrial Solar Thermal projects
India Sula Vineyards Hot water Cogenra
US/NC Lake James Cellars Hot waterAlternate Energy
Technologies (AET)
US/SC R J Rockers Brewing Co. Hot water AET
US/SC Westbrook Brewing Company Hot water AET
Solar Skies
Irealand Cow dairy farm Hot water
US/Ca Frito Lay Hot water Abengoa
US/CA Stapleton's Fruit Packing Co. Process heat FAFCO
US/CA Houweling's Hot House Hot water Aztec Solar
SunEarth
Cyprus Pig Breeding Hot water
Vendor
Cogenra
Country/State Project Name Application
US/CA Sonoma Wine Company Hot water / PV
US/CA Kendall-Jackson Winery Hot water / PV Cogenra
US/CA UC Davis Jackson Winery Hot water / PV Cogenra
Italy Wine Storage Hot water Tanks Calpak
Belgium Brewery Hot water Calpak
US/WI Red Eye Brewing Co Hot water
Calpak
Calpak
Portland, ME Oakhurst Dairy Hot water Owner Builder
US/CA Clover Stornetta Hot water / PV Cogenra
US/WI Johnson Controls Corporate Headquarters
Hot water

45
Energy Management in Wineries California produces about 90% of all U.S. wine, and after France, Italy, and Spain California is the world's 4th leading winemaker. There are 3,800 wineries, which cover 546,000 acres of wine-grapes.103F
104
In addition to growing grapes and producing wine, wine industry managers are keenly aware of the need to conserve water, to be more energy efficient and to reduce GHG emissions. Although the available data is dated to 2001, the winery industry was estimated to have consumed 2.9 billion gallons of water to produce 574 million gallons of wine104F
105, five gallons of water per gallon of wine produced. The industry consumed an average of 23 million Therms of natural gas and demanded 406 million kW hours of electricity.
Table 4.2 Water and Energy Use Values from Food Industry sectpr
104 http://www.wineinstitute.org/resources/statistics 105 105 TECHNOLOGY ROADMAP ENERGY EFFICIENCY IN CALIFORNIA'S FOOD INDUSTRY http://www.energy.ca.gov/2006publications/CEC-500-2006-073/CEC-500-2006-073.PDF

46
Energy Demand in Wineries Electric-driven motors/pumps, fans, conveyors and lighting equipment consume 50 percent of total energy demand in wineries. Table 3 shows that an additional 40 percent of total energy demand is dedicated to electric power driven refrigerated cooling loads. Only 10 percent of the energy used in wineries is attributed to thermal sources, mostly to heat water for equipment sanitation purposes.
Table 4.3 Estimated Process Energy Requirements at California Food Processing Industry
Researchers can assume that stand-alone solar thermal systems competing with natural gas to fire hot water boilers would not be a cost-effective investment at seasonal wineries. The California wineries that have adopted the Cogenra solar PV/Thermal hybrid system receive solar hot water as an added benefit to generating solar PV electricity. That is not to say that stand-alone solar thermal systems cannot be cost competitive in other locations where natural gas is not always available (India) and more expensive sources of energy are utilized (East Coast/Europe).
Appendices show results from a few winery case studies.
4.2 Breweries The brewery industry has also invested in sustainability manufacturing principles, particularly with the adoption of energy efficiency, resource conservation and renewable energy implementation.105F
106 These trends are evident among the microbrewery industry; the small and medium sized breweries as well as the large non-craft brewing companies. The Sierra Nevada Brewing Company in Chico, California is a prime example of a medium-sized brewery investing in clean energy and sustainability: including all potential energy efficiency measures, solar PV installation, bio-energy anaerobic digester, hydrogen fuel cells, 106 https://www.brewersassociation.org/attachments/0001/1530/Sustainability_Energy_Manual.pdf

47
CO2 recovery, bio-diesel fuel production and several other innovation projects.106F
107 Sierra Nevada owners were motivated to build a second brewery in Mills River, North Carolina to reduce the transportation footprint107F
108, as their craft beer gains more market share in the east coast. However, the company has evaluated the potential to use solar thermal technologies and concluded that the Chico facility is already producing enough hot water from their heat recovery practices, including heat recovery from the boilers, fuel cells, and the fermentation process. 108F
109
On a larger scale, the Fairfield, California AB inBev facility is generating electricity with solar PV and a win turbine, producing biogas fuel from a bio-energy anaerobic digester. The company has issued a purchasing order to install a parabolic solar thermal system from Sopogy and a second wind turbine, in 2014.109F
110
National data shows that there are 2,538 brewery facilities in the U.S., of which only 24 are categorized as “large non-craft breweries”110F
111 Only three of these large facilities are located in California, including the Miller Coors factory in Irwindale, and the ABInBev, Los Angeles and Fairfield, facilities. Also at the national level, U.S. consumers bought over 200 million barrels of beer in 2012, of which only 13.2 million barrels were craft beer sales.111F
112
Energy Demand in Breweries Thermal energy is used to generate hot water and steam resources in the brewing process. Electricity powers motors, compressed air systems and refrigeration equipment. Thermal energy is mostly fueled by natural gas, delivering 70 percent of the total energy used at a typical brewery. Thermal energy, at current natural gas prices, only represents 30 percent of the total energy costs.112F
113 Because electricity is the most expensive energy source, brewery managers have expressed some interest in the adoption of solar thermal cooling systems to displace electric powered refrigeration demand.113F
114 The California Solar Energy Collaborative recommends investing CEC/EPIC funds to advance the science and technology of industrial solar cooling systems.
Resource Management in Breweries A survey conducted among 225 breweries, representing a third of the world’s production, documented that the brewery industry has “reduced their energy usage over 9% and water usage by over 17% over the last four years”.114F
115 For California-based breweries, energy management also involves the management of air pollution emissions. Under the California Air Resources Board (CARB) Cap % Trade program, facilities emitting 25,000 metric tons of CO2 per year have to purchase CARB allocations, to off-set GHG pollution
107 http://www.sierranevada.com/brewery/about-us/why-we-brew 108 http://www.sierranevada.com/brewery/about-us/sustainability#/transportation 109 Interview with Cheri Chastain, sustainability coordinator of Sierra Nevada. 110 2/11/14 conversation with PGE staff. 111 https://www.brewersassociation.org/pages/business-tools/craft-brewing-statistics/beer-sales 112 http http://www.arb.ca.gov/cc/reporting/ghg-rep/reported-data/ghg-reports.htm s://www.brewersassociation.org/pages/business-tools/craft-brewing-statistics/beer-sales 113 https://www.brewersassociation.org/attachments/0001/1530/Sustainability_Energy_Manual.pdf 114 December 2013, January/February 2014, researcher’s interviews with SoCalGas utility staff. 115 The Worldwide Brewery Industry Water and Energy Benchmarking Survey, http://www.dailyenergyreport.com/brewing-industry-untapped-source-for-energy-efficiency/

48
emissions. Among California-based breweries, in 2012, the Miller Coors, Irwindale facility generated 39,242 Metric Tons of CO2. 115F
116 The same year, the ABInBev facility in Los Angeles produced 52,750 Metric Tons of CO2.
116F
117
As previously mentioned, the ABInBev facility in Fairfield is planning to install a solar thermal system for hot water production. The facility only generates 17,212117F
118 metric tons of CO2, thus is not yet subject to CARB’s Cap & Trade Program. Researchers assume that the CO2 Cap &Trade allocations earned by the Fairfield facility, from the reduction of natural gas fuel consumption, will be saved for this facility or be utilized to offset the cost of CO2 emissions at the Los Angeles facility, which is subject to Cap &Trade compliance.
The L.A. facility may also become a candidate location for a solar thermal hot water production system. Researchers assume that the facilities that are subject to the Cap & Trade threshold will be incorporating CO2 costs to calculate brewing production costs. In addition to paying cash for GHG allocations, industrial managers can invest in GHG emission reduction projects. Facilities that install solar thermal systems that displace natural gas use can earn Cap &Trade allocations.
The side-bar shows industry data that establishes a CO2 metric for the production of beer.118F
119 This metric can be used to calculate the amount of CO2 allocations that can be earned by displacing natural gas use with solar thermal systems, as well as with biogas generation and other thermal energy conservation practices.
In contrast, Cap &Trade allocations are not earned by the facility when electricity demand reductions occur. The Cap &Trade allocations are earned by the electric utility power plant generation facility. The industrial facility does not receive any GHG emission reduction allocations for displacing electricity demand. IOUs earn the allocations and are expected to deliver cost effective energy efficiency program services to industrial facilities to reduce both thermal and electric energy demand.
Renewable Energy in Breweries Although most microbrewery managers are familiar with the technical resources offered by the Brewer’s Association, researchers recommend readers to further explore the Sustainability Energy Manual and other energy efficiency and renewable energy tools and documents. 119F
120
Regarding renewable energy sources, the Manual identifies Sun Power (PV electrical power, solar heating, CSP), Wind Power (wind generation – all sizes), Bio-mass (heat generation, power generation), Land-fill gas, Bio-gas (heat generation, power generation), Waste to energy sources (heat generation, power generation) and Geothermal (direct heating, electrical generation, HVAC) as the renewable energy technologies previously evaluated for the brewery industry.120F
121 The Manual offers a comparison matrix among these technologies to support industry managers with the “due diligence” process.
116 http://www.arb.ca.gov/cc/reporting/ghg-rep/reported-data/ghg-reports.htm 117 http://www.arb.ca.gov/cc/reporting/ghg-rep/reported-data/ghg-reports.htm 118 http://www.arb.ca.gov/cc/reporting/ghg-rep/reported-data/ghg-reports.htm 119 https://www.brewersassociation.org/attachments/0001/1530/Sustainability_Energy_Manual.pdf 120 https://www.brewersassociation.org/attachments/0001/1530/Sustainability_Energy_Manual.pdf, March 2013 121 https://www.brewersassociation.org/attachments/0001/1530/Sustainability_Energy_Manual.pdf, March 2013

49
Table 5 provides information about these renewable energy sources as potential investments in the brewery industry. Solar heat is given a “move forward with project development” recommendation.
Table 4.4 Technical Characteristics of Multiple Renewable Energy Technologies
Appendices provides details from several brewery industry case studies.
4.3 Dairy Creamery Industry More than 1,700 California dairy farms supply 42 billion pounds121F
122 of raw milk to industrial milk processing facilities (creameries) to process fluid milk, cheese, butter, ice cream, whey protein and other dairy products. The 2007, D&B database identifies 88 companies processing milk, including 32 fluid milk companies (SIC 2026), 38 natural, processed, and imitation cheese companies (SIC 2022), and 18 companies manufacture ice cream and frozen desserts (SIC 2024).122F
123 These farms and industrial facilities operate 365 days a year, 24 hours per day.
Energy Requirements in Creameries Like their colleagues in the winery and brewery industries, dairy creamery managers are keenly aware of the need to conserve water, to be more energy efficient and to reduce GHG emissions. Although the available data is dated to 2001, the dairy creamery industry was estimated to have consumed 960 million gallons of water, 76 million Therms of natural gas and 713 million kW hours of electricity.
122 CDFA, 2012. 123 Dun & Bradstreet, 2007

50
Table 4.5 Water and Energy Use Values from Food Industry Sectors
Thermal systems demand between 40 to 55 percent of total energy consumed at dairy creameries. Electric-driven equipment consume between 25 to 35 percent with refrigeration demanding an additional 15 to 20 percent of power. Table 7 also shows that only 5 percent of the energy is used for sanitation purposes.
Table 4.6 Estimated Process Energy Requirement at California Food Processing
Industry
Dairy creameries are one of the largest year-round consumers of industrial thermal energy. This dual characteristic provides a market opportunity for solar thermal energy systems to

51
participate in the IOU’s, CSI Solar Thermal Industrial program incentives. This assumption is not based on past performance, knowing that there are very few solar thermal projects installed.
In California, the Cogenra system installed at the Clover Stornetta dairy creamery in Petaluma is producing solar hot water as an added benefit to generating solar PV electricity. An integrated solar thermal system installed at the Oakhurst Dairy in Portland, Maine is using seventy two solar thermal panels to preheat water for milk case washing, in addition to floor and equipment sanitation. The company integrated waste heat recovery with the solar thermal system to displace between 7,000 to 10,000 gallons of fuel oil.123F
124
124 http://www.usda.gov/oce/reports/energy/Web_SolarEnergy_combined.pdf

52
5 CHAPTER 5: CALIFORNIA ENERGY EFFICIENCY AND GREENHOUSE GAS EMISSION GOALS
To proceed, we start to examine the scenario of each solar heating application in California. In the following, California’s Energy Efficiency Goals and Greenhouse Gas (GHG) Emissions Goals are introduced.
In 2003, the California Public Utilities Commission (CPUC) created a framework to make energy efficiency a way of life in California. The Commission recognized that California’s very ambitious energy efficiency and greenhouse gas reduction goals require long-term strategic planning to eliminate persistent market barriers and effect lasting transformation in the market for energy efficiency across the economy. Accordingly, the Commission is committed to prepare and adopt a long-term strategic plan for California energy efficiency through 2020 and beyond. The plan articulates a long-term vision and goals for each economic sector and identifies specific near-term, mid-term and long-term strategies to assist in achieving those goals. It is California Energy Commission’s Energy Action Plan I124F
125, which identifies energy efficiency as California’s top priority resource. Under Public Utilities Code Section 454.5(b)(9)(C) utilities are required to first meet their “unmet resource needs through all available energy efficiency and demand reduction resources that are cost effective, reliable, and feasible.” Based on the energy efficiency plan, Navigant125F
126 provides an estimate of potential energy and demand savings for California for all commercial buildings and new construction. The study provides forecasts on two forms of potential: technical potential and economic potential. We will focus on technical potential analysis in this report. Navigant calculates technical potential by using the product of a measured savings per unit, the quantity of applicable units in each facility, and the number of facilities in a utility service area.
Also, Navigant introduces 21 emerging technologies to account for new potential that will become available through these technologies. As there technologies become technically and economically viable, they cause an upward shift in technical and economic potential. The report also illustrates that potential energy savings in the commercial sector are impacted significantly by the introduction of emerging technologies to utility portfolios. After accounting for the federal standards, emerging technologies, behavioral impacts, forecasted loads, and modeling methodology, building energy efficiency goals were calculated.
125 Energy Action Plan I”, California Energy Commission, California Public Utilities Commission and Consumer Power and Conservation Financing Authority. May 8, 2003. Available at: http://docs.cpuc.ca.gov/word_pdf/REPORT/28715.pdf
126 Navigant Consulting Inc. Nov. 2011, Analysis to Update Energy Efficiency Potential, Goals and Targets for 2013 and Beyond, http://www.cpuc.ca.gov/PUC/Energy+Efficiency/Energy+Goals+and+Potential+Studies.htm

53
Figure 5.1 California commercial buildings energy efficiency goals. Refer to Pg. 104 Figure 43 in Navigant126F
127 The blue line indicates the technical potential while the red line represents the economic potential. For example, the technical potential in 2012 is approximately 363 million of therms.
Furthermore, the California Governor signed Executive Order S-3-05127F
128, which establishes greenhouse gas (GHG) emission targets and charges the California Environment Protection Agency secretary with the coordination of efforts to achieve them. Then, in 2006 Assembly Bill 32 (AB32), the ”Global Warming Solutions Act” became law, setting a binding target that GHG emission be brought back down to the 1990 level by 2020. Based on this blueprint, McCollum128F
129 introduces CA-TIMES, a bottom-up, technologically rich, integrated energy-engineering-environmental-economic system model that has been developed to guide the long-term policy planning process. McCollum then explores the potential of various technology and policy options for reducing emissions across a number of different sectors and is summarized in Figure 13. The expected CO2 emissions for commercial buildings in 2012 are around 2.51 × 10⁶ metric tons.
127 Navigant Consulting Inc. Nov. 2011, Analysis to Update Energy Efficiency Potential, Goals and Targets for 2013 and Beyond, http://www.cpuc.ca.gov/PUC/Energy+Efficiency/Energy+Goals+and+Potential+Studies.htm
128 Executive Order S-3-05, http://climatestrategies.us/library/library/view/294
129 David McCollum, Christopher Yang, Sonia Yeh, Deep Greenhouse Gas Reduction Scenarios for California — Strategic implication from the CA-TIMES energy-economic systems model. Energy Strategy Reviews, Vol 1, Issue 1, March 2012, Page 19-32

54
Figure 5.2 California greenhouse gas emission reduction goals for the next 50 years. Refer to Pg.27 Figure 8 in McCollum129F
130
The CO2 emission for each option could be calculated with use of natural gas. One therm equals to 0.005 metric tons of CO2 emission when burning natural gas.130F
131
130 David McCollum, Christopher Yang, Sonia Yeh, Deep Greenhouse Gas Reduction Scenarios for California — Strategic implication from the CA-TIMES energy-economic systems model. Energy Strategy Reviews, Vol 1, Issue 1, March 2012, Page 19-32
131 Greenhouse Gas Equivalencies Calculator, http://www.epa.gov/cleanenergy/energy-resources/calculator.htm

55
6 CHAPTER 6: SOLAR WATER HEATING TECHNOLOGY OPTIONS AND PENETRATION SCENARIOS
To proceed, we start to introduce the most common application in solar heating system: solar water heating system.
Solar water heaters preheat water supplied to a conventional domestic hot water heating system. In principal water heating could be completely supplied by solar energy, but this is generally not economical because a large system would be required that would be underutilized for most of the year. Thus, the fraction of water heating systems that could be converted to SWH has been quantified.
We define technical potential consistent with KEMA-XENERGY as the complete penetration of all measures analyzed in applications where they were deemed technically feasible from an engineering perspective. The assessment includes measures that might not be cost-effective or have the backing of a strong consumer market. By disregarding these factors, the technical potential assessment provides an upper bound of efficiency potential regardless of cost or market penetration.
KEMA-XENERGY131F
132 provides a comprehensive report, which estimates the average and total savings potential for the entire existing commercial building population. The key data used in the report includes:
1. Total gas-served floor space of the in-scope commercial buildings
2. Annual natural gas consumption for each end use studied (both in terms of total consumption in therms and normalized for intensity on per-square-foot basis)
3. The saturation of natural gas end uses (for example, the fraction of total commercial floor space with natural gas water heating)
4. The market share of each base equipment type (for example, the fraction of total commercial floor space served by natural gas domestic hot water heaters)
5. Market share for each energy-efficiency measure in scope (for example, the fraction of total commercial floor space already served by high-efficiency boilers)
The primary sources for the end-use energy consumption estimates were the PG&E and SDG&E Commercial End Use Studies (CEUS). In CEUS, end-use natural gas consumption is expressed as the product of building floor space (in square feet), the fraction of floor space associated with a given end-use fuel (the end-use fuel saturation), and the EUI (the energy-use intensity of an end use expressed in therms per square foot). These three data elements have been collected
132 Fred Coito, Mike Rufo, May 2003, California Statewide Commercial Sector Natural Gas Energy Efficiency Potential Study Volume 1, California Measurement Advisory Council, http://www.calmac.org/allpubs.asp

56
and estimated from various sources over time and form the foundations upon which the estimation form natural gas consumption are developed.
As for the commercial natural gas consumption by end use, the report132F
133 indicates that water heating and space heating are by far the largest users of natural gas, accounting for 38 percent (782 Mth) and 31 percent (643 Mth) of total commercial consumption respectively. Table A.1 in Appendix summarizes commercial natural gas usage of water heating by business type. KEMA-XENERGY133F
134 also provides the technical potential for SWH. The technical potential for energy savings through displacing conventional water heating with SWH is shown by business type in Table A.2 in the Appendix
Based on Tables A.1 and A.2 in the Appendix, Figure 6.1 shows water-heating scenarios. The hotel industry has the highest potential to transition to SWH technology. In addition, Figure A.4 in the Appendix shows the gas technical potential for SWH in California by region. It is obvious that the Los Angeles Region (SCG) have more potential energy saving than other regions.
Figure 6.1 Technical potential for SWH of major business types, generated based on the data from Table A.1. Refer to KEMA-XENERGY’s report. The column represents the gas consumption of existing water
heating devices for main options in California, while the red part of the column represents the fraction of water heating system which could be converted to a SWH system.
To further understand the importance of potential SWH technology, Figure 6.2 was generated to help understand the extent which each option would help California achieve its energy efficiency and GHG emission goals. The accumulated contributions for all options do help California achieve majority of its energy efficiency and GHG emission goals.
133 Fred Coito, Mike Rufo, May 2003, California Statewide Commercial Sector Natural Gas Energy Efficiency Potential Study Volume 1, California Measurement Advisory Council, http://www.calmac.org/allpubs.asp
134 Fred Coito, Mike Rufo, May 2003, California Statewide Commercial Sector Natural Gas Energy Efficiency Potential Study Volume 2, California Measurement Advisory Council, http://www.calmac.org/allpubs.asp

57
Figure 6.2 Contribution of different business types to CO2 emission reduction goals by converting from conventional to SWH, generated based on the Table A.2 and Figure 14. Refer to KEMA-XENERGY’s
report.
6.1 Solar Water Heating Scenarios in Other States Other states are also on their way to estimating the benefits from SWH. NREL134F
135 introduces the entire water heating market in US and the potential natural gas saving by SWH. It divides the US into 13 regions and establishes the solar fraction from residential low-cost SWH systems for each region, which represents the fraction of buildings water heating energy demand met by the SWH system. It also assumes that commercial systems would achieve the same solar fraction as residential systems. The fraction of commercial building with roofs available for SWH was utilized to further refine the estimation of potential energy saving. Table 6.1 summarizes SW scenarios for other states.
135 P. Denholm, Mar. 2007, The Technical Potential of Solar Water Heating to Reduce Fossil Fuel Use and Greenhouse Gas Emissions in the United States, http://www.nrel.gov/docs/fy07osti/41157.pdf

58
Table 6.1 Technical potential energy saving of commercial buildings by converting to SWH by region. Natural gas represents the total regional end-use energy consumption for water heating inferred from Pg.
7 Table 1, LCS means energy efficiency of low-cost SWH system, inferred from Pg. 10 Table 2. Roofs implies the fraction of commercial buildings that can utilize SWH systems, inferred from Pg. 12 Table 3 in
NREL135F
136, Natural Gas (NG) savings potentials are calculated by manipulating the data from those two tables.
Natural Gas Use LCS Roofs NG Savings Saving
Region (Trillion BTU) (%) (%) (Million Therms) %
New England 15 45% 50% 34 22.5
Mid-Atlantic 35 45% 60% 95 27.0
E. No. Central 112 45% 60% 302 27.0
W. No. Central 39 45% 70% 123 31.5
S. Atlantic 49 55% 60% 162 33.0
E. So. Central 19 55% 60% 63 33.0
W. So. Central 23 60% 60% 83 36.0
Mountain 36 60% 65% 140 39.0
Pacific 7 45% 65% 21 29.2
New York 34 40% 60% 82 24.0
CA 78 60% 75% 351 45.0
TX 41 65% 70% 187 45.5
FL 8 70% 70% 39 49.0
The potential gas saving from SWH is calculated by multiplying the rooftop availability by solar fraction of LCS. These factors are then multiplied by total gas consumption to derive the potential energy savings which is visualized in Figure 16.
136 P. Denholm, Mar. 2007, The Technical Potential of Solar Water Heating to Reduce Fossil Fuel Use and Greenhouse Gas Emissions in the United States, http://www.nrel.gov/docs/fy07osti/41157.pdf

59
Figure 6.3 Statewide technical potential for energy savings by converting to SWH technology based on the data from Table 8. Refer to NREL’s report39.
From the figure, we could observe that, the amount of potential energy saving from coast to coast is very large. Among all the regions in US, California while being a pioneer in popularizing SWH technology is also the primary beneficiary from the energy savings. Florida, Texas, and California have the highest percentage saving of natural gas (Table 6.1). As an aside, the estimate for California, 315 Millions of Therms, is very close to the amount of energy efficiency goal adopted from Figure 12 in Navigant136F
137 discussed above.
137 Navigant Consulting Inc. Nov. 2011, Analysis to Update Energy Efficiency Potential, Goals and Targets for 2013 and Beyond,http://www.cpuc.ca.gov/ PUC/Energy+Efficiency/Energy+Goals+and+Potential+Studies.htm

60
7 CHAPTER 7: OTHER NON-DHW SOLAR THERMAL POTENTIALS IN CALIFORNIA
The potential market for other types of solar heating system, including solar process heating, solar space heating, solar pool heating and solar cooling are analyzed as followed.
With a solar pool heating system, the already good and pool friendly climate can extend the life of the swimming season by several months. KEMA-XENERGY137F
138 also provided total gas consumption for pool heating in commercial buildings as well as the technical potential for solar pool heating. In the report, pool heating efficiency improvements include high-efficiency pool heater, pool cover, and solar water heater. The estimate includes pools in commercial settings, such as health clubs and hotels, but does not include multi-family common areas. Total base consumption for the population is estimated by focusing on a prototypical pool’s consumption based on the penetration of pools obtained from the PG&E and SDG&E CEUS studies. The technical potential gas savings for solar pool heating in the report are collected and summarized in Table A.3 in the Appendix.
Figure 7.1 provides an overview of current pool heating scenarios for commercial buildings in California for the four business types where pools are most prevalent. Hotels account for the most potential energy savings, followed by schools and colleges. The energy saving for hospitals is small, because not many hospitals have pools.
Figure 7.1 Total energy use (total bar) and technical potential energy saving by converting to solar pool heating (red portion), generated based on Table A.3. Refer to KEMA-XENERGY’s report.
138 Fred Coito, Mike Rufo, May 2003, California Statewide Commercial Sector Natural Gas Energy Efficiency Potential Study Volume 2, California Measurement Advisory Council, http://www.calmac.org/allpubs.asp

61
Solar space heating uses solar thermal energy to heat the space inside buildings, which help lower heating bills and reduce dependence on fossil fuels. KEMA-XENERGY138F
139 offers the gas consumption in term of total millions of therms for space heating. While it does not offer technical potential for solar space heating, the fraction of savings is assumed to be the same as for SWH (Table 8). Table 7.1 provides the gas consumption of space heating for each type of business.
Table 7.1 Space heating gas consumption and potential solar space heating scenario of main option (Unit: Millions of Therms), Refer to Pg.78, Appendix G in KEMA-XENERGY139F
140 The solar fraction of potential SWH for each type of business is calculated from Appendix D and Appendix G in KEMA-XENERGY140F
141 and the potential energy saving for solar space heating is calculated by applying the solar fraction on the
current space heating scenarios.
Total Gas Consumption
(Millions of Therms) Solar Fraction (%)
Potential Energy Savings
(Millions of Therms)
Office 102.81 12.3 12.65
Restaurant 4.12 18.5 0.76
Retail 17.65 15.0 2.65
Foodstore 6.42 15.7 1.01
Warehouse 6.22 31.0 1.93
School 19.82 30.7 6.08
College 12.60 30.7 3.87
Hospital 29.19 30.7 8.96
Hotel 7.83 30.7 2.40
139 Fred Coito, Mike Rufo, May 2003, California Statewide Commercial Sector Natural Gas Energy Efficiency Potential Study Volume 2, California Measurement Advisory Council, http://www.calmac.org/allpubs.asp
140 Fred Coito, Mike Rufo, May 2003, California Statewide Commercial Sector Natural Gas Energy Efficiency Potential Study Volume 2, California Measurement Advisory Council, http://www.calmac.org/allpubs.asp
141 Fred Coito, Mike Rufo, May 2003, California Statewide Commercial Sector Natural Gas Energy Efficiency Potential Study Volume 2, California Measurement Advisory Council, http://www.calmac.org/allpubs.asp

62
Figure 18 illustrates the space heating scenarios in commercial buildings. Offices show the largest amount of therms and the largest potential energy saving. Offices would obtain the most benefit from solar space heating.
Figure 7.2 Total energy use (total bar) and technical potential energy saving by converting to solar space heating (red portion) based on Table 7.1. Refer to KEMA-XENERGY’s report.
Process heating and cooling are the last two thermal systems analyzed here. Process heating is used to heat energy during manufacturing of basic materials and goods. Typical process heating components are boilers, fired heaters, heated reactors, dryers, and heat exchangers. If solar could be introduced to a process heating system as an external source, the supplemental heat would decrease the load on existing heating equipment, reducing gas consumption and extending the life of the equipment. The demand for air conditioning in offices, school, and other commercial buildings is considerable and has increased interest in solar cooling. Itron141F
142 offers a California Commercial End-use Survey which provides detailed information of annual energy use for process heating and cooling. There are no well-documented studies on solar fraction for process heating and cooling known to the authors. Since solar process heating and cooling still depend on rooftop availability and LCS factors in same area, we assume that the solar fraction of solar process heating and cooling are the same with that of solar water heating in California. Thus, the solar fractions for solar hot water (Table 1.2) are used again to obtain the potential energy savings. The gas consumption and technical potentials for solar process heating and cooling are shown in Table 7.2.
The solar fraction assumptions may be too optimistic given that the heating or cooling load has more dramatic amplitude changes from month to month, and day to day, than for steady, year-round domestic water heat (or process heat). To achieve the same solar fraction, the solar system for a specific application would therefore have to be oversized and would not be utilized to its full capacity on many other days and seasons. However, if a single solar system can be designed as a combination (“combisystem”) to utilize heat from the collectors 12 months of the year (ideally by providing SWH, space heat and space cooling, and perhaps pool heat), the combisystem’s value would be enhanced. This wholistic consideration of different thermal loads with regard to solar heat supply is one of the great technical challenges for California.
142 California Commercial End-use Survey, http://capabilities.itron.com/ceusweb/chart.aspx

63
Table 7.2 Process heating and cooling gas consumption and potential energy saving by converting to solar technology (Unit: Millions of Therms), refer to Table “Annual Summary Statistics” in CCES142F
143
Process Heating Saving for PH Cooling Saving for Cooling Millions Therms
Office 8.09 1.00 3.59 0.44 Restaurant 0.49 0.09 0 0
Retail 0.25 0.04 0 0 Foodstore 0.10 0.02 0 0 Warehouse 2.66 0.82 0 0
School 0.27 0.08 0.56 0.17 College 0.04 0.01 7.12 2.19
Hospital 11.83 3.63 3.62 1.11 Hotel 0.70 0.21 0.18 0.06
Figure 7.3 illustrates process heating and cooling scenarios in the commercial buildings. Out of nine columns, the column of office and hospital show the largest portion of natural gas consumption and highest portion of potential energy saving. Thus, offices and hospitals would obtain the most benefit from solar process heating. Similarly, college offices and hospitals would be main beneficiary on the transition to solar cooling, which is demonstrated in Figure 20.
Figure 7.3 Total energy use (total bar) and technical potential energy saving by converting to solar process heating (red portion) based on Table 10. Refer to Table “Annual Summary Statistics” in CCES.
143 California Commercial End-use Survey, http://capabilities.itron.com/ceusweb/chart.aspx

64
Figure 7.4 Total energy use (total bar) and technical potential energy saving by converting to solar cooling (red portion) based on Table 10. Refer to Table “Annual Summary Statistics” in CCES.

65
8 CHAPTER 8: METRICS FOR SOLAR THERMAL INDUSTRIAL SYSTEMS
This section will present an evaluation of solar thermal system metrics. The term, “metrics” begs the question, what is the metric for? What is to be measured and why? Is the measurement to be on the load side, or the solar side? For the purpose of industrial solar thermal assessment, “metrics” refers to the measurements of both thermal loads and of solar performance as collected by the solar array and delivered to the conventional backup heater. The purpose of this section is to describe what measurements are most important for estimating, measuring and confirming solar system savings.
8.1 Performance Measurement Metrics Utility and state program planners often justify incentive levels or even programs themselves based on measured performance of systems. For the evaluation here, state and utility planners would likely want to be able to estimate how much energy will be saved by solar thermal systems and at what cost of investment. An example would be the monitoring of a utility solar rebate program, done at any of four levels of accuracy. Solar thermal system performance may be monitored directly with nothing more than a single BTU meter143F
144 or may use a lower cost metric of observing utility bills to see how much gas consumption was reduced. These four levels are as follows (from least accurate to most accurate).
8.1.1 Tracking billing history. Observing the consumption of natural gas or electricity in monthly utility bills is the most simple and potentially low cost metric. It essentially requires the assumption that any monthly reduction of gas or electricity consumption following the installation of a solar thermal system can be attributed to the performance of the solar system. However, by itself the method is fraught with potential errors. The following errors or performance factors could influence the monthly gas consumption independently from the solar thermal system:
Changes of household or business behavior. For industries, there are likely to be year-to year changes in product or process, impacting the amount of heat needed, and therefore the performance of the solar system.
Efficiency or conservation measures. Some thermal load reductions have nothing to do with solar. In fact smart industry operators will likely combine efficiency measures with a solar thermal system to maximize total system cost effectiveness. Analysis would be required to identify bill reductions caused by efficiency measures. This analysis is complicated by the existence of multiple end uses and may be reflected by the gas or electric bills. This analysis may be expensive as it would likely require custom analysis for each business.
144 A BTU meter uses water temperature rise and mass flow to calculate heat energy produced by the collectors or heat energy delivered by the solar system

66
Weather factors, including water temperature and/or winds. To be accurate, a billing analysis would have to account for changes in solar system performance caused by year-to-year changes of ambient temperature, insolation, supply water temperature, and wind. Site-specific wind can greatly affect unglazed solar collectors, especially in a region that has ambient temperatures lower than the collector fluid temperature.
8.1.2 Measuring solar collector performance A mid-level accuracy of performance evaluation would be to meter the heat delivered from the collector loop (disregarding solar heat losses from solar tanks, heat exchangers and piping). This method may use a turbine or paddlewheel insertion flow meter in the collector loop or a simple, low-cost orifice flow sensor in the collector loop. The key meter component, the flow sensor, is based on the principle of fluidic oscillation; meaning that the gallons per minute (GPM) flow rate through the collector is sensed as vibration. A key advantage of this method relative to the billing analysis method is that a BTU meter in the collector loop measures the energy contribution from the solar collector. This data would be useful to validate Solar Rating and Certification Corporation (SRCC) Standard 100 solar collector performance ratings. It could also, with the help of system monitoring, help to validate computer simulation programs such as the California Solar Initiative (CSI)-Thermal Program commercial system calculator. Finally, this collector loop data could be used to develop a therm per square foot database by type of business or industry and climate zone. Such a metric might be helpful to designers.
However, some disadvantages or potential difficulties are as follows:
• The system losses downstream from the collector loop are not accounted for. This includes heat exchangers, storage tank loss, unintended nighttime system losses such as thermosyphon, etc., and piping losses. These can amount to 20% of the solar collector output. They are difficult to assume or model because they are dynamically interactive with the solar collectors, changing loads and ambient conditions.
• The critical flow sensor may be affected by such collector loop phenomena as varying flow rates as when a variable speed pump is used. Oscillating principle orifice flow sensors, such as the Grundfos Vortex sensor, are usually most accurate at their single rated flow rate, instead of over a range of flows. They may be considerably less accurate at very slow rates, such as trickle rates. Some solar collection processes use very slow speeds for the pump if high collector temperatures are desired to compete with the high temperature set points of many gas heaters. The controller may stop the flow through the collector until the fluid temperature is high enough to inject heat into the process, or it may slow the flow down to a trickle. Because these flow sensors have minimum rated flow rates, they may miss the very slow flow rates that might occur. According to OIMLR75, flow sensors should have a maximum permissible error of about 2% through the entire expected flow range. There also might be unwanted BTU losses during night convective flow situations, or in a “steamback” function. Steamback is intended to be a controlled boiloff of the glycol/water mixture under lower temperatures than would damage the glycol. Orifices sensors aren’t designed to record negative flow as negative, and their BTU calculators may not be able to account for negative flows or temperature drops from some of these phenomena. Therefore, falsely high apparent solar “savings” may result. In addition to the possible weakness in sensing BTU losses, glycol in the

67
collector loop may begin to break down, causing sedimentation of glycol chemical additives, which affect the accurate measurement of flow.
Although accurate collector loop monitoring may be possible, one must understand the dynamics of the collector loop and either by prevention, or by calculator accounting, factor in the negative BTUs.
8.1.3 Measuring the solar energy delivered by the system. Placing a BTU meter (or meters) in the demarcation between the solar system and the backup heater or boiler (if feasible) would be the most accurate way to measure net energy delivered by the entire solar thermal system. It is often possible to find a pipe location between the solar tank and the conventional heater to install a flow meter, with a cold temperature sensor and a hot sensor such that BTUs being transferred from the solar system can be accurately measured. Two valuable advantages are:
The solar energy at the point of hand-off from the solar system to the conventional system is the net of heat exchanger, tank and solar piping losses.
The flow meter at this location can monitor and report gallons per interval of water flow, e.g., Gallons Per Day (GPD). This GPD data can be used to develop charts of GPD’s for typical businesses or industries which can be published and used by system designers for sizing and estimating system savings by modeling.
In most cases, a single BTU meter will suffice, if carefully located, to measure this energy. However, for very complex plumbing systems, often combining multiple sources of heat, or various types of loads and recirculation loops, two or even more meters will be required.
Some disadvantages or possible problems are:
• Large diameter potable water pipes require large expensive flow meters.
• Some water systems may have hard water or aggressive water not compatible with the flow sensors. Periodic maintenance may be required.
• Space constraints may prohibit proper installation of the flow meters.
• Complex plumbing may require highly trained installers to properly locate flow and temperature sensors, and install heat traps to prevent unwanted night convection flows.
• System leaks can be significant factors if the flow meters cannot detect them.
8.1.4 Measuring all performance factors for scientific purposes A fourth measurement option is to measure all of the following performance factors (or combinations of) for selected sites (especially industrial sites) to evaluate system performance:
Collector loop performance
System performance

68
Subsystem component performance such as heat loss or parasitic consumption
Site weather, including ambient temperature, insolation, wind, ground water temperature, and load profiles and changes
This data could be used for a number of purposes. For example, unglazed collectors are likely to be used for pre heating cold supply water on large industries. Manufacturers and collector rating organizations are debating the effect of wind on their performance. It would seem beneficial to set up a mini-weather station with multiple wind anemometers and BTU meter to monitor performance and correct for changes in assumed weather and wind versus actual conditions at a select few sites.
A total solar system monitoring program would be valuable for validating or modifying the performance prediction model (TRNSYS) used by the CSI-Thermal rebate program. The TRNSYS program could be modified for more precise performance estimating.
8.2 System Design Metrics In system design, numerous metric criteria are often used. Some projects may use some metrics more than others, depending on the desired outcome. Any of the metrics that follow may play a part at one time or another in the design process.
8.2.1 Solar Collector Efficiency and Collector Types Solar collector efficiency is the metric that drives solar energy delivered. It is the percent of solar radiation impacting the collector that is collected and transferred to the heat transfer fluid. Collector efficiency can be determined by measuring the energy collected in the collector loop with a Vortex (fluid oscillation) meter or other insertion meter, plus two temperature sensors and calculator. Collector efficiency charts are usually depicted as snapshots in time. But efficiency is a variable that is constantly changing. At any moment, collector efficiency varies with the solar radiation entering the collector (insolation), with the ambient air temperature, and with the temperature of the fluid (usually water being heated). It also is affected by wind.
Collector efficiency is vital in system design. Solar thermal collectors are described to show that collector technologies vary and offer unique advantages and disadvantages for a variety of applications. Efficiency will vary depending on the collector type, application and weather.
Five major collector types are discussed with relevant information about their efficiency and performance, especially for industrial process systems. While glazed flat plate collectors and evacuated tube collectors are the most common choices for water heating and industrial applications requiring 150- 200˚F, unglazed flat plate and concentrating collectors each cover a specialized range of additional conditions.
8.2.1.1 Glazed Collector - Flat black Flat black paint means the absorber paint is like Rustoleum paint; good in absorbing solar heat, but poor in holding the long wave radiation that results. These collectors generally have a y-axis (peak) collection efficiency of about .70-.75, and a slope144F
145 to the performance curve of about -.9 (a moderate slope). For water heating temperatures between 100˚F and 160˚F in most 145 Slope is the rate of heat loss from a collector as its fluid temperature rises relative to ambient. Values for collector types range from -.3(excellent) to -3.5(poor)

69
of California, this out-performs any other collector type. This collector type has been popular in California and the U.S. for over forty years. Beginning with wood framed collectors (which would occasionally catch fire) to the modern boxed and glazed extruded aluminum collectors with heat resistant insulation and high transmissivity glazing; they have come a long way in a short time. Thanks to the development of performance ratings by SRCC and severe thermal shock tests under Standard 100, the metal collectors produced today should be able to last 30 or 40 years, and perform at around 40-70% efficiency for most water heating tasks. If temperatures higher than about 150˚F are needed, the efficiency of these collectors may drop too low. In the range 160˚F to 200˚F, glazed flat plate collectors with selective surface absorbers may be useful, or evacuated tube collectors.
8.2.1.2 Selective Surface Absorber This represents the next level of performance gain over the flat black paint absorber, showing peak (Y-axis) efficiency in the .75 to .80 range, and a slightly flatter performance curve slope, around -.7. This means it retains collected heat longer at hotter fluid temperatures and cooler ambient conditions. The selective surface coating usually has an absorptivity of .8 to.9 (very high), and an emissivity of .05 to .25; the lower the emissivity, the better the performance. Generally, because they are more expensive than flat black absorber collectors, they are limited to northern climates where the extra efficiency is more valuable. If used in glycol systems in Southern California, there is more risk of overheating the glycol and causing damage. These collectors (usually in the serpentine fluid tube design), are used extensively in Germany, because of the cold climate and high cost of energy.
8.2.1.3 Polymer Collectors - Unglazed Polymer collectors are usually in the form of unglazed collectors – a polymer absorber with no frame or glass cover. They are made by an extrusion process and cost about 20% of the per square foot cost of glazed collectors. But due to UV and expansion and contraction, the lifespan is much shorter than for glazed metal or evacuated tube collectors.
Unglazed polymer collectors are usually used for swimming pool heating, but may fit in to some industry processes. One major California polymer collector manufacturer recently installed approximately 20,000 square feet of their unglazed polymer collectors on the roof of a prune processing plant in northern California. The solar system preheats cold well water enroute to a steam boiler. The key to its successful operation is that the well water is usually cooler than the air temperature in the morning and early afternoon. If the well water temperature is 50˚F and the air temperature is also 50˚F (as is the case in mornings), the collector efficiency is close to 100%, (about 30% to 40% higher than the efficiencies of glazed collectors, evacuated tube collectors, or even concentrating collectors). For the narrow range of temperature differences (until the fluid temperature is about 20-30˚F warmer than the ambient temperature), the unglazed collector efficiency is above that of other collector types.
An additional benefit in warm climates is, if the air temperature is warmer than the fluid temperature, heat is transferred to the collector by convection as well as by radiation. But if the air temperature is cooler than the fluid temperature, and a wind is blowing, the efficiency drops very rapidly. Modeling a number of unglazed collectors in CSI-Thermal’s solar pool system

70
calculator revealed widely disparate savings among collector brands and among climate zones. So, if unglazed collectors were to be used on large projects, a useful metric would be wind speed at the roof surface. Since winds are generally reported to TMY from airports, local wind should be monitored.
8.2.1.4 Polymer Collectors - Glazed A type of polymer collector that promises the low cost of polymer absorbers plus the benefit of glazing (using low cost plastic glazing) is the glazed polymer collector. Glazed polymer collectors have some advantages and some disadvantages compared to unglazed. One advantage is that higher fluid temperatures can be achieved than for unglazed collectors due to the flatter heat loss curve caused by the glazing. Another advantage is that the absorber is shielded from wind losses. They are also lighter and less expensive than glass-covered collectors (one person can carry a collector). A disadvantage is that they will heat up more than unglazed collectors, and might be subject to damaging stagnation conditions. They would also have shorter lives than glass covered metal collectors.
8.2.1.5 Evacuated Tube Collectors Evacuated tube collectors substitute sealed and evacuated glass tubes for the heavy and copper-intensive glazed flat plate collector design. Usually the tubes consist of a vacuum space with a dark absorber fin in the center. The vacuum helps to reduce the convection losses, which keeps the efficiency higher than flat plate collectors. Y-axis (peak) efficiencies are around .50 to .6 with heat loss rate slope at around -.3. These collectors can generate hotter fluid temperatures than flat plate collectors under more severe conditions making them good candidates for industrial systems. Two major types are: flow-through, where the cooler water or glycol fluid flows through the evacuated tube and exits to a collecting manifold; and heat pipe evacuated tube collectors, which capitalize on heat pipe technology, which relies on a single sealed copper tube that itself is in a part vacuum condition, flashing a small amount of water to steam which then carries the heat of vaporization upward to the condensing manifold where cool water or glycol condenses it back to a liquid and carries the heat away. An advantage of the heat pipe technology is that if a tube breaks, it can be pulled from the array and replaced without taking the whole collector off. Individual tubes can be carried up to the roof more easily than flat plate collectors. These collectors can generate upwards of 500˚F. A disadvantage is that they are often made of borosilicate glass, which is fragile and can shatter into dangerous shards.
Millions of these tubes are being manufactured every year and entering the U.S. market. The cost is declining steadily, and the quality (durability of vacuum and thermal shock resistance) is increasing, especially for collectors that are certified to SRCC Standard 100.
8.2.1.6 Concentrating Collectors Concentrating collectors are a very specialized technology, appropriate for very high industrial process temperatures, from 200˚F to over 600˚F. Many are parabolic reflector troughs reflecting onto a heated oil collection pipe. Concentrators usually have the flattest efficiency curve of any collector type, with a y-intercept of .5 to .6, and an almost flat heat loss curve slope. They are limited to direct gain insolation, which in coastal and transitional climate zones is about 80-85%
71
of the total radiation. Location inland might be advisable. Overheat protection is achieved by off-tracking the concentrator.
8.2.2 Solar fraction Solar fraction is a metric that shows the fraction of annual water heating energy from solar expressed as a percent. For example, a solar fraction of 70% means that 70% of the annual heating energy comes from solar. Commonly available simulation programs such as FChart or RETSCREEN will estimate the total annual energy needed for water heating a residence or business, then estimate what percent of that is likely to be supplied from solar under the climate and design conditions of the project. It includes consideration of parasitic energy (pump/control power). Its major value is in telling the designer that they are sizing the system close to the optimum solar fraction for the life cycle cost of the project. For example, in Southern California, where hot water is used year round and the climate is mild year round, a solar system that saves 50-80% is most appropriate. A solar fraction above 70-80% produces waste in the summer. (Even at 70%, there will be thermal stress in summer that reduces the life of the system.) This loss reduces the life cycle benefit of solar from ideal. Optimizing life cycle benefits would show that, based on the load and cost/performance of the solar system, about 70% solar fraction would normally be optimal in much of California. In other areas such as Hawaii, this might change. Hawaii, because of their warm year round climate and reduced system cost (not requiring freeze protection which is costly), may see 90% solar fraction as optimal. In cold areas such as Northern California, where more collectors are needed for the same production as Southern California, a lower solar fraction might be called for to make it more cost effective. For example, if the collector array is reduced in size, but the installed cost per square foot remains the same, the extra energy produced per square foot will add to the value (lowering the collector array size means that the average entering water temperature will be lower, which means the collector is able to collect more thermal energy). A reason that sizing for a solar fraction that predicts 100% solar fraction in summer months is problematic is that real world weather is not so predictable. In the real world, there are likely to be times in summer when the energy produced is in excess of what is needed. This suggests that estimating monthly solar fractions would be helpful especially to reduce overheating in the summer. This energy is wasted, which is useless and possibly damaging in terms of life and durability of solar system components and heat transfer fluid.
8.2.3 Therm savings per square foot of collector Annual “therms saved per square foot” is a very useful metric. It is useful in three ways:
1. To use for initial solar system sizing by a salesman or system designer. Many systems in moderate climates can be sized by assuming a ratio of one square foot of collector per gallon per day consumption. This is an easy-to remember guide. Square feet of collector area can be quickly priced as a system based on the contractor’s pricing guidelines.
2. A second way is for consumers to compare competing bids on the basis of dollar savings per square foot versus cost per square foot. They would need to have access to such data, or simulation results.

72
3. A third is as a rough estimating measure that can indicate when the solar system is within a reasonable band of expected performance, based on past experience with similar systems and modeling in the public programs. If for example, the energy savings calculator predicts 2 or 3 therms per square foot of collector, and a proposal comes in at 8 therms per square foot, (or a heat meter installed at the site shows 8 therms per square foot) then the inspector should investigate for errors. Given enough measured or predicted data, a designer knows how to predict rough savings based on the collector array size. It is effectively a reasonableness measure of whether the system is sized, modeled, or metered correctly. It is also good to estimate the performance in therms per square foot, then measure actual performance.
8.2.4 Therms saved Therms saved can be used to calculate greenhouse gases saved directly if natural gas is used, or “at source” if electricity is used. For customers, this is usually converted to dollars.
Therm savings derived by simulation is not a perfect predictor, especially if the industry’s thermal loads vary (which they inevitably will). If more accurate savings estimates are desired, updated load information will be helpful inputs to the model as these load changes occur. For example, if a company learns that its thermal load will be reduced significantly after the solar system has been operating, new loads could be input into an on-line calculator such as the CSI-Thermal commercial calculator to reflect the changes. In general, access to a California state calculator that is fully validated would be very helpful for bringing confidence into the savings estimates. Vendors and consumers could use the calculator, as well as planners. Access should be free and part of solar system training for engineers, contractors, and commercial/industrial owners.
8.3 Economic Metrics 8.3.1 Collector Cost The majority of collectors in California are made of copper, aluminum and glass. Copper is expensive and the combination makes the typical 4’ x 8’ or 4’ x 10’ glazed collector weigh 150 pounds or more. This makes installation more expensive than for polymer collectors.
The collectors are about 20-30% of system cost. The collector cost is around $30 to $40 a square foot. Progress in reducing collector cost, labor to install heavy collectors, or increasing their efficiency will improve cost effectiveness.
8.3.2 System Cost
Commercial systems cost around $100 a square foot. Their economics benefit from the federal tax credit and depreciation write offs, so their simple paybacks tend to be in the range of 5-10 years. Because other energy saving options offer paybacks of under 5 years, solar system price needs to come down. Opportunities to reduce system costs are:
• Establish programs to encourage manufacture of low cost, but durable collectors.
• Import or develop evacuated tubes.

73
• Promote small simple storage tanks.
• Eliminate the need for an anti-scald mixing valve.
• Eliminate the need for two-wall heat exchangers (provide testing and certification that heat transfer fluids are non-toxic after experiencing the worst case stagnation conditions.)
• Standardize standards and simplify permitting procedures.
• Train contractors on quality and best practices.
• Consolidate system inspections into a single inspection for rebate and permit.
• Establish design assistance centers to help estimate or meter GPD or system performance. Provide useful data on metrics such as GPD for various types of businesses.
8.3.3 Simple payback This cost effectiveness metric is commonly used by energy system purchasers. It is simple, avoids speculation about long-term energy costs and discount factors, and is reasonably fair for short periods (up to about 10 year payback), because the guessing about such critical economic considerations as fuel price escalation and future inflation and discount rates has been removed from consideration. It is logical because most businesses plan in 5-year cycles, and most energy efficiency competition to solar comes with 1-5 year simple paybacks. Most businesses seek a simple payback of less than 3 to 5 years. When everyone is using simple payback to compare similar energy saving technologies, results are easily comparable.
8.3.4 Life cycle cost Life cycle cost (LCC) is important for long term planning, mostly by state agencies. It has advantages and disadvantages. Advantages are that it recognizes the expected life of the solar system. Long life means less LCC. For planners, it shows dramatic sensitivity to factors such as fuel cost escalation and discount rate. Having an economic analysis for the long term highlights this factor. Disadvantages of LCC are that projecting far into the future is a vague process. It is subject to risks that important factors such as fuel cost escalation, discount rate, or system maintenance assumptions are prone to the possibility of considerable error. Energy technology and prices are likely to change dramatically.
8.3.5 Return on investment (ROI) Lifetime savings minus investment divided by investment gives Return on Investment. This value is compared to bank ROIs. If the solar system ROI exceeds that of a bank and other paper, the solar system is likely a better investment.

74
8.3.6 Greenhouse gas emissions This value is vitally important, as California has set ambitious goals for greenhouse gas reductions by 2020. SDG&E emissions rate for natural gas is 11.7 pounds per therm. Natural gas pounds of emissions savings for combustion can be calculated by multiplying therms saved (including boiler efficiency factor) times 11.7.
8.4 Sizing While system sizing is part of the design process, it should be understood also from a system performance evaluation perspective. This section refers to sizing metrics as used for sizing a system and as used for performance evaluation. A comprehensive performance-monitoring program should have a component to develop sizing guidelines used by the solar thermal industry, utilities, and state planning agencies.
The CSI-Thermal Program sizing rules were established based on rule of thumb sizing guidelines gained from about 30 years of experience. The program sizing criteria are intended to reduce the risk of oversizing solar systems, causing glycol to break down early or causing scald injury to occupants. In contrast to photovoltaic systems, which generate the same number of kwhs/yr regardless of the site load, solar thermal system performance is highly sensitive to the size of the thermal collector array. That is, a small solar system will save a larger number of therms per square foot a year than will a larger one, given the same GPD load.
When monitoring solar system performance, analysis should be done on the relationship of system size to performance and system cost effectiveness. Evaluating for the most cost effective size relationships (square feet of collector per GPD, for example), using therms saved per square foot, and system cost per square foot would be helpful to the industry and planners. Questions like, “what ratio of square feet of collector per GPD gives the highest Life Cycle Cost benefit?” would help utility incentive program designers identify the optimum incentive level to generate favorable purchase decisions.
8.4.1 Thermal Load Thermal load is an important metric for sizing and evaluation of system performance. As a metric, it guides the sizing process. Sizing collector arrays must be done to avoid exceeding the thermal load, especially in hot summer months.
A solar thermal system used for water heating or any other thermal process is best viewed as basically a water heating system feeding a boiler or heater that serves the space cooling or heating system (or any process heat.) Heat meters can be used to determine the thermal load, or flow meters can measure the fluid flow in gallons per day or per hour. This data is useful for sizing based on modeling.
Thermal load for water heating systems equals gallons of water heated times the temperature rise times density times specific heat. Thermal load provides a target for solar system designers – a solar system cannot save more than the thermal load, adjusted for

75
boiler efficiency, but it can save a good portion (even most) of the thermal load. The key challenge is to size the solar system to provide the desired percent of total thermal load. A conventional heat source, or a solar thermal system, or both can provide energy for the thermal load. The common practice is for a solar system to pre-heat cold water and use a backup heater to boost the temperature to the level needed, whether for domestic water heating, space heating, cooling, or process heating. Solar can provide all or part of this load. These larger system solar fractions will range from 20% to 80%.
The practical component of thermal load that is most useful to sizing is the gallons of water to be heated each day (GPD) for the example of solar water heating. The other components to thermal load are commonly assumed (like water heater set point, water density and specific heat), or may be obtained from standard TMY weather data bases (like cold water temperature, ambient temperature, insolation and wind.) The gallons per day (GPD) variable must be either measured or estimated (estimating is not recommended for commercial or industrial systems).
System design involves sizing a collector array to handle the desired fraction of the thermal load, then selecting the system components that most facilitate achieving the design goal. Additionally, the array size might be limited by available roof area. Sizing is expressed as total collector area, or a ratio of collector area to GPD.
8.4.1.1 Estimating Thermal Load GPD data from sources such as American Society of Heating, Refrigeration, and Air-conditioning Engineers (ASHRAE) is useful only to show a range of possible thermal loads. System sizing based on the ASHRAE GPD chart may not always be as conservative as actual site consumption and the actual site GPD may be much lower than the ASHRAE table implies.
While using rules of thumb may be appropriate for residential systems, using them for estimating savings for large commercial/industrial systems is not recommended.
The GPD should be measured if at all possible to develop a representative load shape and yearly schedule of down times. Data from similarly monitored projects in similar climate zones can be used for reasonableness checks or to provide a maximum size limit for overheat protection. But there is not enough validated field performance data to confidently predict system performance for commercial purposes. Measured GPD should be used with TRNSYS or other simulation programs to estimate savings and greenhouse gas reduction.
8.4.1.2 Metering Thermal Load Commercial and industrial owners have much at stake in energy costs, and therefore demand accurate performance prediction, and likely demand performance metering of some sort.
To be most accurate in sizing a solar system and estimating savings, one must go beyond the rules of thumb used for small residential systems. This may entail metering the hot water usage to more accurately size the solar system.

76
It is sometimes difficult and expensive to schedule a shutdown of hot water delivery to the apartment or business to install an insertion-type flow meter. An alternative metering approach is to attach an ultrasonic flow meter temporarily to the cold water pipe going to the building water heater and monitor GPD for a period long enough to represent the load shape and cycles. Accurate ultrasonic flow meters are expensive and require a knowledgeable operator who can program into it the characteristics of the pipe. Also, these usually require a level pipe section with about ten diameters of clear length before and after the flow sensor. These meters need to be able to sense flow of clean potable water. Some models require flow of sediment or oxygen bubbles to get a Doppler signal readout. The advantage of ultrasonic flow meters is their portability. One meter can be reused at different locations easily, an ideal tool for a solar company that specializes in apartment and commercial/industrial systems (it would also be an important tool for a statewide solar load evaluation and design assistance team). These meters also record the GPDs in time intervals, which is helpful for entering load shapes into computer programs.
An option to facilitate widespread professional commercial/industrial solar deployment is for each utility or state agency to have several ultrasonic flow meters that are maintained and calibrated by qualified people. They can instruct contractors and engineers in their use, and perhaps ask for a copy of the resulting load shape for the benefit of other designers. System designers can use the resulting data to build a database for access.
GPD and load shape are the most important criteria for system sizing and performance estimating. There is a need for a public database of GPD and typical load shapes for numerous types of businesses. Optimization of performance requires avoiding oversizing and avoiding gross under sizing. Systems sized for optimum cost effectiveness will create more acceptance of solar; so access to free, accurate, and easy to use flow meters is essential.
8.4.2 Other influences on sizing of a solar thermal system Cold and heated water temperature
Temperature settings throughout the process
Insolation
Wind, preferably at the level of the collectors
Air temperature near the collectors
Backup heater tank temperature set point
Recirculation loop returning tepid water to the backup heater. BTU’s lost in the loop.
Lost solar energy due to freeze protection, glycol overheat protection, piping and storage losses
Other thermal loads that might affect solar performance

77
All of these influences can be measured with varying degrees of difficulty and expense. In a formal measurement and evaluation (M&E) program, select fully instrumented homes, businesses and industries should be monitored closely to verify the predictions by TRNSYS and other simulation models. Another outcome of a good M&E program could be therms saved per square foot of collector-by-collector type and commercial/industrial application.
8.5 Recommendations 8.5.1 Recommendations for BTU Meters (Heat Meters)
Utilities and government agencies need to know how well the solar system performs in terms of gas savings for incentives and for long term resource planning. Customers need that information converted to dollar savings. A reliable heat meter is needed for very large systems. For a practical matter any performance data that can be collected, analyzed and published for the good of the solar industry, is invaluable, and should be reported in some public way so the entire industry can benefit from it.
The major stumbling block in the entire solar commercial/industrial industry from a metrics standpoint is the current lack of a national “heat meter” standard. The Environmental Protection Agency and American National Standards Institute (ANSI) are developing a heat meter standard for solar thermal and other heat sources, including combined heat and power, etc. Utilities need a reliable BTU meter that has accuracy at three levels: the flow meter (in the range of flows expected), the temperature sensors (in the range of temperatures expected), and the calculator itself. A heat meter is needed to measure contributions to large loads. The U.S. heat meter task force is using work that was started in Europe about 10 years ago, and updating it for additional requirements. The heat meter standard, when fully developed in a year or two, may not have every feature that would be ideal for a solar system, but it will have a range of “maximum permissible errors” depending on the requirements of utility programs. It will provide reliable metering, if the various technical problems here are addressed adequately (most likely via a “best practices” publication). The major California utilities want “utility grade accuracy” of meters if substantial rebate payments are to be based on them. But the meter does not stand-alone. A statewide “best practices” manual is needed to supplement the ANSI heat meter.
Thermal systems have unique challenges around such matters as unwanted flows, corrosion, sediment, heat extremes, etc.
Issues like thermal sensor placement and protection and flow meter placement will probably come under a best practices guide to accompany the particular meter, or it may be left to the installation manuals. There are some features and functions that should not be overlooked, either in the standard or the best practices guide:
The BTU calculator should have the ability to subtract negative BTUs; that is BTUs from flow (either pumped or convective), in the opposite direction than was intended. Usually these negative BTU transfers are caused by unwanted night thermosyphoning through the collector loop or system piping. Because the collectors are on the roof above the hot tank, if fluid is left in the collectors at night, a convective loop may develop, allowing warm fluid to rise from the solar storage tank upward in the hot line from the collectors to the collectors. At the same time,

78
cool fluid at the low end of the collectors descends and returns to the solar storage tank, creating a push/pull force that can cause continuous circulation at night causing considerable loss of energy from the solar tank. This unwanted thermosyphon flow can also move in the positive (pumped) flow direction. Solar installers are usually required to install check valves and/or heat traps to prevent this flow, but a check valve may fail, especially in hard water. Check valves in glycol systems can also be cracked open by sediment caused by deterioration of the glycol due to excessive temperature exposure. Negative BTU accounting should be given a high priority by state agencies.
Ideally the BTU calculator should be able to be programmed to recognize when BTUs are being wrongly fed into the solar tank from a conventional heat source. This might be caused by erroneous plumbing, malfunction, or by gaming. This would be identified by cold supply water entering the tank being warmer than the hot water leaving the tank and moving to the backup heater. This situation could be created by accidentally or intentionally cross-connecting a recirculation loop bringing hot water from a conventional heater into the solar tank, either directly, or after flowing from the hot water fixtures. This could create a situation where the solar tank is warmed up by conventional heat energy, but the BTU meter should see it as being falsely heated by solar. When it causes the solar tank hot out sensor temperature to rise relative to the cold supply sensor, it appears to be delivering solar energy. This could be corrected in the BTU calculation by setting a dipswitch to subtract BTUs when this phenomenon occurs.
The most likely outcome is that many of these unwanted flow situations will have to be prevented by check valves and heat traps, and unreasonable energy losses prevented by knowledgeable inspectors and reasonableness checks on calculations.
The ideal metering arrangement for utility rebate programs and state M&E programs would be to have a dedicated heat meter crew that will be able to detect subtle metering errors or gaming by vendors, or do the installations themselves.
Other desirable features of the heat meter are:
Separate reporting of GPD
Onsite readout of such items as BTUs and maximum collector temperature
Warning when negative BTUs have occurred
Data storage for loss of power, and a standard restart procedure.
Modem connection or wireless data transmission.
8.5.2 General Recommendations It is recommended that a program for validating industrial system energy performance estimation methodology be developed and tested if possible during the CSI-Thermal rebate program. That is, estimated savings for certain industrial projects should be compared to actual metered performance that has been normalized for weather and load changes. Additionally, development of a comprehensive program to measure and evaluate large system performance in California would be beneficial.

79
Also recommend is a provision of design assistance and training including use of design metrics and tools such as ultrasonic flow meters, development of commercial and industrial system public access databases, and a technical help line for design or monitoring questions. The design assistance center would have access to all relevant databases, technical design resources, and perform and evaluate modeling tools. The dual goal would be to develop a vetted design and planning modeling program, along the lines of the CSI-Thermal Program commercial TRNSYS calculator, and to provide performance monitoring tools and training.
8.6 Summary This discussion showed that many metrics could apply to solar thermal systems depending on the objectives of the stakeholders. The most valuable metric for large commercial or industrial systems is conventional energy displaced as measured by heat meters located at the point where the solar system delivers its thermal energy to the system backup heater, whether a water heater or absorption cooler or space heater or process heat boiler.
Different metrics are of value to different people, both in the design phase and the evaluation phase. System performance evaluation is important to utilities and state resource planners. Publishing performance data and providing independent monitoring and design assistance would be beneficial to the California solar thermal industry.

80
9 CHAPTER 9: SOLAR THERMAL ASSESSMENTS FOR WHITE LABS BREWERY AND THE NAVY FLEET READINESS CENTER
This assessment evaluates the potential value of solar thermal as a source of industrial process heat through an examination the craft brewing at White Labs, and electroplating at the Navy’s San Diego Fleet Readiness Center. This report will describe important issues that concern both types of applications, then focus on each industry separately, and then summarize the assessment.
9.1 General considerations of solar thermal systems Collectors are the most important component in any solar thermal system. It is important to know their performance and durability issues. For industrial heating, there are four basic types of collectors: unglazed flat plate, glazed flat plate, evacuated tubes, and concentrators. Each has an optimal temperature zone where it out performs the others.
9.1.1 Unglazed collectors Unglazed collectors are typically made of polymers, which greatly reduce the cost, but may only have a 10-15 year lifespan. Expected collector lifetime and repair requirements are definite considerations. Unglazed collectors are the most efficient collector, but only for a very narrow band of fluid temperatures entering the collector where the fluid temperature is no more than about 30˚F warmer than ambient temperature. For example, where a pool is being heated to 80˚F, the ambient temperature can drop to 50˚F or so and the collector would still maintain efficiency. However, the efficiency curve is very steep relative to other collectors and efficiency loss is very high beyond that range. Unglazed collector work well for pool heating because ambient temperatures during most of the pool-heating season are within the 60-90˚F range. It also performs well for steam boiler preheat systems, such as the Stapleton Prune Processing plant in northern California, where cold well water is preheated by about 20,000 square feet of Fafco unglazed collectors. When the daytime air temperature is warmer than the fluid temperature in the collector, these collectors will get a performance boost by absorbing heat from the air itself. This type of collector performs very poorly in cold, windy climates because the convective heat transfer works against it any time the wind is blowing and the air temperature is cooler than the water temperature. Coastal climate zones are affected because ambient temperatures tend to be cooler than transitional or inland climate zones. Also, wind across a particular roof shape, pitch or size is very hard to predict, and formulas for converting wind at meteorological stations to a site-specific rooftop are in need of more research.
Polymer collectors are vulnerable to freeze damage and need reliable (glycol or automatic drainback) freeze protection. Freeze damage in these collectors has recently been reported in Phoenix, Arizona as well as severe weakening of plastic tubing used for unglazed swimming pool solar systems.

81
9.1.2 Glazed Flat Plate Collectors Glazed flat plate collectors typically have copper waterways, copper absorber plates, good insulation and clear glass covers (single or double pane). Their absorbers are metal, usually copper, and painted with either a flat black paint with high emissivity or a selective surface paint with low emissivity and high absorptivity. The selective surface coating adds about 10% to the collection efficiency. This is beneficial if higher temperatures are required (as they are in the cases presented here), or more heat is needed in winter than in summer (space heating). Selective surface collectors can reach peak efficiencies close to 80%. Flat black flat plate collectors have peak efficiency around 70%, cost about 10% less, and are fine for normal domestic water heating temperatures of about 150˚F. But the temperatures needed for these two processes are above 176˚F, so selective surface flat plate collectors or evacuated tube collectors would likely be more cost effective.
Glazed collectors, and all collectors, seeking utility rebates must have a Solar Rating and Certification Corporation (SRCC) Standard 100 Certification145F146. Standard 100 Certification is a step toward ensuring reliable collector performance. Collectors are tested in severe solar stagnation conditions then subjected to cold shock and the equivalent of hailstones. They receive their collector performance ratings, modeling equations and (for unglazed collectors) wind factor corrections to the old ASHRAE collector ratings. For most installations where freeze and overheat protection are provided, these metal collectors should last 30 or 40 plus years.
9.1.3 Evacuated tube collectors Evacuated tube collectors promise to be low cost and durable. Their absorbers are protected from excessive heat loss by a tubular vacuum space and it is important that they hold vacuum for the expected 20-30 year life of the collector.146F147 However two obstacles need to be overcome before they are widely accepted in the U.S. They need to go through the certification process by SRCC or the International Association of Plumbing and Mechanical Officials (IAPMO), and they need to hold vacuum for a long time, probably decades, to show they are durable. Also, since they use borosilicate glass, which is dangerous when it shatters, they need to resolve the issue of safety. For the two cases in this study, safety will not likely be an issue – for the White Labs Brewery, the collectors would be on a flat roof, behind parapets. At the Fleet Readiness Center, the roof is two stories high and inaccessible. In one version of evacuated tube collectors, the heat pipe is easy to replace a tube if it is broken and in fact manufacturers often send extra tubes for breakage during shipping or installation. If a tube breaks in the collector, fluid is not lost, and only a 5-10% efficiency loss will be experienced. Care must be taken in selecting which type 146 Standard 100 certification can currently be obtained through the Solar Rating and Certification Corporation (SRCC) or the International Association of Plumbing and Mechanical Officials (IAPMO)
147 China is seeking to be the world leader in this technology and promises to greatly reduce system costs to where entire residential solar water heating systems using evacuated tube collectors costs less than $500.

82
of evacuated tube collector to install: heat pipe, flow through, or thermosiphon flow through. If drainback freeze protection is used in the flow-through types (basically a copper tube carrying water into the evacuated tube, and a u-tube carrying the heated water back out) will not drain and may be vulnerable to freeze damage.147F148
9.1.4 Concentrating collectors Concentrating collectors are tracking collectors that concentrate solar energy, either by reflective surfaces (typically parabolic trough) or by Fresnel lens. They can achieve concentration ratios equivalent to several hundred suns. Fluid temperatures of up to about 600˚F are possible. But these concentrators have moving parts, which creates maintenance expense, and are reliant on direct solar radiation, meaning they don’t capture the 10-15% diffuse radiation in San Diego’s coastal climate. They are therefore not appropriate for the needed temperature (under 200˚F) and coastal climate. They would be more appropriate for a California desert climate where high fluid temperatures are needed.
9.2 Collector performance ratings It is useful to mention that two different performance rating conventions exist, which may cause some confusion if one is unaware of the situation.
Europeans rate their collector efficiency based on net absorber area – in the U.S., the ratings are based on gross collector area. Both methods have their defenders. In the U.S. designers prefer the gross efficiency rating because it is based on the outside dimensions of the collector, which is important to know when sizing based on available roof area. SRCC and IAPMO collector ratings are expressed in terms of gross area, and therefore appear to be 5-10% lower than the European collector efficiencies. A salesperson may quote a collector efficiency value without saying that it is based on net absorber area. It appears to be more efficient than the SRCC Standard 100 rated collector by 5-10%, but when the ratio of absorber area to gross area is factored, the two efficiencies are identical. When seeking bids, always request efficiencies in terms of gross area.
9.2.1 Freeze Protection Freeze protection is a critical requirement that is often overlooked in San Diego, but one that is essential in every location in California. Freezing can occur in the collectors if the ambient
148 TUV Rheinland is developing a freeze resistance standard for evacuated tubes. If drainback is used, the only feasible evacuated tube option is the heat pipe, which consists of a thin, totally sealed, copper inner pipe that runs the 6 foot length of the evacuated tube and has a small amount of water or alcohol in a part vacuum that boils at around 80 or 90˚F. The steam rises to the top closed nodule where cold flowing water in the manifold takes the heat away, causing the vapor to condense, descend to the bottom of the tube and re-vaporize. If the manifolds are sloped to drain, the system will be protected from freezing when the pump stops running.

83
temperature drops to 40˚F or so, depending on such factors as collector type, absorber surface coating, pitch (less pitch is more dangerous) and sky conditions (dry bulb temperature and dew point temperature). Flat plate collectors with flat black paint can see temperatures in their risers of 8 degrees below ambient under certain conditions. Evacuated tube collectors may be able to resist somewhat colder ambient temperatures (some claim down to 5˚F, but early testing by TUV Rheinland raised doubts). Even the desert occasionally sees night time temperatures under 40˚F. Reliable freeze protection is required. There are four freeze protection options, with differing degrees of reliability.
9.2.1.1 Direct Forced Circulation (DFC) This method uses the circulation of warm water from the solar tank at night to push near-freezing water out of the collectors when a collector temperature sensor senses 41˚F or less. The one advantage of this system is that heat exchangers are not required because the process water is heated directly in the collectors. However, recirculating solar-heated or gas-heated water at night can lose considerable energy. This system usually has freeze protection drain valves (“dribble” valves) at the hot outlet of the collectors to reinforce (or supplant) the recirculation function. In theory, these valves begin to open to dribble onto the roof when the ambient temperature drops to about 45˚F. A Task force of California Solar Initiative (CSI) Thermal Program148F149 engineers, industry contractors and manufacturers studied the reliability of this method and decided to ban it from eligibility for CSI Thermal rebates. It requires maintenance, soft water, and the availability of grid power to run the pump. It is not allowed in the CSI Thermal Program, and is not recommended for White Labs or the Fleet Readiness Center.
9.2.1.2 Indirect Forced Circulation (IFC) with water in the collector loop This system is used in Germany. It is a more reliable version of the DFC system. Key features are: a closed collector loop (one-wall heat exchanger) with pure water, recirculation of the water when the collector temperature drops to 41˚F, precise controls to minimize night time heat loss, and a control/pump system backed by an uninterruptible power supply (UPS) – basically a battery that ensures the pump can run all night if needed. Only one company is known to market this system, and we have not seen one installed in California.
9.2.1.3 Indirect Forced Circulation (Glycol) This system uses propylene glycol as the heat transfer fluid and antifreeze. It is a reliable freeze protection method and the glycol is non-toxic or at worst, mildly toxic. However the glycol does require more care during startup and periodic testing. In many code jurisdictions, it must have a two-wall heat exchanger to prevent contamination of the potable water and receive a permit. Filling and charging the glycol loop at startup is one place where mistakes are sometimes made. Skill is required to purge all oxygen and eliminate contaminants. Reliable overheat prevention is also vital to prevent damage to the glycol from exposure to stagnation 149 The California Solar Initiative Thermal Program provides rebates to customers of the four California investor owned utilities (Pacific Gas & Electric, Southern California Gas, Southern California Edison, and San Diego Gas & Electric) for eligible solar thermal systems.

84
conditions. The performance penalty is about 5% compared to a drainback system because of the two wall heat exchanger and reduced heat transfer ability.
9.2.1.4 Indirect Forced Circulation (Drainback) Drainback systems use distilled water or tap water in a closed collector loop as an efficient heat transfer fluid during the day, then drain the collectors back into an unpressurized storage tank for night time protection against freezing. The critical requirement is that the collector supply and return lines must have at least ¼” per foot continuous gradient between the collectors and the storage tank.
This type of system has an advantage over the glycol system in that it also provides automatic overheat protection in the summer by shutting the pump off and draining the collectors when the tank high temperature limit has been reached.
The proposed location of the solar tank at the White Labs location appears conducive to a drainback freeze protection system. For the White Labs roof height, a two-speed pump or adjustable speed control is needed to provide about 5 minutes of high-speed circulation at morning startup to reach the roof and entrain oxygen to clear the collectors of air. After that period, the descending water weight assists flow by “pulling” water through the collectors. Thus the only pump requirement during most of the solar day is a low energy circulation. The same logic holds for the Navy Fleet Readiness Center, although the building height is greater. The glycol and drainback systems are the preferred options for further evaluation at both facilities.
9.2.2 Overheat protection Protection of the heat transfer fluid is just as important as freeze protection. Propylene glycol, while being an excellent antifreeze heat transfer fluid, is vulnerable to excessive temperatures usually during hot days or days when there is no demand for solar heat. If the solar tank controller shuts the solar pump off because the solar tank has reached its high temperature limit, the glycol/water mixture in the collector will rapidly heat up, possibly to over 300˚F to 400˚F. This range is beyond the breakdown point of most commercial glycols. There are a number of overheat protection options including heat dump convectors, steamback, and dumping to other loads. Grid power or a UPS may be required for the overheat protection function. Some overheat protection methods don’t require grid energy to function. This paper doesn’t state which is best. It does say that those that are passive (don’t require grid energy), and automatic are more reliable.
The best way to avoid overheating heat transfer fluid is to use a drainback system. A drainback system has an unpressurized storage tank located to allow the collectors to automatically drain the heat transfer fluid (water) back into the tank at any time the solar pump shuts down, which on a hot or idle day could be when the solar storage tank reaches its high temperature limit. The pipes to and from the collectors must be sloped at a gradient of ¼ inch per foot continuously between the collectors and storage tank. The dry collectors will reach stagnation temperature (probably over 400˚F), but they are designed to withstand temperatures like that.

85
9.3 Brewing Industry Solar Thermal Assessment - White Labs White Labs is a craft brewery149F150 in San Diego. It began as a yeast production business, founded by Dr. Chris White, co-author of the book, Yeast: The Practical Guide to Beer Fermentation, and is a recognized leader in the rapidly growing craft (or micro) brewing industry. Dr. White points to the vital importance of yeast for taste and quality, and is doing advanced research into genetic propagation of various yeasts. Due to the respect given to Dr. White, many look upon White Labs as a leader in this developing industry. His research director, Troels Prahl was recently featured in the New York Times about the promising genetic research White Labs is doing.
White Labs is an example of the rapid expansion of craft breweries in San Diego and elsewhere in California. Many early successful craft-brewing pioneers are now undergoing expansion. In the process, they tend to examine sustainable energy options such as efficiency measures, combined heat and power, biogas power, and solar power and heat. White Labs is planning to expand its beer production this year, and is interested in a solar thermal system as an option.
9.3.1 Brewing Process Brewing typically is done in 7 steps: mashing, lautering, boiling or sterilizing, fermenting, conditioning, filtering and packaging.
• Mashing: Mixing milled grain with hot water to produce enzymes and separate proteins, starches and sugars from spent grain. Mash is steeped (soaked) in hot water much like steeping tea. By controlling the time and temperature, fermentable sugars may be produced. The final step involves heating to 176˚F, the mashing temperature.
• Lautering: Separation of liquid (wort) from spent grain using mechanical filtering and sparging (rinsing) with hot water (168˚F to 172˚F)
• Boiling: Wort (malt extract) is boiled for sterility and to eliminate unwanted flavors. Hops are added for flavor and aroma. Steam is usually used for this.
• Fermenting: The boiled wort is cooled and aerated. Yeast is added and temperature controlled to around 72˚F in a large tank. Yeast consumes the sugars in the wort, producing carbon dioxide and alcohol. Waste heat is recovered and used.
150 A craft brewer is a term describing small brewing companies that have exploded in growth during the past 30 years in the U.S. In 1980 there were fewer than a dozen brewers in the U.S. That number has grown to over 2,500 now. In California the growth has been in the major cities such as San Diego. The count statewide is approximately 200. Two major stimuli have propelled the growth: former President Jimmy Carter passed legislation in 1978 deregulating home brewing, and small brewing companies began brewing for taste and quality rather than quantity and cost. Related to the taste factor is the rapidly growing understanding of the role that yeast plays in taste.

86
• Conditioning: After fermenting, the liquid is cooled to near freezing, which settles yeast, and smooth out the flavor.
• Filtering: Optional step to further stabilize flavor.
• Packaging: Putting the beer into bottles, cans or kegs.
9.3.2 Heating method The company plans to use steam for most of its heat needs. This involves heat exchangers in the wort kettle and steam piping to the mash tank. Set point controllers control temperature needs. A steam piping system will deliver heat where it is needed. A separate water heater is used for the kitchen.
9.3.2.1 Temperature requirements Other than the need for boiling the wort, the major heat requirement is for 176˚F in the mash tank, or 180˚F for dish/bottle washing.
9.3.2.2 Integration of solar thermal into the brewing process Solar thermal is one of several options for heating water used in the brewing process: hot water heater, steam boiler, combined heat and power, waste heat recovery, biogas heat, etc. Each has its own advantages and disadvantages depending on energy costs and site electrical and thermal requirements. A comprehensive design process would entail a detailed analysis of each technology in relation to the loads and energy costs. For example, combined heat and power would be a logical candidate for a business that has relatively inexpensive gas and expensive electricity, as is the case in San Diego. At times, these technologies stand-alone. Or they may be used in combination with solar thermal. An analysis of the process cycle in terms of time and energy needs, coupled with the production of power and heat would be needed to determine which combination of technologies is optimum. Energy efficiency fits into that analysis also as a first priority. There are ways to save heat energy by programming heat-needing operations together, and by using efficient heat exchangers and heat recovery.
All or some of these technologies would have the effect of reducing the thermal load that solar must supply. This reduces the cost of the solar system, and may improve the performance of the solar system by smoothing the energy demands and overlapping storage needs. That is, a single efficient storage tank could store heat from the solar collectors and a waste heat recovery system. Final determination must await completion of the design optimization stage.
Along with the selection of major technologies, a method to inject solar heat into the process must be selected. Since the optimal method would likely be interactive with the other energy technologies selected, selection of best solar injection method should await that analysis. Options for solar heat injection are:

87
Place a solar hot water storage tank in the stream of cold city supply to a gas tank-type backup heater to the mash tank (see sketch). Solar heat the storage tank water with a closed collector loop (separating the solar-heated collector fluid from the potable city water). Build the tank temperature up to 176˚F or higher if a reserve margin is needed. As hot water is demanded for the mash process the backup heater if needed will boost the solar pre-heated water temperature. By controlling the process timing to create a new mash cycle each day, such that the hot water is needed to start the mash process in the late afternoon, would reduce the overnight loss of solar heat, and utilize solar heat at the optimal time. On an annual basis, if the solar system is sized to provide about 70% of the annual water heating energy (in southern California), this option would provide about 100% of the heat load during the summer months, and about half the heat load during winter months. 70% is a common target solar fraction for southern California for conventional domestic solar water heating. However the modeling for this brewery will show that a smaller solar fraction, in the range of 40% would likely provide a better solar performance (see Thermal Performance Modeling section). This solar-heated water can be fed to the kitchen for cleanup and dishwashing needs. 180˚F may be needed for the dish/bottle washing. The same backup heater or a separate one dedicated to the kitchen can likely provide this.
A similar concept to Item 1 is a solar storage tank followed by a boiler or tankless heater. The major difference is that the backup heater has no storage, and must modulate its burner depending on the incoming temperature from the solar tank to reach the desired hot outlet temperature. If hard water is used for the brewing process, the tankless heater will need to be capable of descaling its heat exchanger periodically, as it will likely scale up rapidly. Also, if the tankless heater does overshoot the desired hot water temperature, a mixing valve will be needed to temper it to 176˚F. A cost penalty associated with the tankless heater may be the need to upgrade the size of the gas service pipe to the building, although it may be large enough to supply the extra gas needed. A condensing tankless heater can achieve an efficiency of over 98%.
A third option is to use steam heat for the mash process temperature control and wort boiling (and any other hot water needs such as clean up, dishwashing, or keg and bottle washing.) This has the advantage of having an assured high temperature available via a steam-piping loop for any part of the operation (e.g., tweaking for quality control). There are a couple of disadvantages: if the steam heats water in the solar storage tank, the solar system would have to compete with the steam for heating to the desired set point temperature. A control system would then be needed to prioritize for solar contribution during daytime hours when solar can contribute, and delay steam delivery until the last resort. This would be essentially a parallel system with steam and solar operating together, but with solar being given the first opportunity to provide the needed heat. A variation of this is to have solar pre-heat the steam boiler makeup water, a kind of dual-solar benefit system. Solar would provide as much heat to the process, as it is able, but can also pre-heat the boiler makeup water. Disadvantages to any steam system include the need for frequent maintenance, danger from steam leaks and the cost of having a certified steam boiler technician onsite when the steam boiler is operating. It seems preferable to limit the steam operation to the wort boiling/sterilization function.
An option that allows solar to contribute in competition with a steam or a backup boiler is to have variable speed pumps in the solar collector loop. This option is beneficial in two senses: first, the pump can be slowed down, or even stopped, to allow the sun to heat the collector heat transfer fluid to the desired set point temperature (176 - 186˚F). If steam system controls can’t

88
shut the steam supply down, this provides a means of injecting the solar heated water into the process ahead of steam. Second, the adjustable speed drive pump can be programmed to speed flow up during the hottest part of the day, improving solar heat collection by reducing collector temperature difference (difference between the hot out and the cold in to the collectors). A disadvantage is that slowing the flow down to get a higher temperature at the collector outlet has the negative effect of causing heat to be lost to the atmosphere via radiation or convection losses.
For the purpose of this assessment a rough performance estimate using reasonable assumptions about Option 2 thermal load can provide a good indication of the viability of solar thermal. This option would be the most likely one selected because it has the feature of assured high heat delivery, while solar has a reasonable role in the mash and kitchen areas.
9.3.2.3 Brewery Solar Thermal Performance Modeling This study assesses solar thermal energy for the brewing process to be used by White Labs in their expanded business. The goal is to estimate savings and return on investment two separate ways; with no incentives and with federal tax incentives plus California Solar Initiative Thermal Program rebate.
Per the freeze protection discussion above, solar thermal is best produced in a closed solar loop with the heat transfer fluid separated from the hot water used for beer making. This facilitates freeze protection and ensures high quality water for the brewing process. This may be either a drainback system or a glycol system. Since TRNSYS (Transient System Simulation Program) modeling shows the two systems performing close together, the simulation will assume the more common glycol system, with a two-wall heat exchanger. Because the design temperatures are higher than the normal water heating range of about 150˚F, selective surface collectors will be used. The collector chosen for this study is a Heliodyne Gobi 4’ x 10’ collector, based on the fact that this collector was used on a brewery in Portland. This is not intended as an endorsement.
89
Initial simulations were run using the industry sizing practice of one square foot of collector per gallon per day (GPD). This practice in San Diego and Southern California generally produces an annual solar fraction (percent savings by solar) of about 70% (100% in summer and 50% in winter.) However, because the initial simple paybacks were above 10 years, it was decided to reduce the collector array size to ½ square foot per GPD. This improves collector efficiency by having relatively lower solar storage tank and collector loop temperatures. Larger GPD per square foot of collector causes the storage tank to be cooler because twice as much cool water is passing through the solar system as would be for the 70% solar fraction system. Cooler water/glycol in the collector absorbs more solar radiation. The TRNSYS calculator run at 1 square foot per GPD (2,580 sf) resulted in savings of 2.5 therms/sf/year, versus 3.9 therms/sf/year for the system modeled below (.5 sf/GPD).
Assumptions.
Propylene glycol
2-wall heat exchanger on collector loop
Solar and storage tanks separate
1,280 square feet of Heliodyne Gobi 4’x 10’ (410003) selective surface collectors (based on 2,580 GPD load)
South at 33°F pitch
Gas backup heater. Efficiency = 82%
California Climate Zone 7
Hot Water Demand = 2,580 GPD
Set Point temperature 186°F delivered water
Solar availability 100% (no shade)
Solar system cost at $100/sf = $128,000
Federal Investment Tax Credit at 30% = $38,400
MACRS depreciation not considered.
Asset value increase not considered.
Reduced thermal wear and tear of heater not considered.
Gas price escalation rate not considered.
9.3.2.4 Results Results with tax credit and CSI Thermal incentive:
Annual savings = 4,985 therms/yr. (3.9 therms/sf) Equals $4,985 a year at $1/therm

90
CSI Thermal incentive: $72,432 at $14.53 a therm
Simple payback: 3.4 years
Install Cost $128,000
CSI Thermal Incentive ($72,432)
Federal ITC ($38,400)
Net Cost of System $17,168
Annual Savings $4,985
Simple Payback 3.4 Years
Results with no tax credit or CSI Thermal incentive:
$128,000/$4,985 = 25.7 Year payback
Note from the discussion above that reducing the size of the collector array in half, results in a 56 % increase in therms per square foot per year (3.9 vs 2.5). This shows that an optimization study on collector array size should be an integral part of the design process. Also, since the solar storage tank is an expensive component, solar system tank sizing should be modeled along with various ratios of gallon storage per square foot of collectors. As part of the design process, measurement of GPD passing through the solar system (or through the backup heater if solar is planned as a retrofit) would be very helpful to aid in sizing the array. Another suggestion regarding solar pricing is to get price bids based on savings per dollar system cost (as modeled by TRNSYS or another recognized simulation program that you prefer). The brewery will find a wide range of price bids, and even proposed collector array sizes, but bids should focus on dollar per therm predicted savings, plus contractor expertise and references.
Additionally, combining solar with efficiency measures such as better pipe and tank insulation, recirculation controls, tankless heater, etc., will improve the economics of the whole package.
9.4 Aircraft Refurbishment Facility Solar Thermal Assessment - Navy Fleet Readiness Center
The Navy Fleet Readiness Center on Coronado Island, San Diego, is a major fighter aircraft refurbishment facility that has been operating for decades, repairing and replating fighter aircraft returning from battle or long exposure to corrosive ocean environment. The process saves $10’s of millions of dollars per aircraft over buying new replacement aircraft.
9.4.1 Refurbishment Operation There are many components to the refurbishment operation, but the process of concern for this evaluation is the cleaning and plating operation.

91
This involves a matrix of overhead hoists carrying aircraft parts to two areas, the cleaning tanks and the plating tanks. Thirty-seven of the tanks are kept hot, from 95˚F to about 215˚F. The process is extremely inefficient – all tanks are uninsulated, steel-walled, tanks with no covers. The tanks are approximately 15’x 5’x 6’ each, filled to the top 6 inches with water or other cleaning and plating chemicals.
9.4.2 Heat Loss estimate. Thermal loss calculations (radiant and convection) show the heat loss rate to be about 174,717 therms per year. This was validated by the last year’s billing total of 379,963 therms supplied by an old combined heat and power (CHP) plant in the form of steam. The energy manager estimates over 200,000 therms are consumed through steam system leaks and other refurbishment loads. This corroborates the heat loss estimate of 174,717 therms from the tanks. He also feels the current audit may result in basic energy savings of half the remaining thermal load, resulting in a net thermal load of 87,448 therms/year. About half of this could be targeted for solar savings.
9.4.3 CHP Plant An energy services company, who charges the Navy $5.66 a therm under a take-or-pay contract, owns the power plant. That is an arrangement where the heat generated by the CHP plant is paid for by the customer (the Navy), whether it is used or not. These financial arrangements have been used to recover costs for CHP projects for over 30 years. Since the cost to purchase natural gas directly from SDG&E is less than $1.00 a therm, this situation represents a motive for the Navy to either close down the CHP plant, or renegotiate the contract for a much more favorable rate, with allowance to take cost effective energy savings actions.150F151
9.4.4 Investment Grade Energy Audit The Navy is not simply jumping into a decision to use solar thermal. They have begun a multi-million dollar total plant audit, and will compare energy options identified via the audit (such as new CHP, heat recovery, etc.) with the solar thermal system economics. It is hoped that their
151 Another consideration of the take-or-pay contract is that it basically serves as a disincentive for the Navy to purchase energy efficiency measures or renewables. Why spend the money when you’d have to pay the high cost of steam whether you use it or not? The Navy (and the military in general) is reevaluating these costly contracts, and very much driven by a new paradigm that sees sustainability as a vital element of national security. Saving fossil fuel energy improves the mission success of every military base and overseas operation. Some of the more prominent sustainability policies have been demonstrated in the San Diego/Southern California region. The Fleet Readiness Center is nearing the end of its steam purchase contract and is motivated to consider alternatives such as solar thermal energy. The coincidental timing with the current California Solar Initiative Thermal rebate program is fortunate. This study will address the benefits of solar thermal with and without the $500,000 CSI Thermal maximum rebate. If the model is successful in San Diego, it could be replicated in dozens of other military bases around the U.S.

92
economic evaluation will include credit for solar being a step toward energy independence, which is critically important to the military.
9.4.5 Integration of solar thermal into the cleaning and plating process As with a brewery application, solar thermal is one of several options for heating water used in the cleaning and plating process: steam boiler, combined heat and power, waste heat recovery, biogas heat, etc. Each has its own advantages and disadvantages depending on energy costs and site electrical and thermal requirements. A comprehensive design process would entail a detailed analysis of each technology in relation to the loads and energy costs. This will be part of the audit process that is under way. An analysis of the process cycle in terms of time and energy needs, coupled with the production of power and heat would be needed to determine which combination of technologies is optimum. Energy efficiency fits into that analysis also as a primary option. There are ways to save heat energy by programming heat-needing operations together, and by using efficient heat exchangers and heat recovery. At a minimum, the tanks should be insulated and covered.
Conservation measures reduce thermal load and therefore the size and cost of the solar system, and may improve the performance of the solar system by smoothing the energy demands and overlapping storage needs. That is, a single efficient storage tank could store heat from the solar collectors and a waste heat recovery system. Final determination must await completion of the design optimization stage.
A method to inject solar heat into the process must be selected. Since the optimal method would likely be interactive with the other energy technologies selected, selection of the best solar injection method should await that analysis. Options for solar heat injection are:
Place a solar hot water storage tank in the stream of cold city supply to a gas steam boiler to refurbishment center. Solar heat the storage tank water with a closed collector loop (separating the solar-heated collector fluid from the city water to the tanks). Build the tank temperature up to 190˚F-200˚F (or higher if a reserve margin is needed). As hot water is demanded for the cleaning/plating process the solar pre-heated water temperature will be boosted by the backup boiler as needed. Controlling the process timing to create a new demand cycle each day such that the hot water is needed to start the process in the late afternoon would reduce the overnight loss of solar heat, and utilize solar heat at the optimal time.
On an annual basis, if the solar system is sized to provide about 70% of the annual water heating energy (in Southern California), this option would provide about 100% of the heat load during the summer months, and about half the heat load during winter months. This is a common target solar fraction for Southern California for conventional domestic solar water heating. However, the modeling for this site will show that a smaller solar fraction, in the range of 40% to 50% would likely provide a better solar performance (see Thermal Performance Modeling section). This solar-heated water can be fed to the tanks directly, or have a separate steam loop heating the tanks in parallel solar would be given first priority. If solar is inadequate, the steam boiler supplies the additional heat.

93
A similar concept to Item 1, is a solar storage tank followed by a boiler, passing heated water directly to the tanks. One advantage is higher boiler efficiency and use of the cleaning and plating tanks as storage. The solar system is free to operate in an efficient manner, only heating cold city water as it passes through to the boiler. The collectors can be glazed flat plate. The tanks become the storage, reducing system cost. Standard boiler controls can maintain the desired tank temperatures.
A third option is to use steam heat for the process temperature control (and any other hot water needs such as clean up, terminal reheat, etc.) This has the advantage of having an assured high temperature available via a steam-piping loop for any part of the operation (e.g., tweaking for quality control). There are a couple of disadvantages: if the steam heats water in the tanks, the solar system would have to compete with the steam for heating to the desired set point temperature. A control system would then be needed to prioritize for solar contribution during daytime hours when solar can contribute, and delay steam delivery until the last resort. This would be essentially a parallel system with steam and solar operating together, but with solar being given the first opportunity to provide the needed heat. A variation of this is to have solar pre-heat the steam boiler makeup water, a kind of dual-solar benefit system. Solar would provide as much heat to the process as it’s able, but can also pre-heat the boiler makeup water. Waste heat from a combined heat and power plant can also provide the steam.
An option that allows solar to contribute in competition with a steam or backup boiler or waste heat recovery is to have variable speed pumping in the solar collector loop. This option is beneficial in two senses: first, the pump can be slowed down, or even stopped, to allow the sun to heat the collector heat transfer fluid to the desired set point temperature (200˚F). If steam system controls can’t shut the steam supply down, this provides a means of injecting the solar heated water into the process ahead of steam. Second, the variable speed drive pump can be programmed to increase flow during the hottest part of the day, improving solar heat collection by reducing collector temperature difference (difference between the hot out and the cold in to the collectors). A disadvantage is that slowing the flow down to get a higher temperature at the collector outlet has the negative effect of causing excess heat to be lost to the atmosphere via radiation or convection losses. Also, to get the higher (200˚F) temperature, more efficient (and expensive) collectors would needed For the purpose of this assessment a rough performance estimate using reasonable assumptions about the parallel thermal supply option can provide a good indication of the viability of solar thermal. This option would be the most likely one selected because it has the feature of assured high heat delivery, while solar has a reasonable role in the cleaning and plating areas. See the section on thermal performance modeling.

94
9.4.6 Aircraft Refurbishment Facility Solar Thermal Performance Modeling After numerous iterations of different collector types and configurations, the one simulation that makes the most sense economically is to model for just enough therm savings to max out the CSI Thermal rebate at $500,000. The following inputs to the TRNSYS calculator were used.
Assumptions
Drainback system
Boiler backup
Collector: Heliodyne Gobi 4’x10’
276 collectors
Storage 12,000 gallons
California Climate Zone 7
Set point temperature = 190˚F
Tilt 33˚
Azimuth 180˚
9.4.7 Results The following results take into account the CSI-Thermal Program rebate. As a government agency, the Navy cannot use the 30% federal tax credit.

95
Installed Cost ($1,108,100)
CSI Thermal Incentive $500,000
Net Cost of System ($608,100)
Annual Savings $35,337
Simple Payback
(vs Steam at $5.66/therm) 3.4 Years
Simple Payback
(w/ Steam at $1/therm) 17.2 Years
The system looks attractive with the CSI Thermal incentive if the cost of steam remains at $5.66/therm.
9.5 Solar cost trends Cost trends for solar thermal systems will likely decline as more installers, designers and producers enter the field. As contractors gain experience and refine their bidding and installation procedures, and as business owners learn more about the competing price opportunities, prices should come down. The entire process, from project analysis to design to bidding to permitting to installation is currently “a learning curve”. California can do much to smooth this learning curve and reduce costs by:
• Developing or adopting universally applicable system standards
• Developing a streamlined permitting process
• Providing advanced training for engineers and contractors
• Providing Technical Advisory service to help customers and engineers/contractors screen technical alternatives
All these actions will help reduce costs by improving system designers and contractor’s knowledge and understanding, thereby reducing the need for pricing “fudge-factors” in to bids based on a lack of confidence. Contractors in other fields often bid higher than they otherwise would when they bid on new products that they may not understand adequately.
Also, innovations in collector design such as massive manufacturing of evacuated tube collectors in China, is bringing the panel costs down which will lower system costs. Other innovations are the development of polymer panels, replacing expensive copper glazed and framed panels, and drainback systems with fewer components. Some companies are demonstrating hybrid technologies, such as PV modules cooled by air or liquid for dual energy benefits.

96
Others are investigating interactive benefits between solar thermal and non-solar technologies, such as using low-cost unglazed solar panels to provide daytime pre heat and nighttime precooling for efficient heat pumps (boosting their Coefficients of Performance for heating and cooling). For some industries, it may be feasible to use unglazed collectors to preheat well or city water as it enters the plant. Unglazed collectors operate very efficiently in conditions where the air temperature is within 20 or 30 degrees of the water temperature.
In general, efforts should be made to integrate solar water heating with other loads that may be seasonal, such as space heating or cooling in winter months or pool heating in summer. Doing seasonal integration gets more year-round production from the solar collectors. In some cases, it may help to program certain thermal processes to operate more smoothly from a thermal energy standpoint (e.g., scheduling two batch processes to closely follow one another in time.)
Permitting costs are an expensive component, mostly because the current code and permitting process is archaic. Just as it is being done to streamline the permitting process in the PV industry, it should be done to standardize and speed up the process in the solar thermal industry. We have seen the cost-reducing benefits of the growth and innovation of the photovoltaics industry, and many of these innovations (such as in roof-mounting techniques) could benefit the solar thermal industry. It may take ten or so years, with strong government leadership, to bring these improvements about.
In the meantime, subsidies are needed to soften the transition. In addition, it would be productive to have targeted industrial solar thermal demonstration projects. These should showcase industrial customers who are very receptive to educating the technical and consumer public, complete with system monitoring displays and training seminars. Industries that have a good “force multiplier” effect should be chosen. That is, they represent a large industrial potential market such as brewing, wine making, food processing, etc.
The military market is very large and important. Aircraft and equipment refurbishment operations are performed inefficiently on many military bases. Now is the time to partner with the military, as they seek to make their energy-related operations more secure and sustainable.
Finally, leadership is critical. State government leaders should take a strong advocacy role, and make it happen through all the levels of resistant bureaucracy.
97
10 CHAPTER 10: CONCLUSIONS AND FUTURE WORK Industrial solar thermal systems can deliver clean energy to produce hot water and generate low pressure steam, heat fluids, and deliver heat to be used by absorption refrigeration systems. Significantly important industrial unit operations require these energy-driven end products; for sanitation purposes at creameries and wineries and to power refrigeration systems at breweries. Solar thermal energy displaces on-site burning of natural gas fuel, reducing greenhouse gas (GHG) emissions.
The low price of natural gas fuel is the biggest barrier for solar thermal systems to compete in the industrial hot water market. Historically, the public investment and regulatory support for solar thermal systems has been negligent when compared to the resources invested in solar PV electric systems. Since most of the incentives have only recently being introduced, it will take time for industrial market participants to express their willingness to invest in solar thermal.
Researchers assume that the recently enacted Federal and State incentives do not compensate for the low cost of natural gas. Further research is needed to determine the price at which natural gas would have to rise for solar thermal systems to be more competitive. Or estimate how low would the cost of solar thermal systems have to be to compete with low natural gas prices? Researchers believe that despite the incentive payments and the potential to sell GHG Allocations in the Cap and Trade market, the industrial solar thermal market will be slow to ramp-up, particularly for dedicated hot water solar thermal systems.
With the CSI PV history as an indicator151F
152, researchers will assume that the new CSI Thermal Industrial incentives will accelerate the adoption of industrial solar heating and cooling technologies. The momentum created by additional sales will encourage competing companies to further invest in innovations, needed to lower costs and increase system efficiencies to remain competitive.
Solar cooling is being demonstrated at the SoCalGas building but researchers have yet to identify the installation of an industrial solar thermal driven chiller. Solar heating and cooling technologies have the potential to displace fossil fuel thermal energy as well as electric energy in the agricultural and industrial sectors of the economy. Researchers recommend investing RD&D public funds to achieve cost-effective solar cooling technologies.
The commercialization of solar cooling technologies also promises to open the solar thermal market by competing with expensive electric energy. Public investments are needed to advance the science and technology of solar thermal hybrid systems, capable of delivering process heat and refrigeration loads, or solar electric and hot water. Hybrids will be in a better position to overcome the cost-effectiveness limitation faced by stand-alone solar thermal hot water systems.
Although public RD&D funds are always welcomed, the private sector is investing to develop competitive technologies. Cogenra, Aztec Solar and Sopogy are, each within their own
152 The CSI PV succeeded activating the solar PV market where it no longer offers incentives.

98
corporate strategy, investing to develop competitive advantages. New competitors will emerge as profits migrate to projects with access to CSI Thermal incentives. Cogenra may have a new competitor in Sundrum Solar, as they market their hybrid PV electric/thermal systems to industrial facilities.152F
153
Both Calpak and Cogenra are targeting dairy farms and dairy processing creameries, breweries and wineries. Cogenra is penetrating the solar thermal energy market mostly because it delivers solar PV electricity at a competitive price. Their ability to install projects in these market segments offers a platform to demonstrate the technical and economic potential of the hybrid technology.
Another important development is the integration of solar thermal energy with absorption chillers to deliver cooling loads. The partnerships with Johnson Controls and SoCalGas provide Cogenra an early-adopter advantage to commercialize solar PV/Thermal/Cooling systems. Sopogy is also active with the deployment of solar cooling systems.
Companies that can integrate solar cooling to their solar thermal systems will have an additional competitive advantage. Solar cooling systems will reduce electricity demand (kWh) and shave Electric Peak loads (kW). Aztec, Cogenra, Chromasun and Sopogy are investing RD&D funds to deliver cost effective solar heat and cooling systems.
It is encouraging to know that established and emerging private sector companies are investing in new technologies to create competitive advantages. The industry is aware of the need to develop emerging technologies that can utilize solar thermal resources more cost-effectively. Particularly, to produce refrigeration loads to displace higher cost electricity. The development and deployment of cost-effective solar cooling technologies will open a significantly more profitable market for industrial solar thermal systems.
End use market participants will be the ultimate judges of solar thermal renewable energy technologies. Managers at wineries, creameries and brewery companies will need a compelling reason to want to replace existing fuels and delivery systems to produce hot water resources. But a combination of generous CSI incentives based on thermal fuel savings, the potential to earn greenhouse gas credit allocations, and the accomplishment of sustainability goals may drive early adopters to invest in industrial solar thermal systems.
In this report, a general framework to show the solar heating technology options and penetration scenarios for California was presented. Below is a summary and recommended future work. Table 10.1provides a summary for possible energy saving for all scenarios discussed in previous sections. The energy savings are listed by end use category and type of solar thermal systems.
153 Researcher’s conversation with SunDrum Solar staff.
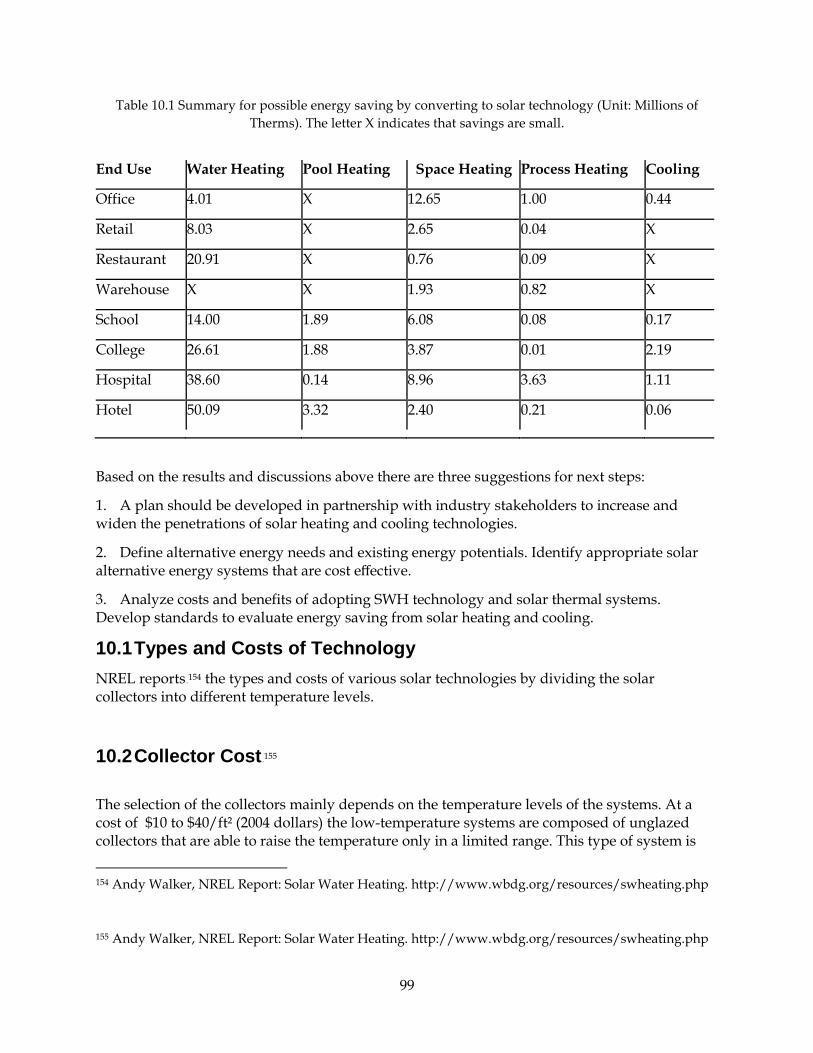
99
Table 10.1 Summary for possible energy saving by converting to solar technology (Unit: Millions of Therms). The letter X indicates that savings are small.
End Use Water Heating Pool Heating Space Heating Process Heating Cooling
Office 4.01 X 12.65 1.00 0.44
Retail 8.03 X 2.65 0.04 X
Restaurant 20.91 X 0.76 0.09 X
Warehouse X X 1.93 0.82 X
School 14.00 1.89 6.08 0.08 0.17
College 26.61 1.88 3.87 0.01 2.19
Hospital 38.60 0.14 8.96 3.63 1.11
Hotel 50.09 3.32 2.40 0.21 0.06
Based on the results and discussions above there are three suggestions for next steps:
1. A plan should be developed in partnership with industry stakeholders to increase and widen the penetrations of solar heating and cooling technologies.
2. Define alternative energy needs and existing energy potentials. Identify appropriate solar alternative energy systems that are cost effective.
3. Analyze costs and benefits of adopting SWH technology and solar thermal systems. Develop standards to evaluate energy saving from solar heating and cooling.
10.1 Types and Costs of Technology NREL reports153F
154 the types and costs of various solar technologies by dividing the solar collectors into different temperature levels.
10.2 Collector Cost154F
155 The selection of the collectors mainly depends on the temperature levels of the systems. At a cost of $10 to $40/ft² (2004 dollars) the low-temperature systems are composed of unglazed collectors that are able to raise the temperature only in a limited range. This type of system is
154 Andy Walker, NREL Report: Solar Water Heating. http://www.wbdg.org/resources/swheating.php
155 Andy Walker, NREL Report: Solar Water Heating. http://www.wbdg.org/resources/swheating.php

100
most often used for heating swimming pools, especially in California where the climate is milder, but can also be applied to preheat cold-water enroute to a high performance collector or boiler. Next, mid-temperature collectors are usually flat plates insulated by a low-iron cover glass and insulation, as discussed in previous chapter. Again, the warmer climate in California reduces convection and radiation losses such that flat plate collectors can be adopted in most solar water heating cases. As of 2004, flat plate collector systems cost from $90 to $120/ft². In addition, there are high-temperature commercial applications. High-temperature systems usually use evacuated tubes around the receiver tube to provide strong insulation and often use focusing curved mirrors to concentrate sunlight at costs of about $75/ft² to $120. NREL notes that costs could be lowered to $40 to 70/ft² (2004) through efficient distribution and economies of scale. Finally, a common solar technology application are solar ventilation preheat system155F
156. This type of system is composed of transpired solar collectors, ventilation fan, ducts and ductwork. It has the lowest cost and highest efficiency compared to other solar technologies. While the solar ventilation preheat system is primarily used for preheating ventilation air, it has also been used to dry crops in California. As of 2012, the cost of the transpired solar collector is only around $14.5/ft².
10.3 Installed Costs155 156 Installed costs for different types of collectors vary depending on geographic location, system scale, and system type. For example, installed costs could range from $60 per square foot for an expensive system in the location with a highly developed solar market to $225 per square foot for an inexpensive system in the location with a startup solar market and no, or limited storage. In general, installed costs per square foot for collectors range from as low as $10 for pool systems to as high as $225 for large systems. Specifically, while the installed costs of unglazed collectors and evacuated tubes are highly variable, most glazed water heating systems fall within the range of installed costs of $60 to $150 per square foot of collector area. For the transpired solar collector, the installed cost is about $30 per square foot of collector area.
Finally, we provide a summary in Table 10.2 for all solar technology in term of application, basic working principle, possible market penetration and cost.
Table 10.2 Summary for solar technology, working principle, market penetration and cost. The possible market penetration for water heating, pool heating, space heating, and process heating is calculated by dividing technical potential energy saving by current total energy usage as shown in Figs.14, 17, 18 and 19. A major commercial system cost item is the storage tank. ASME pressure vessel compliant pressurized tanks become expensive above 120 gallons.
Solar Technologies
Unglazed collector Glazed flat plate or evacuated tube
Transpired solar collector
Concentrated solar collectors
Application Pool Heating Water Heating Space Heating Process Heating
Possible Market Penetration
20% 39% 20% 24%
2 156 DOE report: Solar Ventilation Air Preheating. http://www.wbdg.org/resources/svap.php
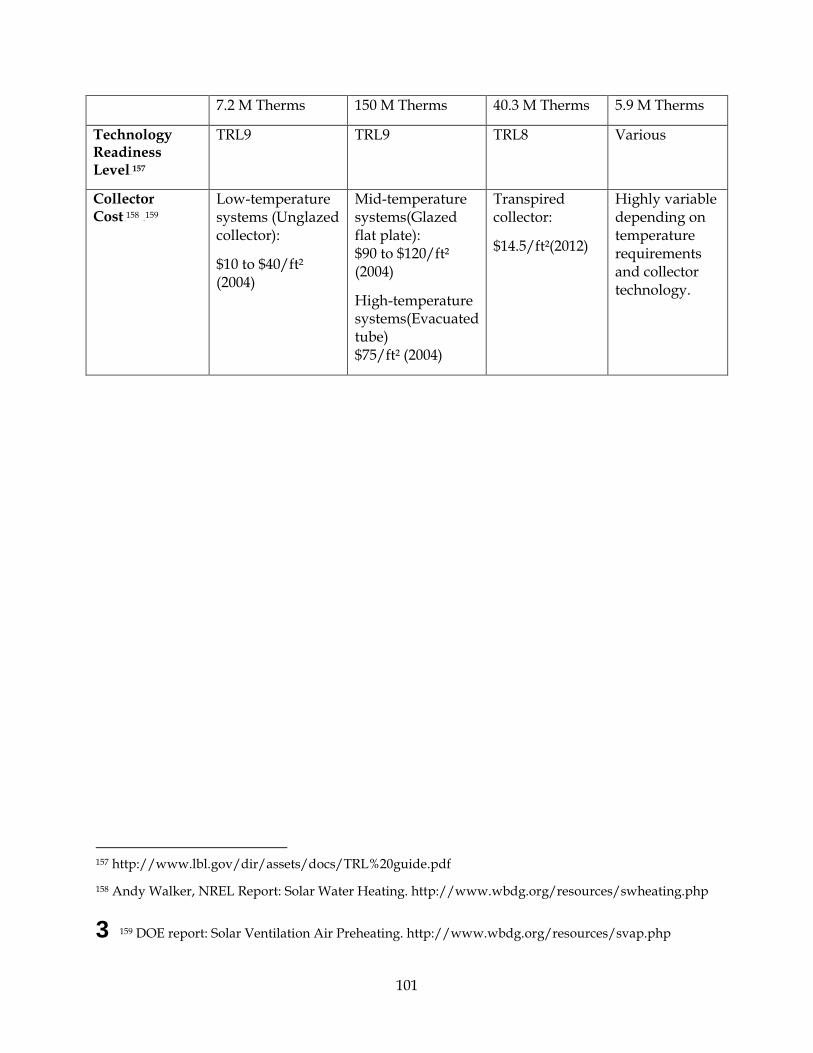
101
7.2 M Therms 150 M Therms 40.3 M Therms 5.9 M Therms
Technology Readiness Level156F
157
TRL9 TRL9 TRL8 Various
Collector Cost157F
158 158F
159 Low-temperature systems (Unglazed collector):
$10 to $40/ft² (2004)
Mid-temperature systems(Glazed flat plate): $90 to $120/ft² (2004)
High-temperature systems(Evacuated tube) $75/ft² (2004)
Transpired collector:
$14.5/ft²(2012)
Highly variable depending on temperature requirements and collector technology.
157 http://www.lbl.gov/dir/assets/docs/TRL%20guide.pdf
158 Andy Walker, NREL Report: Solar Water Heating. http://www.wbdg.org/resources/swheating.php
3 159 DOE report: Solar Ventilation Air Preheating. http://www.wbdg.org/resources/svap.php

102
11 Appendix A Table A.1: Water heating gas consumption scenario of major options (Unit: Millions of Therms), Refer to Pg.78 Appendix G in KEMA-XENERGY159F
160
Utilities Service PG&E SCG SDG&E Total
Restaurant 28.07 68.17 17.03 113.27
School 28.91 13.73 3.46 46.1
College 44.26 32.44 8.41 85.11
Hospital 70.02 42.29 13.96 126.27
Hotel 39.92 86.49 36.37 162.78
Table A.2: Technical potential SWH scenario of utilities service (Unit: Millions of Therms), Refer to Pg.42, Appendix D in KEMA-XENERGY160F
161
Utilities Service PG&E SCG SDG&E Total
Restaurant 5.18 12.59 3.14 20.91 School 8.72 4.22 1.06 14.00
College 14.04 9.98 2.59 26.61 Hospital 21.29 13.01 4.29 38.60
Hotel 12.28 26.61 11.19 50.09
160 Fred Coito, Mike Rufo, May 2003, California Statewide Commercial Sector Natural Gas Energy Efficiency Potential Study Volume 2, California Measurement Advisory Council, http://www.calmac.org/allpubs.asp
161 Fred Coito, Mike Rufo, May 2003, California Statewide Commercial Sector Natural Gas Energy Efficiency Potential Study Volume 2, California Measurement Advisory Council, http://www.calmac.org/allpubs.asp

103
Table A.3: Pool heating gas consumption and potential solar pool heating scenario of major options (Unit: Millions of Therms), refer to pg.42, Appendix D and pg.78 Appendix G in KEMA-XENERGY161F
162
Pool Heating Solar Pool Heating
School 9.58 1.89
College 9.21 1.88
Hospital 0.61 0.14
Hotel 15.89 3.32
Fig. A.4: Potential SWH scenario by regions in California, Generated based on the data from
Table A.2
162 Fred Coito, Mike Rufo, May 2003, California Statewide Commercial Sector Natural Gas Energy Efficiency Potential Study Volume 2, California Measurement Advisory Council, http://www.calmac.org/allpubs.asp

104
12 Appendix B) Sample design for a creamery This document evaluates the potential of solar technologies in creameries by rough estimates of the electricity and hot water. The data gathered in our site visit from a balancing plant located in Hughson, CA.
12.1 Introduction This creamary plant is a balancing plant, and the extra milk, which is produced by dairies but cannot be consumed by industries, will be sent to this creamary. T converts the milk to different products such as cream, butter, concentrated milk, and dry powder milk.
The separation of cream or butter from milk, results in skim milk. The skim milk can be concentrated to non-fat milk by reverse osmosis or can be evaporated in dryers for production of non-fat dry milk.
12.2 Gas Consumption Gas is consumed in two processes. Boilers burn the gas to produce steam. The steam will be used for pasteurization. In addition to pasteurization, mixing steam with cold water produces hot water with controllable temperature. The hot water is used for cleaning-in-plane (CIP) purposes. The second process which consumes gas is the gas burner which produces hot air for spray drying or milk concentration applications.
The 2013 gas consumption is shown in the following figure. The gas usage for most of the year is above 4000 MMBtu. The peak season is from January to June and the gas consumption reaches 10,000 MMBtu at April. The reason for the seasonal change of the gas consumption is because of the change of the difference between milk production and milk consumption throughout the year.

105
Even during the day the gas consumption has sever fluctuation, which is due to the amount of arrived milk, the required processes, and the required products.
The company works 24/7 and therefore the gas consumption is also 24/7. However, the gas consumption is not continuous and depending on the operating processes and steam demand the gas consumption changes.
There is no storage tank for hot water and whenever hot water is required for cleaning, steam and cold water are mixed with proper ratio to generate the hot water the required temperature.
The steam has a pressure of around 125 psi and temperature of 180 degree C. The burner produces hot air of around 440 degree F for drying processes. The hot water is around 175oF.
There is partial heat recovery from the hot air of the drying process however it is not fully efficient yet.
12.3 Electricity consumption Electrical usage throughout 2013 is shown in the following figure and in general it is above 500,000 KWhr. The electricity demand changes throughout the year and in April it reaches the peak of 1,000,000 KWhr.
Roughly around 15% of the electricity is used in the cooling processes. There are two cooling processes. The first process is ammonia system in which 3 pumps circulate glycol at the temperature of 34oF. The second process is based on circulation of Freon by two pumps.
No electricity and gas subsidy is devoted and they are purchased from PG&E on industrial rate.
12.4 Design consideration Three scenarios will be evaluated for better understanding of the potential of solar technologies in food industry. These scenarios are as follows:

106
1) Photovoltaic (PV) panels for production of the electricity
2) Evacuated Tube Solar Thermal panels for production of hot water
3) Photovoltaic-Thermal (PV/T) panels for production of both electricity and hot water
The following general assumptions were considered for the simulations:
1) Since the overload of the solar panels on the roof is not preferred, all the panels will be installed on the fixed-tilt racks on the ground in the available site close to the factory.
2) The output temperature of the hot water should be 80±5 OC.
3) The produced electricity will be injected to the grid.
4) In all scenarios only 10 panels are considered. The optimized determination of the number of the panels requires further consideration of economic parameters, available space for installation, available capital costl.
12.5 PV Panels The schematic of the system is shown below. PolySun Software was used to perform most of the simulations.
The simulated values show that 10 PV panels could generate 1.5 MWh of AC electricity. The following energy flow diagram is based on the average annual electricity requirement of the factory. It is obvious that by increasing the number of the panels the PV yield increases.

107
12.6 Evacuated Tube Solar Thermal Panel Evacuated tubes absorb the solar energy and transfer the heat to a heat transfer liquid. A typical evacuated tube is shown below.
For the sake of simulation, the volume of the hot water was estimated based on the natural gas consumption of the company and it was assumed that the 30% of the natural gas consumption is related to hot water preparation. The schematic a solar thermal system is shown below. The energy is stored in the hot water tank. The gas burner works as the auxiliary heat production to make sure the continuous operation of the hot water unit.

108
The simulation results and the energy flow are shown below. It should be considered that for the sake of comparison only ten panels were considered.
It is interesting to notice that only ten panels will save around 2000 m3 of natural gas annually.
12.7 PV/T panels The PV/T panels are constructed from a top PV panels, which is cooled by a heat transfer liquid. The schematic of the system is shown below.

109
The hot water from the panels is stored in the hot water tank and the produced electricity is injected to the grid.
The thermal and electrical outputs of the system are summarized in the following table. By comparing the electricity generation of scenario 1 and 3, it is interesting to notice that per unit gross area they both produce similar energy. In comparison of the thermal energy, the PV/T technology looks more promising.
The final decision on the number of the panels, type of the technology requires further input about the economic situation and the desired output of the system for the factory.

110

111
13 References Astolfi, Marco, et al., 2011. Technical and economical analysis of a solar–geothermal hybrid
plant based on an Organic Rankine Cycle. Geothermics 40(1):58-68.
Darwish, Mohamed, Ashraf Hassan, and Rabi Mohtar, 2013. Toward Implementing HH the Amir Declaration of 2% Electricity Generation by Solar Energy in 2020. Energy and Power Engineering 05(03):245-258.
Hudon, K., et al., 2012. Low-Cost Solar Water Heating Research and Development Roadmap. National Renewable Energy Laboratory.
Kibaara, S, S Chowdhury, and SP Chowdhury, 2012. A thermal analysis of parabolic trough CSP and biomass hybrid power system. Transmission and Distribution Conference and Exposition (T&D), 2012 IEEE PES, 2012, pp. 1-6. IEEE.
Kondili, E., and J. K. Kaldellis, 2006. Optimal design of geothermal–solar greenhouses for the minimisation of fossil fuel consumption. Applied Thermal Engineering 26(8-9):905-915.
Lentz, Álvaro, and Rafael Almanza, 2006a. Parabolic troughs to increase the geothermal wells flow enthalpy. Solar Energy 80(10):1290-1295. —, 2006b. Solar–geothermal hybrid system. Applied Thermal Engineering 26(14-15):1537-1544.
Lumby, Alasdair Miller; Ben, 2012. Utility Scale Power Plants: A Guide for Developers and Investors. International Finance Corporation- World Bank Group
Mekhilef, S., R. Saidur, and A. Safari, 2011. A review on solar energy use in industries. Renewable and Sustainable Energy Reviews 15(4):1777-1790.
Ozgener, Onder, 2010. Use of solar assisted geothermal heat pump and small wind turbine systems for heating agricultural and residential buildings. Energy 35(1):262-268.
Pokhrel, Hardik, et al., FEASIBILITY ANALYSIS OF HYBRID SOLAR CONCENTRATOR AND BIOGAS POWERED PROTOTYPE STEAM ENGINE.
Prabhakant, Y. N., R. K. Mishra, and G. N. Tiwari, 2012. Thermal modelling of hybrid photovoltaic thermal (HPVT) integrated-biogas plants. Applied Solar Energy 47(4):304-311.